Vienna 2016 THINKING AHEAD. - CA Immo · ANNUAL REPORT 2016 ViE Vienna ANNUAL REPORT 2016 NEO...
219
ANNUAL REPORT 2016
Transcript of Vienna 2016 THINKING AHEAD. - CA Immo · ANNUAL REPORT 2016 ViE Vienna ANNUAL REPORT 2016 NEO...

AN
NU
AL
RE
PO
RT
201
6
ViEVienna
www.caimmo.com
ANNUALREPORT2016
NEOMunich Baumkirchen Quarter
THINKING AHEAD.

KEY FIGURES
INCOME STATEMENT
2016 2015
Rental income € m 165.6 154.8
EBITDA € m 147.6 148.6
Operating result (EBIT) € m 293.8 402.7
Net result before taxes (EBT) € m 237.6 316.0
Consolidated net income € m 183.9 220.8
Operating cash flow € m 125.4 113.2
Capital expenditure € m 291.6 92.5
FFO I (excl. Trading and pre taxes) € m 91.7 80.8
FFO II (incl. Trading and after taxes) € m 113.7 121.2
BALANCE SHEET
2016 2015
Total assets € m 4,309.1 3,984.0
Shareholders' equity € m 2,204.5 2,120.5
Long and short term interest-bearing liabilities € m 1,565.6 1,404.0
Net debt € m 1,167.7 1,191.4
Net asset value (EPRA NAV) € m 2,497.5 2,354.4
Triple Net asset value (EPRA NNNAV) € m 2,294.4 2,196.3
Gearing % 53.0 56.2
Equity ratio % 51.2 53.2
RoE 2) in % % 8.5 10.8
Gross LTV % 45.9 43.8
Net LTV % 34.2 37.2
PROPERTY PORTFOLIO
2016 2015
Total usable space (excl. parking, excl. projects) 4) sqm 1,609,242 1,655,187
Gross yield investment properties 5) % 6.1 6.3
Fair value of properties € m 3,819.9 3,655.8
1) Key figures include all fully consolidated properties, i.e. all properties wholly owned by CA Immo 2) Return on Equity (profit-generating efficiency) = consolidated net income after minority interests / average equity (without minority
interests) 3) Includes fully consolidated real estate (wholly owned by CA Immo) and real estate in which CA Immo holds a proportionate share (at
equity) 4) incl. land leases and rentable open landscapes 5) Incl. the project developments Kontorhaus, Monnet 4 and Kennedy-Haus 6) before deffered taxes
KEY FIGURES
KEY FIGURES
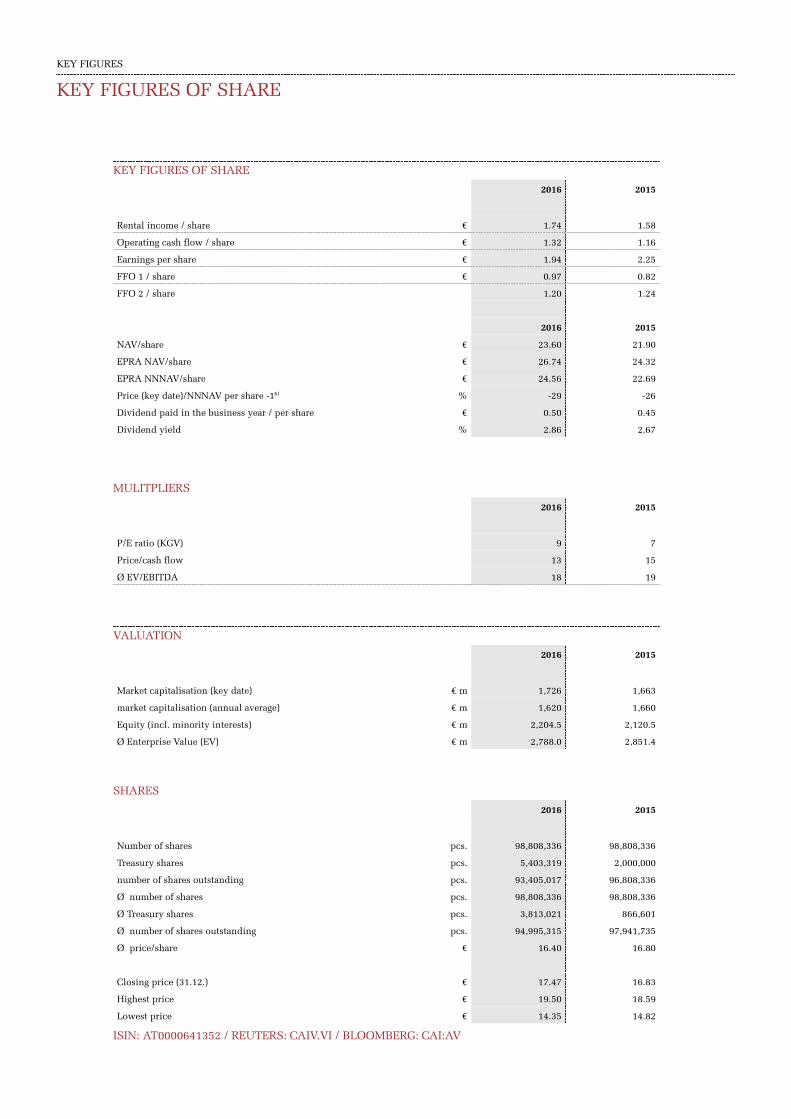
KEY FIGURES OF SHARE
2016 2015
Rental income / share € 1.74 1.58
Operating cash flow / share € 1.32 1.16
Earnings per share € 1.94 2.25
FFO 1 / share € 0.97 0.82
FFO 2 / share 1.20 1.24
2016 2015
NAV/share € 23.60 21.90
EPRA NAV/share € 26.74 24.32
EPRA NNNAV/share € 24.56 22.69
Price (key date)/NNNAV per share -16) % -29 -26
Dividend paid in the business year / per share € 0.50 0.45
Dividend yield % 2.86 2.67
MULITPLIERS
2016 2015
P/E ratio (KGV) 9 7
Price/cash flow 13 15
Ø EV/EBITDA 18 19
VALUATION
2016 2015
Market capitalisation (key date) € m 1,726 1,663
market capitalisation (annual average) € m 1,620 1,660
Equity (incl. minority interests) € m 2,204.5 2,120.5
Ø Enterprise Value (EV) € m 2,788.0 2,851.4
SHARES
2016 2015
Number of shares pcs. 98,808,336 98,808,336
Treasury shares pcs. 5,403,319 2,000,000
number of shares outstanding pcs. 93,405,017 96,808,336
Ø number of shares pcs. 98,808,336 98,808,336
Ø Treasury shares pcs. 3,813,021 866,601
Ø number of shares outstanding pcs. 94,995,315 97,941,735
Ø price/share € 16.40 16.80
Closing price (31.12.) € 17.47 16.83
Highest price € 19.50 18.59
Lowest price € 14.35 14.82
ISIN: AT0000641352 / REUTERS: CAIV.VI / BLOOMBERG: CAI:AV
KEY FIGURES OF SHARE

AN
NU
AL
RE
PO
RT
201
6
ViEVienna
www.caimmo.com
ANNUALREPORT2016
NEOMunich Baumkirchen Quarter
THINKING AHEAD.

€184m
8.5 % 51 %
65 cents
€92m €114m
CONSOLIDATED NET INCOME
RETURN ON EQUITY EQUITY RATIO
DIVIDEND PER SHARE (+30 %)
FFO I FFO II
By monitoring the markets closely and correctly identify-ing scope for future develop-ment, CA Immo laid the foun-dations for its current success many years ago. By entering the German real estate market at the right time, building up internal project development expertise and investing early in central land reserves, the company created a basis for
long-term growth and estab-lished a successful pattern.
Looking to the future re-mains a key success factor as CA Immo continues to build the office buildings for the next generation. By taking account of developments over the coming decades, the com-pany can continue to secure excellent returns.
LOOKING TO THE FUTURE MEANS DOING BUSINESS MORE EFFECTIVELY – AND SUSTAINABLY.
Consolidated net income close to last year’s record value reflects strong operational development within a favourable market environment.
Solid rise in shareholder value in one of the most successful business years in the company’s history.
Extremely robust balance sheet structure as a key stability factor for the CA Immo Group.
Substantial dividend increase based on steadily rising earning power over the long term.
Long-term revenue significantly above the previous year’s value and the annual target (€89 m).
Profitable sales of non-strategic real estate to generate additional revenue.
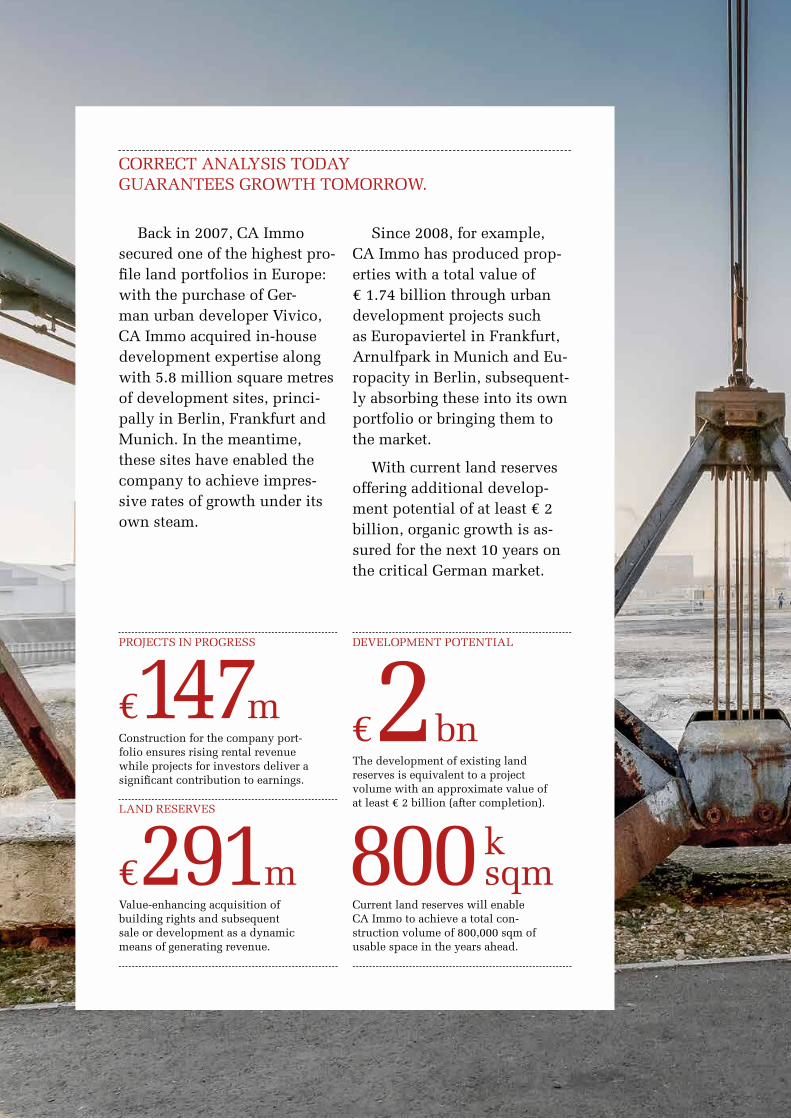
CORRECT ANALYSIS TODAY GUARANTEES GROWTH TOMORROW.
Back in 2007, CA Immo secured one of the highest pro-file land portfolios in Europe: with the purchase of Ger-man urban developer Vivico, CA Immo acquired in-house development expertise along with 5.8 million square metres of development sites, princi-pally in Berlin, Frankfurt and Munich. In the meantime, these sites have enabled the company to achieve impres-sive rates of growth under its own steam.
Since 2008, for example, CA Immo has produced prop-erties with a total value of € 1.74 billion through urban development projects such as Europaviertel in Frankfurt, Arnulfpark in Munich and Eu-ropacity in Berlin, subsequent-ly absorbing these into its own portfolio or bringing them to the market.
With current land reserves offering additional develop-ment potential of at least € 2 billion, organic growth is as-sured for the next 10 years on the critical German market.
Construction for the company port-folio ensures rising rental revenue while projects for investors deliver a significant contribution to earnings.
Value-enhancing acquisition of building rights and subsequent sale or development as a dynamic means of generating revenue.
€147m
€291m
PROJECTS IN PROGRESS
LAND RESERVES
The development of existing land reserves is equivalent to a project volume with an approximate value of at least € 2 billion (after completion).
Current land reserves will enable CA Immo to achieve a total con-struction volume of 800,000 sqm of usable space in the years ahead.
€2 bn
800 k sqm
DEVELOPMENT POTENTIAL

LOOKING AHEAD.
ZOLLHAFEN MAINZMainz

PLANNING AHEAD.
ONEFrankfurt, Europaviertel

Given that office properties remain competitive for at least 20–30 years, building today means anticipating developments for decades ahead. We must therefore ask ourselves, what is the outlook for in creasingly flexible and digital working spaces? How will workstations and working environments need to be designed to give people the best possible support in their working processes? What role will be played by new technologies?
The answer lies in inno-vative buildings that are flexible enough to keep pace with ongoing modernisation. In developing these buildings, CA Immo relies on far-sighted planning based on relevant research as a partner to the OFFICE 21 joint research project of the Fraunhofer IAO Institute.
BUILDING TODAY FOR THE GENERATION OF TOMORROW.
Inner city style, outside and inside: new CA Immo projects bring an urban feel to interiors through lively lobbies, cafés and lounges.
Smart office concepts call for smart office buildings. Networking of relevant technical systems and a building app promise comfort and efficiency.
As a partner to the OFFICE 21 joint research project of the Fraunhofer IAO Institute, we are party to new findings that we quickly incorporate into in-house developments.
Flexible rental agreements, co-working spaces and temporarily rentable conference facilities make our properties ideal zones of productive business activity.
200 %
100 % 1A
360°URBAN ZONES
SMART BUILDINGS RESEARCH PARTNERS
FLEXIBILITY
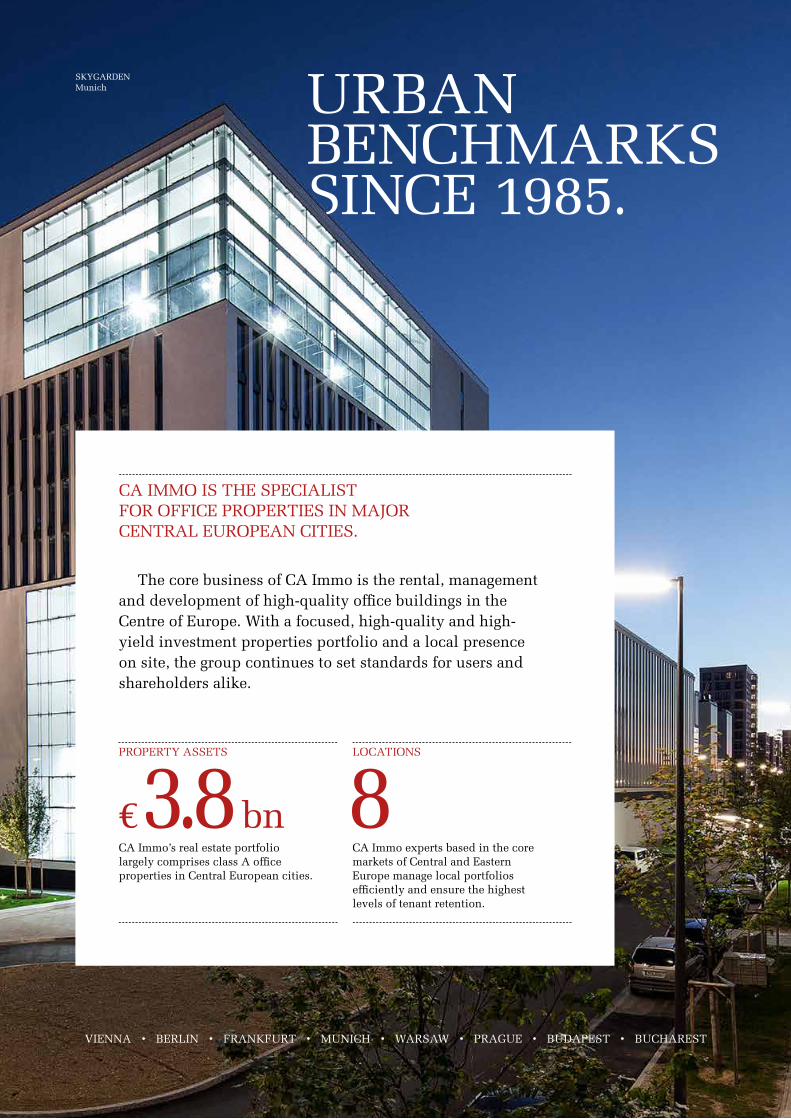
CA IMMO IS THE SPECIALIST FOR OFFICE PROPERTIES IN MAJOR CENTRAL EUROPEAN CITIES.
The core business of CA Immo is the rental, management and development of high-quality office buildings in the Centre of Europe. With a focused, high-quality and high-yield investment properties portfolio and a local presence on site, the group continues to set standards for users and shareholders alike.
CA Immo’s real estate portfolio largely comprises class A office properties in Central European cities.
CA Immo experts based in the core markets of Central and Eastern Europe manage local portfolios efficiently and ensure the highest levels of tenant retention.
€3.8bn 8PROPERTY ASSETS LOCATIONS
VIENNA • BERLIN • FRANKFURT • MUNICH • WARSAW • PRAGUE • BUDAPEST • BUCHAREST
URBAN BENCHMARKS SINCE 1985.
SKYGARDENMunich

CONTENT
2 FOREWORD BY THE MANAGEMENT BOARD
4 STRATEGY AND GOALS
6 INVESTOR RELATIONS
6 Share
8 Shareholder Structure
13 CORPORATE GOVERNANCE
13 Report of the Supervisory Board
15 Management Board
16 Supervisory Board
18 Sustainability and Corporate Responsibility
22 Corporate Governance Report
29 Remuneration Report
Inside Front Cover
KEY FIGURES
KEY FIGURES OF SHARES
34 MANAGEMENT REPORT
34 Group Structure
36 Economic Environment
38 Property Markets
42 Property Assets
44 Investment Properties
48 Investment Properties Under Development
53 Property Valuation
56 Financing
60 Results
68 Outlook
69 Financial Performance Indicators
70 Employees
72 Supplementary Report
72 Research and Development
72 EPRA Reporting
73 Risk Management Report
81 CONSOLIDATED FINANCIAL STATEMENTS
84 Consolidated Income Statement
85 Consolidated Statement of Comprehensive Income
86 Consolidated Statement of Financial Position
87 Consolidated Cash Flow Statement
88 Consolidated Statement of Changes in Equity
90 Notes to the Consolidated Financial Statements
174 Annex I to the Consolidated Financial Statements
181 Declaration of the Managing Board
182 Auditor’s Report
188 FINANCIAL STATEMENTS OF CA IMMOBILIEN
ANLAGEN AKTIENGESELLSCHAFT
192 TABLES AND ANALYSES
198 General Overview of Properties
208 SUSTAINABILITY INDEX
209 DISCLAIMER/CONTACT/IMPRINT
A glossary with explanations of the most important
technical terms is available at www.caimmo.com/glossary
These sections include sustainability issues.
CONTENT
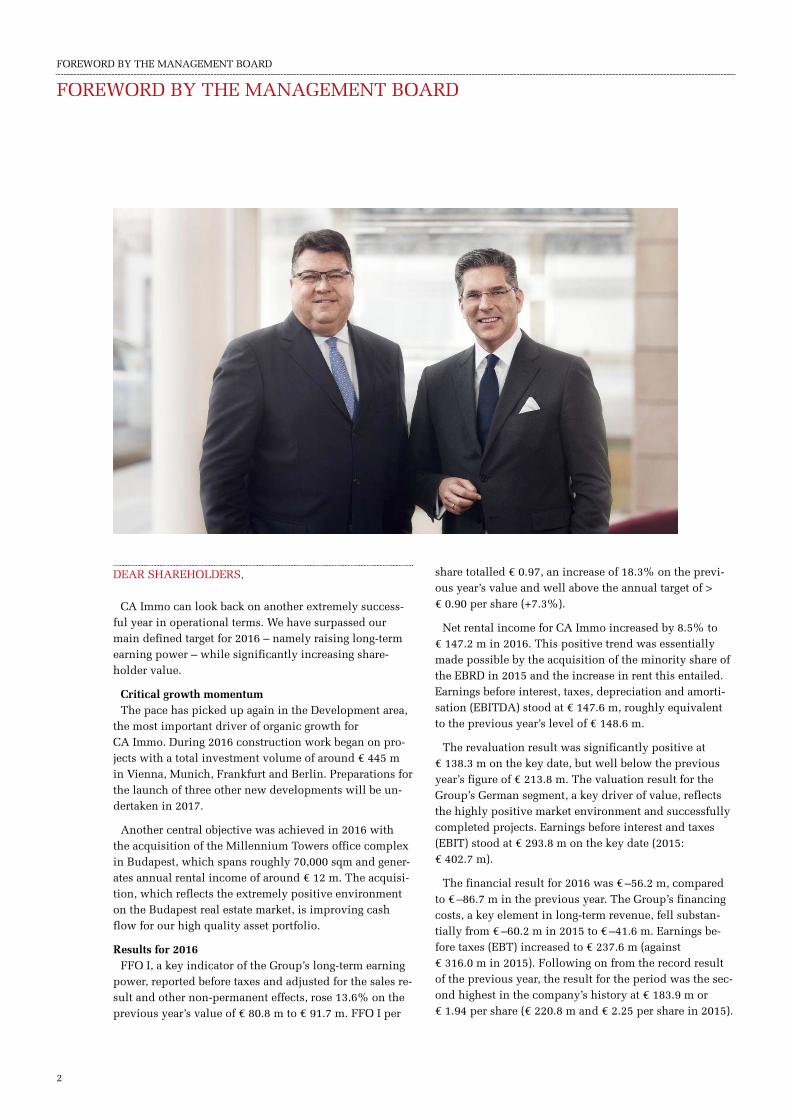
FOREWORD BY THE MANAGEMENT BOARD
2
DEAR SHAREHOLDERS,
CA Immo can look back on another extremely success-ful year in operational terms. We have surpassed our main defined target for 2016 – namely raising long-term earning power – while significantly increasing share-holder value.
Critical growth momentum The pace has picked up again in the Development area,
the most important driver of organic growth for CA Immo. During 2016 construction work began on pro-jects with a total investment volume of around € 445 m in Vienna, Munich, Frankfurt and Berlin. Preparations for the launch of three other new developments will be un-dertaken in 2017.
Another central objective was achieved in 2016 with the acquisition of the Millennium Towers office complex in Budapest, which spans roughly 70,000 sqm and gener-ates annual rental income of around € 12 m. The acquisi-tion, which reflects the extremely positive environment on the Budapest real estate market, is improving cash flow for our high quality asset portfolio.
Results for 2016 FFO I, a key indicator of the Group’s long-term earning
power, reported before taxes and adjusted for the sales re-sult and other non-permanent effects, rose 13.6% on the previous year’s value of € 80.8 m to € 91.7 m. FFO I per
share totalled € 0.97, an increase of 18.3% on the previ-ous year’s value and well above the annual target of > € 0.90 per share (+7.3%).
Net rental income for CA Immo increased by 8.5% to € 147.2 m in 2016. This positive trend was essentially made possible by the acquisition of the minority share of the EBRD in 2015 and the increase in rent this entailed. Earnings before interest, taxes, depreciation and amorti-sation (EBITDA) stood at € 147.6 m, roughly equivalent to the previous year’s level of € 148.6 m.
The revaluation result was significantly positive at € 138.3 m on the key date, but well below the previous year’s figure of € 213.8 m. The valuation result for the Group’s German segment, a key driver of value, reflects the highly positive market environment and successfully completed projects. Earnings before interest and taxes (EBIT) stood at € 293.8 m on the key date (2015: € 402.7 m).
The financial result for 2016 was € –56.2 m, compared to € –86.7 m in the previous year. The Group’s financing costs, a key element in long-term revenue, fell substan-tially from € –60.2 m in 2015 to € –41.6 m. Earnings be-fore taxes (EBT) increased to € 237.6 m (against € 316.0 m in 2015). Following on from the record result of the previous year, the result for the period was the sec-ond highest in the company’s history at € 183.9 m or € 1.94 per share (€ 220.8 m and € 2.25 per share in 2015).
FOREWORD BY THE MANAGEMENT BOARD

FOREWORD BY THE MANAGEMENT BOARD
3
Substantial increase in shareholder value On the basis of the strong operating result, the Manage-ment Board intends to propose a rise in the dividend from 50 cents per share in 2015 to 65 cents per share – a significant increase of 30% per share – to the Ordinary General Meeting for 2017. In addition, approximately 3.4 million own shares were repurchased in 2016 through the share buyback programme, raising the num-ber of own shares to around 5.5% of the capital stock.
Core shareholder sells 26% stake in CA Immo On the basis of the share purchase agreement of 17 April 2016, O1 Group Limited sold its 25,690,163 bearer shares indirectly held via Terim Limited (Cyprus) (approxi-mately 26% of the entire capital stock of CA Immo) and the four registered shares of CA Immo directly held by O1 to IMMOFINANZ AG. The purchase price was € 23.50 per share, with the total transaction volume ap-proximately € 604 m. Closing for the transaction took place in August 2016.
Potential merger of CA Immo and IMMOFINANZ CA Immo and IMMOFINANZ have entered into construc-tive dialogue concerning a potential amalgamation of the two companies. In line with the Austrian Stock Corpora-tion Act, such a merger must be approved by the Ordi-nary General Meetings of both organisations with a 75% majority; the Ordinary General Meetings are scheduled for 2017. In December 2016, however, IMMOFINANZ AG announced an adjustment to the timetable: the timing of the separation of the Russian properties (a precondition to the success of merger talks) should be such that any decision regarding a potential merger will be taken in 2018. The dialogue was subsequently suspended. A fair and transparent process allied with corporate governance that conforms to international conventions are key ele-ments in establishing a sound basis on which our share-holders can make decisions on the transaction.
Changes in the Supervisory Board Torsten Hollstein and Dr. Florian Koschat were elected
to the Supervisory Board at the Ordinary General Meet-ing in May 2016. The works council of CA Immobilien Anlagen AG exercised its right to appoint four represent-atives. As the new core shareholder, IMMOFINANZ AG utilised its right of appointment through the four regis-tered shares to appoint Professor Klaus Hirschler and Professor Sven Bienert to the Supervisory Board along with Dr. Oliver Schumy and Stefan Schönauer. Dr. Wolf-gang Renner, Marina Rudneva and Timothy Fenwick, the members previously appointed by O1 Group Limited, the former core shareholder, have stepped down. The Super-visory Board members Dr. Wolfgang Ruttenstorfer, Bar-bara Knoflach, Dr. Maria Doralt and Dmitry Mints re-signed their mandates in 2016.
Changes to the Management Board Florian Nowotny stepped down as a Management Board
member and CFO of CA Immo on 30 September 2016. He was succeeded with immediate effect by Dr. Hans Volckens, who took the reins of the finance division from 1 October 2016. As an expert in the fields of law, taxation and accounting, Dr. Volckens has a wealth of experience in the real estate sector. Between October 2011 and April 2014, he was the Chief Financial Officer of IVG Immo-bilien AG, guiding the company through a period of fi-nancial restructuring. Prior to this, Dr. Volckens served on the management boards of companies including Han-nover Leasing GmbH & Co KG.
Outlook for 2017 Recurring earnings (FFO I) is expected to increase fur-
ther to at least € 100 m in 2017. Our shareholders are therefore likely to benefit from a rising dividend amount-ing to roughly 70% of FFO I.
Vienna, March 2017
The Management Board
Frank Nickel (Chief Executive Office)
Dr. Hans Volckens (Member of the Management Board)

STRATEGY
4
Company profile and business model Developing and managing modern and spacious office
properties in Central and Eastern Europe is CA Immo’s core field of expertise. The company’s core region com-prises Austria, Germany, Poland, Hungary, Czechia and Romania. While business activity in Germany is concen-trated on the cities of Munich, Frankfurt and Berlin, the strategic focus in the other countries is directed at capital cities (Vienna, Warsaw, Prague, Budapest and Bucharest). As at the key date, the proportion of office properties was approximately 88% of the overall property portfolio.
From the design and development of entire urban dis-tricts to the active management of investment properties, value is generated for CA Immo shareholders through a comprehensive value chain. The CA Immo business model aims to ensure stable revenue from lettings to a first-class pool of tenants with high credit ratings while generating additional revenue from the development and sale of real estate.
Strategic agenda for 2015-2017 In addition to the finalising of sales of non-strategic
properties (1) and further optimisation of the financing structure (2), the strategic agenda for 2015-2017 is clearly focused on value-enhancing growth (3) and (4) within de-fined core markets. Continuing to strengthen long-term cash flow for CA Immo while generating an attractive re-turn on equity will be the priority (see section on ‘Finan-cial performance indicators’).
The main value drivers are:
1. Continual portfolio optimisation The strengthening of our position on key existing mar-
kets through local asset management teams takes strategic priority over entering new markets. To be able to operate these local platforms with efficiency, a minimum portfo-lio size and operational streamlining are required. Re-maining non-strategic properties, including some of the land reserves in Germany, smaller properties and proper-ties not used as offices will be sold. Further monetisation of land reserves in Germany should therefore reduce that part of NAV which does not contribute ongoing income to the overall result.
Significant success was achieved in this area in 2016, with numerous small-scale properties sold in both Aus-tria and Eastern Europe. The sale of the Šestka shopping centre in Prague, one of the final large-scale non-strategic properties, largely concluded the programme of non-core sales. CA Immo has thereby strengthened its focus on
high quality office buildings in Central and Eastern Eu-rope while enhancing operational efficiency.
2. Further optimisation of the financing structure Average financing costs are a key component in the
long-term earning power of CA Immo. It is thus highly relevant to establish the most effective possible structur-ing and optimisation of financing with outside capital; alongside successful management of the real estate portfo-lio, this is one of the key factors in the overall result for the Group.
Average financing costs fell sharply during 2016, from 2.9% on key date 31 December 2015 to 2.3%. Aside from a further reduction in average borrowing costs, improving the maturity profile and raising the quota of hedged fi-nancial liabilities will be key objectives. The pool of un-encumbered assets – a key factor in the company’s invest-ment grade rating – will also be raised and the rating of CA Immo will be consolidated.
3. Real estate development as driver of growth In-house development and the incorporation of modern,
energy efficient core properties on the main markets of CA Immo will continue to be the main drivers of organic growth. In Germany in particular, land reserves in the portfolio and the company’s development expertise con-stitute a strategic competitive advantage in a very compet-itive market for high quality buildings in urban locations.
Many successfully completed projects in Germany – in-cluding large-scale, complex undertakings for such repu-table tenants as PricewaterhouseCoopers, Bosch, Mer-cedes-Benz and Google – have highlighted the develop-ment expertise of the company and improved access to leading tenants as the basis for new development pro-jects. As in recent years, the company’s development ac-tivity will focus on the German market. The CA Immo Group’s strong positioning as an established, nationally successful real estate developer in Germany is critical to the future growth strategy of the company as this enables sustained access to high quality office properties and thus the organic expansion of rental cash flow. Returns at-tained on production costs are well above the current market level.
4. Property acquisitions also driving growth Aside from property development, the portfolio for the
Group’s core markets will be bolstered by selective acqui-sitions, which will also provide additional rental reve-nue. Value-enhancing growth opportunities to strengthen market position are most evident on the core markets of
STRATEGY

STRATEGY
5
CA Immo in Eastern Europe. Combined with a robust bal-ance sheet profile and the local market exper- tise of internal asset management teams on all core mar-kets, the corporate platform optimised over recent years constitutes a sound basis for raising value through growth.
With the acquisition of the Millennium Towers office complex in Budapest, which spans roughly 70,000 sqm and generates annual rental income of around € 12 m, this objective was successfully met in 2016 as cash flow from the asset portfolio was increased.
Attractive dividends CA Immo has positioned itself as a dividend payer with
the long-term objective of offering shareholders attractive payouts on a regular basis. The long-term, stable profita-bility of lettings business is a critical indicator of the company’s capacity to pay a dividend, which should be gradually raised by means of the measures outlined
above. This continual enhancement of long-term earning power as a core strategic objective is likely to be reflected in dividend growth, with an approximate payout ratio of 70% of FFO I (up from 60% in 2016).
Investment grade as a strategic component In December 2015 Moody’s Investors Service, the inter-
national rating agency, classified CA Immobilien Anlagen AG with a Baa2 investment grade (long-term issuer) rating with a stable outlook following a comprehensive analysis of creditworthiness (change of outlook to ‘negative’ in spring 2016). The key indicators in retaining and uphold-ing the corporate credit investment grade rating, which is of high strategic significance to CA Immo, are a strong balance sheet with low gearing, recurring earning power, an associated solid interest coverage ratio and a suffi-ciently large quota of unsecured properties (see ‘Financ-ing’ section).
CA IMMO BUSINESS MODEL

INVESTOR RELATIONS
6
GOOD YEAR FOR THE STOCK MARKET DESPITE UNCERTAINTY
Neither the unexpected British rejection of the Euro-pean Union, the victory of Donald Trump in the U.S. election nor the governmental crisis in Italy could have a long-lasting influence on international financial markets in the last business year. Nonetheless, the markets were affected by economic worries (especially in China) and the drastic fall in the oil price, with rates collapsing prac-tically world-wide – at least in the short term. The British Brexit referendum in June, the result of the U.S. presi-dential election in November and the crisis afflicting the Italian financial sector (more than the Italian referendum) also prompted temporary losses. Despite this, all the ma-jor stock exchanges closed 2016 in the black: the Dow Jones was up by approximately 14%, the FTSE 100 up around 11%, the Nikkei in Japan around 1%, the German DAX by roughly 5% and the ATX by 9%. Economic opti-mism made a cautious comeback over the course of the year which was not clouded by the aforementioned events. The global economic environment has bright-ened, as shown by the rise in commodity prices. As for the general interest level, rate rises in the USA had the ef-fect of strengthening the US dollar. By contrast, the Euro-pean Central Bank (ECB) continued to pursue a highly expansive monetary policy in 2016. Base rates were low-ered to 0% in early March and the bond purchase pro-gramme was extended to December 2017. Since interest paid is one of the biggest expenditures for real estate companies, this has also benefited the real estate sector; as the level of interest paid has fallen over the years, profitability has steadily risen. However, the possibility that the ECB will depart from its low interest rate policy cannot be discounted.
Outlook for the capital market in 20171) According to the assessments of economists in the fi-
nancial sector, developments on the financial and capital markets will be defined by political challenges in the USA and Europe in 2017. Adverse effects in Europe dur-ing 2017 may include the forthcoming elections in France, the Netherlands and Germany; the uncertain pro-gress of Brexit negotiations could also make companies less willing to invest. All of these events, couple with po-tential difficulties surrounding the implementation of the
1) Sources: Deutsche Bank: Capital Markets Outlook 2017, Helaba: Volkswirtschaft und Research November 2016.
US reforms signalled for 2017, could bring about signifi-cant fluctuations on stock markets. Fraught labour mar-kets (especially in the peripheral states of Europe) could suppress moderately rising inflation rates as well as the development of real-terms incomes. It seems that the only positive growth-driving impulses will originate from outside Europe. Economic growth of around 1.1% – roughly 0.5 percentage points down on 2016 – is forecast for the eurozone in 2017. The outlook for the German economy is 1.0%, half the figure anticipated for 2017. Economic developments in the USA will depend largely on the new administration; expansion of around 2.3% is forecast for the US in 2017. The slow pace of growth is set to continue in China. In terms of gross domestic prod-uct, however, global economic growth should reach 3.0% to 3.5% this year, slightly exceeding the figure for 2016. The attractive interest environment for real estate invest-ment around the world is likely to be maintained in 2017, with demand for real estate remaining high. None-theless, property markets are heavily dependent on any future changes of interest rate policy by the ECB.
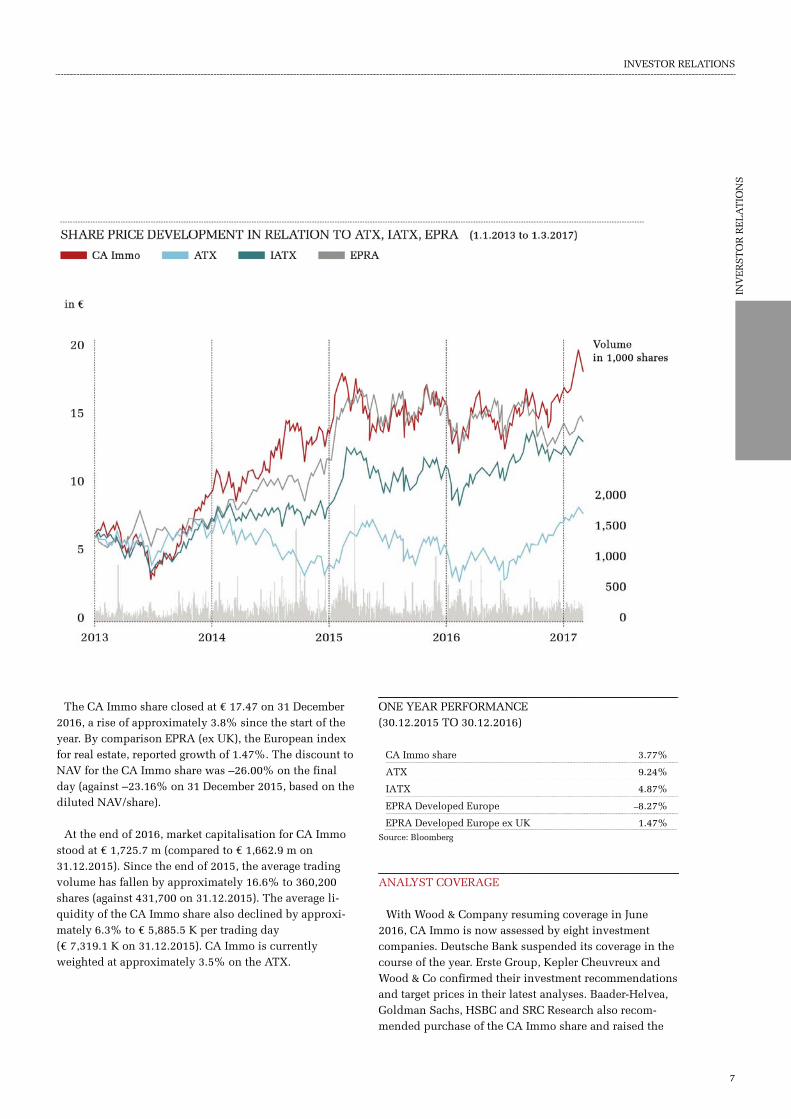
Rate development, stock exchange sales and market capitalisation for the CA Immo share The CA Immo share price opened the first quarter of
2016 at € 16.98. In the first six weeks of the year it lost more than 15% of its value to stand at a low for the year of € 14.35 on 11 February. By the end of quarter one, the share finally managed to convert these losses into a mar-ginal gain, rising to an annual high of € 19.50 by mid-April. In the second quarter, the continuing modest level of economic growth in Europe combined with myriad po-litical uncertainties to suppress rates in Europe; by the end of June, the CA Immo share had fallen 10.8% since the start of the year. The share closed the first half of 2016 at € 15.01. In the third and fourth quarters, develop-ment of the CA Immo share price was largely positive, compensating for the downward trend of earlier months.
INVESTOR RELATIONS
INVESTOR RELATIONS
INV
ER
ST
OR
RE
LA
TIO
NS
7
The CA Immo share closed at € 17.47 on 31 December 2016, a rise of approximately 3.8% since the start of the year. By comparison EPRA (ex UK), the European index for real estate, reported growth of 1.47%. The discount to NAV for the CA Immo share was –26.00% on the final day (against –23.16% on 31 December 2015, based on the diluted NAV/share).
At the end of 2016, market capitalisation for CA Immo stood at € 1,725.7 m (compared to € 1,662.9 m on 31.12.2015). Since the end of 2015, the average trading volume has fallen by approximately 16.6% to 360,200 shares (against 431,700 on 31.12.2015). The average li-quidity of the CA Immo share also declined by approxi-mately 6.3% to € 5,885.5 K per trading day (€ 7,319.1 K on 31.12.2015). CA Immo is currently weighted at approximately 3.5% on the ATX.
ONE YEAR PERFORMANCE (30.12.2015 TO 30.12.2016)
CA Immo share 3.77%
ATX 9.24%
IATX 4.87%
EPRA Developed Europe –8.27%
EPRA Developed Europe ex UK 1.47%
Source: Bloomberg
ANALYST COVERAGE
With Wood & Company resuming coverage in June 2016, CA Immo is now assessed by eight investment companies. Deutsche Bank suspended its coverage in the course of the year. Erste Group, Kepler Cheuvreux and Wood & Co confirmed their investment recommendations and target prices in their latest analyses. Baader-Helvea, Goldman Sachs, HSBC and SRC Research also recom-mended purchase of the CA Immo share and raised the

INVESTOR RELATIONS
8
Retail Investors
Immofinanz AG 26%
26%
Institut. Investors 43%
Treasury Shares 5%
target price. RCB downgraded its recommendation from buy to hold, and reduced its target price from € 20.50 to € 19.40. The most recent 12-month target rates were thus in the range of € 17.70 to € 22.00, with the valuation me-dian at € 20.10. The closing rate for 31 December 2016 implies price potential of 15.1%.
ANALYST RECOMMENDATIONS
Baader-Helvea Bank 9.2.2017 € 21.00 Buy
Erste Group 2.2.2017 € 19.50 Buy
Goldman Sachs 25.1.2017 € 19.20 Neutral
HSBC 12.10.2016 € 19.60 Neutral
Kepler Cheuvreux 22.12.2016 € 21.50 Buy
Raiffeisen Centrobank 14.12.2016 € 19.40 Hold
SRC Research 24.11.2016 € 22.00 Buy
Wood & Company 5.12.2016 € 17.70 Neutral
Average € 20.14
Median € 20.10
CAPITAL STOCK AND SHAREHOLDER STRUCTURE
The company’s capital stock amounted to € 718,336,602.72 on the balance sheet date. This was di-vided into four registered shares and 98,808,332 bearer shares each with a proportionate amount of the capital stock of € 7.27. The bearer shares trade on the prime mar-ket segment of the Vienna Stock Exchange (ISIN: AT0000641352).
SHAREHOLDER STRUCTURE
IMMOFINANZ AG as new main shareholder On the basis of the share purchase agreement of
17 April 2016, O1 Group Limited (‘O1’) sold its 25,690,163 bearer shares indirectly held via Terim Lim-ited (‘Terim’) (approximately 26% of the entire capital stock of CA Immo) and the four registered shares of CA Immo directly held by O1 to IMMOFINANZ AG. The purchase price was € 23.50 per share, with the total transaction volume approximately € 604 m. Closing for the transaction took place on 2 August 2016.
With a shareholding of 26% and four registered shares, IMMOFINANZ is the largest shareholder in CA Immo. As at the balance sheet date, the remaining shares of CA Immo (approximately 74% of the capital stock) are in free float with both institutional and private investors. The company held 5,403,319 treasury shares (for details of the share buyback programme for 2016 please see next page). The company is not aware of any other sharehold-ers with a stake of more than 4% or 5%. For more infor-mation on the organisation of shares and the rights of shareholders, please refer to the corporate governance re-port.
Potential merger of CA Immo and Immofinanz CA Immo and IMMOFINANZ have agreed to enter into
constructive dialogue concerning a potential amalgama-tion of the two companies. J. P. Morgan and Ithuba Capi-tal were appointed advisors to the CA Immo Group in this process.
In line with the Austrian Stock Corporation Act, such a merger must be approved by the Ordinary General Meet-ings of both organisations with a 75% majority. A fair and transparent process allied with corporate governance that conforms to international conventions are key ele-ments in establishing a sound basis on which sharehold-ers can make decisions on the transaction. IM-MOFINANZ had advocated selling or spinning off the Russia portfolio as a precondition to potentially success-ful merger negotiations; in mid-December 2016, the com-pany announced that talks on the possible merger (in-cluding separation of the Russia portfolio) would be sus-pended and the timetable would be adjusted. CA Immo is well prepared for negotiations and will thoroughly exam-ine the pros and cons of a possible merger in the interests of its shareholders. According to the IMMOFINANZ an-nouncement, the timing of the separation of the Russian properties should be such that the Ordinary General Meetings of the two companies that will rule on a poten-tial merger could take place in 2018.

INVESTOR RELATIONS
INV
ER
ST
OR
RE
LA
TIO
NS
9
SHARE BUYBACKS IN 2016
A total of three share buyback programmes were under-taken in the past business year, with the repurchases ap-proved in January and March respectively performed on the basis of the enabling resolution passed by the 27th Ordinary General Meeting of 8 May 2014 and the buy-back programme that started at the end of November per-formed on the basis of the enabling resolution passed by the 29th Ordinary General Meeting of 3 May 2016. De-tails of transactions completed as part of the buyback programme are published at http://www.caimmo.com/en/investor-relations/share-buy-back-ca-immo/.
Share buyback programme I Between 13 January and 19 February, 2016 CA Immo
acquired a total of 1,000,000 bearer shares in the com-pany for a total purchase price of € 15,392,916.72. The weighted equivalent value was approximately € 15.39 per share. The highest/lowest equivalent values per share in the buyback programme were € 16.38 and approximately € 14.39 respectively.
Share buyback programme II Between 25 March and 30 September 2016, another
2,000,000 bearer shares in the company were acquired for a total purchase price of € 32,347,069.75; the weighted equivalent value per share was approximately € 16.17 and the highest/lowest equivalent values per share in the buyback programme were € 17.50 and approximately € 14.66 respectively.
Share buyback programme III The third share buyback programme was launched at
the end of November 2016. The volume is again up to 1,000,000 shares (around 1% of the company’s current capital stock), with an upper limit of € 17.50 per share. The equivalent value to be attained must be within the range stipulated in the enabling resolution passed by the Ordinary General Meeting and may be no more than 30% below and 10% above the average non-weighted stock ex-change closing price on the ten trading days preceding the repurchase. As in previous instances, the repurchase will be undertaken to support the purposes permitted by resolution of the Ordinary General Meeting and will end on 2 November 2018 at the latest. By the balance sheet date, 403,319 shares had been acquired through the pro-gramme at a weighted equivalent value per share of ap-proximately € 17.26.
As at 31 December 2016, CA Immobilien Anlagen AG held 5,403,319 treasury shares in total; given the total number of voting shares issued (98,808,336), this is equivalent to around 5.5% of the voting stock. On the ba-sis of other transactions in business year 2017, CA Immo-bilien Anlagen AG held a total of 5,438,046 treasury shares (around 5.5% of the voting stock) at the time of publication of this report in March 2017.
DIVIDEND POLICY
CA Immo will continue with its profit-oriented divi-dend policy in future. The level of the dividend is deter-mined by profitability, growth prospects and the capital requirements of the CA Immo Group. At the same time, a steady dividend payout ratio of around 60% of FFO I should ensure the continuity of the dividend trend. The actual proposed dividend will generally be announced in tandem with the publication of annual results. For busi-ness year 2015 it stood at € 0.50, an increase of around 11% on the dividend for business year 2014. Based on the closing rate for 2015 (€ 16.83), the dividend yield was approximately 3%. The payment took the form of a capi-tal repayment under Austrian taxation law and was thus tax-free for natural persons living in Austria holding shares as personal assets. The dividend was paid on 10 May 2016 and the ex-dividend date was 6 May 2016. Eli-gible stock in connection with the payment (record date) was determined on 9 May 2016.
Proposed dividend for 2016 For business year 2016, the Management Board will
propose a dividend of € 0.65 per share. Compared to last year, this represents another rise of approximately 30%. In relation to the closing rate as at 31 December 2016 (€ 17.47), the dividend yield is back to approximately 4%. The dividend will be paid on 17 May 2017 (the ex-dividend day and verification date are 15 May/16 May 2017 respectively).
INVESTOR RELATIONS
10
RESOLUTIONS OF THE ORDINARY GENERAL MEETING
The 29th Ordinary General Meeting of CA Immo was held on 3 May 2016. It was attended by some 560 share-holders and their delegates (representing approximately 49% of the entire capital stock). Alongside the usual agenda items (distribution of profit, approval of the ac-tions of Management and Supervisory Board members, the definition of Supervisory Board remuneration and confirmation of KPMG Austria GmbH Wirtschaftsprüfungs- und Steuerberatungsgesellschaft as the (Group) auditor for business year 2016), the agenda also covered the changes to the Supervisory Board, re-drafting of the authorisation of the Management Board to acquire treasury shares in accordance with article 65 sub-section 1 line 8 of the Stock Corporation Act (non-spe-cific acquisition), the associated usage approval and amendments to the statutes. All information and docu-ments relating to Ordinary General Meetings may be viewed at http://www.caimmo.com/de/investor-rela-tions/hauptversammlung/. The Supervisory Board report contains information on changes within the Supervisory Board.
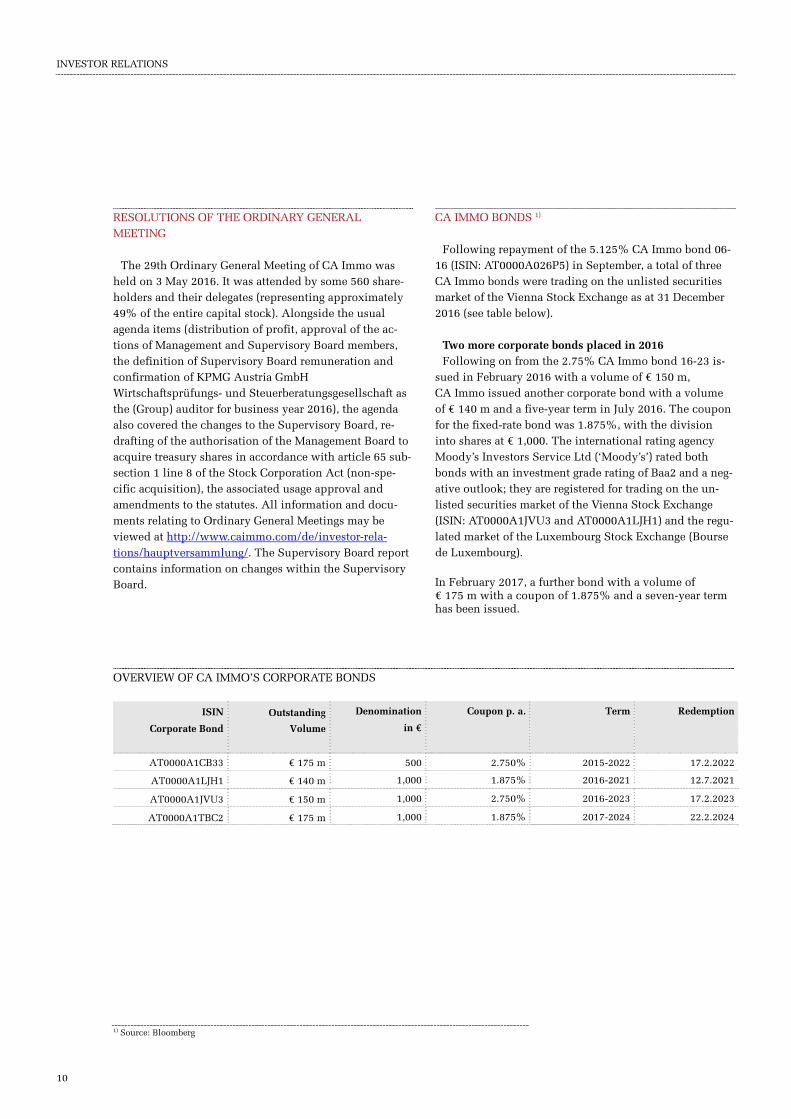
CA IMMO BONDS 1)
Following repayment of the 5.125% CA Immo bond 06-16 (ISIN: AT0000A026P5) in September, a total of three CA Immo bonds were trading on the unlisted securities market of the Vienna Stock Exchange as at 31 December 2016 (see table below).
Two more corporate bonds placed in 2016 Following on from the 2.75% CA Immo bond 16-23 is-
sued in February 2016 with a volume of € 150 m, CA Immo issued another corporate bond with a volume of € 140 m and a five-year term in July 2016. The coupon for the fixed-rate bond was 1.875%, with the division into shares at € 1,000. The international rating agency Moody’s Investors Service Ltd (‘Moody’s’) rated both bonds with an investment grade rating of Baa2 and a neg-ative outlook; they are registered for trading on the un-listed securities market of the Vienna Stock Exchange (ISIN: AT0000A1JVU3 and AT0000A1LJH1) and the regu-lated market of the Luxembourg Stock Exchange (Bourse de Luxembourg).
In February 2017, a further bond with a volume of € 175 m with a coupon of 1.875% and a seven-year term has been issued.
OVERVIEW OF CA IMMO’S CORPORATE BONDS
ISIN
Corporate Bond
Outstanding
Volume
Denomination
in €
Coupon p. a. Term Redemption
AT0000A1CB33 € 175 m 500 2.750% 2015-2022 17.2.2022
AT0000A1LJH1 € 140 m 1,000 1.875% 2016-2021 12.7.2021
AT0000A1JVU3 € 150 m 1,000 2.750% 2016-2023 17.2.2023
AT0000A1TBC2 € 175 m 1,000 1.875% 2017-2024 22.2.2024
1) Source: Bloomberg

INVESTOR RELATIONS
INV
ER
ST
OR
RE
LA
TIO
NS
11
INVESTOR RELATIONS ACTIVITIES
For CA Immo, dialogue with stakeholders, transparency and active communication are the top priorities in infor-mation policy. In addition to the legal obligation to in-form (through the publication of insider information, quarterly financial reporting, etc.), dialogue with ana-lysts, institutional investors and private shareholders takes place through personal meetings at roadshows and conferences and through participation in events and trade fairs specifically aimed at private shareholders. Pri-vate shareholders regularly use the Ordinary General Meeting, investor fairs and the shareholders’ phone line
to make contact with the Investor Relations team. Confer-ence calls for analysts also take place at least quarterly. In 2016, CA Immo participated in conferences and road-shows and arranged numerous conference calls, investor meetings and property tours at several of its main sites. The target audience was national and international inves-tors. Detailed information on key performance indicators, the CA Immo share, annual and quarterly results, finan-cial news items, presentations, IR events and much more is available on the website www.caimmo.com. Interested parties can also subscribe to our IR newsletter, which contains full details of recent developments.
SHARE RELATED KEY FIGURES
31.12.2016 31.12.2015
EPRA NNNAV/share € 24.56 22.69
NAV/share € 23.60 21.90
Price (key date)/NAV per share -11) % -26.00 -23.16
Price (key date)/NNNAV per share -11) -28.90 -25.82
Number of shares pcs. 98,808,336 98,808,336
Treasury shares pcs. 5,403,319 2,000,000
number of shares outstanding pcs. 93,405,017 96,808,336
Ø number of shares pcs. 98,808,336 98,808,336
Ø Treasury shares pcs. 3,813,021 866,601
Ø number of shares outstanding pcs. 94,995,315 97,941,735
Ø price/share € 16.40 16.80
Market capitalisation (key date) € m 1,726 1,663
Highest price € 19.50 18.59
Lowest price € 14.35 14.82
Closing price € 17.47 16.83
Dividend/share paid in the business year € 0.50 0.45
Dividend yield % 2.86 2.67
1) before deferred taxes

INVESTOR RELATIONS
12
BASIC INFORMATION ON THE CA IMMO SHARE
Type of shares: No-par value shares
Stock market listing: Vienna Stock Exchange, prime market
Indices: ATX, ATX-Prime, IATX, FTSE EPRA/NAREIT Europe, GPR 250, WBI
Specialist: Raiffeisen Centrobank AG
Market Maker: Baader Bank AG, Erste Group Bank AG
Stock exchange symbol / ISIN: CAI / AT0000641352
Reuters: CAIV.VI
Bloomberg: CAI:AV
Email: [email protected]
Web site: www.caimmo.com Investor Relations contacts:
Christoph Thurnberger Tel. +43 1 532 59 07-504 Fax: +43 1 532 59 07-550 [email protected]
Claudia Höbart Tel. +43 1 532 59 07-502 Fax: +43 1 532 59 07-550 [email protected]
FINANCIAL CALENDAR 2017
22 MARCH PUBLICATION OF ANNUAL RESULTS FOR 2016 PRESS CONFERENCE ON FINANCIAL STATEMENTS
24 MAY INTERIM REPORT FOR THE FIRST QUARTER 2017
1. MAY VERIFICATION DATE FOR THE 30TH ORDINARY GEN-ERAL MEETING
24 AUGUST SEMI-ANNUAL REPORT 2017
11 MAY 30TH ORDINARY GENERAL MEETING
23 NOVEMBER INTERIM REPORT FOR THE THIRD QUARTER 2017
15 MAY / 16 MAY / 17 MAY EX-DIVIDEND DATE / RECORD DATE (DIVIDEND) / DIV-IDEND PAYMENT DAY
22 MARCH 2018PUBLICATION OF ANNUAL RESULTS FOR 2017 PRESS CONFERENCE ON FINANCIAL STATEMENTS

CORPORATE GOVERNANCE
CO
RP
OR
AT
E G
OV
ER
NA
NC
E
13
DEAR SHAREHOLDERS,
In business year 2016, the Supervisory Board of CA Immo undertook its tasks in accordance with legisla-tion and the articles of association at a total of nine ple-nary sessions. Particular attention was paid to the rea-lignment of the company and the associated merger plans of IMMOFINANZ, the new main shareholder. The Super-visory Board was also closely involved in budgetary mat-ters, the issue of two corporate bonds, numerous land and property sales, potential acquisitions (of joint ven-ture shares, amongst other things) and project realiza-tions; changes to the Management Board constituted an-other major subject.
Key topics in regular reporting included financing and liquidity issues, current legal proceedings and risks, de-velopments on financial and real estate markets, resultant opportunities and threats and property valuations. Evalu-ating the organisation and working methods of the Super-visory Board and its committees was central to an annual self-assessment exercise. The results of this evaluation and the annual activity report on compliance manage-ment were discussed and corporate governance was re-viewed. Reports on risk management and the observa-tions of Internal Auditing were discussed at regular inter-vals by the Audit Committee, which reported its findings to the Supervisory Board. The Management Board ex-plained any deviations from planned values and targets in full. Decisions and measures taken by the Management
Board were transparent and raised no objections. Cooper-ation between the Supervisory Board and the Manage-ment Board was characterised by open discussion. Con-tact between the Supervisory Board chairman and the Management Board underlined the openness of ex-changes on matters of relevance to decision-making. All developments in the company were reported to the Su-pervisory Board promptly and in full.
Personnel changes in the Supervisory and Management Boards At the 29th Ordinary General Meeting, O1 Group Lim-
ited (‘O1’, formerly the main shareholder of CA Immo) utilised the right of appointment conferred by its regis-tered shares for the first time. Dr. Wolfgang Renner, Ma-rina Rudneva and Timothy Fenwick were duly appointed to the Supervisory Board with immediate effect. Also at this meeting, Torsten Hollstein and Dr. Florian Koschat were elected to the Supervisory Board at the request of O1 until the Ordinary General Meeting that rules on the approval of actions in business year 2020. The maximum number of shareholder representatives permitted by the Articles of Association (12) has thereby been reached. The following changes also took place: Torsten Hollstein was elected as the new Chairman of the Supervisory Board, with Dr. Florian Koschat elected as the new sec-ond Deputy Chairman; Dmitry Mints was confirmed as Deputy Chairman of the Supervisory Board. The works council also exercised its right to appoint four represent-atives to the Supervisory Board. With effect from 10 No-vember 2016, Supervisory Board members Dr. Wolfgang Ruttenstorfer, Barbara Knoflach and Dr. Maria Doralt re-signed their mandates in accordance with the statutory deadline. Dmitry Mints resigned his mandate as Deputy Chairman of the Supervisory Board with effect from 21 December 2016. IMMOFINANZ AG, the new main share-holder of CA Immo, also exercised the right of appoint-ment conferred by its four registered shares to appoint Dr. Oliver Schumy, Stefan Schönauer, Professor Klaus Hirschler and Professor Sven Bienert to the Supervisory Board of CA Immo until further notice. Dr. Wolfgang Ren-ner, Marina Rudneva and Timothy Fenwick stepped down as Supervisory Board members. The current mem-bers of the Supervisory Board are listed at www.caimmo.com and in the corporate governance re-port.
On 30 September 2016, Florian Nowotny also resigned as a Management Board member and CFO of CA Immo. He was succeeded by Dr. Hans Volckens, who took the reins of the finance division. Thanks to his educational
SUPERVISORY BOARD REPORT

CORPORATE GOVERNANCE
14
and career background, Dr. Volckens has a wealth of ex-pertise in the fields of law, taxation and accounting as well as extensive managerial experience with listed and privately run real estate companies. Between October 2011 and April 2014, he was the Chief Financial Officer of IVG Immobilien AG, guiding the company through a period of financial restructuring. Prior to this, Dr. Volckens served on the management boards of companies including Hannover Leasing GmbH & Co KG.
The Supervisory Board would like to thank the resign-ing Supervisory Board members and former Chief Finan-cial Officer Florian Nowotny for their dedication and val-uable contribution.
Committee activities in 2016 The investment committee convened three times in
2016 to scrutinise potential real estate acquisitions and sales as well as the implementation of projects. All measures proposed by the Management Board were ap-proved by the investment committee, which advised the Supervisory Board as appropriate on recommended deci-sions. Management Board issues were uppermost on the agenda at the three meetings held by the remuneration and nomination committee. At its March meeting, the committee was focused on determining the extent to which targets were met in 2015 and redefining targets for 2016 (performance-related pay). In the summer, the com-mittee passed the amendment of the employment con-tract for the Chief Executive Officer (change of control clause) following intense discussions; the employment contract for the new Chief Financial Officer was ap-proved in the autumn. The Audit Committee held four meetings in the last business year. The annual and con-solidated financial statements for 2015 (including the management reports), the corporate governance report, the internal monitoring system and the effectiveness of risk management at CA Immo were discussed and exam-ined with the auditor and the Management Board in March 2016. In accordance with article 270 subsection 1a of the Austrian Commercial Code, the statement was ob-tained from the proposed auditor, whose legal relation-ship with CA Immo and its senior executives was scruti-nised; the fee for carrying out the audit was negotiated and a recommendation on the selection of an auditor was submitted. The financial result and progress on current business activity, including the risk report, were dis-cussed quarterly; no objections were raised. Moreover, the legally required advance approval for non-audit ser-vices of the auditor was granted in November 2016. The
web site www.caimmo.com and the corporate governance report contain more information on the responsibilities of the Supervisory Board and its committees.
Consolidated and annual financial statements for 2016 KPMG Austria GmbH Wirtschaftsprüfungs- und Steuer-
beratungsgesellschaft has audited the annual and consoli-dated financial statements for 2016 (including the man-agement reports) and expressed its (unqualified) auditor’s opinion. The auditor also determined that the Manage-ment Board has established a risk management system with a concept that allows it to operate in such a way as to identify developments hazardous to the company’s survival at an early stage. Moreover, an evaluation of compliance with rules 1 to 76 of the Austrian Corporate Governance Code for business year 2016 found that dec-larations of conformity submitted by CA Immo with re-gard to compliance with the C and R Rules of the Code were correct.
All documents making up the financial statements, the proposal on the distribution of profit, the auditor’s re-ports and the corporate governance report were discussed in detail by the Audit Committee in the presence of the auditor and the Management Board members and exam-ined. After concluding the examination, no significant objections were raised. The Supervisory Board endorsed the annual financial statements, which were thus adopted in accordance with article 96 subsection 4 of the Austrian Stock Corporation Act. Taking into considera-tion the company's earnings performance and financial situation, the Supervisory Board indicated its consent to the Management Board’s proposal on the distribution of profit.
The Supervisory Board would like to extend particular thanks to all employees for their hard work and unswerv-ing commitment throughout an eventful and highly suc-cessful business year 2016.
On behalf of the Supervisory Board Torsten Hollstein, Chairman
Vienna, 21 March 2017

CORPORATE GOVERNANCE
CO
RP
OR
AT
E G
OV
ER
NA
NC
E
MANAGEMENT BOARD
Accounting
Controlling
Finance
Capital Markets / Investor Relations
Legal
Corporate Strategy
Corporate Communications
Investment- & Asset-Management
Development
Engineering
Human Resources
IT and Organisation
FULL MANAGEMENT
DR. HANS VOLCKENS CFO
FRANK NICKELCEO
RISK MANAGEMENT PROPERTY VALUATIONCORPORATE OFFICE / COMPLIANCE
INTERNAL AUDIT
FRANK NICKEL (BORN 1959) CHIEF EXECUTIVE OFFICER (CEO)
Frank Nickel was appointed CEO of CA Immobilien Anlagen AG as of 1 January 2016 and is thus responsible for corporate strategy, corporate communication and the operational Real Estate Divisions as well as the Human Resources, Organisation and IT departments. Before joining the CA Immo Group, he was CEO of Cushman & Wakefield LLP Germany, member of Cushman’s Euro-pean Executive Committee and Chairman of its EMEA Corporate Finance division. Prior to joining Cushman & Wakefield, Mr. Nickel was working for Deutsche Bank in Frankfurt as Managing Director and Head of Commer-cial Real Estate for Germany, Austria and Switzerland and member of the Commercial Real Estate Executive Committee. Mr. Nickel is member of the committee of Real Estate Financing of ZIA (Zentraler Immobilienausschuss) and member of the supervisory board of IREBS (International Real Estate Business School).
Initial appointment: 1.1.2016Term of office ends: 31.12.2018
DR. HANS VOLCKENS (BORN 1970) MANAGEMENT BOARD MEMBER (CFO)
Dr. Hans Volckens took over management of the finance division (accounting, controlling, debt funding, capital markets and investor relations and legal department) as of September 27, 2016. With a doctorate in Law, he initially has been in investment banking and worked then as a lawyer, tax consultant and specialist lawyer for tax law. From 2008 to 2011, Dr. Volckens was a member of the management board of Hannover Leasing GmbH & Co. KG; from there, he transferred to IC Immobilien Holding AG and managed its refinancing. From October 2011 to April 2014, Dr. Volckens was Chief Financial Officer of IVG Immobilien AG. Dr. Volckens is i.a. Chairman of the tax committee of the German Property Federation (ZIA e.V.); Head of the Working Group Restructuring of the Initiative Corporate Governance der deutschen Immobilienwirtschaft e.V. and lecturer for real estate tax law at the University of Regensburg.
Initial appointment: 27.9.2016Term of office ends: 30.9.2018
15
CORPORATE GOVERNANCE
SUPERVISORY BOARD
TORSTEN HOLLSTEIN (born 1965)
Chairman of the Supervisory Board
Initial appointment: 3.5.2016
Term of office ends: 2020 (33rd AGM)
Independent according to C Rule 53 and 54
Torsten Hollstein is a Managing Director
and founding partner of CR Investment
Management. Mr. Hollstein holds two
state qualifications in law and was a
lawyer with Lehman Brothers and Ger-
man mid-market private equity company
Hannover Finanz. He was Managing
Director of Catella Property Germany
prior to the spin-off of Catella Corporate
Finance Germany and amalgamation with
DeutscheRiver to create ‘CR’.
Other supervisory board mandates or
similar functions in Austrian or foreign
listed companies: none
DR. FLORIAN KOSCHAT
Deputy Chairman of the Supervisory
Board (born 1974)
Initial appointment: 3.5.2016
Term of office ends: 2020 (33rd AGM)
Independent according to C Rule 53 and 54
Dr. Florian Koschat is the CEO and
founding partner of Pallas Capital Adviso-
ry AG, the leading corporate finance and
M&A consulting firm. Mr. Koschat has
more than 15 years’ experience in invest-
ment banking. He has been involved in
several large-scale transactions and spe-
cialises in the emerging markets of Central
and Eastern Europe and the CIS.
Other supervisory board mandates or
similar functions in Austrian or foreign
listed companies: none
RICHARD GREGSON (born 1966)
Initial appointment: 28.4.2015
Term of office ends: 2020 (33rd AGM)
Independent according to C Rule 53 and 54
Richard Gregson is an Associate of the
Institute of Chartered Accountants and a
Registered Company Auditor in Aus-
tralia. He has over 29 years’ professional
experience, much of which was spent
with PricewaterhouseCoopers as a partner
in the financial services field, including
many years leading the firm’s real estate
practice in Russia. Mr. Gregson currently
holds several posts in the areas of ac-
counting, audit and advisory. He has been
an independent, non-executive director of
O1 Properties Ltd. since June 2012, where
he chairs the audit and risk committee.
Other supervisory board mandates or
similar functions in Austrian or foreign
listed companies: none
JOHN NACOS (born 1967)
Initial appointment: 28.4.2015
Term of office ends: 2020 (33rd AGM)
Independent according to C Rule 53 and 54
John Nacos worked for Merrill Lynch
for 11 years, where he set up and oversaw
mortgage financing as well as opportun-
istic real estate and MBS/ABS trading
activities in Europe. Between 2001 and
2011 he held various positions in the
field of commercial real estate at Deutsche
Bank before being appointed to the Board
of Directors of O1 Properties in September
2011. Among other things John Nacos is
a Founding and Executive Board member
of EG Real Estate Advisors and member of
the senior management team of CR Invest-
ment Management.
Other supervisory board mandates or
similar functions in Austrian or foreign
listed companies: none
MICHAEL STANTON (born 1960)
Initial appointment: 19.12.2014
Term of office ends: 2020 (33rd AGM) Independent according to C Rule 53 and 54
Having held various positions with
GLS Capital, Oppenheimer & Company
and Westpac Banking Corporation in
New York, USA, Michael Stanton can
call on more than 20 years’ experience
in the areas of finance, investments and
emerging markets. From 2006 to 2010 he
was employed by the private equity group
of Otkritie Financial Corporation. In 2010
he switched to O1 Group, where he holds
various positions in subsidiaries. Michael
Stanton is Founding member of EG Real
Estate Advisors and member of the senior
management team of CR Investment
Management.
Other supervisory board mandates or
similar functions in Austrian or foreign
listed companies: none
DR. OLIVER SCHUMY (born 1971)
Delegated through registered shares:
2.8.2016
Term of office ends: until further notice
Independent according to C Rule 53
Oliver Schumy has been the Chief Exec-
utive Officer of IMMOFINANZ since May
2015. Along with a doctorate in econom-
ics, Dr. Schumy has extensive experience
at managerial and board level. He has also
gained a wealth of operational knowledge,
especially in Russia and Eastern Europe.
Between June 2008 and his move to IM-
MOFINANZ, he was CFO of the Mayr-
Melnhof Group; prior to this appointment
he was Group Finance Director and per-
formed other managerial roles for Mayr-
Melnhof in the areas of finance, taxation,
Group accounting and M&A.
Other supervisory board mandates or sim-
ilar functions in Austrian or foreign listed
companies: CEO of IMMOFINANZ AG
and Deputy Chairman of the BUWOG AG
Supervisory Board
STEFAN SCHÖNAUER
(born 1979)
Delegated through registered shares:
2.8.2016
Term of office ends: until further notice Independent according to C Rule 53
Stefan Schönauer, born 1979, has been
the Chief Financial Officer of IMMOFI-
NANZ since 11 March 2016. Prior to
this he performed managerial functions
for IMMOFINANZ from December 2008
onwards, most recently acting as Head of
Capital Markets and Corporate Strategy.
His fields of responsibility over recent
years have included overseeing major
Group projects (including the BUWOG
spin-off and the sale of a logistical portfo-
lio), capital market financing and Investor
16

CO
RP
OR
AT
E G
OV
ER
NA
NC
E
CORPORATE GOVERNANCE
Relations. Earlier in his career, the holder
of a degree in business economics and
specialist in business informatics worked
for Invesco Asset Management Österreich.
Other supervisory board mandates or
similar functions in Austrian or foreign
listed companies: Chief Financial Officer
of IMMOFINANZ AG
PROF. DR. SVEN BIENERT
(born 1973)
Delegated through registered shares:
1.12.2016
Term of office ends: until further notice Independent according to C Rule 53
Amongst other things, Professor Bienert
spent many years in managerial posi-
tions with international consulting firms
and other businesses in the financial and
real estate sectors. Since April 2010 he
has headed the Centre of Excellence for
Sustainability in the Real Estate Sector at
the IRE|BS Institute of the University of
Regensburg, where he also holds a chair.
In April 2013 he became Managing Direc-
tor of the IRE|BS Institute. Between 2011
and 2013, Professor Bienert was simulta-
neously Chief Executive Officer of Vienna-
based Probus Real Estate GmbH, which
has assets under management of approxi-
mately €2.1 bn. Aside from his role as an
expert and advisor, Professor Bienert is a
publisher and author of various textbooks
on real estate and the recipient of numer-
ous research prizes. Professor Bienert is
active in several industry associations; he
sits on the real estate advisory board of
the German Sustainable Building Council
and the Managing Board of the Initiative
Corporate Governance der deutschen Im-
mobilienwirtschaft e.V. (ICG).
Other supervisory board mandates or sim-
ilar functions in Austrian or foreign listed
companies: none
UNIV.-PROF. DR. KLAUS HIRSCHLER
(born 1966)
Delegated through registered shares:
1.12.2016
Term of office ends: until further notice Independent according to C Rule 53
Dr. Klaus Hirschler is a university pro-
fessor at the Institute for Accounting and
Auditing at Vienna University of Eco-
nomics and Business. He is mainly ac-
tive in the fields of accounting, reorgani-
sations and analysing annual financial
statements; he is also deputy chairman
of the expert committee on fiscal law
at the Austrian Chamber of Public Ac-
countants. Dr. Hirschler is a member of
AFRAC (the Austrian Financial Report-
ing and Auditing Committee) as well as
a lecturer and the author of many spe-
cialist publications.
Other supervisory board mandates or
similar functions in Austrian or foreign
listed companies: none
EMPLOYEE REPRESENTATIVES
SEBASTIAN OBERMAIR
Employee representative (born 1980)
Delegated since: 22.3.2016
Term of office: open-ended
Sebastian Obermair completed a
degree in business consultancy at the
University of Applied Sciences Wiener
Neustadt. In 2013 he was appointed
head of the Group Accounting division
of CA Immo. Prior to this, he had spent
around six years working for the con-
solidation area of IMMOFINANZ AG.
Other supervisory board mandates or
similar functions in Austrian or foreign
listed companies: none
GEORG EDINGER
Employee representative (born 1976)
Delegated since: 3.5.2016
Term of office: open-ended
Georg Edinger studied European
business and corporate management
in Vienna followed by real estate asset
management at IREBS in Germany. In
1992 he began his career in sales for
Austrian trading companies. He joined
the Organisation division of CA Immo
in 2012.
Other supervisory board mandates or
similar functions in Austrian or foreign
listed companies: none
NICOLE KUBISTA
Employee representative (born 1974)
Delegated since: 3.5.2016
Term of office: open-ended
Nicole Kubista started her career with
BDO in Vienna in 1999, successfully
qualifying as a tax consultant in 2003.
In 2007 she joined CA Immo, where she
is currently deputy head of the Tax and
Accounting division. Amongst other
things, she is responsible for compiling
consolidated financial statements for
Austria and Germany in particular.
Other supervisory board mandates or
similar functions in Austrian or foreign
listed companies: none
FRANZ REITERMAYER
Employee representative (born 1979)
Delegated since: 3.5.2016
Term of office: open-ended
Franz Reitermayer studied at the
University of Applied Sciences Wiener
Neustadt. He joined CA Immo immedi-
ately after graduating, and has worked for
the company’s Asset Management CEE/
SEE/CIS division since 2004.
Other supervisory board mandates or
similar functions in Austrian or foreign
listed companies: none
17
CORPORATE GOVERNANCE
18
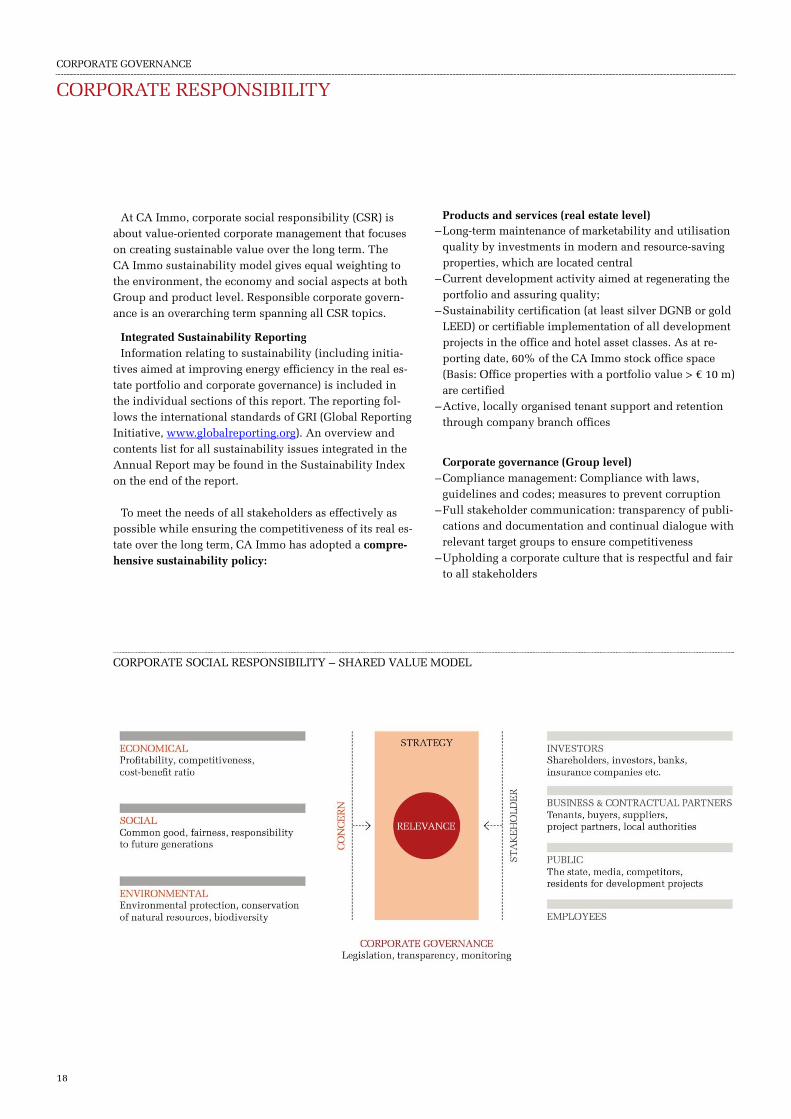
At CA Immo, corporate social responsibility (CSR) is about value-oriented corporate management that focuses on creating sustainable value over the long term. The CA Immo sustainability model gives equal weighting to the environment, the economy and social aspects at both Group and product level. Responsible corporate govern-ance is an overarching term spanning all CSR topics.
Integrated Sustainability Reporting Information relating to sustainability (including initia-
tives aimed at improving energy efficiency in the real es-tate portfolio and corporate governance) is included in the individual sections of this report. The reporting fol-lows the international standards of GRI (Global Reporting Initiative, www.globalreporting.org). An overview and contents list for all sustainability issues integrated in the Annual Report may be found in the Sustainability Index on the end of the report.
To meet the needs of all stakeholders as effectively as possible while ensuring the competitiveness of its real es-tate over the long term, CA Immo has adopted a compre-hensive sustainability policy:
Products and services (real estate level) – Long-term maintenance of marketability and utilisation
quality by investments in modern and resource-saving properties, which are located central
– Current development activity aimed at regenerating the portfolio and assuring quality;
– Sustainability certification (at least silver DGNB or gold LEED) or certifiable implementation of all development projects in the office and hotel asset classes. As at re-porting date, 60% of the CA Immo stock office space (Basis: Office properties with a portfolio value > € 10 m) are certified
– Active, locally organised tenant support and retention through company branch offices
Corporate governance (Group level) – Compliance management: Compliance with laws,
guidelines and codes; measures to prevent corruption – Full stakeholder communication: transparency of publi-
cations and documentation and continual dialogue with relevant target groups to ensure competitiveness
– Upholding a corporate culture that is respectful and fair to all stakeholders
CORPORATE SOCIAL RESPONSIBILITY – SHARED VALUE MODEL
CORPORATE RESPONSIBILITY

CORPORATE GOVERNANCE
CO
RP
OR
AT
E G
OV
ER
NA
NC
E
19
INITIATIVES AIMED AT RAISING THE ENERGY EFFICIENCY OF THE ASSET PORTFOLIO
CA Immo holds international investment properties of many different kinds at many stages of the property life-cycle. In order to ensure the longest possible value reten-tion and marketability of all properties, CA Immo Asset Management applies diversified quality management. To establish the best possible conditions for long-term rent-als, various highly specific measures aimed at properties and their tenants are adopted.
The most important levers in integrated quality assur-ance are:
– Standardised recording of structural properties (incl. energy consumption values) as the decision-making ba-sis in active asset management
– Needs-based investment to ensure portfolio quality and user comfort
– Sustainability certification for strategic core properties as objectified evidence of the building quality
– Raising awareness among current tenants to improve re-source conservation by users
Energy consumption and the carbon footprint Conservation of resources is a major theme affecting the
future of the real estate sector. CA Immo continually col-lates and analyses international data on consumption as well as carbon emissions produced by the heat and
energy consumption of its office properties1). The table indicates the relevant values for business year 2015 ac-cording to region. The data is applied to ongoing portfo-lio monitoring, on the basis of which decisions on maintenance measures are made. Annual energy audits are also carried out in owner-occupied CA Immo office premises in Germany and Austria with the specific aim of progressively optimising energy values.
Sustainability certification for investment properties To facilitate transparent comparison of the quality of
portfolio buildings across international boundaries, CA Immo has certified more and more portfolio buildings since 2015. In 2016, the certification process was com-pleted for six office properties in total. As at 31 December 2016, 60%1) (31.12.2015: 45%) of the CA Immo stock of-fice space has been certified according to DGNB, LEED or BREEAM standards. Further standing office buildings are undergoing the certification process.
CERTIFIED OFFICE SPACE BY REGION1)
in sqm Total office
space
Certified office
space
Share of
certified office
space in %
Germany 244,232 167,582 69%
Austria 149,073 17,500 12%
Eastern Europe 659,298 448,614 68%
Total 1,052,603 633,696 60%
1) Basis: Office properties with a portfolio value > € 10 m
CARBON FOOTPRINT, ENERGY AND WATER CONSUMPTION IN THE OFFICE PORTFOLIO 2015 1)
Power consumption
in kWh 2)
Heating energy
consumption
in kWh
Total Carbon-Emission 3)
in kgCO2/a
Water consumption
in m³
Rental office
space 4)
/sqm rental
space
Absolute /sqm rental
space
Absolute /sqm rental
space
Absolute /sqm rental
space
Absolute In sqm
Eastern Europe 200.05 106,758,211 146.07 77,951,045 129.41 69,061,217 0.66 354,775 533,664
Germany 92.04 25,519,385 64.84 17,978,963 67.50 18,715,814 0.31 86,012 277,262
Austria 108.96 15,317,013 85.62 12,036,319 26.33 3,701,093 0.42 59,476 140,579
Total 155.12 147,594,609 113.47 107,966,326 96.14 91,478,123 0.53 500,263 951,505
1) Basis: Office properties with a portfolio value > € 10m. The calculation of carbon emissions from power consumption is based on 47 properties, or 84 % of the rentable area of the portfolio (as at 31.12.2015).
2) Power consumption incl. tenant´s power consumption. As for consumption data without tenant´s power consumption, a value of 50 kWh/m²a was as-sumed
3) The calculation of carbon emissions caused by power and heating energy consumption take account of the so-called carbon dioxide equivalent, which differs between countries and sometimes regions. The higher the proportion of renewable energy in the production of electric power and heating, the lower the carbon dioxide equivalent.
4) Rented office space with consumption data

CORPORATE GOVERNANCE
20
CERTIFICATES OF THE CA IMMO OFFICE PORTFOLIO
Management and user conduct as key levers To optimise the energy balance of their portfolio build-
ings, CA Immo also maintains a dialogue with users. A Group-wide information campaign concerning the re-source-efficient usage of office buildings by CA Immo of-fice tenants was launched in business year 2013 under the slogan ‘Think more, waste less’.
SUSTAINABLE PROJECT DEVELOPMENT
Through its real estate and urban district development activities, CA Immo is helping to shape the skylines of major cities like Vienna, Berlin, Frankfurt and Munich – from involvement in the master plan to the establishment of surrounding infrastructure and the construction and running of new buildings.
Projects with sustainability certificates To comply with the multifarious requirements arising at
all levels, CA Immo only constructs offices (since 2011; minimum standard: DGNB silver) and hotels (since 2013) certified to LEED, DGNB or ÖGNI standards on a Group-wide basis. By meeting various certification require-ments, the company makes allowance for the conserva-tion of resources such as energy and water as well as emissions, wastewater and refuse and the transporting thereof; effects on safety and health are considered throughout the lifecycle.
Dialogue with residents and stakeholders Within the context of its development projects,
CA Immo observes legal requirements on potentially neg-ative influences on stakeholders (such as construction noise and increased particulate matter pollution) and en-gages in proactive dialogue with relevant stakeholders from the outset. Examples of this have included the site conferences for the new Europacity in Berlin.
Observance of social and environmental standards
Where construction services are provided, CA Immo re-quires contractors to comply with the legal regulations on occupational health and safety, workplace regulations, working time regulations and wage agreements; the com-pany also verifies compliance. Alongside the economic evaluation of tenders, the company asks potential con-tractors to comply with social and environmental stand-ards and monitors observance during the tendering pro-cess.
SUSTAINABILITY CERTIFICATIONS OF CURRENT DEVELOPMENT PROJECTS
Country City Project System Category Version
Germany Berlin ABDA office building DGNB Gold Office new construction
Germany Berlin KPMG office building DGNB Gold Office new construction
Germany Munich MY.O DGNB Gold Office new construction
Germany Frankfurt Steigenberger Hotel DGNB Gold Hotel new construction
Germany Mainz ZigZag DGNB Gold Office new construction
Germany Berlin cube berlin DGNB Gold Office new construction
Germany Munich NEO DGNB Gold Office new construction
Austria Vienna ViE DGNB Gold Office new construction
Romania Bucharest Orhideea Towers LEED Gold Office new construction
DGNB Gold 22 %
LEED Platin 6%
LEED Gold 45%
DGNB Platin 6%
Basis: 633,696 m² certified office space
BREEAM Very good 21%

CORPORATE GOVERNANCE
CO
RP
OR
AT
E G
OV
ER
NA
NC
E
21
Sensitive site development Maximum attention is paid to issues such as biodiver-
sity, species protection and (where relevant) habitat change during site development, especially in and around nature reserves. All properties are evaluated accordingly with restoration work and mitigating measures intro-duced as appropriate; these may include the creation of green access pathways or the planting of tree and bushes.
Example of land remediation: Zollhafen Mainz In the spring of 2016, CA Immo cleaned up oil damage
on the site of the planned ZigZag office building at the Zollhafen in Mainz through its wholly owned construc-tion subsidiary omniCon. The site, which had been used as a fuel depot until a few years ago, had been locally contaminated mainly by petroleum hydrocarbons but also volatile by-products of petrol. Before undertaking the re-mediation work, ground air pollution was significantly reduced by means of an extraction process outside of the construction site. In the next step, mini diggers excavated the polluted soil to a depth of around seven metres and the polluted ground water was decontaminated. The area has now been approved for the planned development.
Preparing the ground: construction subsidiary omniCon cleaned up oil
damage at Zollhafen Mainz
EXAMPLE OF SUSTAINABLE PROJECT DEVELOPMENT: THE ORHIDEEA TOWERS IN BUCHAREST

CORPORATE GOVERNANCE
22
COMMITMENT TO COMPLIANCE WITH CORPORATE GOVERNANCE STANDARDS
Compliance with legal provisions applicable in the CA Immo Group’s target markets is a high priority for the company. We organise our business in such a way that we are able to comply with all applicable compliance standards in our everyday business dealings. The Man-agement Board and Supervisory Board are committed to observing the Austrian Corporate Governance Code1 and thus to transparency and principles of good corporate management.
External evaluation The evaluation carried out by KPMG Austria GmbH
Wirtschaftsprüfungs- und Steuerberatungsgesellschaft concerning compliance with rules 1 to 76 of the Austrian Corporate Governance Code for business year 2016 found that declarations of conformity submitted by CA Immo with regard to compliance with the C and R Rules of the Code were correct.
COMPLY OR EXPLAIN
The rules and recommendations of the version of the Corporate Governance Code applicable in business year 2016 (January 2015 amendment) are implemented almost in full. Discrepancies were noted in respect of C Rules no. 2 (right of appointment to the Supervisory Board), 38 (appointment of Management Board members), 39 (com-mittee authorised to take decisions in urgent cases) and 45 (executive positions with competitor companies).
C Rule no. 2: Shares are to be construed in accordance with the ‘one share – one vote’ principle.
Explanation/reason: The ordinary shares of the com-pany (98,808,332 bearer shares and four registered shares) were issued in accordance with the ‘one share – one vote’ principle. At present, 74% of the voting rights are in free float, with 26% (including the four registered shares) held by IMMOFINANZ since 2 August 2016; the company has a stock of treasury shares amounting to ap-proximately 5.5%. The registered shares in existence since the founding of the company confer the right of nominating up to four Supervisory Board members. Full use was made of this right of appointment: the Supervi-sory Board currently comprises five shareholder repre-sentatives elected by the Ordinary General Meeting, four
1) The Austrian Corporate Governance Code may be viewed on the web site of the Austrian Working Group for Corporate Governance at www.corporate-
governance.at.
shareholder representatives appointed by registered shares and four employee representatives. Transfer of reg-istered shares requires the approval of the company. In the view of the company, the right of all shareholders to participate in the composition of the Supervisory Board is upheld in spite of the registered shares. The Austrian Stock Corporation Act provides for the delegation of members to the Supervisory Board, whereby the total number of appointed members may not exceed one third of all Supervisory Board members. Moreover, appointed members of the Supervisory Board may also be removed from office at the request of a minority (10% of the capi-tal stock) where there is good cause relating to an indi-vidual member personally; however, this depends on a majority required for resolutions of 75% of the capital stock represented (article 21 of the Articles of Associa-tion of CA Immo). There are no preference shares or re-strictions on issued ordinary shares of the company. The Austrian Takeover Act also ensures that all shareholders would receive the same price for their CA Immo shares in the event of a takeover bid (mandatory offer). The share-holders alone would decide whether to accept or reject any such bid.
C Rule no. 38: The Supervisory Board must appoint members of the Management Board in line with corporate strategy and the current position of the company accord-ing to a defined appointment procedure. The Supervisory Board must ensure no member of the Management Board has been convicted by a court of an offence that would cast doubt on their professional integrity as a Manage-ment Board member. The Supervisory Board also needs to take account of succession planning.
Explanation/reason: Given the sudden resignation of Dr. Bruno Ettenauer (end of December 2015) and Florian Nowotny (end of September 2016) from the Management Board of CA Immo, it was in the interests of both the company and its shareholders to fill the vacancies quickly. For this reason, the usual appointment proce-dure (executive search, selection of potential candidates via long/short lists) was not applied. A carefully consid-ered decision was taken following extensive discussion by the full Supervisory Board.
C Rule no. 39: The Supervisory Board must ensure that a committee is authorised to take decisions in urgent cases.
CORPORATE GOVERNANCE REPORT

CORPORATE GOVERNANCE
CO
RP
OR
AT
E G
OV
ER
NA
NC
E
23
Explanation/reason: Following the pattern of recent years, CA Immo has an audit committee, an investment committee and a joint remuneration and nomination committee. No committee was set up to rule on urgent matters; all urgent decisions were taken by the full Super-visory Board itself. In future, the Supervisory Board will again establish a presiding committee comprising, ac-cording to its rules of procedure, the Supervisory Board chairperson, one of their deputies and another Supervi-sory Board member.
C Rule no. 45: Supervisory Board members may not take up executive positions with companies that are com-petitors of CA Immo.
Explanation/reason: According to L Rule no. 52, the Or-dinary General Meeting considers the professional and personal qualifications of candidates and aims to main-tain a balance of expertise across the Supervisory Board in the selection of Supervisory Board members. Aspects of diversity are considered in terms of the representation of both genders, the age profile and the international make-up of the Supervisory Board. To meet these criteria and uphold an in-depth knowledge of the real estate sec-tor, there will clearly be a preference for persons with a background in a similar industry environment. For this reason, the possibility that Supervisory Board members will hold positions with broadly similar companies can-not be ruled out. However, persons proposed for election to the Supervisory Board must present to the Ordinary General Meeting their professional qualifications, state their vocational or similar functions and disclose all cir-cumstances that could give rise to concern over partial-ity.
Moreover, members of the Management Board are not permitted to run a company, own another business enter-prise as a personally liable partner or accept Supervisory Board mandates in companies outside the Group without the consent of the Supervisory Board. Senior executives may only enter into secondary activities (and in particu-lar accept executive positions with non-Group compa-nies) with the approval of the Management Board.
Neither Management Board nor Supervisory Board members are permitted to make decisions in their own interests or those of persons or organisations with whom they are closely acquainted where such interests are counter to the (business) interests of the CA Immo Group. All conflicts of interests must be declared immediately. In the event of a contradiction of interests arising, the
member in question shall be required to abstain from tak-ing part in voting procedures or leave the meeting while the relevant agenda item is being discussed.
The following Supervisory Board members hold execu-tive positions with similar companies:
Following the acquisition of a 26% stake and the four registered shares of CA Immo by IMMOFINANZ in Au-gust 2016, Dr. Oliver Schumy and Stefan Schönauer, the two Management Board members of IMMOFINANZ, also joined the CA Immo Supervisory Board. IMMOFINANZ is one of the biggest competitors of CA Immo. Between IMMOFINANZ and CA Immo there is a reciprocal share-holding. The CA Immo Group holds 54,805,566 bearer shares of IMMOFINANZ (equivalent to approximately 5.6% of the capital stock of IMMOFINANZ AG). Further-more, the two companies have agreed to engage in con-structive dialogue regarding a possible amalgamation. The sale or hiving off of the IMMOFINANZ Russia port-folio is a precondition to merger talks; talks on the poten-tial merger will be suspended until that point.
Dr. Oliver Schumy was also the Deputy Chairman of the Supervisory Board of BUWOG AG. CA Immo has become a private party to criminal proceedings regarding privati-sation of the government-owned apartments (Causa BUWOG) having narrowly lost out to an IMMOFINANZ consortium in the bidding process.
Other members of the Supervisory Board hold executive positions with companies in related sectors; there is no direct competition with these companies at present. A full list of executive functions performed by Management and Supervisory Board members is published at www.caimmo.com.
All business transactions conducted between the com-pany and members of the Management Board as well as persons or organisations with whom they are closely ac-quainted must conform to industry standards and have the approval of the Supervisory Board. The same applies to contracts between the company and members of the Supervisory Board which oblige those members to per-form services outside of their Supervisory Board activi-ties for the CA Immo Group in return for remuneration of a not inconsiderable value (L Rule no. 48) and to con-tracts with companies in which a Supervisory Board member has a significant business interest. The company is not permitted to grant loans to members of the Super-visory Board outside the scope of its ordinary business activity.

CORPORATE GOVERNANCE
24
THE EXECUTIVE BODIES OF CA IMMO2)
Management and supervisory structure Unless legally regulated, the responsibilities of Manage-
ment and Supervisory Boards and cooperation between Board members are defined by the Articles of Association and rules of procedure passed by the Supervisory Board (including the schedule of responsibilities for the Manage-ment Board). The obligations therein defined as regards information provision and reporting by the Management Board apply to all subsidiaries of CA Immo. The full Su-pervisory Board rules on matters of critical importance as well as general strategy. The Board also executes its duties through three competent committees. The Supervisory Board report describes its main activities in business year 2016. The rules of procedure of the Supervisory Board and associated business matters requiring approval (which covers all Group subsidiaries) are published on the Internet at www.caimmo.com.
Collaboration within the Management Board The Management Board of CA Immo currently has two
members. Since 1 January 2016, Frank Nickel has been the Chief Executive Officer and spokesperson for the Management Board. He is responsible for overall organisa-tion and management, the strategic direction and future development of the company and for representing the company to its supervisory boards and owners. As the Management Board spokesperson, he also issues state-ments to the general public and the media. Since 27 Sep-tember 2017, Dr. Hans Volckens took the reins of the fi-nance division. Regardless of individual departmental and Board responsibilities, all agendas are discussed openly by the Board members at regular Management Board meetings, with departmental representatives in-cluded in the discussions. The implementation of resolu-tions passed is constantly monitored. The Supervisory Board is informed immediately of any significant discrep-ancies from planned values. Irrespective of the division of authority, each member of the Management Board shares responsibility for the overall running of the company’s business affairs. The entire Management Board is respon-sible for realising the objectives of company policy and to this end bears general managerial responsibility at both company and Group level. These objectives are based on a wide-ranging corporate social responsibility CSR) strategy that takes account of economic, environmental and social
2) For more information on remuneration paid to all Management Board and Supervisory Board members in business year 2016, refer to the remuneration report.
aspects and defines exemplary corporate governance and compliance.
The Supervisory Board and its committees As at the balance sheet date, the Supervisory Board of
CA Immo comprised five shareholder representatives elected by the Ordinary General Meeting, four share-holder representatives appointed by registered shares and four employee representatives all of whom possess per-sonal integrity, market knowledge and experience. In ac-cordance with the independence criteria laid down by the Supervisory Board (C Rule no. 53), a Supervisory Board member is deemed to be independent where he or she has no business or personal relationship with the company or its Management Board which could give rise to a material conflict of interests and thus influence the conduct of that member. All members of the Supervisory Board have declared their independence according to C Rule no. 53. With the exception of the four members ap-pointed by registered shares (Dr. Oliver Schumy, Stefan Schönauer, Professor Sven Bienert and Professor Klaus Hirschler), all members of the Supervisory Board meet the criteria under C Rule no. 54 in that they do not repre-sent the interests of any shareholder with a stake of more than 10% (IMMOFINANZ). However, some members of the Supervisory Board perform functions in related com-panies or similar organisations that have the potential to create a conflict of interests. Full details are found under ‘Comply or explain’ (explanation/reason for C Rule no. 45) and in the ‘Related party disclosures’ in the notes. The independence criteria defined by the Supervisory Board are published on the Group’s web site along with a list of all mandates held by Board members outside the CA Immo Group.
The audit committee is responsible for overseeing the entire process of financial reporting, the (Group) auditing process, the effectiveness of the internal monitoring sys-tem, the internal auditing system and risk management. Auditing the annual and consolidated financial state-ments (including the management reports) and examin-ing the corporate governance report and proposals on the distribution of profit are also tasks of the audit commit-tee.

CORPORATE GOVERNANCE
CO
RP
OR
AT
E G
OV
ER
NA
NC
E
25
The committee also checks the independence of the (Group) auditor (especially with regard to additional ser-vices performed on behalf of the company) and puts for-ward proposals for the choice of (Group) auditor to the Supervisory Board.
All members of the audit committee (and especially Rich-ard Gregson) are acknowledged as financial experts on the basis of their experience and professional track records.
CURRENT COMPOSITION OF THE COMMITTEES
The audit committee The investment committee The remuneration and nomination committee
Richard Gregson (Chairman) Torsten Hollstein (Chairman) Torsten Hollstein (Chairman)
Dr. Florian Koschat John Nacos John Nacos
Michael Stanton Michael Stanton Michael Stanton
Nicole Kubista Georg Edinger Georg Edinger
Sebastian Obermair Franz Reitermayer Sebastian Obermair
The investment committee, in cooperation with the Management Board, prepares the ground for all invest-ment decisions that must be taken by the full Supervisory Board. The investment committee may also approve in-vestments in and sales of real estate and companies and the implementation of development projects and similar measures with total investment volumes of up to € 50 m; beyond this limit, the approval of the full Supervisory Board is required.
The remuneration and nomination committee is re-sponsible for succession planning for the Management Board and the Supervisory Board. Candidates for vacant Supervisory Board mandates put forward to the Ordinary General Meeting are considered on the basis of their pro-fessional and personal qualifications, with particular ef-forts made to maintain diversity and a balance of exper-tise across the Supervisory Board. Management Board members are invariably selected according to a defined appointment procedure, taking corporate strategy and the current position of the company into consideration. The remuneration and nomination committee also scrutinises the remuneration system for the Management Board and (in the case of exceptional bonuses) employees. On ac-count of their lengthy professional track records, all members of the remuneration and nomination committee possess sufficient knowledge and experience of remuner-ation policy.
A committee authorised to rule in urgent cases (presid-ing committee) was not set up in business year 2016.
Details of committee activity in business year 2016 are provided in the Supervisory Board report.
Co-determination by employees on the Supervisory Board Four employee representatives from the works council
established in February 2016 were appointed to the Su-pervisory Board. Although works council members are always numerically inferior owing to the one-third parity rule, their Supervisory Board activity affords them faster and fuller access to important information on happenings within the company and far-reaching corporate decisions such as restructuring, demergers and mergers. Moreover, it is standard business practice in Austria to seek una-nimity on major Supervisory Board resolutions.
Co-determination of shareholders As the new main shareholder of CA Immobilien Anla-
gen AG and owner of the four registered shares, IM-MOFINANZ utilised its right of appointment: with Dr. Oliver Schumy and Stefan Schönauer (CEO and CFO of IMMOFINANZ respectively), Professor Sven Bienert and Professor Hirschler, four of the nine shareholder repre-sentatives directly or indirectly represent a stakeholder with a holding in excess of 10% (C Rule no. 54).
The rights and obligations of the shareholders derive from the Stock Corporation Act and the Articles of Asso-ciation of CA Immo. The most important shareholder rights are the right of profit-sharing, the right to attend Ordinary General Meetings (with associated voting rights) and the right to demand additions to an agenda and submit motions to an Ordinary General Meeting. Given their voting rights, shareholders are entitled to vote not only on the appropriation of corporate profit, but also on the future direction of the company (for example by approving takeovers, capital measures or the actions

CORPORATE GOVERNANCE
26
of Management and Supervisory Board members). An-other right of shareholders is the right to information: shareholders have the right to be informed on all key matters affecting the joint stock company. Further infor-mation on the rights of shareholders as regards Ordinary General Meetings is published at www.caimmo.com.
One item was added to the agenda of the 29th Ordinary General Meeting in response to a supplementary motion properly submitted by former core shareholder Terim Limited; this item envisaged an amendment to point 21 of the Articles of Association, which concerns the legal majority requirement for resolutions passed by the Ordi-nary General Meeting. Terim Limited also proposed a res-olution regarding expansion of the Supervisory Board from seven to nine members, thereby putting forward the election of Dr. Florian Koschat and Torsten Hollstein. All resolutions proposed by Terim Limited were adopted with the legally required majority.
ADVANCEMENT OF WOMEN AT CA IMMO
CA Immo ensures equality and balance in the composi-tion of its employee structure, both across the workforce as a whole and at all managerial and executive levels. Aside from professional qualifications, the recruitment process adheres to a strict policy of non-discrimination between women and men. The proportion of women working for the Group stood at 55% in reporting year 2016 (57% in 2015).
Just one of the four employee representatives on the CA Immo Supervisory Board is female. In the wake of the resignation of Dr. Maria Doralt and Barbara A. Knoflach, none of the shareholder representatives is female; nor are there any women on the Management Board of CA Immo.
Year on year, the proportion of female managers was un-changed at 30% on the key date. In filling managerial va-cancies, the focus is on internal succession planning and raising the proportion of women by deliberately targeting women in the recruitment process. Where qualification backgrounds are equivalent, preference is given to female applicants. Part-time employment does not preclude a managerial position. With the introduction of flexible part-time working models, the proportion of female man-agers employed part-time is approaching 9%.
To raise the proportion of women in managerial posi-tions still further, CA Immo is trialling ‘shared leader-ship’; in a pilot project in future one department will be led by management teams comprising one woman and one man. To support this initiative, the new leadership
team will be offered training and advisory measures, both internally and externally. Graduate and talent manage-ment programmes will also aim to raise the proportion of women steadily. In 2016, women made up 43% of at-tendees on management training courses.
CA Immo makes it possible to reconcile professional and family life by offering flexible working hours, part-time options, working from home, paternity leave and ‘baby months’. Employees on a leave of absence remain linked to the internal information network and are in-vited to participate in annual team meetings and com-pany events. CA Immo also takes part in the ‘berufund-familie’ initiative; the company is particularly keen to learn from other organisations and implement new ideas wherever possible. In the area of occupational health, CA Immo offers employees everything from first aid and medical check-ups to advice on crisis and conflict situa-tions, therapy and leisure and relaxation activities.
RESPONSIBLE CORPORATE MANAGEMENT
For CA Immo, corporate governance is an all-embracing concept of responsible, transparent and value-based cor-porate leadership. The Management Board, Supervisory Board and managerial team ensure corporate governance is actively applied and continually developed across all departments. Alongside the Austrian Corporate Govern-ance Code and the specifications of the Initiative Corpo-rate Governance der deutschen Immobilienwirtschaft e.V. (ICG), good company management incorporates the standards of the internal monitoring system (IMS), risk management, compliance and, particularly, internal regu-lations on organisational and supervisory duties (alloca-tion of responsibilities).
CORPORATE GOVERNANCE
CO
RP
OR
AT
E G
OV
ER
NA
NC
E
27
COMPLIANCE
Compliance is a central component of good corporate management and the precondition for long-term success in business. For CA Immo, compliance is a risk manage-ment tool that establishes the framework for business ac-tivity. CA Immo’s compliance management system is based on the pillars of prevention, identification, com-munication and intervention. Our compliance strategy aims to establish integrity as a firm part of corporate cul-ture. That involves observing legislation and internal reg-ulations while respecting fundamental ethical values and doing business in a sustainable manner. For CA Immo, integrity is the basis of good business. The code of con-duct of the CA Immo Group is published at www.caimmo.com; it is binding on all executive bodies, employees and contractual partners, including architects, construction firms, estate agents, other service providers involved in lettings and joint venture partners. In partic-ular, the code sets out regulations on conformity with the law, dealings with business partners and third parties, handling company equipment and confidential infor-mation, avoiding conflicts of interest and so on. It also contains information on dealing with complaints, viola-tions of the code of conduct and other provisions binding on CA Immo.
Our values are shared and consistently practised by all employees. To this end, we continually seek to upgrade our training concepts, incorporate compliance into our business processes and tailor communication to target groups. However, compliance also means promoting en-trepreneurial risk-taking by creating a clear framework for calculable business risks and establishing a culture of dealing with mistakes. Breaches of legal provisions and internal regulations are nonetheless incompatible with the law and our understanding of compliance, and appro-priate sanctions will be taken in such cases.
The Compliance division works closely with the Risk Management and Internal Auditing departments to per-form an advisory, coordinating and consolidating role; it reports directly to the full Management Board and the Supervisory Board. Responsibility for the content of com-pliance rests with the various Group divisional heads. CA Immo’s Compliance Officer coordinates the compli-ance management system, develops the compliance pro-gramme, compiles and advises on guidelines, accepts comments and complaints (anonymously or otherwise) and oversees the resolution of compliance issues. Moreo-ver, employees regularly undergo training on preventing corruption, capital market compliance and other subjects.
A compliance steering committee was also set up, com-prising the Chief Financial Officer, heads of the Group’s Compliance, Internal Auditing and Risk Management di-visions and one employee from the operational area (pro-ject development). In particular, the committee is respon-sible for monitoring observance of the code of conduct, identifying typical compliance risks within the sector and assessing the effectiveness of agreed compliance measures.
In business year 2016, compliance activity focused on the implementation of European regulations on market abuse. CA Immo’s compliance guidelines were compre-hensively revised and the Management Board, Supervi-sory Board and workforce were notified accordingly. Fur-ther training sessions on capital market compliance are planned for business year 2017. Managerial staff and em-ployees in sensitive areas are also obliged to undergo web-based training at least bi-annually with a view to fa-cilitating the resolution of conflict situations in the work-place according to the values of CA Immo through the ap-plication of practical examples from the real estate area (dealing with authorities, construction companies, ten-ants, etc.). In the last business year, training on points of liability, internal processes and guidelines was offered on request to new members of the Management and Supervi-sory Boards.
Preventing corruption CA Immo rejects every kind of corruption and to this
end has defined compulsory principles (zero tolerance). Counter-corruption measures are reported to the Supervi-sory Board at least once a year. Instances of potential cor-ruption are investigated according to the auditing plan approved by the audit committee or by the Internal Au-diting division based on special audit mandates issued by the Management Board in close cooperation with the Compliance Officer. All operational Group companies are investigated for corruption risks at regular intervals.

CORPORATE GOVERNANCE
28
AUDITING COMPANY SERVICES AND FEES
By resolution of the Ordinary General Meeting, KPMG Austria GmbH Wirtschaftsprüfungs- und Steuerbera-tungsgesellschaft was appointed to audit the annual and consolidated financial statements for business year 2016. In the case of foreign subsidiaries, local law firms of the KPMG network are generally charged with reviewing and auditing the semi-annual and annual financial statements and with overseeing the conversion to IFRS. Auditing charges paid to the Group auditor totalled € 384 K in the last business year (against € 433 K in 2015); expenditure
on project-related and other advisory and assurance ser-vices (non-audit services) was € 187 K in the reporting period (€ 273 K in 2015). In the course of the issue of two corporate bonds (one in 2015) additional € 203 K (2015: € 90 K) for other review services were paid to the auditor in 2016. In the consolidated income statement, the audit expenses, including review amount to € 1,182 K (2015: € 1,356 K). Out of this, the amount for KPMG entities amounts to € 1,142 K (31.12.2015: € 1,335 K). No consult-ing services which could compromise independence were rendered by the Group auditor.

CORPORATE GOVERNANCE
CO
RP
OR
AT
E G
OV
ER
NA
NC
E
29
The remuneration report draws together the principles on which remuneration for the Management Board and Supervisory Board of CA Immo is defined, clarifies the level and structure of Management and Supervisory Board earnings and contains details of share ownership by members of the Management and Supervisory Boards.
GENERAL PRINCIPLES OF THE REMUNERATION SYSTEM FOR THE MANAGEMENT BOARD
On the basis of preparatory work undertaken by the re-muneration and nomination committee, the Supervisory Board is responsible for determining remuneration for in-dividual Management Board members. Management Board remuneration comprises a fixed, non-performance-related annual salary, performance-related (variable) components, fringe benefits and a pension fund. The cri-teria for the appropriateness of Management Board remu-neration are the field of activity and responsibility, per-sonal performance, the economic situation, the com-pany’s success/future prospects and the national and in-ternational standards for the property sector. The variable salary components are linked to a long-term increase in the value of the company and continually adjusted in line with strategic targets defined jointly by the Manage-ment Board and Supervisory Board. There are no stock option plans.
Fixed salaries and fringe benefits The level of fixed salaries depends on spheres of com-
petence as determined in the schedule of responsibilities. To avoid conflicts of interest, secondary employment for Management Board members requires the approval of the Supervisory Board. No separate payment is made for ac-cepting mandates in Group companies. The basic salary is paid in advance in 14 monthly payments as a non-per-formance-related component. Management Board mem-bers also receive fringe benefits in the form of remunera-tion in kind (company car, telephone, travel expenses) on the basis of individual regulations in employment con-tracts. Since they qualify as remuneration components, Management Board members must pay tax on these bene-fits.
Variable remuneration components Performance-related pay is divided into three compo-
nents and comprises an annual bonus (short term incen-tive) and a medium-term (mid term incentive) along with long-term variable remuneration (long term incentive); it is limited to 200% of the annual salary. The bonus pay-ment is linked to long-term operational and quality-based
targets and also takes account of non-financial perfor-mance criteria. Of the variable remuneration, 50% is linked to the attainment of short-term targets defined an-nually (annual bonus); the other half of the performance-related components depends on the exceeding of annu-ally defined indicators such as return on equity (ROE), funds from operations (FFO) and NAV growth. The level of the bonus actually paid depends on the degree of tar-get attainment: the values agreed and actually achieved at the end of each business year are compared before being confirmed by the remuneration committee. Half of perfor-mance-related remuneration takes the form of immediate payments (short term incentive); the remaining 50% is converted into phantom shares on the basis of the aver-age rate for the last quarter of the business year relevant to target attainment. The payment of phantom shares is made in cash in three parts after 12 months, 24 months (mid term incentive) and 36 months (long term incen-tive) at the average rate for the last quarter of the payment year.
PROFIT SHARING SCHEME FOR EMPLOYEES
To promote strong identification with its objectives and ensure employees have a stake in the success of CA Immo, variable remuneration is paid to all staff along-side fixed salaries. In line with the Management Board remuneration system, the precondition is the attainment of budgeted quantitative and qualitative annual targets and positive consolidated net income. Executive bonuses are also linked to the attainment of specific operational annual targets. Managerial staff have the additional op-tion of participating in a long term incentive programme.
Long term incentive programme (‘LTI’) Within the remuneration system for the Management
Board, the LTI programme was dissolved in 2015 and re-placed by phantom shares as described above. The LTI programme remains effective for managerial staff: LTI is a revolving programme with a term (retention period) of three years per tranche; it presupposes a personal invest-ment (maximum of 35% of the fixed annual salary). The personal investment is evaluated according to the closing rate as at 31 December of the preceding year, and the number of associated shares is determined on the basis of that evaluation. At the end of each three-year perfor-mance period, a target/actual comparison is applied to define target attainment. The LTI programme takes ac-count of value creation of CA Immo over the medium to long term. The critical factor is the value generated within the Group in terms of NAV growth, TSR (total
REMUNERATION REPORT

CORPORATE GOVERNANCE
30
shareholder return) and growth of FFO (funds from oper-ations). The weighting for NAV and FFO growth is 30%, and 40% for the TSR. Payments are made in cash. At the end of 2015, the degree of target attainment for the third LTI tranche for 2013-2015 was 100%, equivalent to a monetary value of € 17.08 per share in the LTI pro-gramme. On the basis of these calculations, a total amount of € 892 K was paid out in 2016 for 53,268 partic-ipating shares. As at 31 December 2016, provisions total-ling € 1,235 K (including incidental charges; € 1,835 K on 31.12.2015) had been formed in connection with the LTI programme for the tranches beginning in 2014, 2015 and 2016; of this, the Management Board accounted for € 143 K (€ 206 K in the previous year).
Pension regulations Members of the Management Board have pension fund
agreements into which the company pays annually agreed contributions (approximately 10% of the fixed sal-ary). The company has no further obligations. During business year 2016, contributions to pension funds for Management Board members (defined contribution plan) totalled € 124 K (€ 60 K in 2015).
Regulations governing the premature termination of employment contracts Both Management Board contracts contain a change of
control clause assuring payments in the event of prema-ture termination of Management Board duties following a change of control. A change of control occurs either where a shareholder or group of shareholders attains 25% of voting rights in the Ordinary General Meeting, or they are obliged to make a mandatory takeover bid where the investment threshold of 30% is exceeded, or a corpo-rate merger takes place. A merger constitutes a change of control. The contractual regulations provide for extraor-dinary termination rights as well as continued remunera-tion (including variable remuneration) for the remaining term of the employment contract.
Claims where an employment contact is terminated Where a Management Board member steps down, the
amount of the severance payment shall be determined by the legal provisions (criteria being the total salary level and length of service) with the maximum payout equat-ing to one full year’s salary. Payment is forfeited in the event of the employee serving notice of termination. All
contracts with Management Board members continue to include adjustment payments to cover dismissal for good cause; depending on the remaining term of the Manage-ment Board mandate, this is limited to a maximum of two annual salaries (including fringe benefits).
Payments to form a reserve for severance payment claims (defined benefit plan) amounted to € 84 K in the last business year (compared to € 65 K in 2015). As at the balance sheet date 31 December 2016, severance payment provisions totalled € 84 K (€ 189 K on 31.12.2015).
Payments have been made to former members of the Management Board as follows. Following early termina-tion of his Management Board contact, Dr. Florian Nowotny received a severance payment of € 2,441 K in business year 2016; appropriate provision was made on the balance sheet date for payment of an additional €150 K on 31 March 2017. The salary-based deductions for this severance payment amounted to € 169 K in 2016. Dr. Bruno Ettenauer received a severance payment of € 2,490 K in 2015; another € 150 K was payable as at 30 June 2016, with this amount reflected in the consolidated financial statements for 2015. A total of € 193 K was paid to former Management Board members from maturity of the LTI tranche 2013-2015 (previous year: € 320 K for the LTI tranche for 2012-2014). There are no further obliga-tions.
PAYMENTS TO THE MANAGEMENT BOARD IN 2016
In business year 2016, total salary payments to active Management Board members stood at € 1,347 K (€ 1,485 K in 2015). Management Board remuneration contains € 203 K (€ 545 K in 2015) in short term incen-tives and € 106 K from the LTI tranche for 2013-2015 (2015: € 175 K for the LTI tranche for 2012-2014). Fixed salary components made up 77% of Management Board remuneration (52% in 2015), with variable salary compo-nents accounting for 23% (48% in 2015). Provisions of € 932 K (including incidental charges) were allocated at Management Board level for variable salary components payable in 2017 on the basis of targets agreed in business year 2016 (€ 467 K in the previous year).
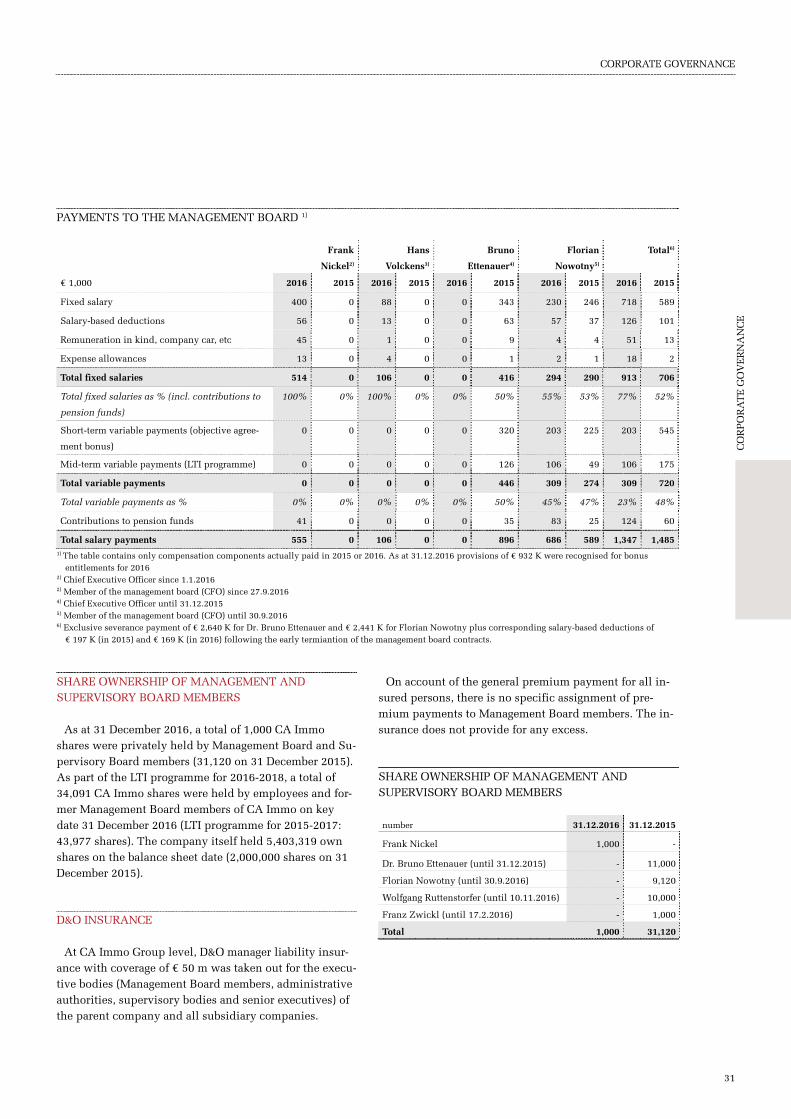
CORPORATE GOVERNANCE
CO
RP
OR
AT
E G
OV
ER
NA
NC
E
31
PAYMENTS TO THE MANAGEMENT BOARD 1)
Frank
Nickel2)
Hans
Volckens3)
Bruno
Ettenauer4)
Florian
Nowotny5)
Total6)
€ 1,000 2016 2015 2016 2015 2016 2015 2016 2015 2016 2015
Fixed salary 400 0 88 0 0 343 230 246 718 589
Salary-based deductions 56 0 13 0 0 63 57 37 126 101
Remuneration in kind, company car, etc 45 0 1 0 0 9 4 4 51 13
Expense allowances 13 0 4 0 0 1 2 1 18 2
Total fixed salaries 514 0 106 0 0 416 294 290 913 706
Total fixed salaries as % (incl. contributions to
pension funds)
100% 0% 100% 0% 0% 50% 55% 53% 77% 52%
Short-term variable payments (objective agree-
ment bonus)
0 0 0 0 0 320 203 225 203 545
Mid-term variable payments (LTI programme) 0 0 0 0 0 126 106 49 106 175
Total variable payments 0 0 0 0 0 446 309 274 309 720
Total variable payments as % 0% 0% 0% 0% 0% 50% 45% 47% 23% 48%
Contributions to pension funds 41 0 0 0 0 35 83 25 124 60
Total salary payments 555 0 106 0 0 896 686 589 1,347 1,4851) The table contains only compensation components actually paid in 2015 or 2016. As at 31.12.2016 provisions of € 932 K were recognised for bonus
entitlements for 2016
2) Chief Executive Officer since 1.1.2016 2) Member of the management board (CFO) since 27.9.2016 4) Chief Executive Officer until 31.12.2015 5) Member of the management board (CFO) until 30.9.2016 6) Exclusive severance payment of € 2,640 K for Dr. Bruno Ettenauer and € 2,441 K for Florian Nowotny plus corresponding salary-based deductions of
€ 197 K (in 2015) and € 169 K (in 2016) following the early termiantion of the management board contracts.
SHARE OWNERSHIP OF MANAGEMENT AND SUPERVISORY BOARD MEMBERS
As at 31 December 2016, a total of 1,000 CA Immo shares were privately held by Management Board and Su-pervisory Board members (31,120 on 31 December 2015). As part of the LTI programme for 2016-2018, a total of 34,091 CA Immo shares were held by employees and for-mer Management Board members of CA Immo on key date 31 December 2016 (LTI programme for 2015-2017: 43,977 shares). The company itself held 5,403,319 own shares on the balance sheet date (2,000,000 shares on 31 December 2015).
D&O INSURANCE
At CA Immo Group level, D&O manager liability insur-ance with coverage of € 50 m was taken out for the execu-tive bodies (Management Board members, administrative authorities, supervisory bodies and senior executives) of the parent company and all subsidiary companies.
On account of the general premium payment for all in-sured persons, there is no specific assignment of pre-mium payments to Management Board members. The in-surance does not provide for any excess.
SHARE OWNERSHIP OF MANAGEMENT AND SUPERVISORY BOARD MEMBERS
number 31.12.2016 31.12.2015
Frank Nickel 1,000 -
Dr. Bruno Ettenauer (until 31.12.2015) - 11,000
Florian Nowotny (until 30.9.2016) - 9,120
Wolfgang Ruttenstorfer (until 10.11.2016) - 10,000
Franz Zwickl (until 17.2.2016) - 1,000
Total 1,000 31,120

CORPORATE GOVERNANCE
32
REMUNERATION OF THE SUPERVISORY BOARD
In line with the Articles of Association of CA Immo, re-muneration for the Supervisory Board for the past busi-ness year is determined annually by the Ordinary General Meeting. For business year 2015, the 29th Ordinary Gen-eral Meeting held on 3 May 2016 adopted a fixed fee of € 25 K per Supervisory Board member alongside the re-imbursement of cash expenses. The chairman receives double that amount, with the deputy chairman paid one and a half times the fixed fee. In addition, committee and Supervisory Board members received an attendance fee of € 1,000 per meeting day. Remuneration is paid pro rata where a Supervisory Board member steps down during the year.
In business year 2016, fixed salaries for business year 2015 of approximately € 306 K (previous year: € 198 K; figure includes total attendance fees of € 85 K against € 19 K in the previous year) were paid to members of the Supervisory Board. In addition, expenses of € 242 K (€ 215 K in 2015) were recogniced in connection with the
Supervisory Board out of which cash outlays for travel expenses represented € 47 K (2015: € 13 K), legal and other consultancy services for the Supervisory Board ac-counted for € 194 K (€0 in 2015) and other expenditure represented € 1 K (2015: € 4 K). No other fees (particu-larly for consultancy or brokerage activities) were paid to Supervisory Board members.
Total Supervisory Board remuneration of € 396 K for business year 2016 will be proposed to the Ordinary Gen-eral Meeting on the basis of the same criteria (fixed an-nual payment of € 25 K per Supervisory Board member plus attendance fee of € 1,000 per meeting day). A provi-sion of the same amount was formed as at 31 December 2016. The increase on the previous year was the result of the expansion of the Supervisory Board.
No loans or advances were paid to either Management Board or Supervisory Board members. No company pen-sion plans are provided for Supervisory Board members at CA Immo.
REMUNERATION OF THE SUPERVISORY BOARD1)
€ 1,000 2016 2015
Torsten Hollstein, Chairman (since 3.5.2016) - -
Dr. Florian Koschat, Deputy Chairman (since 3.5.2016) - -
Dmitry Mints, Deputy Chairman (until 21.12.2016) 46 1
Helmut Bernkopf (until 28.10.2014) - 33
Prof. Dr. Sven Bienert (since 1.12.2016) - -
Dr. Maria Doralt (until 10.11.2016) 38 19
Timothy Fenwick (from 3.5.2016 to 30.11.2016) - -
Richard Gregson (since 28.4.2015) 24 -
Univ.-Prof. Dr. Klaus Hirschler (since 1.12.2016) - -
Waldemar Jud (until 8.5.2014) - 9
Barbara A. Knoflach (until 10.11.2016) 34 29
Reinhard Madlencnik (until 28.10.2014) - 23
John Nacos (since 28.4.2015) 25 -
Dr. Wolfgang Renner (from 3.5.2016 to 2.8.2016) - -
Marina Rudneva (from 3.5.2016 to 2.8.2016) - -
Dr. Wolfgang Ruttenstorfer (until 10.11.2016) 64 54
Stefan Schönauer (since 2.8.2016) - -
Dr. Oliver Schumy (since 2.8.2016) - -
Michael Stanton (since 19.12.2014) 38 1
Franz Zwickl (until 17.2.2016) 38 28
Total 306 198
1) Paid out for Supervisory Board mandates in the business year 2015 and 2014 respectively.

GROUP MANAGEMENT REPORT 2016
WARSAW TOWERSWarsaw

GROUP MANAGEMENT REPORT
34
The CA Immo Group is an internationally active real es-tate group. The parent company of the Group is CA Im-mobilien Anlagen Aktiengesellschaft, a listed company based in Vienna whose main activity is the strategic and operational management of subsidiary companies at home and abroad. The company has branch offices in Austria, Germany, Hungary, the Czech Republic, Roma-nia, Poland and Serbia; the Group also has offices in Cy-prus and Ukraine. Each site acts as a largely autonomous profit centre. Other subsidiaries (without separate local teams) are present in Bulgaria, Croatia, the Netherlands, Slovakia and Slovenia. As at key date 31 December 2016, the Group comprised 206 companies (31.12.2015: 214) with around 363 employees (31.12.2015: 357) in 16 coun-tries. The CA Immo Group’s core field of expertise in-volves developing and managing modern and spacious office properties in Central and Eastern Europe. In re-gional terms, the company focuses on Austria, Germany, Poland, Hungary, the Czech Republic, Slovakia and Ro-mania. Business activity in Germany is focused on Mu-nich, Frankfurt and Berlin; in other countries, the strate-gic emphasis is on the capital cities. Aside from office properties, the asset portfolio of the Group includes ho-tels, speciality retail outlets, shopping malls and a small proportion of residential and logistical properties. From the design and development of entire urban districts to the active management of investment properties, value is generated through a comprehensive value chain.
COMPANIES BY REGION
Number of companies1) 31.12.2016 31.12.2015
Austria 22 27
- of which joint ventures 1 1
Germany 101 95
- of which joint ventures 16 15
Eastern Europe2) 83 92
- of which joint ventures 8 8
Group-wide 206 214
- of which joint ventures 25 24 1) Joint ventures at property/project level 2) Includes holding companies in Cyprus and the Netherlands established
in connection with Eastern European investments
GROUP STRUCTURE
GROUP MANAGEMENT REPORT
GR
OU
P M
AN
AG
EM
EN
T R
EP
OR
T
35
Austria The company’s domestic properties are overseen in di-
rect subsidiaries of CA Immobilien Anlagen AG. As at 31 December 2016, the parent company also directly held property assets of approximately € 255.8 m (€ 278.2 m on 31.12.2015). As at 31 December 2016, the total Austrian portfolio comprised investment properties with a market value of € 547.0 m (€ 587,6 m on 31.12.2015) along with three development projects.
Germany The operational platform for all Group activities in Ger-
many is CA Immo Deutschland GmbH. As a former col-lecting society for state-owned railway properties in Ger-many, the company has a wealth of expertise in develop-ing inner city real estate. With subsidiaries in Frankfurt, Berlin and Munich, an appropriate local profile is as-sured. Aside from investment properties, the company’s property assets mainly comprise properties under con-struction and undeveloped plots alongside a portfolio of properties intended for trading or sale. Investment prop-erties are largely held in direct holdings and let and man-aged by DRG Deutsche Realitäten GmbH, a joint venture
set up with the Austrian estate agent and property man-agement firm ÖRAG. Construction management – which encompasses construction management, project manage-ment and construction supervision – is carried out by CA Immo’s German subsidiary omniCon, which also per-forms these services for third parties.
Eastern Europe In Eastern Europe, the focus is also on commercial class
A buildings in regional capitals. The Group’s portfolio of investment properties in Eastern Europe, along with a small proportion of development projects and undevel-oped plots, is directly held via CA Immo participating in-terests and via Europolis GmbH, another wholly owned subsidiary of CA Immo acquired from the Volksbank Group early in 2011. On the balance sheet date there was also a partnership with Union Invest overseeing a sub-portfolio comprising two investment properties. The share of Union Invest (49%) was acquired by CA Immo in mid-January 2017. All properties in Eastern Europe are managed by regional companies in Prague, Budapest, Warsaw, Bucharest and Belgrade under the name CA Immo Real Estate Management.

GROUP MANAGEMENT REPORT
36
THE ECONOMIC TREND1)
In 2016 the global economy and Europe in particular had to cope with numerous challenges including geopo-litical tensions, terrorist attacks, stressed banking sectors, UK’s vote to leave the European Union. That notwith-standing, the European economy has shown resilience and delivered economic growth as well as strong dynam-ics regarding the creation of new jobs. GDP growth picked up towards the end of 2016 and is expected to maintain its momentum into 2017. European economies enjoyed a number of favourable factors, such as the low oil price, a depreciating euro (especially againstthe US dollar) and in particular accommodative monetary poli-cies. According to the European Commission, private consumption has been the main growth driver in Europe while investment continued to be subdued, which “casts a shadow of doubt over the sustainability of the recovery and the economy’s potential growth”.
Stockmarkets showed strong performances across the world in 2016. The DAX rose 7% and the ATX by 9% over the 12 months. The S&P 500 gained 9% and the Dow Jones increased by 12% over the the same period. Russia’s RTS index soared after the US election and gained 28% in 2016, while China’s Shanghai Composite ended 10% lower.
REVIEW OF THE CA IMMO CORE MARKETS IN 20162)
Growth in the eurozone amounted to 1.7% in 2016, with the EU as a whole achieving 1.9%. The unemploy-ment rate (seasonally adjusted) for the euro area was 9.6% (down from 10.4% in January 2016) and 8.1% (down from 8.9% in January 2016) for the EU as a whole in January 2017, which is the lowest rate since January 2009. The government debt to GDP ratio stood at 91.2% at the end of the third quarter 2016 (83.3% in the EU28). Annual inflation picked up in the fourth quarter of 2016 and is expected to be 2.0% in February 2017.
The economy of Austria continues to grow with real GDP rising by 1.5% in 2016. The inflation rate in Austria stood at 1.0% in 2016 and is expected to increase to 1.8% in 2017. The current unemployment rate is reported at 5.7%.
The German economy continued its robust growth path and expanded by 1.9% in 2016. In EU comparison, Ger-many and the Czech Republic reported the lowest unem-ployment rates at just 3.8% and 3.4%, respectively, ac-cording to the most recent publication by Eurostat. The inflation rate in Germany remained on a low level throughout 2016 at 0.4%.
ECONOMIC DATA FOR CA IMMO CORE MARKETS
Growth rate of real GDP 1) Annual inflation rates 2)
Rate of unemployment 3)
Public budget balance
Gross public debt
Current account balance
2016 2017 in % in % as % of GDP 2016
as % of GDP 2016
as % of GDP 2016
EU –28 1.9 1.8 1.7 8.1 -1.9 85.1 2.1
Euro zone –19 1.7 1.6 1.8 9.6 -1.7 91.5 3.6
AT 1.5 1.6 2.1 5.7 -1.4 83.5 2.4
GER 1.9 1.6 1.9 3.8 0.6 68.2 8.7
PL 2.8 3.2 1.4 5.4 -2.3 53.6 0.2
CZ 2.4 2.6 2.3 3.4 0.3 37.8 -0.2
HU 1.9 3.5 2.4 4.3 -1.8 73.5 5.4
RO 4.9 4.4 0.3 5.4 -2.8 39.1 -2.2
Source: European Commission, Eurostat, Bloomberg 1) Forecast, change versus prior year (in %); 2) by January 2017; 3) by January 2017 (seasonally adjusted)
1) European Commission, Bloomberg, Financial Times, The Economist 2) Eurostat, European Commission, Bloomberg
ECONOMIC ENVIRONMENT

GROUP MANAGEMENT REPORT
GR
OU
P M
AN
AG
EM
EN
T R
EP
OR
T
37
As in preceding quarters, the core CA Immo markets in the CEE region displayed positive growth trends, alt-hough the pace of growth has slowed somewhat (with the exception of Romania).
Hungary was the laggard among the CEE core markets in terms of GDP growth at 1.9% in 2016. The economy of Romania continued to perform extraordinarily well in 2016, recording GDP growth of 4.9%. Gross domestic product in Poland grew to 2.8% in 2016 and Czechia ex-panded by 2.4% over the same period. The unemploy-ment rate in the CEE nations is below the EU 28 and euro zone average; it stands at 3.4% in Czechia, 4.3% in Hun-gary and 5.4% in Poland and Romania.
The inflation rates in most CEE countries were negative and remained below the respective targets in 2015 mainly due to the continual fall in oil prices. 2016 partly showed a turnaround into positive territory. Czechia re-ported an inflation rate of 0.6% for 2016, while the infla-tion rate in Romania produced an annual value of –1.1%. The inflation rate in Poland stood at –0.2%, Hungary yielded an annual inflation of 0.4%.
THE MONEY MARKET AND INTEREST ENVIRONMENT 1)
Monetary policy continued to be highly expansive in 2016 and was characterised by the continuance of histori-cally low interest rates. In March 2016, the European Central Bank (ECB) under Mario Draghi announced a package of measures that exceeded market expectations. The policy of quantitative easing was extended with a further reduction in the deposit rate to –0.4%. Starting in April, € 80 bn (up from the previous level of € 60 bn) were invested in the purchase programme for govern-ment bonds and other securities. The programme was ex-tended at least to the end of March 2017 in December. In a recent response to criticism about the policy in Ger-many, the ECB said that it is still not the time to start ta-pering the stimulus programme.
The European Central Bank (ECB) has maintained its in-terest rates at record lows at its January 2017 policy meet-ing. The marginal refinancing rate stands at 0.0%, while the marginal lending rate stands slight above at 0.25%. The interest rate on deposit facilities (deposit rate) for the euro zone stands at –0.4%. The rate remained negative
1) Sources: Eurostat, Central Statistical Offices, Bloomberg 2) Sources: European Commission Winter 2017 Economic Forecast, Bloomberg, Financial Times, The Economist
during the whole year to make lending more attractive to banks.
The 3 month Euribor rate remained in negative terri-tory, fluctuating between –0.13% and –0.32% in the pe-riod under review. As a result of the expansive policy of the European Central Bank (ECB), yields on government bonds from eurozone countries and corporate bonds with good credit ratings remain at historic lows. The 10-year German federal bond produced a negative yield for the first time in the second quarter of 2016. Corporate bonds with a negative yield of –0.05% were issued for the first time in quarter three of 2016.
Following the presidential election in the USA in No-vember 2016, the mood brightened on international capi-tal markets after an initially negative reaction. The infra-structure investment and tax cuts signalled have prompted many investors to factor in higher expectations of growth and inflation and, by extension, interest rates. Yields on 10-year US Treasury bonds and other govern-ment bonds, and especially those in emerging nations and the eurozone, have posted the biggest gains since the financial crisis in some instances. On a different note, re-newed concerns about the future of the euro zone pushed the spread of French, Greek and Italian bonds over that of German bunds to recent highs.
OUTLOOK 2)
The European Commission raised its growth forecast for the euro zone slightly to 1.6% in 2017 and 1.8% in 2018. At the same time, it pointed to “exceptional risks” sur-rounding its forecast, such as the start of “Brexit” negoti-ations between Britain and the European Union and “to be clarified” intentions of the new administration of the United States in key policy areas. The unemployment rate in the euro area is expected to decline further, from 10.0% in 2016 to 9.6% in 2017.
Euro zone inflation has reached its highest level in four years (above the targeted ECB rate) in February 2017 dri-ven by rising energy costs, which might intensify the dis-cussion on whether the bank should reduce its stimula-tive monetary policy. Annual inflation up to 2.5% in the US in January 2017 (up from 2.1% in December) might lead to another interest rate hike in March and conse-quently to a policy turnaround of the Federal Reserve’s towards a more aggressive monetary tightening path.
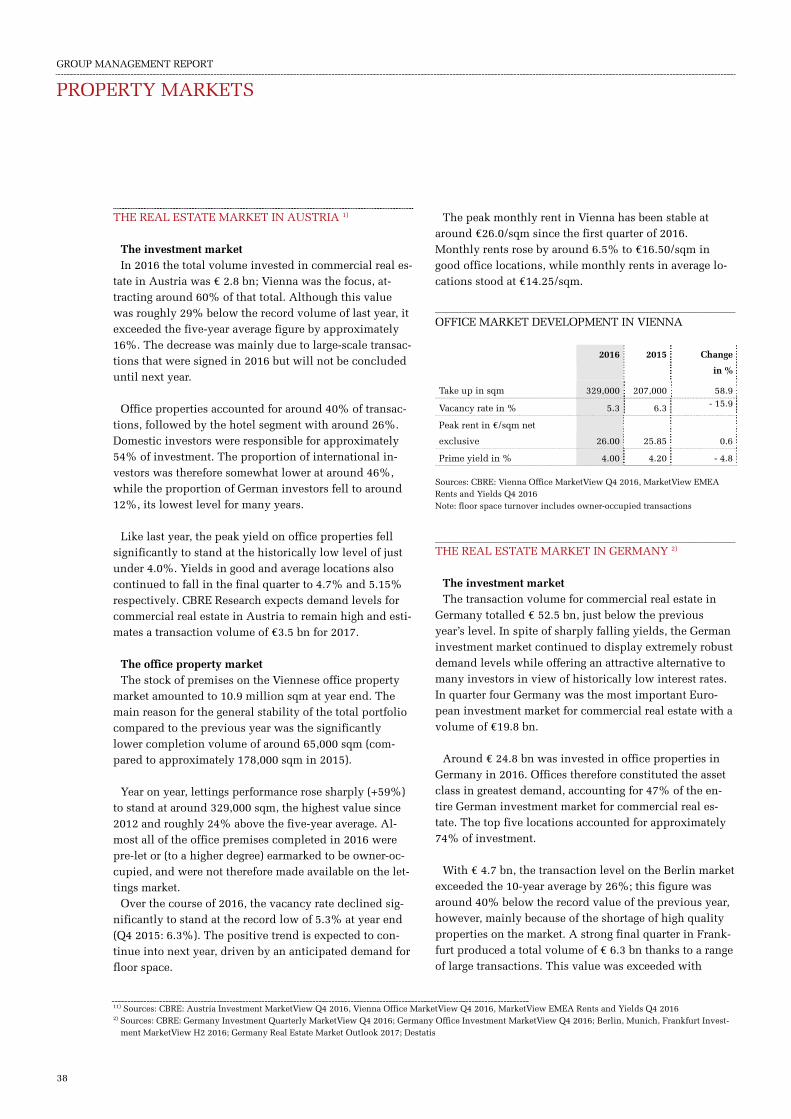
GROUP MANAGEMENT REPORT
38
THE REAL ESTATE MARKET IN AUSTRIA 1)
The investment market In 2016 the total volume invested in commercial real es-
tate in Austria was € 2.8 bn; Vienna was the focus, at-tracting around 60% of that total. Although this value was roughly 29% below the record volume of last year, it exceeded the five-year average figure by approximately 16%. The decrease was mainly due to large-scale transac-tions that were signed in 2016 but will not be concluded until next year.
Office properties accounted for around 40% of transac-tions, followed by the hotel segment with around 26%. Domestic investors were responsible for approximately 54% of investment. The proportion of international in-vestors was therefore somewhat lower at around 46%, while the proportion of German investors fell to around 12%, its lowest level for many years.
Like last year, the peak yield on office properties fell significantly to stand at the historically low level of just under 4.0%. Yields in good and average locations also continued to fall in the final quarter to 4.7% and 5.15% respectively. CBRE Research expects demand levels for commercial real estate in Austria to remain high and esti-mates a transaction volume of €3.5 bn for 2017.
The office property market The stock of premises on the Viennese office property
market amounted to 10.9 million sqm at year end. The main reason for the general stability of the total portfolio compared to the previous year was the significantly lower completion volume of around 65,000 sqm (com-pared to approximately 178,000 sqm in 2015).
Year on year, lettings performance rose sharply (+59%)
to stand at around 329,000 sqm, the highest value since 2012 and roughly 24% above the five-year average. Al-most all of the office premises completed in 2016 were pre-let or (to a higher degree) earmarked to be owner-oc-cupied, and were not therefore made available on the let-tings market.
Over the course of 2016, the vacancy rate declined sig-nificantly to stand at the record low of 5.3% at year end (Q4 2015: 6.3%). The positive trend is expected to con-tinue into next year, driven by an anticipated demand for floor space.
11) Sources: CBRE: Austria Investment MarketView Q4 2016, Vienna Office MarketView Q4 2016, MarketView EMEA Rents and Yields Q4 2016 2) Sources: CBRE: Germany Investment Quarterly MarketView Q4 2016; Germany Office Investment MarketView Q4 2016; Berlin, Munich, Frankfurt Invest-
ment MarketView H2 2016; Germany Real Estate Market Outlook 2017; Destatis
The peak monthly rent in Vienna has been stable at around €26.0/sqm since the first quarter of 2016. Monthly rents rose by around 6.5% to €16.50/sqm in good office locations, while monthly rents in average lo-cations stood at €14.25/sqm.
OFFICE MARKET DEVELOPMENT IN VIENNA
2016 2015 Change
in %
Take up in sqm 329,000 207,000 58.9
Vacancy rate in % 5.3 6.3 - 15.9
Peak rent in €/sqm net
exclusive 26.00 25.85 0.6
Prime yield in % 4.00 4.20 - 4.8
Sources: CBRE: Vienna Office MarketView Q4 2016, MarketView EMEA Rents and Yields Q4 2016 Note: floor space turnover includes owner-occupied transactions
THE REAL ESTATE MARKET IN GERMANY 2)
The investment market The transaction volume for commercial real estate in
Germany totalled € 52.5 bn, just below the previous year’s level. In spite of sharply falling yields, the German investment market continued to display extremely robust demand levels while offering an attractive alternative to many investors in view of historically low interest rates. In quarter four Germany was the most important Euro-pean investment market for commercial real estate with a volume of €19.8 bn.
Around € 24.8 bn was invested in office properties in
Germany in 2016. Offices therefore constituted the asset class in greatest demand, accounting for 47% of the en-tire German investment market for commercial real es-tate. The top five locations accounted for approximately 74% of investment.
With € 4.7 bn, the transaction level on the Berlin market
exceeded the 10-year average by 26%; this figure was around 40% below the record value of the previous year, however, mainly because of the shortage of high quality properties on the market. A strong final quarter in Frank-furt produced a total volume of € 6.3 bn thanks to a range of large transactions. This value was exceeded with
PROPERTY MARKETS

GROUP MANAGEMENT REPORT
GR
OU
P M
AN
AG
EM
EN
T R
EP
OR
T
39
€ 6.6 bn in Munich, where once again a very strong clos-ing quarter generated more than € 3 bn. Investment activ-ity in Munich was thus 50% above the five-year average. In both Frankfurt and Munich, the office area accounted for more than 80% of the investment volume.
Demand for office properties remains high in German
cities, with a rising proportion of foreign investors (>50% in 2016) playing key roles in large-volume transactions in particular. Owing to high demand for investment paired with a low level of supply, the peak yield in Munich fell to 3.20% year on year, 45 base points down since the end
of 2015. In the same period Berlin fell 60 base points to 3.40% in the prime office segment. The prime yield in Frankfurt stood at 4.00%, a decline of 10 base points.
The office property market 3)
The continuing upward trend in the German economy was reflected in GDP growth of 1.9% in 2016, the strong-est rate of growth in the last five years. The trend in the number of persons employed is positive, leading to a ris-ing demand for office space; given the shortage of floor space in many inner city areas, rental rates are rising.
OFFICE MARKET DEVELOPMENT IN CA IMMO CORE MARKETS IN GERMANY
2016 2015 Change in %
Berlin
Take up in sqm 888,300 881,800 0.7
Vacancy rate in % 4.9 6.4 - 23.4
Peak rent in €/sqm net exclusive 27.5 23.5 17.0
Prime yield in % 3.40 4.00 - 15.0
Frankfurt am Main
Take up in sqm 546,400 401,100 36.2
Vacancy rate in % 11.1 12.1 - 8.3
Peak rent in €/sqm net exclusive 39.5 39.5 0.0
Prime yield in % 4.00 4.40 - 9.1
Munich
Take up in sqm 789,400 758,700 4.0
Vacancy rate in % 4.1 4.9 - 16.3
Peak rent in €/sqm net exclusive 35.0 34.0 2.9
Prime yield in % 3.20 3.65 - 12.3
Sources: CBRE: Munich, Frankfurt, Berlin Office MarketView Q4 2016 Note: floor space turnover includes owner-occupied transactions
The lettings market in Munich performed very strongly once again in 2016. Floor space turnover totalled 789,400 sqm in 2016, approximately 4% above the previ-ous year’s value. Year on year, the continuing high de-mand brought about a 3% rise in the peak monthly rent to € 35.0/sqm, while the weighted monthly average rent was 3% below the previous year’s level at € 16.0. The of-fice vacancy rate currently stands at the historically low level of 4.1% (2015: 4.9%). Although the completion vol-ume of 156,000 sqm in 2016 is the lowest value for the last 10 years, this figure is expected to rise significantly in 2017 and 2018.
Office space take-up in Frankfurt stood at 546,400 sqm in 2016, a significant rise of 36% on the previous year
3 ) Sources: CBRE: Munich, Frankfurt, Berlin Office MarketView Q4 2016
and the highest value since 2007. The vacancy rate was 11.1% at year end, well below the 10-year average of 14.8%. Aside from rising demand for office space, the demolition and conversion of older office premises to other uses underpinned the positive trend. The peak monthly rent of € 39.50 was unchanged on the previous year. The weighted average market rent is € 19.09/sqm per month. The completion volume of around 179,000 sqm was just below the 10-year average. CBRE Research does not expect the supply of floor space in the top segment of the market to expand significantly in the years ahead.
GROUP MANAGEMENT REPORT
40
Office space take up for 2016 in Berlin was slightly up on the previous year and a new record value. The Ger-man capital therefore headed the field for another year in terms of lettings activity in the office sector. In yearly comparison, the vacancy rate fell by almost a quarter to its current level of 4.9%. The shortage of floor space led to a 17% increase in the peak monthly rent € 27.50/sqm, the strongest rate of growth among the top five locations in Germany. The weighted average rent also increased further to € 15.84/sqm per month. Although the comple-tion volume of 340,000 sqm increased significantly on previous years, it is struggling to keep pace with high de-mand.
THE REAL ESTATE MARKET IN EASTERN EUROPE 1)
The investment market Strong demand from investors for the real estate asset
class has also led to a significant rise in liquidity on property markets in Eastern Europe. The registered trans-action volume of € 12.6 bn – the highest recorded value – was some 42% above the previous year’s volume. In re-gional terms, Poland accounted for the largest volume (36%), followed by the Czech Republic (29%), Hungary (13%) and Romania (7%).
The volume of office transactions was approximately € 1.1 bn in Warsaw, with a registered peak yield of up to 5.25%. This trend is expected to continue in 2017 with the suppression of yields reaching up to 5.0%. The peak yield also fell sharply (to as much as 4.85%) in Prague. JLL Research anticipates a yield of 6.75% for prime office projects in Budapest and expects further suppression thanks to greatly improved market sentiment. The office segment accounted for roughly 47% of the overall trans-action volume of € 1.7 bn. The acquisition of Millennium Towers in Budapest by CA Immo was the largest single office transaction in the history of Hungary’s commercial property market. Romania reported an investment vol-ume of € 890 m, of which the capital Bucharest ac-counted for around 70% and the office sector was re-sponsible for 45%; a peak yield of 7.5% is indicated.
1) Sources: Jones Lang LaSalle: CEE Investment Pulse H2 2016 2) Sources: CBRE: Prague, Warsaw, Bucharest Office MarketView Q4 2016; JLL: Budapest City Report Q4 2016 / Q4 2015
The office property markets 2) Lettings continued to develop positively in 2016 in all
four of CA Immo’s core cities (Warsaw, Prague, Budapest and Bucharest), bringing about a decrease in vacancy rates in some cities over the course of the year.
By the end of 2016, total office space in Warsaw had ex-ceeded the 5.0 m sqm threshold as around 417,000 sqm of floor space was completed during the year. More than 60 projects were under construction at the time according to CBRE Research; around 54% of the associated floor space of 856,000 sqm was in a central location, with some 360,000 sqm of this scheduled for completion in 2017. Total floor space turnover in 2016 was 757,700 sqm, around 9% below the previous year’s value. The vacancy rate remained high, rising from 12.3% (2015) to 14.2%. The peak monthly rent has fallen stead-ily over recent quarters before stabilising at the current level of around € 23/sqm in the CBD.
By the end of 2016 some 412,000 sqm of office space had been let in Bucharest, an increase of 73% on the pre-vious year. Of the 294,000 sqm completed, 75% was pre-let. The stock of office space totalled 2.64 m sqm, a figure set to rise to over 3 m sqm over the next two years. In an-nual comparison, the vacancy rate had fallen slightly by year end to 11.7%. The peak monthly rent in Bucharest was stable at € 18.5/sqm.
Annual take-up in Budapest amounted to 467,100 sqm in 2016, a high level above the 10-year average but below last year's record number of 538,100 sqm. Around 96,000 sqm of new space was added to the market. The vacancy rate continued its decling trend since 2012 and stood at 9.5% at the end of the year (2015: 12.1%). The prime monthly rent is reported at € 22.0 / sqm.
A historically low completion volume of 33,400 sqm was reported for the office market in Prague in 2016; the stock of office space was also constant at 3.20 million sqm. Lettings performance totalled 414,400 sqm in 2016, of which 305,400 sqm was newly let – a new record value. The vacancy rate stands stable at 10.6%. Peak rents in the city centre stood at € 19.50/sqm per month.
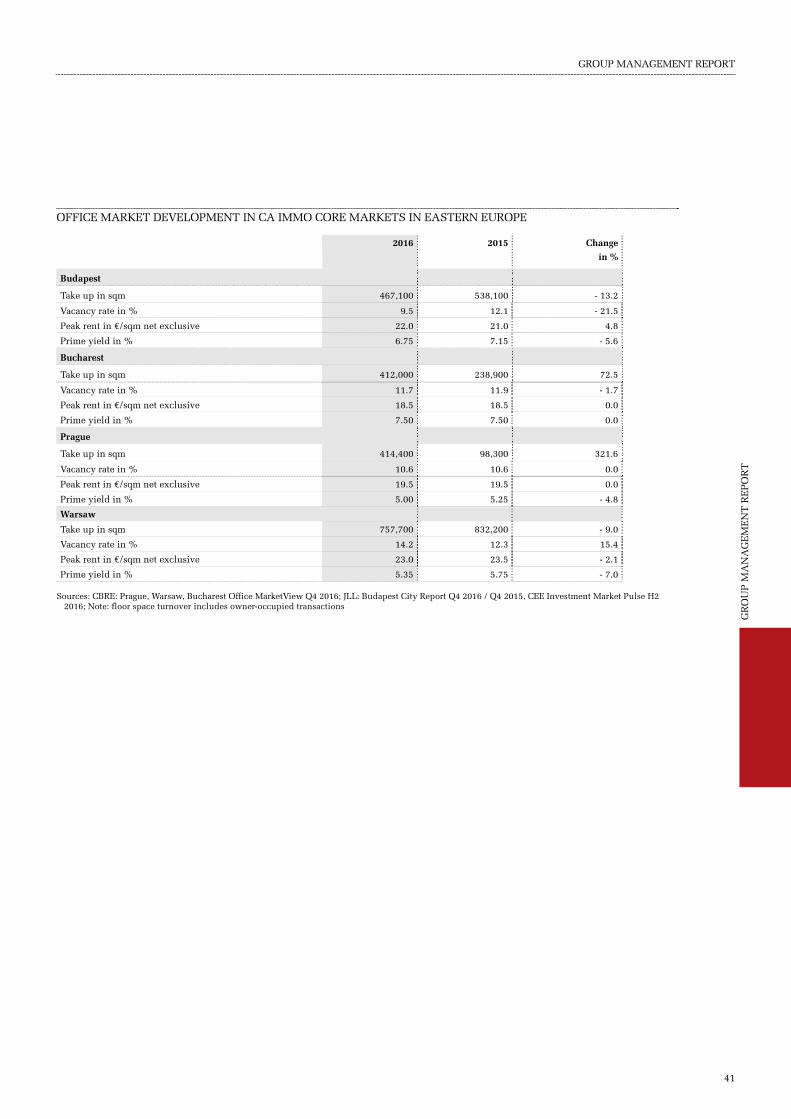
GROUP MANAGEMENT REPORT
GR
OU
P M
AN
AG
EM
EN
T R
EP
OR
T
41
OFFICE MARKET DEVELOPMENT IN CA IMMO CORE MARKETS IN EASTERN EUROPE
2016 2015 Change in %
Budapest
Take up in sqm 467,100 538,100 - 13.2
Vacancy rate in % 9.5 12.1 - 21.5
Peak rent in €/sqm net exclusive 22.0 21.0 4.8
Prime yield in % 6.75 7.15 - 5.6
Bucharest
Take up in sqm 412,000 238,900 72.5
Vacancy rate in % 11.7 11.9 - 1.7
Peak rent in €/sqm net exclusive 18.5 18.5 0.0
Prime yield in % 7.50 7.50 0.0
Prague
Take up in sqm 414,400 98,300 321.6
Vacancy rate in % 10.6 10.6 0.0
Peak rent in €/sqm net exclusive 19.5 19.5 0.0
Prime yield in % 5.00 5.25 - 4.8
Warsaw
Take up in sqm 757,700 832,200 - 9.0
Vacancy rate in % 14.2 12.3 15.4
Peak rent in €/sqm net exclusive 23.0 23.5 - 2.1
Prime yield in % 5.35 5.75 - 7.0
Sources: CBRE: Prague, Warsaw, Bucharest Office MarketView Q4 2016; JLL: Budapest City Report Q4 2016 / Q4 2015, CEE Investment Market Pulse H2 2016; Note: floor space turnover includes owner-occupied transactions

GROUP MANAGEMENT REPORT
42
The CA Immo Group divides its core activity into the business areas of letting investment properties and devel-oping real estate. In both of these business areas, CA Immo specialises in commercial real estate with a clear focus on office properties in capital cities in the cen-tre of Europe. The objective is to build up a focused port-folio of high quality and profitable investment properties within the core markets of Germany, Austria, Czechia, Po-land, Hungary and Romania. The company generates ad-ditional revenue through the utilisation of developed land reserves.
DISTRIBUTION OF BOOK VALUE PROPERTY ASSETS BY COUNTRY (Basis: € 3.8 bn)
€ 3.8 bn property assets As at key date, the property assets of CA Immo were ap-
proximately € 3.8 bn (2015: € 3.7 bn). Of this figure, in-vestment properties1) account for € 3.4 bn (88% of the to-tal portfolio) and property assets under development rep-resent € 0.4 bn (12% of total portfolio). Germany is the biggest regional segment with a proportion of 44% of total property assets.
PROPERTY ASSETS OF THE CA IMMO GROUP AS AT 31.12.2016 (PORTFOLIO VALUES)
in € m Investment properties 2) Investment properties
under development
Short-term
property assets 3)
Property assets Property assets
in %
full at
equity
∑ full at
equity
∑ full at
equity
∑ full at
equity
∑ full at
equity
∑
Austria 551 0 551 5 0 5 15 12 27 572 12 584 17 3 15
Germany 980 195 1,176 384 0 384 34 83 118 1,398 279 1,677 41 69 44
Czechia 206 30 236 14 0 14 0 0 0 220 30 250 6 7 6
Hungary 449 11 460 1 0 1 0 17 17 450 29 479 13 7 13
Poland 288 16 304 0 0 0 0 0 0 288 16 304 9 4 8
Romania 259 0 259 23 5 29 0 0 0 282 5 288 8 1 8
Others 196 37 233 6 0 6 0 0 0 202 37 239 6 9 6
Total 2,930 289 3,219 433 5 438 49 113 162 3,413 407 3,820 100 100 100
Share of total
portfolio 84% 12% 4% 100%
Full: Fully consolidated properties wholly owned by CA Immo At equity: Properties partially owned by CA Immo, consolidated at equity (pro-rata share) 2) Includes properties used for own purposes 3) Short-term property assets include properties intended for trading or sale
1) Includes short-term property assets
Poland 8%
Czechia
6%
Germany 44%
Austria 15%
Hungary
8%
Other
13%
Romania
6%
PROPERTY ASSETS

GROUP MANAGEMENT REPORT
GR
OU
P M
AN
AG
EM
EN
T R
EP
OR
T
43
Acquisitions In mid-September, CA Immo signed the acquisition of
the centrally located Millennium Towers office complex comprising 70,400 sqm in Budapest. The transaction was closed in the end of September. The transaction volume for the fully rented asset with an annual rental income of € 12 m amounts to € 172 m. With this acquisition, CA Immo expands its presence in the core market Hun-gary, where it currently holds the largest property portfo-lio following Germany and Austria.
Sales In business year 2016, the strategic policy of focusing on
large-scale, modern office properties in the portfolio was upheld across the Group. Accordingly, the majority of sales involved properties not classified as part of core business of CA Immo in regional or sectoral. Property as-sets (incl. assets held "at equity", where CA Immo holds a proportionate share) sold in 2016 generated total trading income of € 335.8 m and contributed € 37.6 m to the re-sult (compared to € 53.9 m in 2015). Major contributor to the result was the sale of the railway authority building in Stuttgart, including a 13,400 sqm plot. Trading income is reinvested in the development of office projects in Ger-many, amongst other things.
In October, CA Immo has concluded an agreement to sell the Šestka Shopping Center in Prague, covering more than 27,300 sqm of retail space. The transaction was closed in the end of October 2016.
Portfolio adjustments delivered sales proceeds through-out Austria. A number of smaller properties with various types of use as well as superaedificates were sold with a total transaction volume of about € 57.8 m. The profit of these transactions was around € 4.7 m.
The sale of building plots, which were mainly con-cluded in the course of urban district development pro-jects in German city centre locations, contributed a total of € 105.6 m to trading income or € 11.8 m to the result.
Investments In 2016, CA Immo invested a total of € 168.4 m (2015:
€ 140.5 m) in their property portfolio (investments and maintenance costs). Of this figure, € 45.6 m was ear-marked for modernisation and optimisation measures and € 122.8 m was devoted to the furtherance of development projects.
PROPERTY ASSETS BRIDGE 2015 TO 2016 AND KEY FIGURES 2016
Austria Germany Eastern Europe Total
Property assets 31.12.2015 € m 609.7 1,553.2 1,492.8 3,655.8
Acquisition of new properties € m 0.0 0.0 165.2 165.2
Capital expenditure € m 9.8 114.2 37.1 161.1
Change from revaluation/impairment/depreciation € m 5.8 173.5 – 17.5 161.9
Changes Lease incentive € m 0.1 2.6 – 1.4 1.3
Disposals € m – 41.7 – 166.4 – 121.0 – 329.0
other Changes € m 0.0 – 0.4 4.1 3.7
Property assets 31.12.2016 € m 583.8 1,676.8 1,559.3 3,819.9
Annual rental income1) € m 32.2 58.1 92.7 183.0
Annualised rental income € m 31.3 58.2 108.7 198.2
Economic vacancy rate for investment properties % 5.2 6.1 9.0 7.6
Gross yield (investment properties) % 5.6 4.9 7.2 6.1
1) Includes annual rental income from properties sold in 2016 (€ 5.4 m)

GROUP MANAGEMENT REPORT
44
Contributing around 88% of total property assets, the in-vestment property area is CA Immo's main source of in-come. The principle objective of the company is the con-tinual optimisation of its portfolio and the retention and acquisition of tenants with a view to securing stable and regular rental revenue. 60% of the rentable office sur-faces1) of CA Immo are certified in accordance with LEED, DGNB or BREEAM standard (see also the chapter Sustain-ability).
Investment properties: Office share enhanced to 88% As at key date 31 December 2016, the Group's asset port-
folio2) incorporated a total rentable effective area of 1.3 m sqm with an approximate book value of € 3.2 bn (com-pared to € 3.0 bn in 2015). With 46% of book value, the Eastern Europe segment accounts for the largest propor-tion of the asset portfolio. In 2016, CA Immo generated to-tal rental income of € 183.0 m (€ 187.8 m in 2015); the Eastern Europe segment accounted for roughly 51% of to-tal rental revenue. On the basis of annualised rental reve-nue, the asset portfolio produced a yield of 6.1%3) (6.3% in 2015). In line with the strategic portfolio focus, the office share in the total portfolio was further increa-sed from 85% (31.12.2015) to 88% as at the reporting date.
Occupancy rate increased to 92.4% The occupancy rate for the asset portfolio rose from
90.4%4) (31.12.2015) to 92.4%4) on 31 December 2016. In like-for-like comparisons of properties forming part of the portfolio as at 31 December 2015, the economic occu-pancy rate increased from 90.3% on that date to 92.0% on the balance sheet date for 2016.
DISTRIBUTION OF BOOK VALUE INVESTMENT PROPERTIES BY MAIN USAGE (BASIS: € 3.2 BN)
Hotel 6%
Retail 4%
2%Other
Office 88%
INVESTMENT PROPERTIES: KEY FIGURES BY COUNTRY 5)
Fair value property
assets
Rentable area Occupancy rate Annualised rental
income6)
Yield
in € m in sqm in % in € m in %
full at
equity
∑ full at
equity
∑ full at
equity
∑ full at
equity
∑ full at
equity
∑
Austria 547.0 0.0 547.0 331,907 0 331,907 94.8 0.0 94.8 30.7 0.0 30.7 5.6 0.0 5.6
Germany 977.9 195.4 1173.2 297,123 34,132 331,256 94.9 89.6 93.9 47.8 10.1 57.9 4.9 5.2 4.9
Czechia 206.1 29.8 235.9 84,471 10,911 95,382 93.0 99.7 93.8 13.7 2.0 15.7 6.7 6.7 6.7
Hungary 449.1 11.3 460.4 233,345 6,982 240,327 92.3 98.5 92.5 33.1 1.2 34.3 7.4 10.2 7.4
Poland 288.3 15.8 304.1 93,614 5,820 99,434 87.0 97.0 87.5 18.7 1.0 19.7 6.5 6.1 6.5
Romania 258.9 0.0 258.9 106,377 0 106,377 92.3 0.0 92.3 20.2 0.0 20.2 7.8 0.0 7.8
Others 196.4 36.7 233.1 110,612 23,591 134,203 87.7 90.8 88.2 13.9 3.1 17.0 7.1 8.4 7.3
Total 2,923.7 289.0 3,212.7 1,257,450 81,437 1,338,887 92.5 91.9 92.4 178.1 17.3 195.5 6.1 6.0 6.1
Full: Fully consolidated properties wholly owned by CA Immo; At equity: Properties partially owned by CA Immo, consolidated at equity (pro-rata share)
1) Excl. office properties with a value < € 10 m 2) Excl. properties used for own purposes and short-term property assets 3) Excl. the in 2015 completed project developments Kontorhaus, Monnet 4 and Kennedy-Haus, which are still in the stabilisation phase, the yield stands at
6.3% (31.12.2015: 6.5%) 4) excl. the project developments Kontorhaus, Monnet 4 and Kennedy-Haus, completed in 2015, which are still in the stabilisation phase, the occupancy rate
is 92.9% (31.12.2015: 92.7%) 5) Excl. properties used for own purposes and short-term assets; incl. the office projects Monnet 4, Kennedy Haus and Kontorhaus, which were completed in
2015 6) Monthly contractual rent as at key date multiplied by 12
INVESTMENT PROPERTIES

GROUP MANAGEMENT REPORT
GR
OU
P M
AN
AG
EM
EN
T R
EP
OR
T
45
LIKE-FOR-LIKE COMPARISON OF PROPERTIES IN THE PORTFOLIO AS AT 31.12.2015
Book values Annualised rental
income 1)
Gross yield in % Occupancy rate
m 2016 2015 2016 2015 2016 2015 2016 2015
Austria 547.0 543.6 30.7 30.9 5.6 6.0 94.8 96.3
Germany 1,160.1 1,036.8 57.0 50.8 4.9 4.9 93.8 85.22)
Eastern Europe 1,319.9 1,306.1 94.8 97.4 7.2 7.5 90.0 91.2
Total 3,027.0 2,886.5 182.5 179.1 6.0 6.2 92.0 90.3
1) Monthly contractual rent as at key date multiplied by 12 2) Excl. the project developments Kontorhaus, Monnet 4 and Kennedy-Haus, which were completed in 2015, the occupancy rate as at 31.12.2015 was 93.8%
Lettings performance 2016: 16% of usable space newly let or extended Across the Group, CA Immo let 222,959 sqm of floor
space in 2016, of which 5% (about 11,000 sqm) were pre-lettings on development projects. Excluding these pre-let-tings, this equates to lettings performance of 16% of the Group´s total investment portfolio, which amounts to 1.3 m sqm. New lettings and contract extensions by exist-ing tenants accounted for around 49%; renewals of exist-ing tenants represent 51%. Office space accounted for 88% of the total lettings performance.
The market with the highest lettings performance 2016 (in terms of regional lettable space) was Romania with about 40% new lettings or contract extensions, followed by Poland with 19% lettings performance. The biggest in-dividual new letting was the lease contract with the Fed-eration of Austrian Social Security Institutions in the Vi-enna office building in Haidingergasse for a total of 9,800 sqm office space. 39% of the lease contracts (in terms of letting volume) are concluded for a term of more than 5 years or for an unlimited term.
LETTINGS PERFORMANCE BY SEGMENT 1)
in sqm Pre-leases
development
projects
New leases
investment
properties
Lease
extensions
Total
Germany 3,764 16,921 17,629 38,314
Austria 21,139 10,710 31,849
Eastern Europe 7,256 66,732 78,808 152,796
Total 11,020 104,792 107,147 222,959
% of total 5% 47% 48% 100%
EXPIRY PROFILE OF LEASE AGREEMENTS BASED ON EFFECTIVE RENTAL INCOME
BIGGEST TENANTS (TOP 10)
Sector Region Share in %
of total rent 1)
PWC Auditor Germany 6.7
Verkehrsbuero Hotellerie Hotel sector Austria/Eastern Europe 2.3
Land Berlin c/o Berliner Immobilienmanagement Property administration Germany 2.0
TOTAL Deutschland Energy supply Germany 1.9
Google IT Austria 1.9
Robert Bosch Industrial Austria 1.7
Morgan Stanley Banks Eastern Europe 1.6
Österreichische Post Post Germany 1.6
InterCity Hotel Hotel sector Germany 1.4
IBM IT Eastern Europe 1.3
1) Based on annualised rental revenue

GROUP MANAGEMENT REPORT
46
THE AUSTRIA SEGMENT
The asset portfolio in Austria comprises rentable effec-tive area of 331,907 sqm with a market value of around € 547.0 m according to current valuations. In 2016, this portfolio generated rental income of € 32.2 m (€ 35.5 m in 2015), equivalent to an average yield of 5.6% (5.7% in 2015).
CA Immo invested 2016 around € 6.0 m in its Austrian investment portfolio (investments and maintenance costs), compared to € 6.0 m in 2015.
Lettings In Austria around 21,140 sqm of office space was newly
let and contracts for approx. 10,700 sqm renewed. In terms of total lettable space in Austria, this corresponds to a leasing performance of 9%. The economic occupancy rate in the asset portfolio was 94.8% as at key date (96.5% in 2015).
INVESTMENT PROPERTIES AUSTRIA: KEY FIGURES 1)
in € m 31.12.2016 31.12.2015 Change
Book value 547.0 587.6 – 6.9
Annualised rental income 2) 30.7 33.4 – 7.9
Gross yield in % 5.6 5.7 – 0.1 pp
Economic vacancy rate in % 5.2 3.5 1.7 pp
1) Excludes properties used for own purposes 2) Monthly contractual rent as at key date multiplied by 12
1) Excl. office properties with a portfolio value < € 10 m 2) Excl. the office projects Monnet 4, Kontorhaus and Kennedy Haus, which were completed in 2015, the economic vacancy rate was 93.8% as at 31.12.2015
THE GERMANY SEGMENT
At the key date, CA Immo held investment properties in Germany with an approximate market value of € 1,173.2 m (€ 1,058.5 m in 2015) and rentable effective area of 331,256 sqm. With a share of about 37% of the to-tal CA Immo portfolio (in terms of the portfolio value), Germany is the Group’s biggest investment property mar-ket. The German property assets comprise mainly modern office buildings developed by CA Immo in central loca-tions in Berlin, Munich and Frankfurt; 69% of the lettable office spaces1) are certified according to DGNB or LEED standard.
Rental income of € 58.1 m was generated in 2016, com-pared to € 57.4 m in 2015. The yield on the portfolio was – unchanged to the value of 2015 – 4.9% as at 31 Decem-ber 2016. CA Immo spent some € 9.7 m on maintaining its German investment properties in 2016 (investments and maintenance costs).
Occupancy rate up from 85%2) to 94% The occupancy rate for the asset portfolio in Germany
increased from 85.4%2) on 31 December 2015 to 93.9% on 31 December 2016. Considerable contribution to this in-crease in occupancy rate had the continuous stabilisation of the office projects Kontorhaus (Munich), Kennedy-Haus and Monnet 4 (Berlin), which were completed in 2015, as well as large-scale new rentals in the Tower 185 (Frankfurt). In Germany, approx. 38,300 sqm floor space (of which 26,200 sqm is office space) was newly let or ex-tended during 2016. Pre-letting on development projects accounted for almost 3,800 sqm.
INVESTMENT PROPERTIES GERMANY: KEY FIGURES 1)
in € m 31.12.2016 31.12.2015 Change
Book value 1,173.2 1,058.5 10.8
Annualised rental income 2) 57.9 51.6 12.3
Gross yield in % 4.9 4.9 0.0 pp
Economic vacancy rate in % 6.1 14.6 – 8.5 pp
1) Excl. properties used for own purposes and short-term assets 2) Monthly contractual rent as at key date multiplied by 12

GROUP MANAGEMENT REPORT
GR
OU
P M
AN
AG
EM
EN
T R
EP
OR
T
47
THE EASTERN EUROPE SEGMENT
CA Immo has been investing in Eastern Europe since 1999. The company now maintains investment properties in nine countries of Central and Eastern Europe and South Eastern Europe.
The acquisition of the office complex Millennium Tow-ers in Budapest, which was closed in September (see chapter “Property Assets”) results in an increase of nearly all performance indicators for the Eastern European CA Immo asset portfolio.
As at key date 31 December 2016, investment properties in Eastern Europe had an approximate market value of € 1,492.4 m (€ 1,359.8 m on 31.12.2015), equivalent to around 46% of the total asset portfolio. In this region, CA Immo concentrates on high quality, centrally located office properties in capital cities of Eastern and South Eastern Europe, which make up 98% of the overall East-ern European portfolio. Approximately 68% of the office spaces are certified in accordance with the LEED, BREEAM or DGNB standard (see also chapter Sustainabil-ity).
Following the systematic streamlining of the portfolio since 2012, only 1% of the assets each are now retail and hotel properties. The portfolio is maintained and let by the company's local teams on site.
51% of rental revenue from Eastern Europe The company's asset portfolio comprises 675,724 sqm of
rentable effective area which generated rental income of € 92.7 m in 2016 (compared to € 94.9 m in 2015). This represents 51% of CA Immo's total rental revenue. The overall portfolio produced a gross yield of 7.2% (7.6% in 2015). In 2016, CA Immo invested € 29.9 m in its Eastern Europe investment portfolio (investments and mainte-nance costs).
High Occupancy rate remains stable The economic occupancy rate (measured on the basis of
expected annual rental income) was – unchanged to 2015 – 91.0% as at 31 December 2016 (31.12.2015: 91.1%). To-tal lettings performance for the Eastern Europe segment in 2016 stood at roughly 145,500 sqm of rentable effective area (thereof office space accounted for 131,100 sqm); this corresponds to a letting performance of 22% based on to-tal stock in the region.
Information on sustainability aspects of the business area portfolio properties can be found in the chapter Sus-tainability.
INVESTMENT PROPERTIES IN EASTERN EUROPE: KEY FIGURES 1)
Fair value property assets Annualised rental income 2) Occupancy rate Yield
in € m in € m in % in %
full at equity Total full at equity Total full at equity Total full at equity Total
Poland 288.3 15.8 304.1 18.7 1.0 19.7 87.0 97.0 87.5 6.5 6.1 6.5
Hungary 449.1 11.3 460.4 33.1 1.2 34.3 92.3 98.5 92.5 7.4 10.2 7.4
Romania 258.9 0.0 258.9 20.2 0.0 20.2 92.3 0.0 92.3 7.8 0.0 7.8
Czechia 206.1 29.8 235.9 13.7 2.0 15.7 93.0 99.7 93.8 6.7 6.7 6.7
Others 196.4 36.7 233.1 13.9 3.1 17.0 87.7 90.8 88.2 7.1 8.4 7.3
Total 1,398.8 93.6 1,492.4 99.7 7.2 106.8 90.7 95.2 91.0 7.1 7.7 7.2
Full: Fully consolidated properties wholly owned by CA Immo At equity: Properties partially owned by CA Immo, consolidated at equity (pro-rata share) 1) Excludes short-term property assets 2) Monthly contractual rent as at key date multiplied by 12

GROUP MANAGEMENT REPORT
48
Project development as a driver of organic growth Through its development activity, CA Immo raises the
quality of the company’s portfolio and concurrently achieves organic growth. In addition, the company in-creases the value of land reserves by acquiring building rights and utilises them by means of sales or joint venture developments. CA Immo either transfers completed pro-jects to its portfolio or sells them (through forward sales or to investors upon completion).
In the course of its development activity, CA Immo co-vers a deep value chain from site development and prop-erty use approval to construction management and the letting or sale of completed properties. Information on sustainability aspects of the business area investment properties under development can be found in the chap-ter Sustainability.
88% of development activity in Germany As at 31 December 2016, the development division rep-
resented around 12% (equivalent to approximately €438.5 m, 2015: € 417.5 m) of CA Immo’s total property assets. Accounting for a share of 88%, the focus of project development activity is still firmly on Germany. Develop-ments and land reserves in Eastern Europe (11%) and in Austria (1%) account for the remainder of property assets under development. Development projects in Germany
with a total book value of € 383.6 m are divided into pro-jects under construction accounting for around € 118.9 m and plots subject to property use approval and long-term land reserves (€ 264.6 m).
THE AUSTRIA SEGMENT
In the Vienna district of Lände 3, CA Immo has made rapid progress with utilisation of the last three construc-tion sites on Erdberger Lände itself, a process that began in 2015.
Alongside the construction of 220 rental apartments for a local investor (Wohnbau Süd), which began early in 2016, CA Immo commenced building work on the devel-opment of 270 more apartments on the Lände 3 site at the start of September together with joint venture partner JP Immobilien. The residential project, which will comprise around 500 apartments in total, will be marketed under the name Laendyard Living.
CA Immo also commenced development of the 14,700 sqm ViE office building in the Lände 3 district at the end of 2016. Completion of the last structure under development in the Lände 3 district is scheduled for 2018.
INVESTMENT PROPERTIES UNDER DEVELOPMENT BY COUNTRY
Landbank Projects under development Total Investment Properties
under Development
in € m Book value Book value
in %
Book value Book value
in %
Book value Book value
in %
Austria 0.0 0.0 5.5 3.7 5.5 1.2
Frankfurt 151.3 51.9 27.0 18.3 178.3 40.7
Berlin 76.8 26.4 65.9 44.8 142.7 32.5
Munich 36.5 12.5 26.1 17.7 62.6 14.3
Germany 264.6 90.8 118.9 80.8 383.6 87.5
Czech Republic 13.8 4.7 0.0 0.0 13.8 3.1
Hungary 1.3 0.4 0.0 0.0 1.3 0.3
Poland 0.0 0.0 0.0 0.0 0.0 0.0
Romania 5.9 2.0 22.7 15.4 28.6 6.5
Other 5.8 2.0 0.0 0.0 5.8 1.3
Eastern Europe 26.8 9.2 22.7 15.4 49.5 11.3
Total 291.4 100.0 147.1 100.0 438.5 100.0
INVESTMENT PROPERTIES UNDER DEVELOPMENT

GROUP MANAGEMENT REPORT
GR
OU
P M
AN
AG
EM
EN
T R
EP
OR
T
49
THE GERMANY SEGMENT
CA Immo’s development activity in Germany focused on large scale, mixed-use urban projects in Berlin, Mu-nich and Frankfurt. As at 31 December 2016, CA Immo held rentable effective area under construction amount-ing to 148,235 sqm in Germany with an expected market value (after completion) of around € 742.0 m.
In addition to the current project volume, German land
reserves with a value of € 264.6 m provide additional po-tential for development; after completion, usable space of approximately 800,000 sqm will have a value of around € 2 bn. These existing reserves will form the basis for the value-creating development activity of CA Immo over the years ahead.
GERMANY: BREAKDOWN OF ASSETS UNDER DEVELOPMENT
PROJECTS UNDER DEVELOPMENT
in € m Total
investment 1)
Outstanding
construction
costs
Planned rentable
effective area in
sqm
Gross
yield on
cost in %
City Main usage Share2)
in %
Pre-
letting
rate in %
Start of
cons-
truction
Scheduled
completion
Projects (own stock)
VIE 37.8 33.1 14,715 6.3 Vienna Office 100 0 Q3 2016 Q3 2018
MY.O 96.0 84.5 26,183 6.0 Munich Office 100 0 Q1 2017 Q3 2019
KPMG building 56.3 26.9 12,705 5.8 Berlin Office 100 90 Q4 2015 Q2 2018
Rieck 1, Phase 2 10.4 9.2 2,786 6.4 Berlin Office 100 0 Q4 2016 Q2 2019
ZigZag 16.3 12.8 4,389 5.7 Mainz Office 100 0 Q2 2017 Q3 2018
Steigenberger 3) 56.3 41.9 17,347 6.4 Frankfurt Hotel 100 93 Q3 2016 Q3 2018
Orhideea Towers 74.0 57.9 36,918 8.3 Bucharest Office 100 22 Q4 2015 Q4 2017
Subtotal 347.1 266.4 115,044 6.2
Projects (for sale)
Cube 98.3 75.7 16,990 n.m. Berlin Office 100 0 Q4 2016 Q4 2019
Rieck I, Phase 1 25.7 22.4 5,215 n.m. Berlin Office 100 100 Q4 2016 Q1 2019
Rheinallee III 59.2 44.4 19,668 n.m. Mainz Residential 100 95 Q3 2016 Q3 2018
Baumkirchen WA 2 65.5 16.9 11,232 n.m. Munich Residential 50 99 Q2 2015 Q3 2017
Baumkirchen WA 3 66.4 39.9 13,631 n.m. Munich Residential 50 82 Q1 2016 Q3 2018
Baumkirchen NEO 86.2 64.9 18,088 n.m. Munich Mixed 50 26 Q1 2017 Q2 2019
Laendyard Living 57.1 44.8 19,439 n.m. Vienna Residential 50 31 Q3 2016 Q3 2018
Wohnbau Süd 34.1 17.9 14,100 n.m. Vienna Residential 100 100 Q2 2016 Q2 2018
Subtotal 492.4 326.9 118,364
Total 839.6 593.3 233,408
1) incl. plot 2) All figures refer to the project share held by CA Immo 3) The Mannheimer Strasse bus station next to the hotel (now completed with a value of € 4.0 m) is still assigned to property assets under development as temporary usage and is not included in the table.

DEVELOPMENT OF URBAN DISTRICTEUROPACITY IN BERLIN
GROUP MANAGEMENT REPORT
INTERCITY HOTEL BERLIN
rentable area in sqm 20,600
main usage hotel
opened 2013
status rented
JOHN F. KENNEDY HAUS
rentable area in sqm 18,100
main usage office
completion 2015
status rented
CUBE
rentable area in sqm 17,000
main usage Büro
planned completion 2019
status under construction
50

Developed by CA Immo and added to the investment portfolio
Plots sold
Plots owned by CA Immo
GROUP MANAGEMENT REPORT
TOUR TOTAL
rentable area in sqm 14,200
main usage office
completion 2012
status rented MY.B
rentable area in sqm 14,400
main usage office
status in preparation
MONNET 4
rentable area in sqm 8,200
main usage office
completion 2015
status rented
BÜRO- UND APOTHEKERHAUS
rentable area in sqm 8,000
main usage office
planned completion 2019
status under construction
KPMG
rentable area in sqm 12,700
main usage office
planned completion 2017
status under construction
51

GROUP MANAGEMENT REPORT
52
The main focus of current development activity in Ger-many
Berlin Around Berlin’s main rail station, the city district Eu-
ropacity is taking shape, drawing together office, residen-tial, hotel and culture on some 40 hectares. Reputable companies such as TOTAL, Steigenberger, Airbus, 50 Hertz, and Ernst Basler & Partner have already signed up as tenants or investors. CA Immo is developing three of-fice projects in this district on the key date.
In January 2016, CA Immo decided to develop the Rieck I office building spanning some 9,500 sqm of gross office space in Europacity, Berlin. A leasing contract with ABDA – Bundesvereinigung Deutscher Apothek-erverbände (Federal Union of German Associations of Pharmacists) – concerning some 70% of the office space is already concluded. ABDA will initially rent the build-ing section specifically developed to meet its needs for two years before taking over ownership. The remaining floor space of the building (section 2) will continue to be held by CA Immo.
Construction of the 18,500 sqm, detached Cube build-ing at Berlin’s main rail station began in the second half of 2016. Prominently located by the bend in the River Spree, opposite the Federal Chancellery, the building was sold to a major institutional fund manager under the terms of a forward sale at the end of 2016. CA Immo will build and let the property on behalf of the investor.
Munich 560 high-quality housing units and attractive office
spaces are expected to be completed by the end of 2018 in the district development project Baumkirchen Mitte in the Munich district of Berg am Laim with a surface of about 130,000 sqm. The major share of the privately fi-nanced apartments in the three residential sections has already been sold. The remaining 50 subsidised apart-ments in the third building section are expected to be sold in the first half of 2017. Preparation for apartment sales on the final construction site and for the construc-tion of the NEO hotel and office building took place in
parallel. Construction is expected to start in the first half of 2017.
CA Immo is preparing the development of an office building with some 27,000 sqm in the Munich district Nymphenburg under the name My.O. This 7-storey en-semble is being built in a central location close to the city railway. Start of construction is planned for the first half year of 2017.
The town planning and landscaping competition organ-
ised by CA Immo in partnership with the state capital of Munich to develop a 14-hectare site on Ratoldstrasse in the Munich district of Feldmoching was decided in July. Around 900 apartments are now to be built on what are largely brownfield property reserves at present. The re-sult of the competition will form the basis of the forth-coming land use plan.
Frankfurt Directly adjacent to the southern exit of the Frankfurt
mainline station, CA Immo is developing an eight-level hotel with some 400 rooms along with 82 underground parking spaces for the Steigenberger Hotel Group. The hotel’s opening is planned for the end of 2018.
Mainz In the city quarter Zollhafen Mainz jointly developed by
CA Immo and Stadtwerke, the construction of the resi-dential and retail building Rheinallee III with a total of some 20,000 sqm lettable space was started in summer 2016. CA Immo is realising the building for an investor on a ready-to-occupy basis. Development of the ZigZag office building is under preparation on the same site.
THE EASTERN EUROPE SEGMENT
The Eastern Europe segment accounts for property as-sets under development (incl. land reserves) with an ap-proximate market value of € 49.5 m. As at 31 December 2016, CA Immo had one development project under con-struction in eastern Europe: the Orhideea Towers office project in Bucharest spans some 37,000 sqm.

GROUP MANAGEMENT REPORT
GR
OU
P M
AN
AG
EM
EN
T R
EP
OR
T
53
Property valuation constitutes the basis on which a real estate company is appraised, and is thus the most im-portant factor in determining net asset value. In addition to property-specific criteria, there are many economic and political factors that can affect the development of prop-erty values. In the office property sector, which represents the core business of the CA Immo Group, the general eco-nomic pattern – especially where economic growth and the employment rate are concerned – directly influences the real estate cycle. Moreover, factors such as interest rates and geopolitical developments are also key variables with a major influence on the demand situation on real estate investment markets.
External valuations to international standards The value of real estate is generally determined by inde-
pendent expert appraisers from outside the company ap-plying recognised valuation methods. External valuations are carried out in line with standards defined by the Royal Institution of Chartered Surveyors (RICS). The RICS defines fair value as the estimated value at which an asset or liability can be sold to a willing buyer by a willing seller on the valuation date in the framework of a transac-tion in the usual course of business after a reasonable marketing period, whereby each party acts knowledgea-bly, prudently and without compulsion.
The valuation method applied by the expert appraiser in a particular case is mainly determined by the stage of development and usage type of a property.
Rented commercial real estate (which makes up the bulk of the CA Immo Group’s portfolio) is generally val-ued according to the investment method; fair values are based on capitalised rental revenue or the discounted cash flow expected in future. In addition to current con-tractual rents and lease expiry profiles, the competent as-sessment of the expert appraiser determines and consid-ers other parameters such as, in particular, attainable mar-ket rent and the equivalent yield for a property.
The residual value procedure is applied to sites at the development and construction phase. In this case, fair values are determined following completion, taking ac-count of outstanding expenses and imputing an appropri-ate developer profit. Possible risks are considered, amongst other things, in respect of future attainable rents and the capitalisation and discounting rates. Interest rates are influenced in particular by general market behaviour as well as locations and usage types. The closer a project comes to the point of completion, the greater the propor-tion of parameters derived from actual and contractually stipulated figures. Sites are valued according to the in-vestment method shortly before and after completion.
In the case of land reserves where no active develop-ment is planned for the near future, the comparable value method (or the liquidation, costing or residual value method) is used, depending on the property and the sta-tus of development.
An external valuation of over 95% of all property assets was carried out on the key date 31 December 2016. Values for other property assets were updated on the basis of binding purchase agreements or internally in line with the previous year’s valuations.
The valuations as at 31 December 2016 were undertaken by the following companies:
– CB Richard Ellis (Austria, Germany, Eastern Europe) – Cushman & Wakefield (Eastern Europe) – MRG Metzger Realitäten Beratungs- und Bewertungsge-
sellschaft (Austria) – Knight Frank (Eastern Europe) – Ö.b.u.v.SV Dipl.-Ing. Eberhard Stoehr (Germany, Eastern
Europe) – Buschmann Immobilien Consulting (Germany)
PROPERTY VALUATION

GROUP MANAGEMENT REPORT
54
Market environment in 2016 Like the previous year, the market environment for the
core markets of Germany, Austria and the CEE nations was positive in 2016 (see also the ‘Property markets’ sec-tion). The positive economic trend in Germany has prompted a boom in investment and generated record high turnover from lettings and sustained yield compres-sion. The encouraging development has also been re-flected on the rental market of Germany in improved let-ting performance, occupancy rates and average rents in the German office cities. The CA Immo Group was able to derive significant benefit from these positive market trends thanks to its strong market positions in the cities of Munich, Frankfurt and Berlin. The Vienna office market also enjoyed greater interest from investors in a stable op-erating environment. The core Eastern European markets of Prague, Budapest and Bucharest were characterised by stable operating performance also in 2016. Extensive building activity is currently taking place on the office market in Warsaw, which also reports record lettings per-formance and strong interest from international investors. This also leads to significant yield suppression for core properties. Transaction activity on the investment mar-kets in the CEE region continued its clearly positive trend and reached a historic record volume. For 2016 as a whole, the CA Immo Group recorded a positive revalua-tion result of € 138.3 m (€ 213.8 m in 2015).
AUSTRIA
A low volume of new office premises coupled with high levels of pre-letting made for a stable office property mar-ket in Austria in 2016; accordingly, there were no major value changes in the CA Immo asset portfolio. As at the key date, the revaluation result was € 2.4 m, against € 5.4 m in 2015. The average gross yield on investment properties increased slightly yoy from 5.7% to 5.6% (fully consolidated properties).
GERMANY
Strong performance on the German office market re-sulted in highly positive value development for the real estate portfolio, mainly on account of this positive market trend coupled with successful implementation of devel-opment projects and highly profitable sales of non-strate-gic properties. The revaluation result for the Group as at 31 December 2016 was € 144.0 m (31.12.2015: € 169.4 m). The largest contributions to the revaluation gain in terms of amount in the German segment came from undevel-oped real estate in Frankfurt and Munich, the investment properties Skygarden, Ambigon and Kontorhaus in Mu-nich, the John F. Kennedy-Haus and the InterCity Hotel in Berlin. Year on year, the gross yield increased slightly from 4.8% to 4.9% (fully consolidated properties).
VALUATION RESULT FOR AUSTRIA 1)
Acquisition
costs
(€ m)
Book value
(in € m)
Revaluation/
Impairment
Gross Yield
in %
31.12.2016 31.12.2016 in € m 31.12.2015 31.12.2016
Income producing investment properties 2) 602.1 547.0 0.4 5.7 5.6
Investment properties under development 4.3 5.5 0.4
Assets held for sale 10.7 15.1 1.7
Total 617.1 567.6 2.4
1) Based on fully consolidated properties 2) Excludes properties used for own purposes

GROUP MANAGEMENT REPORT
GR
OU
P M
AN
AG
EM
EN
T R
EP
OR
T
55
VALUATION RESULT FOR GERMANY 1)
Acquisition costs
(€ m)
Book value
(in € m)
Revaluation/
Impairment
Gross Yield
(in %)
31.12.2016 31.12.2016 in € m 31.12.2015 31.12.2016
Income producing investment properties 2) 739.8 977.9 94.6 4.8 4.9
Investment properties under development 315.2 383.6 49.5
Assets held for sale 0.0 0.0 0.0
Properties held for trading 36.8 34.1 0.0
Total 1,091.8 1,395.6 144.1
1) Based on fully consolidated properties; excl. the recently completed office projects Kontorhaus (Munich), John F. Kennedy Haus and Monnet 4 (Berlin) the gross profit as at 31.12.2016 was 5.2%
2) Excludes properties used for own purposes
EASTERN EUROPE
The 2016 revaluation result for the Eastern Europe seg-ment stood at € -8.2 m (2015: € 39.0 m). The market envi-ronment was widely stable across much of CA Immo’s core region in 2016. One exception is Warsaw where the supply of modern office space puts pressure on the sup-ply and demand balance in the short term owing to vigor-ous building activity, which is reflected in revaluation
adjustments. The acquisition of Millennium Towers in Budapest led to a revaluation gain in the amount of € 7.2 m. The average gross yield on investment properties decreased slihtly yoy from 7.6% to 7.1% (fully consoli-dated properties).
VALUATION RESULT FOR EASTERN EUROPE 1)
Acquisition costs
(€ m)
Book value
(in € m)
Revaluation/
Impairment
Gross Yield
(in %)
31.12.2016 31.12.2016 in € m 31.12.2015 31.12.2016
Investment properties 1,502.4 1,398.8 –8.2 7.6 7.1
Investment properties under development 54.1 44.0 0.0
Assets held for sale 0.0 0.0 0.0
Total 1,556.6 1,442.8 –8.2
1) Based on fully consolidated properties

GROUP MANAGEMENT REPORT
56
As a real estate company, CA Immo operates in a capi-tal-intensive sector where success is heavily dependent on access to debt. It is highly relevant to establish the most effective possible structuring and optimisation of fi-nancing with outside capital; alongside successful man-agement of the real estate portfolio, this is one of the key factors in the overall result of CA Immo.
Balance sheet profile remains strong As at 31 December 2016, the total financial liabilities of
the CA Immo Group stood at € 1,565,639 K, above the previous year’s value of € 1,403,989 K. Net debt after the deduction of the Group’s cash and cash equivalents amounted to € 1,167,656 K at year end (2015: € 1,191,446 K). The company thus has an extremely ro-bust balance sheet with a healthy equity ratio of 51.2% (53.2% in 2015), which in conservative debt figures equates to gearing of 53.0% (2015: 56.2%) and a loan-to-value (LTV) ratio of 34.2% (2015: 37.2%).
In addition to financing already secured which is thus reflected on the balance sheet, the CA Immo Group has non-utilised credit lines that will be used to finance de-velopment projects under construction in Germany; pay-ment dates will be set by the banks as construction work progresses. This financing framework amounted to € 111,768 K as at the key date, whereby joint ventures are recognised according to the amount of the holding. Con-tinual optimisation of the financing structure has led to a further significant reduction in financing costs in 2016 (€ -41,622 K against € -60,172 K in 2015). The resulting strengthened recurring earnings power further improves the Group's profitability and is reflected in growing Funds from Operations (FFO).
Confirmation of investment grade rating In December 2015 Moody’s Investors Service, the inter-
national rating agency, classified CA Immobilien Anlagen AG with a Baa2 investment grade (long-term issuer) rat-ing with stable prospects. The credit report published by Moody’s emphasised the high quality and regionally di-versified portfolio of office properties, the low tenant concentration risk, the low level of gearing and the con-servative financing policy as particularly positive factors. Following acquisition of a 26% share by Immofinanz and the associated merger plans communicated in April 2016, Moody’s outlook was lowered from neutral to negative. The Baa2 issuer rating was last confirmed in July 2016 in a more detailed credit report.
The investment grade rating of CA Immo facilitates greater flexibility and thus further optimisation of the fi-nancing structure through improved access to the institu-tional debt capital market; this means the range of usable financing possibilities can be expanded. The key indica-tors in retaining and upholding the corporate credit in-vestment grade rating are a strong balance sheet with low gearing, recurring earnings power, an associated solid in-terest coverage ratio and a sufficiently large quota of un-secured properties.
Expiry profile The diagram below shows the maturity profile of the fi-
nancial liabilities of the CA Immo Group as at 31 Decem-ber 2016 (assuming options to extend are exercised). The due amounts shown for 2017, fully secured mortgage loans, total approximately
FINANCING

GROUP MANAGEMENT REPORT
GR
OU
P M
AN
AG
EM
EN
T R
EP
OR
T
57
€ 192 m as at the key date. Of this, proportionate financ-ing for joint ventures accounted for approximately € 50 m, partly repaid through the buy-out of joint venture partner Union Investment at the beginning of 2017 (see supplementary report). Regarding maturities of fully con-solidated liabilities amounting to approximately € 143 m, secured loans due in Austria and Germany ac-counted for € 95 m, and project financing in Eastern Eu-rope accounted for approximately € 48 m.
Falling financing costs As the table shows, average financing costs for the CA Immo Group on the basis of total financial liabilities (i.e. including proportionate joint venture financing) stood at 2.3% as at key date 31 December 2016. This fig-ure contains derivatives used for interest rate hedging in the form of interest rate swaps and caps. Where the latter are disregarded, the average interest rate is lower at 2.1%.
As a result, average financing costs fell significantly during 2016, as in the previous years (the figure on key date 31 December 2015 was 2.9%). The use of cash and cash equivalents to optimise the financing structure
through the repayment of costly loans and the use of de-rivatives for interest rate hedging were the key drivers. With base rates still at historic lows and even negative in some instances (Euribor), and given the persistently com-petitive environment for bank financing (especially in Germany), which entails lower financing margins, the trend on all core markets of CA Immo was for decreasing financing costs.
FINANCING COSTS 1)
in € m Outstanding
nominale value
Nominal
value swaps
Ø Cost of debt excl.
Derivatives
Ø Cost of debt incl.
Derivatives
Ø Debt maturity Ø Swap
maturity
Income producing
investment properties
Austria 146.9 47.4 2.2 2.8 5.5 7.2
Germany 574.1 119.6 1.4 1.9 5.0 2.5
Czechia 116.4 51.2 2.3 2.2 2.6 1.8
Hungary 182.4 86.9 2.9 3.0 4.8 7.0
Poland 130.7 60.0 2.0 2.0 2.3 2.5
Romania 49.0 32.9 3.7 4.0 3.0 2.7
Others 36.2 0.0 3.5 3.5 1.1 0.0
Total 1,235.7 398.1 2.0 2.3 4.3 4.0
Development projects 46.3 6.3 1.4 1.4 2.1 2.2
Short-term property
assets 38.8 0.0 1.7 1.7 0.8 0.0
Financing on parent
company level 466.5 0.0 2.5 2.5 5.3 0.0
Total 1,787.2 404.4 2.1 2.3 4.4 4.0
1) The data include both fully consolidated liabilities and liabilities consolidated at equity and represented pro rata (proportionately)

GROUP MANAGEMENT REPORT
58
BASIC PARAMETERS OF THE FINANCING STRATEGY
Current emphasis on secured financing The focus of the current financing structure is on mort-
gage credit secured with property; credit is taken up in the (subsidiary) companies in which the respective real estate is held. Since financing is provided at subsidiary level, there is no recourse to the parent company or other parts of the Group. Covenants linked to such project fi-nancing relate only to the property in question and not to key figures for the Group as a whole.
Raising the proportion of unsecured financing As at the key date, unsecured financing at Group parent
company level was essentially limited to three bonds placed on the capital market with a total volume of ap-proximately € 465 m; this received a boost of € 175 m in February 2017 with the issue of corporate bond 2017-2024. As at 31 December 2016, the book value of CA Immo’s unsecured real estate was approximately € 1.0 bn. To secure the Group’s investment grade rating, expansion of the volume of unsecured real estate is planned: the use of issue proceeds from unsecured fi-nancing instruments should enable the repayment of mortgage credit and thus the release of encumbrances re-lating to currently secured real estate.
Long-term financial indicators Upholding a sound balance sheet structure with a
strong equity basis is strategically important to the CA Immo Group. As regards financial indicators, long-term objectives fluctuate between 45-50% for the Group’s equity ratio and around 40-45% for the loan-to-value ra-tio (net financial liabilities to property assets). In the mid-term, the interest rate hedging ratio (around 77% as at the key date) is to be maintained at that level.
Long-term interest rate hedging Since the interest paid makes up the biggest expense
item in the income statement for most real estate compa-nies, interest rate rises can have a major impact on earn-ings – especially since rental revenue is usually based on long-term agreements, which means increases in financ-ing costs cannot be counterbalanced by higher revenue. For this reason, the CA Immo Group’s financing policy partly involves hedging a substantial proportion of inter-est expenditure against fluctuation over the long term. In-terest swaps (and, to a lesser extent, interest rate caps) are used as interest hedging tools. It is also possible to utilise the instrument of a swaption, an option to enter into an interest rate swap in a defined timeframe. In future, fixed-interest bonds will also make up a greater part of the interest rate hedging ratio.
Of the derivatives deployed, interest swap agreements account for a nominal value of € 397,766 K. The weighted average term remaining on derivatives used for interest rate hedging is around 4.0 years, compared to a weighted remaining term of 4.4 years on financial liabili-ties. Interest rate caps represent a nominal value of € 44,196 K.
In terms of the balance sheet, a distinction is drawn be-tween those contracts directly attributable to a loan (thus meeting the criteria for hedge accounting as cash flow hedges) and those for which these preconditions are not met (fair value derivatives). For cash flow hedges, the change in the fair value on the relevant key date is recog-nised directly in equity; for fair value derivatives, by con-trast, the change is recognised as expenditure in the in-come statement under ‘Income from interest rate deriva-tive transactions’. As at key date 31 December 2016, con-tracts with a nominal value of € 92,360 K and a fair value of € –4,151 K were classified as cash flow hedges. The nominal value of swaps classified as fair value deriva-tives was € 305,406 K; the negative fair value was € –7,432 K as at 31 December 2016.

GROUP MANAGEMENT REPORT
GR
OU
P M
AN
AG
EM
EN
T R
EP
OR
T
59
Bonds As at key date 31 December 2016, CA Immo had the fol-
lowing outstanding bonds registered for trading on the unlisted securities market of the Vienna Stock Exchange:
ISIN Typus Outstand-
ing
Volume
Maturity Cupon
AT0000A1CB33 Corporate bond € 175 m 2015-2022 2.750%
AT0000A1JVU3 Corporate bond € 150 m 2016-2023 2.750%
AT0000A1LJH1 Corporate bond € 140 m 2016-2021 1.875%
The bonds provide unsecured financing at Group parent company level; they are on equal footing to one another and to all other unsecured financing of CA Immobilien Anlagen AG. Except for the 2015-2022 corporate bond, bond conditions contain a loan-to-value (LTV) covenant.
Issuance of new corporate bonds After being granted an investment grade rating in De-
cember 2015, CA Immo issued another unsecured corpo-rate bond in February 2016 with a volume of € 150 m, a term of seven years and an interest rate of 2.75%. In July 2016 another corporate bond with a volume of € 140 m, a
term of 5 years and an interest rate of 1.875% was issued. Both issues were assessed at Baa2 by the rating agency Moody’s, in line with the issuer rating. Proceeds from the issues served to refinance the bond 2006-2016 due in September 2016 (€ 186 m) and to increase the Group's re-curring income, including through further optimisation of the financing structure.
In February 2017 another corporate bond 2017-2024 with a volume of € 175 m and an interest rate of 1.875% was is-sued. The bond is registered for trading on the unlisted securities market of the Vienna Stock Exchange and the regulated market of the Luxembourg Stock Exchange (ISIN AT0000A1TBC2) and was also assessed at Baa2 by Moody‘s. Almost twice oversubscribed, more than two thirds of the bond were placed with private and institu-tional investors in Austria. Proceeds from the issue will serve to refinance secured financing with largely variable interest rates and to substitute planned bank financing.
Sources of financing CA Immo has business relations with a large number of
financing partners. With around 23% of total outstanding financial liabilities, the main financing bank is the UniCredit Group. As the diagram shows, Nord LB/Deutsche Hypo, DG Hyp, Helaba, Bayrische Ver-sorgungskammer (BVK) and Erste Group also accounted for significant shares as at the key date. No other finan-cing bank or insurance company provides more than 5% of the financing volume.
23%
25%
FINANCIAL DEBT AS OF 31.12.2016* (Basis: € 1.8 bn)
52%
Variable, but hedgedthrough derivates
Fixed rate debt
Variable rate debt
*Including proportionate joint venture financing
Bonds 25.8%
FINANCING SPLIT BY BANKS*(Basis: € 1.8 bn)
Helaba 5.9%
Others 17.3%
UniCredit
Erste Group
DG Hyp
Deutsche Hypo
BVK
5.5%
5.5%
7.6%
9.5%
22.9%
* Including proportionate joint venture financing

GROUP MANAGEMENT REPORT
60
KEY FIGURES FROM THE INCOME STATEMENT
Sustained earnings Rental income for CA Immo increased by 7.0% to
€ 165,603 K in 2016. This positive trend was essentially made possible by the acquisition of the minority share of the EBRD early in quarter three 2015 and the increase in rent this entailed. As the following table shows, the com-pany was able to more than compensate for the drop in rent of € 11,184 K resulting from property sales thanks to inflows from this acquisition.
Incentive arrangements from various lease agreements (in particular rent-free periods) are linearised for the total term of the lease contract. Rental income therefore shows the effective economic rent and not the actual cash-rele-vant rent during the period. Of the rental income for busi-ness year 2016, linearisation of this kind accounted for € –278 K (€ 4,155 K in 2015).
In year-on-year comparison, property expenses directly attributable to the asset portfolio, including own operat-ing expenses, declined by –4.0% from € –19,225 K to
€ –18,453 K. The main expenditure items are vacancy costs and operating expenses that cannot be passed on (€–5,820 K), agency fees (€ –2,373 K), maintenance (€ –6,097 K), allowances for bad debt (€ –309 K) and other directly attributable expenses (€ –3,044 K). While bad debt losses, agency fees, individual value adjustments and other expenses fell, maintenance rose compared to the previous year.
The net result from renting attributable to letting activi-
ties rose by 8.5% (from € 135,592 K to € 147,150 K) after the deduction of direct management costs. The operating margin on letting activities (net rental income in relation to rental income), an indicator of the efficiency of rental business, increased from 87.6% to 88.9%.
In business year 2016 no earnings were generated from
hotel management due to property sales. Other expendi-ture directly attributable to project development stood at € –2,333 K at year end (€ –2,159 K in 2015).
RESULTS
Hotel 7%
Retail 5%
Other 4%
Logistic 1%
RENTAL INCOME BY MAIN USAGE (Basis: € 165.6 m)
Office 82%
1%Residential
Poland 10%
Czech Republic
11%Romania
9%
Germany 30%
RENTAL INCOME BY COUNTRY (Basis: € 165.6 m)
Austria 19%
Hungary 13%
Other 8%
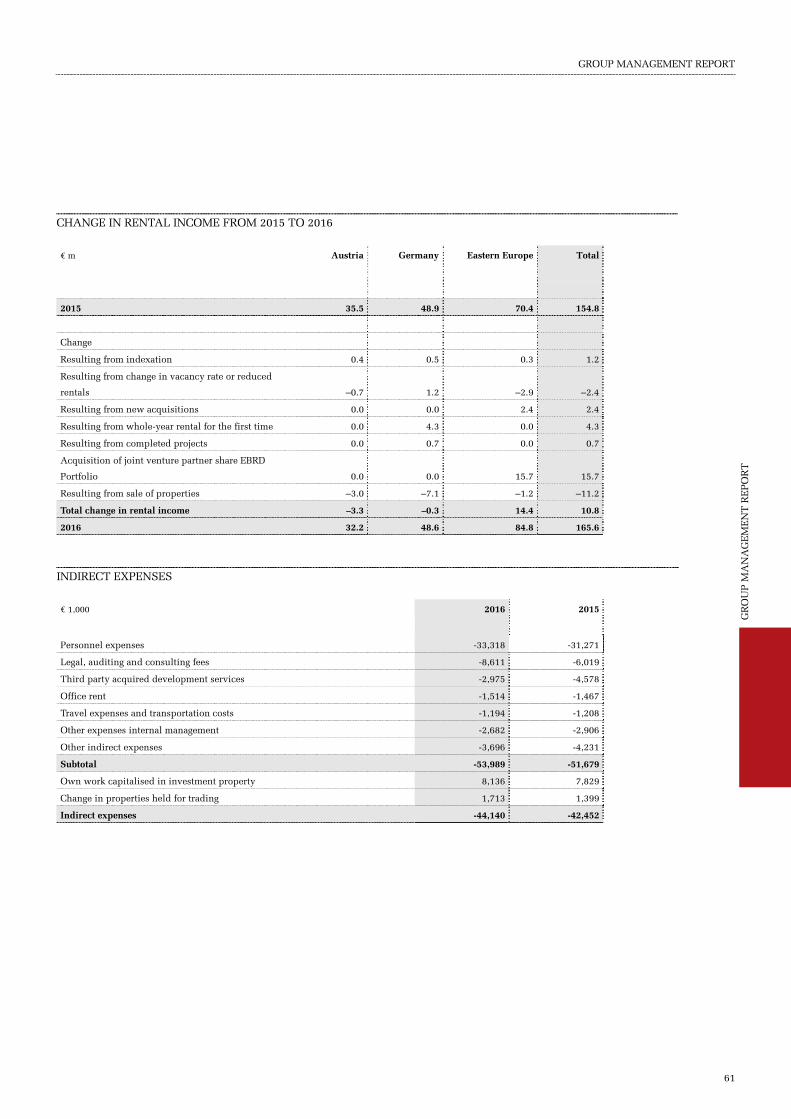
GROUP MANAGEMENT REPORT
GR
OU
P M
AN
AG
EM
EN
T R
EP
OR
T
61
CHANGE IN RENTAL INCOME FROM 2015 TO 2016
€ m Austria Germany Eastern Europe Total
2015 35.5 48.9 70.4 154.8
Change
Resulting from indexation 0.4 0.5 0.3 1.2
Resulting from change in vacancy rate or reduced
rentals –0.7 1.2 –2.9 –2.4
Resulting from new acquisitions 0.0 0.0 2.4 2.4
Resulting from whole-year rental for the first time 0.0 4.3 0.0 4.3
Resulting from completed projects 0.0 0.7 0.0 0.7
Acquisition of joint venture partner share EBRD
Portfolio 0.0 0.0 15.7 15.7
Resulting from sale of properties –3.0 –7.1 –1.2 –11.2
Total change in rental income –3.3 –0.3 14.4 10.8
2016 32.2 48.6 84.8 165.6
INDIRECT EXPENSES
€ 1,000 2016 2015
Personnel expenses -33,318 -31,271
Legal, auditing and consulting fees -8,611 -6,019
Third party acquired development services -2,975 -4,578
Office rent -1,514 -1,467
Travel expenses and transportation costs -1,194 -1,208
Other expenses internal management -2,682 -2,906
Other indirect expenses -3,696 -4,231
Subtotal -53,989 -51,679
Own work capitalised in investment property 8,136 7,829
Change in properties held for trading 1,713 1,399
Indirect expenses -44,140 -42,452

GROUP MANAGEMENT REPORT
62
Property sales result Trading income of € 28,099 K (previous year: € 9,535 K)
was earned in 2016 in connection with the scheduled sale of properties held in current assets. This income was counteracted by book value deductions and other directly attributable expenditure of €–18,669 K. The trading port-folio thus contributed a total of € 9,430 K to the result, compared to € 3,089 K in 2015. As at year end, the re-maining volume of properties intended for trading stood at € 34,147 K.
Profit from the sale of investment properties of € 23,340 K was below the previous year’s value of € 36,547 K. Germany delivered the largest contribution to earnings from property sales in the amount of € 19,752 K. In 2015, sales in Germany accounted for € 24,759 K. The biggest contribution came from a non-strategic property sale in Stuttgart.
Income from services Gross revenue from services declined by –18.2% in
yearly comparison to stand at € 13,265 K (€ 16,219 K in 2015). Alongside development revenue for third parties via the subsidiary omniCon, this item contains revenue from asset management and other services to joint ven-ture partners.
Indirect expenditures In 2016 indirect expenditures rose 4.0% from the previ-
ous year's figure of € –42,452 K to € –44,140 K. Unlike in previous periods, this item also contains expenditure counterbalancing the aforementioned gross revenue from services. As the above table shows, total indirect ex-penditure includes the item ‘Internal expenditure capital-ised’, which was 3.9% up on the 2015 figure at € 8,136 K. This item may be regarded as an offsetting item to the in-direct expenditures which counterbalance that portion of internal project development expenditure, provided it is directly attributable to individual development projects and thus qualifies for capitalisation.
Other operating income Other operating income stood at € 873 K compared to
the 2015 reference value of € 1,470 K.
Earnings before interest, taxes, depreciation and amortisation (EBITDA) Earnings before interest, taxes, depreciation and amorti-
sation (EBITDA) stood at € 147,585 K, down –0.7% on the previous year’s level of € 148,558 K. While sustained earnings were increased compared to the previous year,
lower results from property sales as outlined above led to the slight decline.
The contribution of the various regional segments to overall earnings is as follows: with an EBITDA of € 69,657 K, the CEE segment generated the largest share (approximately 47%). Germany accounted for € 63,143 K (43%) and the Austria segment contributed € 14,875 K (10%).
EBITDA (BASIS € 147.6 M)
Revaluation result The total revaluation gain of € 179,094 K in 2016 was
counterbalanced by a revaluation loss of € –40,834 K. The cumulative revaluation result of €138,260 K was there-fore highly positive (€213,818 K in 2015).
This results reflects the extremely positive market envi-ronment specifically in Germany, the most important core market of CA Immo. In the German real estate mar-ket, as in the previous year, the booming investment ac-tivity and further yield compression continued in 2016 – in combination with strong fundamental data of the let-ting markets –, which is also reflected in the valuation re-sult of CA Immo. The biggest contribution to the revalua-tion gain was delivered by undeveloped properties in Frankfurt and Munich, the newly acquired Millennium Towers in Budapest in September 2016 and by the invest-ment properties of Skygarden, Ambigon and Kontorhaus in Munich as well as John. F. Kennedy-Haus and Inter-City Hotel in Berlin.
In regional terms, the revaluation result for Germany to-taled € 144,046 K. Austria also reported positive results with € 2,145 K, while in Eastern Europe a loss of € –8,201 K was recognised.
Germany
10%
CEE 47%
Austria
43%

GROUP MANAGEMENT REPORT
GR
OU
P M
AN
AG
EM
EN
T R
EP
OR
T
63
Result from joint ventures Current results of joint ventures consolidated at equity
are reported under ‘Result from joint ventures’ in the consolidated income statement. In 2016 this contribution totalled € 11,420 K (2015: € 43,221 K). The declining re-sult was mainly due to the full takeover of shares in joint ventures and the subsequent full consolidation and sale of such shares.
Earnings before interest and taxes (EBIT) Earnings before interest and taxes (EBIT) stood at
€ 293,833 K in 2016, –27.0% below the corresponding figure for last year of € 402,715 K. As outlined above, the lower revaluation result was the key driver of the decline in annual comparison.
In regional terms, the Germany segment contributed the biggest share to Group EBIT with € 220,619 K, or 75%. On an EBIT basis, Austria generated € 14,696 K in 2016 (5%), with Eastern Europe contributing € 58,518 K (20%).
Financial result The financial result for 2016 was € –56,228 K, compared
to € –86,702 K last year. In detail, the elements of the fi-nancial result developed as follows:
The Group's financing costs, a key element in long-term earnings, fell sharply to € –41,622 K (2015: € –60,172 K). Loan repayments linked to sales and continual optimisa-tion of the financing structure had positive effects. Lower costs of floating-rate financing also had a positive impact.
In addition to interest paid as shown in the income statement, financing costs of € 3,832 K (€ 236 K in 2015) with a weighted average interest rate of 3.30% (2015: 1.66%) were capitalised in business year 2016 in connec-tion with the construction of real estate.
The result from interest rate derivative transactions de-livered a negative contribution of €–1,662 K (against €–15,299 K in 2015). In the previous year this item mainly contained reclassifications of negative cash val-ues of interest rate swaps previously recognised in equity which were realised in the period under review owing to the settlement of contracts.
The result from financial investments of € 7,229 K was lower than that for the reference period (€ 12,344 K in 2015). The value for last year primarily included accrued interest on loans to joint venture companies repurchased below par by the financing bank.
Other items in the financial result (other financial in-come/expense, result from other financial assets and re-sult from associated companies and exchange rate differ-ences) totalled € –20,174 K (€ –23,574 K in 2015). The result from other financial assets includes depreciation linked to the subsequent valuation of securities available for sale of € –15,768 K.
Earnings before taxes (EBT) On the basis of the earnings performance outlined
above, earnings before taxes (EBT) of € 237,605 K de-clined by –24.8% year-on-year (2015: € 316,013 K).
Taxes on income Taxes on earnings amounted to € –53,688 K in 2016
(compared to €–95,174 K in 2015).
Result for the period The result for the period was €183,910 K, –16.7% below
the previous year's value of € 220,839 K. Earnings per share amounted to € 1.94 on 31 December 2016 (€ 2.25 per share in 2015).
Cash flow Gross cash flow stood at €130,052 K in 2016, compared
to € 102,898 K in 2015. Cash flow from operating activi-ties takes account of changes in current assets linked to the sale of properties intended for trading and totalled € 125,368 K in 2016 (€ 113,157 K in 2015).
Cash flow from investment activities, which comprises the net balance between investments and real estate sales, stood at € 39,474 K in 2016 compared to the previ-ous year’s value of € 101,548 K. Amongst other things, this item includes the acquisition of Millennium Towers in Budapest.
Cash flow from financing activities of € 23,455 K (€–171,372 K in 2015) includes the corporate bond issu-ances in February and July 2016 with a total a volume of € 290 m.

GROUP MANAGEMENT REPORT
64
CASH FLOW STATEMENT: SHORT VERSION
€ m 2016 2015 Change
in %
Cash flow from
- business activities 125.4 113.2 11
- Investment activities 39.5 101.5 –61
- financing activities 23.5 –171.4 n.m.
Changes in cash and cash
equivalents 188.3 43.3 n.m.
Cash and cash equivalents
- beginning of the business year 207.1 163.6 27
- changes in the value of foreign
currency –0.3 0.1 n.m.
- the end of the business year 395.1 207.1 91
Funds from operations (FFO) An FFO I of € 91,712 K was generated in 2016, 13.6%
above the previous year's value of € 80,766 K. FFO I per share stood at € 0.97 at the reporting date, an increase of 18.3% in year-on-year comparison (2015: € 0.82 per share). The FY 2016 guidance of > € 0.90 per share was therefore solidly exceeded by 7.3%. FFO I, a key indica-tor of the Group's long-term earnings power, is reported before taxes and adjusted for the sales result and other non-permanent effects.
FFO II, which includes the sales result and applicable taxes and indicates the Group’s overall profitability to-talled € 113,671 K (€ 121,155 K in 2015). FFO II per share amounted to € 1.20 at the reporting date (2015: € 1.24 per share).
FUNDS FROM OPERATIONS (FFO)
€ m 2016 2015
Net rental income (NRI) 147.1 135.6
Result from hotel operations 0.0 0.3
Income from services rendered 13.3 16.2
Other expenses directly related to
properties under development –2.3 –2.2
Other operating income 0.9 1.5
Other operating income/expenses 11.8 15.8
Indirect expenses –44.1 –42.5
Result from investments in joint ventures 1) 7.9 14.8
Finance costs –41.6 –60.2
Result from financial investments 7.2 12.3
Other adjustment 2) 3.4 4.8
FFO I (excl. Trading and pre taxes) 91.7 80.8
Trading result 9.4 3.1
Result from the sale of investment
properties 23.3 36.5
Result from sale of joint ventures 0.9 0.7
At-Equity result property sales 3.9 9.4
Result from property sales 37.6 49.7
Other financial results 0.0 0.2
Current income tax –10.1 –36.6
current income tax of joint ventures –1.6 –1.1
Other adjustments –3.9 –6.0
Other adjustments FFO II 0.0 34.2
FFO II 113.7 121.2 1) Adjustment for real estate sales and non-sustainable results 2) Adjustment for other non-sustainable results

GROUP MANAGEMENT REPORT
GR
OU
P M
AN
AG
EM
EN
T R
EP
OR
T
65
BALANCE SHEET ANALYSIS
Assets As at the balance sheet date, long-term assets amounted
to € 3,659,806 K (84.9% of total assets). The growth of in-vestment property assets on balance sheet to € 2,923,676 K (€ 2,714,305 K as at 31 December 2015) was among other factors driven by the acquisition of the Millennium Towers office complex in Budapest.
The balance sheet item ‘Property assets under develop-ment’ increased by 5.9% to € 433,049 K compared to 31 December 2015. Total property assets (investment proper-ties, hotels and other properties used for own purposes, property assets under development and property assets held as current assets) amounted to € 3,424,269 K on the key date, hence up on the level for the end of 2015 (€ 3,203,435 K).
The net assets of joint ventures are shown in the bal-ance sheet item ‘Investments in joint ventures’, which stood at € 191,369 K on the key date (€172,286 K in 2015).
Cash and cash equivalents stood at € 395,088 K on the balance sheet date, well above the level for 31 December 2015 (€ 207,112 K).
Liabilities Equity At year end, the Group’s equity stood at € 2,204,541 K,
4.0% up compared to € 2,120,450 K on 31.12.2015. Aside from the result for the period of € 183,910 K, this also re-flects the payment of a dividend (€ -47,904 K) and the ac-quisition of own shares (€ -54,773 K). As at 31 December 2016, the negative valuation result of these cash flow hedges recognised in equity stood at € -3,201 K. Despite the increase in assets, the equity ratio of 51.2% as at the key date remained stable and within the strategic target range (31.12.2015: 53.2%).
Interest-bearing liabilities As at the key date, interest-bearing liabilities amounted
to € 1,565,639 K, 11.5% above the previous year’s value of € 1,403,989 K. Net debt (interest-bearing liabilities less cash and cash equivalents) declined from € 1,191,446 K in the previous year to € 1,167,656 K. Gearing (ratio of net debt to shareholders’ equity) was 53.0% at year end (31.12.2015: 56.2%). Year on year, the loan-to-value ratio (financial liabilities less cash and cash equivalents to property assets) fell from 37.2% to 34.2%.
100% of interest-bearing financial liabilities are in eu-ros. CA Immo has a comprehensive interest rate hedging strategy to hedge against interest rate risk; for more de-tails, see the section on ‘Financing’.
KEY FINANCING FIGURES
€ m 2016 2015
Shareholders' equity 2,204.5 2,120.5
Long-term interest-bearing liabilities 1,412.6 858.8
Short-term interest-bearing liabilities 153.0 545.2
Cash and cash equivalents -395.1 -207.1
Restricted cash -2.9 -5.4
Net debt 1,167.7 1,191.4
Equity ratio 51.2 53.2
Gearing 53.0 56.2
Loan to Value (Net) 34.2 37.2
EBITDA/Net interest expenses 1 (factor) 3.8 3.0 1) Net interest expenses: Finance costs minus Result from financial invest-ments

GROUP MANAGEMENT REPORT
66
CONSOLIDATED STATEMENT OF FINANCIAL POSITION: SHORT VERSION
2016 2015 restated Change
€ m in % € m in % in %
Properties 3,363.4 78.052 3,130.3 79 7
Investments in joint ventures 191.4 5 172.3 4 11
Intangible assets 8.2 0.190 11.6 0 –29
Financial and other assets 95.3 2.212 140.5 4 –32
Deferred tax assets 1.6 0.036 2.4 0 –34
Long-term assets 3,659.8 85 3,457.1 87 6
Assets held for sale 26.8 1 54.0 1 –50
Properties held for trading 34.1 1 22.1 1 55
Receivables and other assets 91.8 2 138.4 3 –34
Securities 101.6 2 105.3 3 –4
Cash and cash equivalents 395.1 9 207.1 5 91
Short-term assets 649.3 15 526.9 13 23
Total assets 4,309.1 100 3,984.0 100 8
Shareholders' equity 2,204.5 51 2,120.5 53 4
Shareholders' equity as a % of total assets 51.2% 53.2%
Long-term interest-bearing liabilities 1,412.6 33 858.8 21 64
Short-term interest-bearing liabilities 153.0 3 545.2 14 –72
Other liabilities 299.0 7 262.2 7 14
Deferred tax assets 240.0 6 197.4 5 22
Total liabilities and shareholders' equity 4,309.1 100 3,984.0 100 8
Net asset value NAV (shareholders’ equity) stood at € 2,204,495 K on 31
December 2016 (€ 23.60 per share) against € 2,120,410 K at the end of 2015 (€ 21.90 per share); this represents an increase per share of 7.8%. Aside from the annual result, the change reflects the other changes to equity outlined above. Adjusted to account for the dividend payment of € 47,904 K, the growth in NAV per share for business year 2016 was 10.0%.
The table below shows the conversion of NAV to NNNAV in compliance with the best practice policy rec-ommendations of the European Public Real Estate Asso-ciation (EPRA). The EPRA NAV was € 26.74 per share as at the key date (2015: € 24.32 per share). The EPRA NNNAV per share after adjustments for financial instru-ments, liabilities and deferred taxes, stood at € 24.56 per share as at 31 December 2016 (€ 22.69 per share in 2015). The share buyback programme has steadily reduced the number of shares outstanding to 93,405,017 on the key date (96,808,336 on 31.12.2015).

GROUP MANAGEMENT REPORT
GR
OU
P M
AN
AG
EM
EN
T R
EP
OR
T
67
NET ASSET VALUE (NAV AND NNNAV AS DEFINED BY EPRA)
€ m 31.12.2016 31.12.2015
Equity (NAV) 2,204.5 2,120.5
Exercise of options 0.0 0.0
NAV after exercise of options 2,204.5 2,120.5
NAV/share in € 23.60 21.90
Value adjustment for 1)
- Own used properties 6.0 5.1
- Short-term property assets 39.9 24.3
- Financial instruments 3.2 5.1
Deferred taxes 243.9 199.4
EPRA NAV after adjustments 2,497.5 2,354.4
EPRA NAV per share in € 26.74 24.32
Value adj. for financial instruments –3.2 –5.1
Value adjustment for liabilities –24.2 –8.9
Deferred taxes –175.7 –144.1
EPRA NNNAV 2,294.4 2,196.3
EPRA NNNAV per share in € 24.56 22.69
Change of NNNAV against previous year 8.3% 11.4%
Price (31.12.) / NNNAV per share – 1 –28.9 –25.8
Number of shares excl. treasury shares 93,405,017 96,808,336
1) Includes proportionate values from joint ventures

GROUP MANAGEMENT REPORT
68
LIKELY DEVELOPMENTS AND THE MAIN OPPORTUNITIES AND RISKS
Many forecasts, including that of the European Commis-sion, point to positive economic development in Europe in the years 2017 and 2018. We believe the general condi-tions on CA Immo’s core markets should remain condu-cive to business. With the environment in Germany re-maining fundamentally strong, core markets in Eastern Europe are also reporting clear growth trends. The financ-ing and interest environment will continue to define the real estate sector in 2016.
Strategy The strategic programme for 2012-2015, which was suc-
cessfully implemented ahead of time, was succeeded last year by a new strategic agenda for 2015-2017. Alongside the finalising of sales of non-strategic properties and fur-ther optimisation of the financing structure, the focus for CA Immo now fully turns to expansion of real estate port-folios in the company’s defined core markets. The main aim will be to continuously raise the profitability of the CA Immo Group over the long term. For more information and details, please refer to the ‘Strategy’ section.
Development The development of high quality core office properties
on the core markets of CA Immo as a driver of organic growth, especially in Germany, will remain critically im-portant in the business years ahead and should further gain momentum. In 2016 specific efforts will be made to advance development projects under construction in Ber-lin (KPMG, Rieck I and Cube office projects), Frankfurt (Steigenberger Hotel), Mainz (Rheinallee III office) Bucha-rest (Orhideea Towers) and Vienna (ViE office, Laendyard residential).
Moreover, dates for the commencement of construction work will quickly be assigned to development projects at the preparation stage. At present, this applies to the MY.O office project and NEO (hotel/office) as well as Eggarten-siedlung (residential) in Munich and the ZigZag office project in Mainz. Investment in ongoing development projects should average € 150-200 m annually. For more
information and details, please refer to the ‘Project devel-opment’ section.
Rental business In like-for-like comparison, rental levels are expected to
be generally stable across the portfolio. The increase in rent from the Millennium Towers office complex acquisi-tion in Budapest should more than make up for losses of rent linked to finalised sales of non-strategic properties as part of portfolio optimisation. The level of portfolio utili-sation, which has risen steadily over recent years, is ex-pected to be stable.
Financing The environment for refinancing from expiring project
financing of the CA Immo Group is still assessed as posi-tive. In the property development area, we also expect the availability of bank financing under competitive condi-tions to remain healthy on our core market of Germany. With the corporate bond issue 2017-2024 in February 2017, we have already achieved one of our main financ-ing goals in 2017. For more information and details, please refer to the ‘Financing’ section.
Our expectations are based on certain assumptions re-garding general and specific conditions. Key factors that may influence our business plans for 2017 include:
– Economic developments in the regions in which we op-erate and their impact on demand for rental premises and rental prices (key indicators comprise GDP growth, unemployment and inflation).
– The general progression of interest rates. – The financing environment as regards availability and
the cost of long-term financing with outside capital and, accordingly, the development of the market for real es-tate investment, price trends and their impact on the valuation of our portfolio. The speed at which planned development projects are realised will also depend largely on the availability of necessary external loan capital and equity.
– Political, fiscal, legal and economic risks; the transpar-ency and development level on our real estate markets.
OUTLOOK

GROUP MANAGEMENT REPORT
GR
OU
P M
AN
AG
EM
EN
T R
EP
OR
T
69
The strategic focus of business activity at CA Immo is the sustained increased the value of the company. This is supported by key financial performance indicators which are important tools to identify the factors that contribute to the sustained increase in enterprise value and quanti-fying those factors for the purposes of value management.
The primary financial performance indicator is return on equity or RoE. The aim is to produce a figure higher than the calculatory cost of capital (assuming a medium-term rate of around 7.0%), thus generating shareholder value. At 8.5% in 2016 (2015: 10.8%), this figure was above the target value. On the basis of our Strategy 2015-2017 programme, an adequate RoE is to be generated in the medium term on a sustainable basis, one that exceeds the cost of equity (see the "Strategy" section). The other quantitative factors used to measure and manage our shareholders' long-term return include the change in NAV per share, operating cash flow per share, and Funds from Operations (FFO I) per share (please refer to the ta-ble “Balance Sheet” and “Key Figures per Share” in the flap of the annual report).
Since the key financial indicators ultimately demon-strate the operational success of the property business, they are preceded by a series of other non-financial per-formance indicators which are key to measuring and managing the operational business. See the "Investment Properties" section for a presentation of these perfor-mance indicators.
The key performance indicators of operational prop-erty business are as follows:
– The vacancy rate indicates the quality of the portfolio and our success in managing it. With an occupancy rate of 92.4%, CA Immo is above market average.
– The quality of a location and its infrastructure are criti-cal to the marketability of properties. The majority of CA Immo office properties are situated in CBD- or cen-tral business locations of central European cities.
– Sustainability Certificate: As at reporting date, 60%1) of the CA Immo office space stock is certified according to LEED, DGNB or BREEAM standard (please refer to sec-tion Sustainability).
– Local presence and market knowledge: CA Immo has branch offices on its core markets to ensure efficient management and tenant retention
1) Basis: office properties with a value > € 10 m
FINANCIAL PERFORMANCE INDICATORS

GROUP MANAGEMENT REPORT
70
Stable employee structure As at 31 December 2016 the number of international em-
ployees almost remained constant at 3631) employees across the Group (31.12.2015: 3572)). Germany is CA Immo’s core market for staff with around 45% work-ing here, followed by Eastern Europe (29%) and Austria (21%). 77 employees worked for the wholly owned spe-cialist construction subsidiary omniCon as at the key date.
Branch offices on core markets CA Immo has head offices in Vienna, from where the
company also oversees local branch offices in Frankfurt, Berlin and Munich as well as Budapest, Warsaw, Prague, Bucharest and Belgrade. The branch offices employ re-gional staff at both employee and managerial level; new appointments are made by agreement with local branch managers and the Group’s Human Resources department.
Employee profit sharing scheme CA Immo envisages variable profit sharing for all em-
ployees linked to the attainment of budgeted annual tar-gets and positive consolidated net income. Managerial staff have the additional option of participating in a long term incentive programme. This employee participation model takes account of mid- to long-term value creation at CA Immo, which is measured in terms of growth in NAV (net asset value), TSR (total shareholder return) and growth in FFO (funds from operations). For full details, refer to the remuneration report.
KEY ASPECTS IN HUMAN RESOURCES MANAGEMENT
Promoting personal career paths, establishing and en-hancing professional expertise and management skills, team building measures, organisational develop-ment and company health promotion are the cornerstones of human resource management at CA Immo.
Training the next generation Since the start of 2016, the CA Immo Academy has of-
fered training and modular courses in the three core areas of professional expertise, social skills and health. In 2016, in partnership with IREBS (the International Real Estate Business School of the University of Regensburg), CA Immo also launched an evaluation course in which CA Immo staff may participate. The curriculum covers everything from international real estate valuation and land valuation to financial and technical due diligence. The aims of the ‘Fit for Future’, the company’s pro-gramme of promoting young talent whose working groups were upheld in 2016, are innovation and international networking.
PERSONNEL DISTRIBUTION WITHIN THE CA IMMO GROUP
31.12.2016 31.12.2015 Change Joining /
Leaving
Fluctuation
rate 1)
Total employees
(Headcounts)
Thereof
women in %
Total employees
(Headcounts)
absolute in % in %
Austria 77 55 75 2 3 8/8 10,2
Germany/Switzerland2) 180 42 184 -4 -2 19/12 10,9
Eastern Europe 106 77 98 8 8 25/17 24,7
Total 363 55 357 6 2 52/37 14,7
1) Includes employees on a leave of absence; excludes 12 headcounts of joint venture companies 2) Fluctuation rate: workforce attrition x 100 / average num-ber of employees
2) At the end of 2016, 18 local employees were appointed at the branch of wholly owned CA Immo construction subsidiary omniCon in Basel, which was founded in 2014
1) Of which around 10% are part-time staff; including 18 employees on unpaid leave across the Group. 2) Of which around 9% are part-time staff; including 21 employees on unpaid leave.
EMPLOYEES

GROUP MANAGEMENT REPORT
GR
OU
P M
AN
AG
EM
EN
T R
EP
OR
T
71
AVERAGE ABSENCES FROM WORK BY REGIONS
in days Vacation Illness1)
Qualificati
on
Austria
Women 21 5 4
Men 24 4 4
Germany
Women 28 12 3
Men 28 5 2
Eastern Europe
Women 18 6 7
Men 21 1 10 1) Excludes four long-term sick leave cases in Austria, Germany and Eastern
Europe. Including these long-term sick leaves, the average of sick leaves in Austria would be 6 (women) and for Germany also 6 (men) days and for woman in CEE 7 days.
Fit2Work: greater vigour and energy In the course of a continuous improvement process the
fit2work project ensures promoting and maintaining em-ployees’ capacity to work and performance levels. Reduc-
ing risks to health and establishing an early warning sys-tem (especially for burnout) with a view to preventing long-term sick leave and early retirements are being opti-mized.
Safety at work CA Immo employees on construction sites received reg-
ular safety guidance along with health and safety plans. Specific companies are tasked with ensuring the safety of subcontractor staff. A total of five accidents at work and while commuting were reported in Germany during re-porting year 2016, resulting in absences of not longer than one month in each case. No other serious occupational in-juries3), illnesses or absences by CA Immo employees were reported in 2016.
The corporate governance report contains details on measures aimed at advancing women and reconciling professional and family life.
1) Serious injuries are defined as those requiring the employee to consult a doctor

GROUP MANAGEMENT REPORT
72
SUPPLEMENTARY REPORT
The following activities are reported for the opening months of business year 2017:
Share buyback Until the publication of this report in March 2017, an-
other 34,727 treasury shares have been repurchased from the share buyback programme resolved in November 2016.
Acquisitions In January, CA Immo successfully concluded negotia-
tions with JV partner Union Investment concerning the acquisition of 49% holdings in the Danube House and In-fopark office buildings in Prague and Budapest respec-tively. As a result of the acquisition, CA Immo raised its holding in these properties from 51% to 100%; closing has been confirmed. The transaction, which represents another step in the expansion of the portfolio of core of-fice properties in CA Immo’s core cities, will make a posi-tive contribution of approximately € 3 m to long-term profitability (FFO I).
In February 2017 CA Immo issued a new corporate bond with a volume of €175 m and a term of seven years. The coupon for the fixed-rate bond was 1.875%. For full details, please refer to the Investor Relations section.
In March, CA Immo received the construction permit for the NEO office, hotel and residential complex, spanning 21,000 m² of gross floor space in Munich. Construction start for the complex was in March. The company tristar GmbH Hotelgruppe has been signed as long-term tenant for the hotel occupying the first six floors of the NEO property. CA Immo has also acquired the 50% stake in the development project previously held by PATRIZIA, and is now the sole owner.
RESEARCH AND DEVELOPMENT
Technological and social change continues to transform the office environment and the knowledge-based econ-omy. The challenge of developing office properties today and successfully managing them over usage periods of up to 30 years calls for far-sighted planning on the basis of relevant research. Since April 2016, CA Immo is a partner to the OFFICE 21® joint research project of the Fraunho-fer IAO Institute. The research phase extending from 2016
to 2018 is focusing on the success factors in creating a working environment that promotes innovation while linking analyses of best practice to exclusive research findings.
The cornerstones of the research activity are: – Devising exemplary working environments and pro-
cesses to optimise and stimulate the responsiveness and creativity of organisations
– Exploring different working cultures and subsequently producing optimised workplace models
– Developing answers to the changing requirements of of-fice environments through the increasingly hyper-flexi-ble, multi-site and digital workplace
The aim of the partnership is to produce specific re-
search findings to enable the development of innovative new office properties and thereby ensure the competitive-ness of the company for the long term.
EPRA REPORTING
To enhance transparency and facilitate comparisons with other listed property companies, CA Immo pub-lishes a range of key performance measures pursuant to EPRA (“European Public Real Estate Association“), the leading interest body for listed property companies, standards. These figures may differ from the values re-ported under IFRS guidelines. CA Immo applies the latest version of EPRA’s “Best Practices Recommendations” for the figures stated. These recommendations are available on the EPRA website (http://www.epra.com/regulation-and-reporting/bpr/).
EPRA KEY PERFORMANCE MEASURES 1)
31.12.2016
EPRA NAV € m 2,497.5
EPRA NAV per share € 26.74
EPRA NNNAV € m 2,294.4
EPRA NNNAV per share € 24.56
EPRA Net Initial Yield % 5.0
EPRA "topped-up" Net Initial Yield % 5.0 1) Incl. fully consolidated real estate (wholly owned by CA Immo) and real
estate in which CA Immo holds a proportional share (at equity)
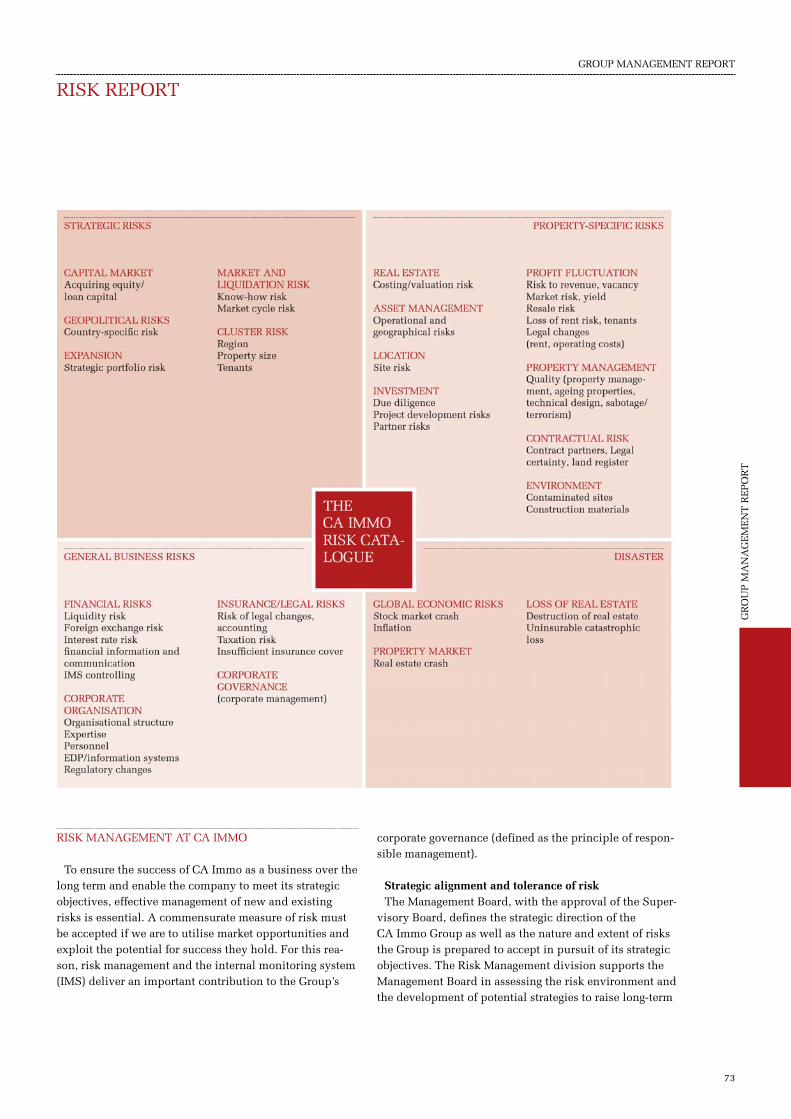
GROUP MANAGEMENT REPORT
GR
OU
P M
AN
AG
EM
EN
T R
EP
OR
T
73
RISK MANAGEMENT AT CA IMMO
To ensure the success of CA Immo as a business over the long term and enable the company to meet its strategic objectives, effective management of new and existing risks is essential. A commensurate measure of risk must be accepted if we are to utilise market opportunities and exploit the potential for success they hold. For this rea-son, risk management and the internal monitoring system (IMS) deliver an important contribution to the Group’s
corporate governance (defined as the principle of respon-sible management).
Strategic alignment and tolerance of risk The Management Board, with the approval of the Super-
visory Board, defines the strategic direction of the CA Immo Group as well as the nature and extent of risks the Group is prepared to accept in pursuit of its strategic objectives. The Risk Management division supports the Management Board in assessing the risk environment and the development of potential strategies to raise long-term
RISK REPORT
GROUP MANAGEMENT REPORT
74
shareholder value. The aim of this is to ensure the com-pany adopts the best possible direction from the alterna-tives available. CA Immo evaluates the opportunity/threat situation through quarterly reporting. Risk is assessed in relation to specific properties and projects as well as (sub)portfolios. The company incorporates early warning indicators such as rent forecasts, vacancy analyses, con-tinual monitoring of lease agreement periods and the pos-sibility of terminations; construction costs are also tracked during project implementation. Scenarios are en-visaged regarding the value trend for the real estate port-folio, exit strategies and liquidity planning; these supple-ment risk reporting and promote reliable planning. CA Immo observes the precautionary principle by apply-ing the full investment horizon to long-term planning and investment decisions. The company also evaluates spe-cific risks at regular intervals (most recently in 2015), fo-cusing on content, effect and likelihood of occurrence. The Management Board uses this data as the basis for de-termining the severity and type of risks that it regards as acceptable in pursuing its strategic objectives. Strategies adopted by the Management Board are incorporated into the Group’s three-year planning; this assists the Group in communicating its willingness to take risks and its expec-tations both internally and externally.
The risk policy of CA Immo is defined by a range of guidelines, observance of which is continually monitored and documented by controlling processes. Risk manage-ment is obligatory at all levels of the company. The Man-agement Board is involved in all risk-relevant decisions and bears overall responsibility for such decisions. At all levels, decisions are subject to the dual verification prin-ciple. Internal Auditing, an independent division, audits operational and business processes; it acts independently in reporting and evaluating the audit results. The audit committee is responsible for overseeing the proper func-tioning of risk management processes.
KEY FEATURES OF THE INTERNAL MONITORING SYSTEM (IMS)
CA Immo’s internal monitoring system covers all princi-ples, procedures and measures designed to ensure the ef-fectiveness, cost-effectiveness and correctness of account-ing as well as compliance with relevant legal regulations and company guidelines. The IMS is integrated into indi-vidual business processes, taking account of management processes. The objectives of the IMS are to preclude and
1 World Economic Forum: The Global Risks Report 2017, 12th edition.
expose errors in accounting and financial reporting, thus enabling amendments to be introduced in good time. Transparent documentation makes it possible to depict processes of accounting, financial reporting and audit ac-tivity. All operational areas are incorporated into the fi-nancial reporting process. Competent local management teams are responsible for implementing and monitoring the IMS; the managing directors of the subsidiaries are re-quired to perform self-checks in order to assess and docu-ment compliance with monitoring measures. The effec-tiveness of the IMS is regularly assessed by the Group Au-diting department and the cost-effectiveness of business processes is continually evaluated. The results of these assessments are reported to the responsible executive boards, the full CA Immo Management Board and (at least once a year) the audit committee. The proper functioning of the risk management system is evaluated annually by the Group auditor in line with the requirements of C Rule no. 83 of the Austrian Corporate Governance Code. The results are reported to the Management Board and the au-dit committee.
STRATEGIC RISKS
CA Immo defines strategic risk as the danger of unex-pected losses that can result from management policy de-cisions on the direction taken by the company. These risks generally arise from unexpected changes in the mac-roeconomic market environment. In 2017, for example, the World Economic Forum (WEF)1 is warning of particu-larly acute economic and social risks.
The global financial market and economic crisis and the sovereign debt crisis (especially in the eurozone) have in the past had a significant negative impact on the asset, financial and revenue positions of CA Immo. Another fu-ture crisis could have highly adverse consequences for CA Immo. Moreover, the effects of the relaxed monetary policy pursued by central banks over recent years cannot be foreseen at present. A further extension to the expan-sive monetary policy could lead to financial instability, potentially resulting in negative incentives for govern-ments, misallocation of investments and resources and the creation of asset and financial bubbles, all of which would impact adversely on economic growth. The possi-ble reintroduction of national currencies by individual eurozone members would have grave consequences for the economies and financial markets of Europe. Finally, the departure of other nations from European currency

GROUP MANAGEMENT REPORT
GR
OU
P M
AN
AG
EM
EN
T R
EP
OR
T
75
union could lead to a complete collapse of the monetary system. The current economic environment is character-ised by low interest rates and comparatively high valua-tions of real estate portfolios. An interest rate rise could have a negative effect on the property market and, in turn, the valuation of properties and the disinvestment plans of CA Immo. Acquiring equity and loan capital could be-come significantly more difficult, making expansion plans impossible or only partially feasible. There are also geopolitical factors which could potentially have nega-tive effects on the capital market; in the event of an exces-sive concentration of properties in one region, the impact on the earnings of the CA Immo Group could be substan-tial. In 2017, the economic environment will be defined by political challenges facing the USA, the results of elec-tions in Europe (France, Netherlands and Germany) and the progress of Brexit negotiations. Taken together with ongoing tensions such as the crisis in eastern Ukraine, sanctions against Russia, political instability in Turkey and the continuing civil war in Syria, these outcomes have the potential to throw economic development in Eu-rope into considerable doubt. The possibility that the re-sultant increase in volatility on capital and financial mar-kets will spread even to economically powerful countries like Austria and Germany – and their financial and real estate markets – cannot be ruled out. Many of these risks are not actively manageable; where they arise, CA Immo has a range of precautions in place to minimise the risk.
PROPERTY-SPECIFIC RISKS
Risks linked to the market environment and composition of the portfolio The real estate market is determined by macroeconomic
development and demand for properties. Economic insta-bility and restricted access to loan capital and equity-based financing can lead to business partners opting out. Where the liquidity of the real estate investment market is insufficient, there is a risk that sales of individual proper-ties with a view to strategically adjusting the real estate portfolio may prove impossible or only possible under unacceptable conditions. The general market environ-ment continues to pose the danger of starting yields for commercial real estate being adjusted upwards. Many fac-tors that can lead to unfavourable developments are out-side of CA Immo’s control. These include changes to available income, economic output, interest rates and tax policy. Economic growth, unemployment rates and con-
sumer confidence also influence supply and demand lev-els for real estate at a local level. This can affect market prices, rents and occupancy rates while adversely affect-ing the value of properties and associated income. For this reason, highly negative effects on earning power and property valuations cannot be ruled out.
CA Immo counters market risk by spreading its portfo-lio across various countries. CA Immo counters country-specific risk by concentrating on defined core regions through local subsidiaries with their own on-site staff, and through appropriate regional allocation within those core markets. Market knowledge, continual evaluation of strategy and monitoring of the portfolio and purposeful portfolio management in the context of strategic decision-making (e.g. defining exit strategies, medium-term plan-ning of sales) enable the company to respond quickly to economic and political events. CA Immo negates transfer risk by repatriating liquid assets from investment markets with a low credit standing. Active portfolio management is aimed at minimising concentration risk. In the wake of numerous sales over the past few years (partial sale of Tower 185, sale of the Hesse portfolio and non-core prop-erties, and especially the logistics portfolio), regional dis-tribution in the portfolio is approaching the desired levels of 40% for both Eastern Europe and Germany and 20% for Austria. Germany remains the biggest single market of CA Immo. The aim here is to maintain property assets of € 250-300 m per core city to uphold consistent market relevance. For single investments, CA Immo defines con-centration risk as a limit value of 5% of the total portfo-lio. The only property in this category at present is Tower 185 in Frankfurt. The concentration risk in respect of sin-gle tenants is manageable. At present, the top 15 tenants are generating some 28% of rental revenue. Accounting for a share of approximately 6% of total rental income, PricewaterhouseCoopers is the largest single tenant in the portfolio at present. The generally high risk arising from the high capital commitment to land reserves and land development projects was steadily reduced through the sale of non-strategic land reserves. In addition, land de-velopment will be accelerated and partners involved at an early stage. The development volume is indicated at ap-proximately 15% of the equity of the CA Immo Group.
Political and economic trends in the countries in which CA Immo is active also have a significant impact on occu-pancy rates and rent losses. The earning power and mar-ket value of a property is adversely affected where the

GROUP MANAGEMENT REPORT
76
Group is unable to extend a rental agreement due to ex-pire under favourable conditions or find (and retain for the long term) suitably solvent tenants. The creditworthi-ness of a tenant, especially during an economic down-turn, may diminish over the short or medium term, which can affect rental revenue in turn. In critical situations, the Group can opt to cut rents in order to maintain an ac-ceptable occupancy rate. Through careful monitoring and proactive measures (such as demanding securities and screening the creditworthiness and reputation of tenants), the Group’s loss of rent risk has settled at the low level of under 1% of rental income. At present, most outstanding rental payments relate to Eastern Europe. All outstanding receivables are evaluated quarterly and adjusted accord-ing to the associated level of risk; around 25% of out-standing receivables are adjusted on average. The risk of lost rent was taken into account to a sufficient degree in the estimation of property values. Many of the Group’s lease agreements contain stable value clauses, usually taking account of consumer price indices for particular countries. The level of revenue from such rental contracts and new lettings depends heavily on the inflation trend (sustainable value risk).
Competition for reputable tenants is intense on the let-tings market; rent levels are coming under pressure on many markets. To remain attractive to tenants, CA Immo could be forced to accept lower rental rates. Moreover, in-correct assessments of the attractiveness of locations or potential usages can make lettings more difficult or sig-nificantly impair desired lease conditions.
The Group’s portfolio also includes special asset classes such as shopping malls, specialist retail centres and ho-tels whose operation involves certain risks. Poor running of the centre, inadequate corporate management of ten-ants, declining footfall and increasing competition can force rental rates down and lead to the loss of key tenants, which leads to rent losses and problems with new let-tings. For this reason, the Group’s earnings situation also depends on the quality of hotel management and the de-velopment of hotel markets.
Risks associated with the project development area Costs are generally sustained at the early stages of real
estate development projects; revenue is not generated un-til the later phases of a project. Many development pro-jects may be associated with cost overruns and delays in completion that are frequently caused by factors beyond the control of CA Immo. This can adversely affect the eco-
nomic viability of individual projects and lead to contrac-tual penalties and compensation claims. If no suitable tenants are found, this can produce vacancy after comple-tion. CA Immo takes various steps to keep such risks largely under control (cost monitoring, variance analyses, long-term liquidity planning and so on). With few excep-tions (especially in Germany), projects are only launched subject to appropriate pre-letting. All projects are being implemented within their approved timeframes and budgetary frameworks. Currently there are proceedings pending relating to two legally binding building permits at Erdberger Lände site in Vienna. A neighbour claims the unlawfulness of the building permits. CA Immo and its legal advisors believe that there are no grounds for enti-tlement to change or annul the building permits or any compensation claims of the neighbour.
Risks associated with sales transactions Sales transactions can give rise to risks linked to con-
tractual agreements and assurances. These might relate to guaranteed income from rental payments, and can subse-quently reduce purchase sums agreed or received. Suffi-cient financial provisions have been made in response to recognised risks to revenue from transacted sales, and li-quidity risk is considered in liquidity planning. Contrac-tual obligations in the form of follow-on costs (e.g. resid-ual construction work) form part of relevant project cost estimates.
Environmental risks Environmental and safety regulations serve to standard-
ise active and latent obligations to remediate contami-nated sites, and complying with these provisions can en-tail considerable investment expenses and other costs. These obligations may apply to real estate currently or formerly owned by CA Immo, or currently or formerly managed or developed by the company. In particular, the provisions cover contamination with undiscovered harm-ful materials or noxious substances, munitions and other environmental risks such as soil pollution, etc. Several regulations impose sanctions on the discharge of emis-sions into air, soil and water: this can make CA Immo lia-ble to third parties, significantly impact the sale and let-ting of affected properties and adversely affect the genera-tion of rental revenue from such properties. Natural dis-asters and extreme weather conditions can also cause considerable damage to real estate. Unless sufficient in-surance is in place to cover such damage, this can have an adverse impact. To minimise the risk, CA Immo incor-porates these considerations into its assessments prior to every purchase and appropriate guarantees are required

GROUP MANAGEMENT REPORT
GR
OU
P M
AN
AG
EM
EN
T R
EP
OR
T
77
from sellers. Wherever possible, the CA Immo Group makes use of environmentally sustainable materials and energy-saving technologies. CA Immo observes the eco-logical precautionary principle by ensuring all (re)devel-opment projects qualify for certification: in this way, stringent specifications regarding green buildings and sustainability are satisfied while the usage of environ-mentally unsound products is also ruled out.
GENERAL BUSINESS RISKS
Operational and organisational risks Weaknesses in the CA Immo Group’s structural and
process organisation can lead to unexpected losses or ad-ditional expenditure. This risk can arise from shortcom-ings in EDP and other information systems as well as hu-man error and inadequate internal inspection procedures. Flawed program sequences as well as automated EDP and information systems pose a significant operational risk where their type and scope fail to take account of busi-ness volumes or they are vulnerable to cybercrime. Hu-man risk factors include an insufficient understanding of corporate strategy, inadequate internal risk monitoring (and especially business process controls) and excessive decision-making authority at an individual level, which can also lead to unconsidered actions or, conversely, a proliferation of decision-making bodies that hinder flexi-ble responses to changes in the market. Moreover, some real estate management tasks and other administrative duties are outsourced to third parties outside the com-pany. In the process of transferring administrative tasks, it is possible that knowledge of managed properties and administrative processes can be lost, and that CA Immo could prove incapable of identifying and contractually committing suitable service providers within the neces-sary timeframe. Nonetheless, the expertise possessed by a company and its workforce constitutes a significant com-petitive factor and a unique point of distinction over com-petitors.
CA Immo takes various measures to counter these risk factors. In the case of corporate mergers (e.g. the former Vivico and Europolis), CA Immo observes structured pro-cesses of organisational integration. Process organisation (i.e. system/process integration) is firmly established; ac-tivities to ensure the long-term implementation of opera-tional processes are ongoing. The Group structure is regu-larly scrutinised and examined to ensure predefined structures take account of the size of the company.
CA Immo counters risks linked to individual expertise (which can arise with the resignation of key knowledge holders) through regular transfers of knowledge (in train-ing courses) and by documenting know-how (in manuals, etc.) as well as far-sighted staff planning.
Legal risks In the course of normal business activity the companies
of the Group become involved in legal disputes, both as plaintiffs and as defendants. Such cases are heard in vari-ous jurisdictions. In each case, different procedural law means that competent courts are not always equally effi-cient; moreover, in certain cases the complexity of issues in dispute can make for protracted proceedings or lead to other delays. CA Immo believes it has made sufficient fi-nancial provisions for legal disputes. At present, no law-suits or arbitration proceedings that could threaten the company’s survival are imminent or pending.
It is not possible to predict changes to legal provisions, case law and administrative practice or their impact on business results; such changes may adversely affect real estate values or the cost structure of the CA Immo Group.
Organised crime, and particularly fraud and extortion, is a general risk to commercial activity. Many countries con-tinue to perform very poorly in combating corruption. Such illegal activity can lead to considerable financial re-percussions and negative publicity.
Taxation risk For all companies, rental revenue, capital gains and
other income is subject to income tax in the respective country. Important discretionary decisions must be taken regarding the level of tax provisions that need to be formed. The extent to which active deferred taxes are rec-ognised must also be determined.
Subject to compliance with certain requirements, reve-nue from the sale of participating interests is fully or par-tially exempted from income tax. Even where a com-pany’s intention is to meet the requirements, passive de-ferred taxes are fully applied to property assets according to IAS 12.
Key assumptions must also be made regarding the ex-tent to which deductible temporary differences and loss carry forwards are set off against future taxable profits, and thus the extent to which active deferred taxes can be recognised. Uncertainty arises regarding the amount and

GROUP MANAGEMENT REPORT
78
timing of future income and the interpretation of complex tax regulations. Where there is uncertainty over the appli-cation of income tax to business transactions, an assess-ment will be required as to whether or not the responsible tax authority is likely to accept the interpretation of the tax treatment of such transactions. On the basis of that as-sessment, the CA Immo Group enters the tax obligation as the most likely amount in case of doubt. Such doubt and complexity can mean that future tax payments are signifi-cantly higher or lower than the obligations assessed as probable and recognised in the balance sheet.
The CA Immo Group holds a large part of its real estate portfolio in Germany, where many complex tax regula-tions must be observed. In particular, these include (i) provisions on the transfer of hidden reserves to other as-sets, (ii) legal regulations on real estate transfer tax charges and the possible accrual of real estate transfer tax in connection with direct or indirect changes of control in German partnerships and corporations and (iii) the de-duction of input taxes on construction costs in the case of development projects. The CA Immo Group makes every effort to ensure full compliance with all tax regulations. Nonetheless, there are circumstances (some of which are outside the CA Immo Group’s control) such as changes to the shareholding structure, changes in legislation or changes in interpretation on the part of tax authorities and courts which could lead to the aforementioned taxa-tion cases being treated differently, which in turn would influence the assessment of tax in the consolidated finan-cial statements.
Partner risks Since CA Immo undertakes numerous development pro-
jects as joint ventures, the company depends on the sol-vency and performance capability of partners to an extent (partner risks). Moreover, the Group is exposed to credit risk in respect of its counterparties. Depending on the agreement in question, CA Immo could also bear joint lia-bility for costs, taxes and other third-party claims with its co-investors and, where a co-investor opts out, be forced to accept liability for their credit risk or share of costs, taxes or other liabilities.
FINANCIAL RISKS
Liquidity, investment and refinancing risk (Re)financing on the financial and capital markets is
one of the most important considerations for real estate companies. CA Immo requires loan capital to refinance
existing loans and to finance development projects and acquisitions in particular. In effect, therefore, the com-pany is dependent on the readiness of banks to provide additional loan capital and extend existing financing agreements under acceptable terms. Market conditions for real estate financing are constantly changing. The attrac-tiveness of financing alternatives depends on a range of factors, not all of which can be influenced by the Group (market interest rates, level of necessary financing, taxa-tion aspects, required securities and so on). This can sig-nificantly impair the ability of the Group to raise the com-pletion level of its development portfolio, invest in suita-ble acquisition projects or meet its obligations arising from financing agreements. Although the CA Immo Group has a sufficient level of liquidity as things stand, we must take account of restrictions at individual subsidiary level; access to cash and cash equivalents is limited owing to obligations to current projects and a liquidity requirement to stabilise loans exists in certain instances. There is also a risk that planned sales will be prevented, delayed or transacted at prices lower than expected. Other risks arise from unforeseen additional funding obligations in rela-tion to project financing and breaches of covenant in the property financing area. Where these requirements are vi-olated or default occurs, the relevant contractual partners are entitled to accelerate financing and demand immedi-ate repayment. This could impel the Group to sell real es-tate or arrange refinancing under unfavourable terms.
CA Immo has fluctuating stocks of cash and cash equiv-alents which the company invests according to its partic-ular operational and strategic needs and objectives. In some cases, an investment may take the form of listed se-curities or funds, which are subject to a higher risk of loss. Sufficient equity capitalisation will be required for the company to retain its Baa2 investment grade (long-term issuer) rating (granted by Moody’s in December 2015). The planned repayment of financial liabilities in Eastern Europe will expand the pool of unencumbered as-sets – a key criterion in the company’s investment grade rating.
CA Immo counters risk of this kind by continually mon-itoring covenant agreements and effectively planning and securing liquidity. The financial consequences of strate-gic aims are also taken into account. This also ensures the Group can meet unexpected cash flow requirements. To this end, various liquidity deployment measures have been identified and successfully implemented in some in-stances. The use of trading income to repay liabilities fall-

GROUP MANAGEMENT REPORT
GR
OU
P M
AN
AG
EM
EN
T R
EP
OR
T
79
ing due in the next two years has had a highly positive ef-fect on the maturity profile, which is now largely stable for the years ahead. In line with the investment horizon for real estate, loans are invariably agreed on a long-term basis. As an alternative and supplement to established means of (equity) capital procurement, the company en-ters into equity partnerships (joint ventures) at project level. Even with meticulous planning, however, liquidity risk cannot be eliminated, particularly where capital re-quests linked to joint venture partners are not viable. CA Immo Deutschland has a high capital commitment, which is typical in the case of development projects. Fi-nancing has been secured for all projects under construc-tion; additional financing is required for new project launches.
Interest rate risk Market-led fluctuations in the interest rate affect both
the level of financing costs and the fair value of interest hedging transactions concluded. For financing purposes, CA Immo uses banks at home and abroad and issues cor-porate bonds, thereby opting for a mix of long-term fixed-rate and floating-rate loans. To hedge against impending interest rate changes and associated fluctuations in fi-nancing costs, greater use is made of derivative financial instruments (interest rate caps and swaps) in the case of floating-rate loans. However, hedging transactions of this kind may prove to be inefficient or unsuitable for achiev-ing targets; they may also result in losses that affect earn-ings. Moreover, the valuation of derivatives can impact negatively on profits and shareholders’ equity. The extent to which the Group utilises derivative instruments is guided by assumptions and market expectations in re-spect of the future interest level, and especially the 3 month Euribor rate. Should these assumptions prove in-correct, the result can be a significant rise in interest ex-penditure. Continual monitoring of the interest rate risk is therefore essential. No risks constituting a serious and permanent threat to the company exist at the present
time. Sufficient provisions have been formed for all risks identified. Repayment of the 5.125% bond in September 2016 has brought about a further significant improvement in average borrowing costs as well as the maturity profile while raising the quota of hedged financial liabilities; the issue of another corporate bond, proceeds from which will mainly be used to reschedule existing loans in east-ern Europe and substitute planned loans, has also con-tributed to this.
Currency risk Since CA Immo is active on a number of markets out-
side the eurozone, the company is subject to various cur-rency risks. Where rents are payable in currencies other than the euro on these markets and cannot be fully ad-justed to current exchange rates in time, incoming pay-ments may be reduced by exchange rate changes. Where expenses and investments are not transacted in euros, ex-change rate fluctuations can impair the payment capacity of Group companies and adversely affect the Group’s profits and earnings situation. CA Immo generally coun-ters such risk in that foreign currency inflows are secured by pegging rents to the euro; no significant and direct cur-rency risk exists at present. The pegging of rents affects the creditworthiness of tenants and thus produces an in-direct currency risk that can result in payment bottle-necks and loss of rent. Since incoming payments are mainly received in local currency, however, free liquidity (rental revenue less operating costs) is converted into eu-ros upon receipt. This process is continually overseen by the responsible country coordinators. There is no cur-rency risk on the liabilities side. Currency risks linked to construction projects are hedged according to need on a case-by-case basis, taking account of the currency under-lying the order and lease agreement, likely exchange rate development and the calculation rate. In addition, with fluctuating exchange rates, property values might be af-fected when converted to an investor’s domestic currency (exit risk).

GROUP MANAGEMENT REPORT
80

CONSOLIDATED FINANCIAL STATEMENTS 2016
KONTORHAUSMunich

CONSOLIDATED FINANCIAL STATEMENTS
82
A. CONSOLIDATED INCOME STATEMENT FOR THE YEAR ENDED 31.12.2016 84
B. CONSOLIDATED STATEMENT OF COMPREHENSIVE INCOME FOR THE YEAR ENDED 31.12.2016 85
C. CONSOLIDATED STATEMENT OF FINANCIAL POSITION AS AT 31.12.2016 86
D. CONSOLIDATED CASH FLOW STATEMENT FOR THE YEAR ENDED 31.12.2016 87
E. CONSOLIDATED STATEMENT OF CHANGES IN EQUITY FOR THE YEAR ENDED 31.12.2016 88
F. NOTES TO THE CONSOLIDATED FINANCIAL STATEMENTS AS AT 31.12.2016 90
1. Information concerning the Company 90 2. Accounting principles 90 3. Significant aspects of presentation and accounting principles 90 a) Presentation and structuring of group notes 90 b) Significant judgments, assumptions and estimates 90 4. Scope of consolidation 96 5. Summarized presentation of accounting methods 99 a) Changes in the accounting methods 99 b) Consolidation methods 99 c) Foreign currency translation 100 d) Properties 102 e) Intangible assets 107 f) Impairment losses 108 g) Financial assets and liabilities (FI - financial instruments) 108 h) Income from services rendered 111 i) Construction work 111 j) Other non-financial instruments (Non-FI – non financial instrument) 111 k) Assets held for sale and disposal groups 111 l) Payment obligations to employees 112 m) Provisions and contingent liabilities 113 n) Taxes 114 o) Leases 114 p) Operating segments 115 q) Revenue recognition 115 r) Result from the sale of investment properties 117 s) Indirect expenses 117 t) Financial result 117 u) Fair value measurement 118 v) New and revised standards and interpretations 122 NOTES TO THE CONSOLIDATED INCOME STATEMENT, CONSOLIDATED STATEMENT OF COMPREHENSIVE INCOME, CONSOLIDATED STATEMENT OF FINANCIAL POSITION AND CONSOLIDATED CASH FLOW STATEMENT 125 1. Segment reporting 125 2. Rental income 130 3. Result from operating costs and other expenses directly related to properties rented 131 4. Result from hotel operations 131 5. Other expenses directly related to properties under development 132 6. Result from trading and construction works 132 7. Result from sale of investment properties 133 8. Income from services rendered 134 9. Indirect expenses 134 10. Other operating income 134 11. Depreciation and impairment losses/reversal 135 12. Joint ventures result 135
CONTENT

CONSOLIDATED FINANCIAL STATEMENTS
CO
NS
OL
IDA
TE
D F
INA
NC
IAL
STA
TE
ME
NT
S
83
13. Finance costs 135 14. Other financial result 135 15. Result from interest rate derivatives 136 16. Result from financial investments 136 17. Result from other financial assets 136 18. Result from associated companies 136 19. Financial result 137 20. Income tax 137 21. Other comprehensive income 138 22. Long-term assets 139 23. Intangible assets and office furniture and equipment 141 24. Investments in joint ventures 142 25. Investments in associated companies 144 26. Financial assets 144 27. Deferred taxes 146 28. Assets held for sale 148 29. Properties held for trading 149 30. Receivables and other assets 149 31. Current income tax receivables 151 32. Securities 151 33. Cash and cash equivalents 151 34. Shareholders’ equity 151 35. Provisions 152 36. Interest bearing liabilities 154 37. Other liabilities 157 38. Income tax liabilities 157 39. Financial instruments 158 40. Derivative financial instruments and hedging transactions 160 41. Risks from financial instruments 162 42. Other obligations and contingent liabilities 165 43. Leases 167 44. Transactions with related parties 168 45. Key figures per share 172 46. Employees 172 47. Costs for the auditor 172 48. Events after the close of the business year 173 ANNEX I TO THE CONSOLIDATED FINANCIAL STATEMENTS 174
DECLARATION OF THE MANAGEMENT BOARD PURSUANT TO SECTION 82 (4) OF THE AUSTRIAN STOCK EXCHANGE ACT 181
AUDITOR'S REPORT 182
FINANCIAL STATEMENT OF CA IMMOBILIEN ANLAGEN AKTIENGESELLSCHAFT 188
TABLES AND ANALYSES 192
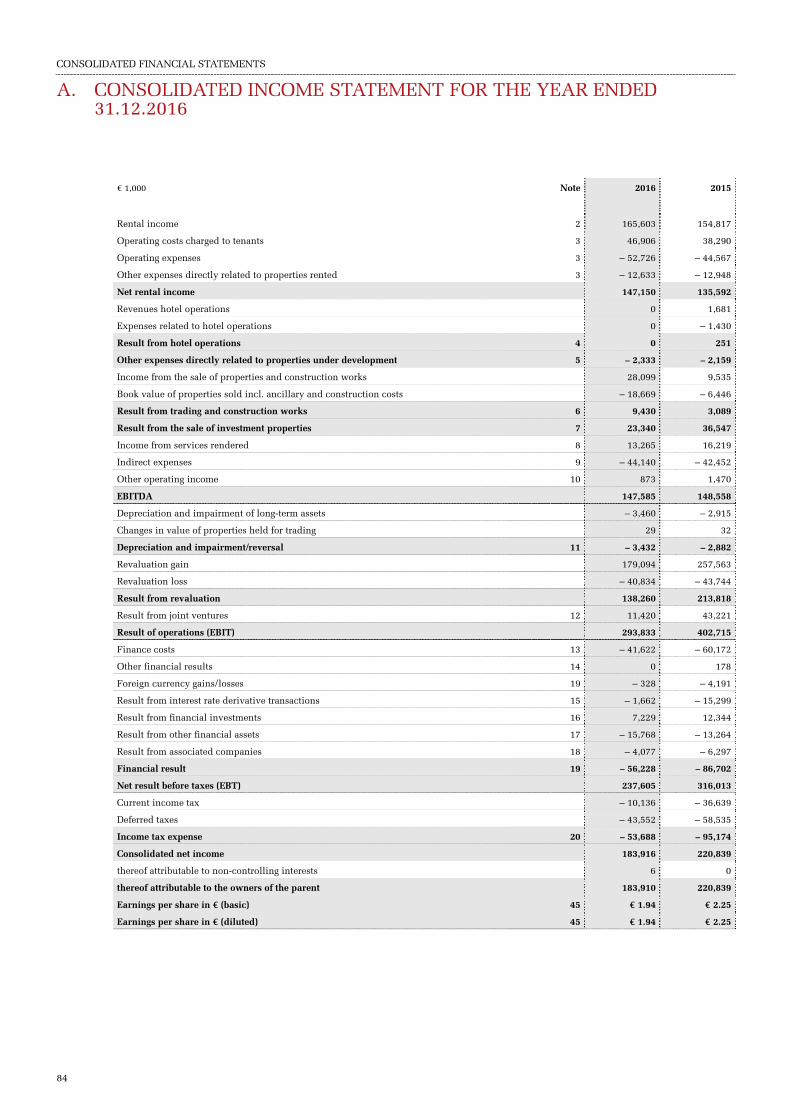
CONSOLIDATED FINANCIAL STATEMENTS
84
€ 1,000 Note 2016 2015
Rental income 2 165,603 154,817
Operating costs charged to tenants 3 46,906 38,290
Operating expenses 3 – 52,726 – 44,567
Other expenses directly related to properties rented 3 – 12,633 – 12,948
Net rental income 147,150 135,592
Revenues hotel operations 0 1,681
Expenses related to hotel operations 0 – 1,430
Result from hotel operations 4 0 251
Other expenses directly related to properties under development 5 – 2,333 – 2,159
Income from the sale of properties and construction works 28,099 9,535
Book value of properties sold incl. ancillary and construction costs – 18,669 – 6,446
Result from trading and construction works 6 9,430 3,089
Result from the sale of investment properties 7 23,340 36,547
Income from services rendered 8 13,265 16,219
Indirect expenses 9 – 44,140 – 42,452
Other operating income 10 873 1,470
EBITDA 147,585 148,558
Depreciation and impairment of long-term assets – 3,460 – 2,915
Changes in value of properties held for trading 29 32
Depreciation and impairment/reversal 11 – 3,432 – 2,882
Revaluation gain 179,094 257,563
Revaluation loss – 40,834 – 43,744
Result from revaluation 138,260 213,818
Result from joint ventures 12 11,420 43,221
Result of operations (EBIT) 293,833 402,715
Finance costs 13 – 41,622 – 60,172
Other financial results 14 0 178
Foreign currency gains/losses 19 – 328 – 4,191
Result from interest rate derivative transactions 15 – 1,662 – 15,299
Result from financial investments 16 7,229 12,344
Result from other financial assets 17 – 15,768 – 13,264
Result from associated companies 18 – 4,077 – 6,297
Financial result 19 – 56,228 – 86,702
Net result before taxes (EBT) 237,605 316,013
Current income tax – 10,136 – 36,639
Deferred taxes – 43,552 – 58,535
Income tax expense 20 – 53,688 – 95,174
Consolidated net income 183,916 220,839
thereof attributable to non-controlling interests 6 0
thereof attributable to the owners of the parent 183,910 220,839
Earnings per share in € (basic) 45 € 1.94 € 2.25
Earnings per share in € (diluted) 45 € 1.94 € 2.25
A. CONSOLIDATED INCOME STATEMENT FOR THE YEAR ENDED 31.12.2016
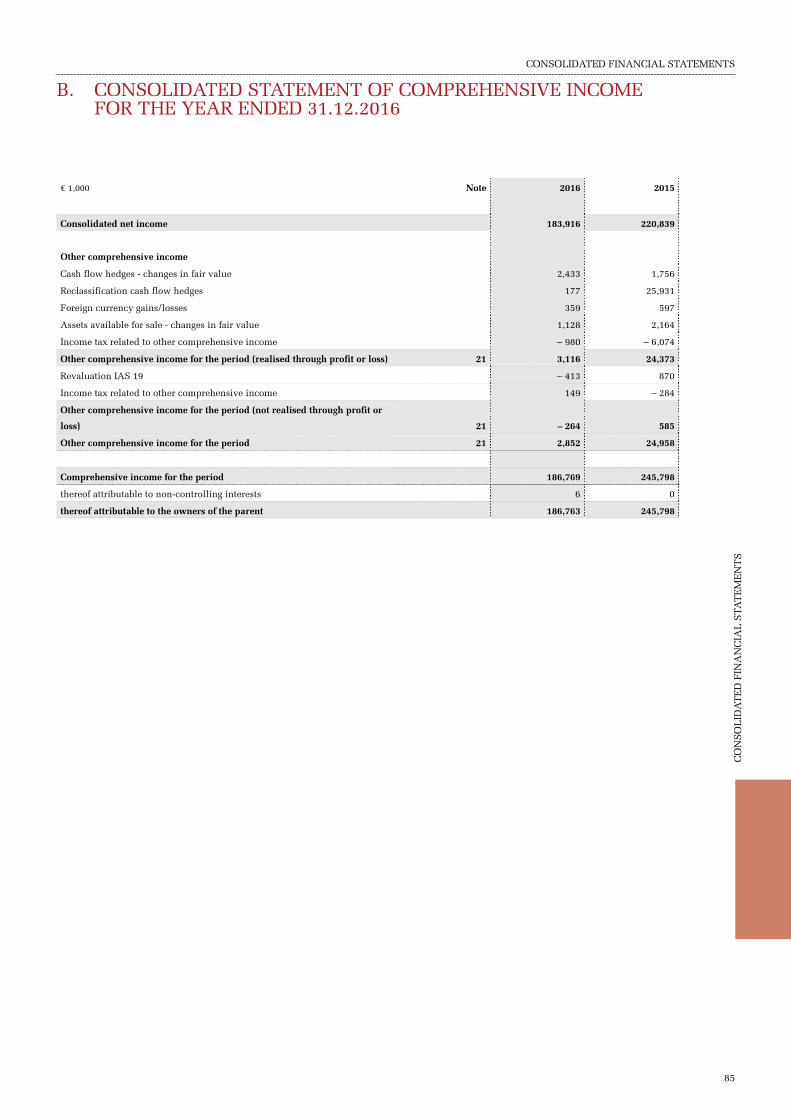
CONSOLIDATED FINANCIAL STATEMENTS
CO
NS
OL
IDA
TE
D F
INA
NC
IAL
STA
TE
ME
NT
S
85
€ 1,000 Note 2016 2015
Consolidated net income 183,916 220,839
Other comprehensive income
Cash flow hedges - changes in fair value 2,433 1,756
Reclassification cash flow hedges 177 25,931
Foreign currency gains/losses 359 597
Assets available for sale - changes in fair value 1,128 2,164
Income tax related to other comprehensive income – 980 – 6,074
Other comprehensive income for the period (realised through profit or loss) 21 3,116 24,373
Revaluation IAS 19 – 413 870
Income tax related to other comprehensive income 149 – 284
Other comprehensive income for the period (not realised through profit or
loss) 21 – 264 585
Other comprehensive income for the period 21 2,852 24,958
Comprehensive income for the period 186,769 245,798
thereof attributable to non-controlling interests 6 0
thereof attributable to the owners of the parent 186,763 245,798
B. CONSOLIDATED STATEMENT OF COMPREHENSIVE INCOME FOR THE YEAR ENDED 31.12.2016

CONSOLIDATED FINANCIAL STATEMENTS
86
€ 1,000 Note 31.12.2016 31.12.2015
restated
1.1.2015 restated
ASSETS
Investment properties 22 2,923,676 2,714,305 2,092,917
Investment properties under development 22 433,049 408,979 496,252
Own used properties 22 6,643 7,016 7,533
Office furniture and equipment 23 5,599 5,710 1,399
Intangible assets 23 8,195 11,567 15,845
Investments in joint ventures 24 191,369 172,286 206,136
Investments in associated companies 25 0 0 18
Financial assets 26 89,713 134,824 385,410
Deferred tax assets 27 1,563 2,376 4,301
Long-term assets 3,659,806 3,457,063 3,209,811
Long-term assets as a % of total assets 84.9% 86.8% 87.4%
Assets held for sale and relating to disposal groups 28 26,754 54,048 91,481
Properties held for trading 29 34,147 22,069 18,445
Receivables and other assets 30 76,235 99,223 120,983
Current income tax receivables 31 15,552 39,218 42,037
Securities 32 101,555 105,250 24,547
Cash and cash equivalents 33 395,088 207,112 163,638
Short-term assets 649,332 526,920 461,130
Total assets 4,309,138 3,983,983 3,670,941
LIABILITIES AND SHAREHOLDERS' EQUITY
Share capital 718,337 718,337 718,337
Capital reserves 819,068 921,746 998,839
Other reserves – 894 – 3,746 – 28,704
Retained earnings 667,984 484,074 263,235
Attributable to the owners of the parent 2,204,495 2,120,410 1,951,707
Non-controlling interests 46 40 0
Shareholders' equity 34 2,204,541 2,120,450 1,951,707
Shareholders' equity as a % of total assets 51.2% 53.2% 53.2%
Provisions 35 13,242 15,980 7,726
Interest-bearing liabilities 36 1,412,635 858,776 1,026,620
Other liabilities 37 87,180 84,911 162,352
Deferred tax liabilities 27 239,969 197,365 145,991
Long-term liabilities 1,753,026 1,157,032 1,342,689
Current income tax liabilities 38 16,736 16,382 11,372
Provisions 35 84,766 69,177 51,259
Interest-bearing liabilities 36 153,004 545,214 202,530
Other liabilities 37 97,064 75,728 84,841
Liabilities relating to disposal groups 28 0 0 26,543
Short-term liabilities 351,571 706,501 376,545
Total liabilities and shareholders' equity 4,309,138 3,983,983 3,670,941
C. CONSOLIDATED STATEMENT OF FINANCIAL POSITION AS AT 31.12.2016

CONSOLIDATED FINANCIAL STATEMENTS
CO
NS
OL
IDA
TE
D F
INA
NC
IAL
STA
TE
ME
NT
S
87
€ 1,000 2016 2015
Operating activities
Net result before taxes 237,605 316,013
Revaluation result incl. change in accrual and deferral of rental income – 137,982 – 217,973
Depreciation and impairment/reversal 3,432 2,882
Result from the sale of long-term properties and office furniture and other equipment – 23,399 – 36,562
Taxes paid/refunded excl. taxes for the sale of long-term properties 5,588 – 4,943
Finance costs, result from financial investments and other financial result 34,393 47,651
Foreign currency gains/losses 328 4,191
Result from interest rate derivative transactions 1,662 15,299
Result from other financial assets and non-cash income from investments in at equity consolidated entities 8,426 – 23,660
Cash flow from operations 130,052 102,898
Properties held for trading – 12,050 – 3,592
Receivables and other assets – 11,355 13,497
Provisions 5,193 171
Other liabilities 13,527 183
Cash flow from change in net current assets – 4,684 10,259
Cash flow from operating activities 125,368 113,157
Investing activities
Acquisition of and investment in long-term properties incl. prepayments – 92,915 – 92,603
Acquisition of property companies, less cash and cash equivalents of € 1,602 K (2015: € 26,080 K) – 160,128 – 34,913
Acquisition of office equipment and intangible assets – 1,191 – 1,342
Repayment/acquisition of financial assets 36,300 – 36,300
Acquisition of assets available for sale – 12,073 – 94,365
Investments in joint ventures – 2,354 – 4,051
Disposal of investment properties and other assets 145,437 164,001
Disposal of investment property companies, less cash and cash equivalents of € 1,746 K (2015: € 1,094 K) 45,528 58,135
Disposal of joint ventures and associated companies 34,616 24,292
Loans made to joint ventures – 616 – 4,633
Loan repayments made by joint ventures 1,278 119,340
Taxes paid/refunded relating to the sale of long-term properties and loans granted 3,938 – 26,120
Dividend distribution/capital repayment from at equity consolidated entities and assets available for sale 40,192 14,359
Interest paid for capital expenditure in investment properties – 3,462 – 236
Interest received from financial investments 4,924 15,984
Cash flow from investing activities 39,474 101,548
Financing activities
Cash inflow from loans received 300,560 218,586
Cash inflow from the issuance of bonds 288,131 174,387
Acquisition of treasury shares – 53,885 – 32,306
Dividend payments to shareholders – 47,904 – 44,464
Payment related to the acquisition of shares from non-controlling interests and dividends to minority interests – 1,675 – 3,130
Repayment of loans incl. interest rate derivatives – 238,502 – 433,017
Repayment of bonds – 185,992 0
Other interest paid – 37,277 – 51,428
Cash flow from financing activities 23,455 – 171,372
Net change in cash and cash equivalents 188,297 43,333
Cash and cash equivalents as at 1.1. 207,112 163,638
Changes in the value of foreign currency – 320 141
Cash and cash equivalents as at 31.12. 395,088 207,112
The interests paid in 2016 totalled € – 40,739 K (2015: € – 51,664 K). The income taxes refunded in 2016 added up to € 9,526 K (2015 payment of € – 31,063 K).
D. CONSOLIDATED CASH FLOW STATEMENT FOR THE YEAR ENDED 31.12.2016

CONSOLIDATED FINANCIAL STATEMENTS
88
€ 1,000 Note Share capital Capital reserves -
Others
Capital reserves -
Treasury share
reserve
As at 1.1.2015 718,337 998,839 0
Valuation / reclassification cash flow hedges 21 0 0 0
Foreign currency gains/losses 21 0 0 0
Revaluation of assets available for sale 21 0 0 0
Revaluation IAS 19 21 0 0 0
Consolidated net income 0 0 0
Comprehensive income for 2015 0 0 0
Dividend payments to shareholders 0 – 44,464 0
Addition of non-controlling interests 0 0 0
Subsequent adjustment for acquisition of shares in non-
controlling interests 0 – 323 0
Acquisition of treasury shares 0 0 – 32,306
As at 31.12.2015 34 718,337 954,052 – 32,306
As at 1.1.2016 718,337 954,052 – 32,306
Valuation / reclassification cash flow hedges 21 0 0 0
Foreign currency gains/losses 21 0 0 0
Revaluation of assets available for sale 21 0 0 0
Revaluation IAS 19 21 0 0 0
Consolidated net income 0 0 0
Comprehensive income for 2016 0 0 0
Dividend payments to shareholders 34 0 – 47,904 0
Acquisition of treasury shares 34 0 0 – 54,773
As at 31.12.2016 34 718,337 906,148 – 87,080
E. CONSOLIDATED STATEMENT OF CHANGES IN EQUITY FOR THE YEAR ENDED 31.12.2016
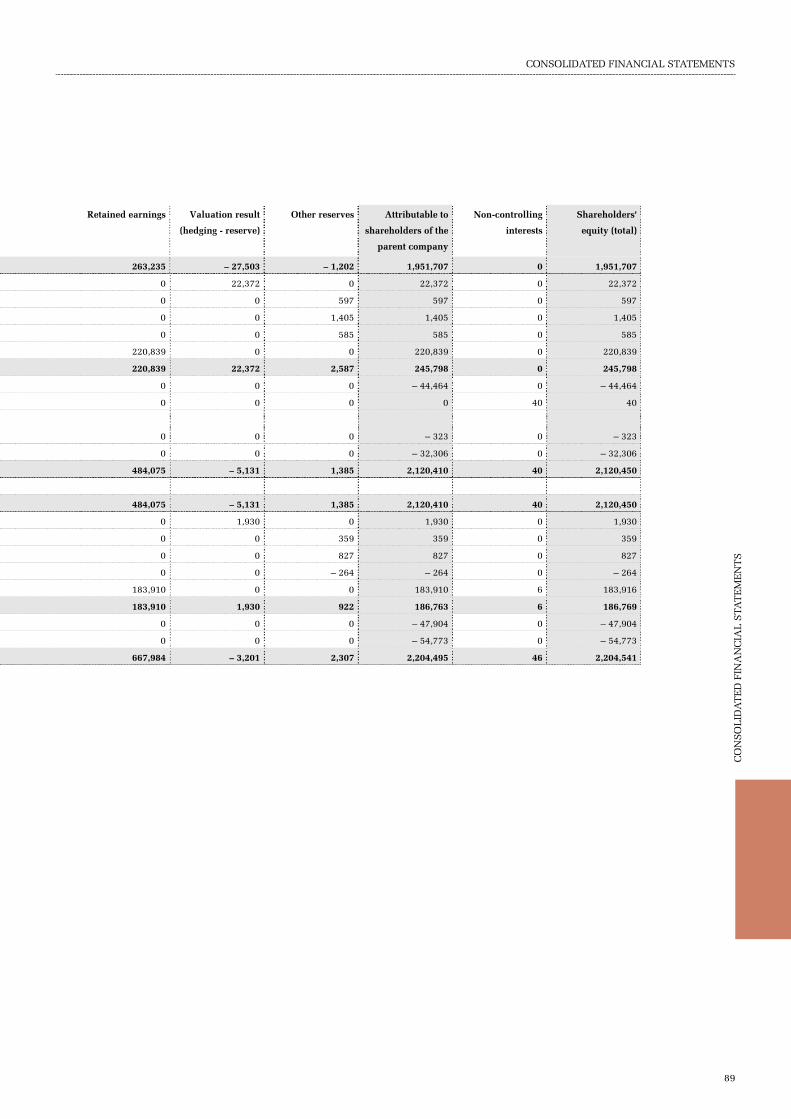
CONSOLIDATED FINANCIAL STATEMENTS
CO
NS
OL
IDA
TE
D F
INA
NC
IAL
STA
TE
ME
NT
S
89
Retained earnings Valuation result
(hedging - reserve)
Other reserves Attributable to
shareholders of the
parent company
Non-controlling
interests
Shareholders'
equity (total)
263,235 – 27,503 – 1,202 1,951,707 0 1,951,707
0 22,372 0 22,372 0 22,372
0 0 597 597 0 597
0 0 1,405 1,405 0 1,405
0 0 585 585 0 585
220,839 0 0 220,839 0 220,839
220,839 22,372 2,587 245,798 0 245,798
0 0 0 – 44,464 0 – 44,464
0 0 0 0 40 40
0 0 0 – 323 0 – 323
0 0 0 – 32,306 0 – 32,306
484,075 – 5,131 1,385 2,120,410 40 2,120,450
484,075 – 5,131 1,385 2,120,410 40 2,120,450
0 1,930 0 1,930 0 1,930
0 0 359 359 0 359
0 0 827 827 0 827
0 0 – 264 – 264 0 – 264
183,910 0 0 183,910 6 183,916
183,910 1,930 922 186,763 6 186,769
0 0 0 – 47,904 0 – 47,904
0 0 0 – 54,773 0 – 54,773
667,984 – 3,201 2,307 2,204,495 46 2,204,541

CONSOLIDATED FINANCIAL STATEMENTS
90
GENERAL NOTES
1. Information concerning the Company CA Immobilien Anlagen Aktiengesellschaft and its subsidiaries (the “CA Immo Group”) constitute an international
real estate group. The parent company is CA Immobilien Anlagen Aktiengesellschaft ("CA Immo AG"), which has its head office at 1030 Vienna, Mechelgasse 1. CA Immo Group owns, develops and manages office, commercial, logistics and residential properties in Austria and Germany as well as in Eastern Europe. CA Immo AG is listed in the prime market segment of the Vienna Stock Exchange and is included in the ATX (Austrian Traded Index of leading compa-nies).
2. Accounting principles The consolidated financial statements of CA Immo AG were prepared in accordance with the International Financial
Reporting Standards (IFRS) as adopted by the European Union and thereby fulfil the additional requirements of § 245a par. 1 of the Austrian Commercial Code (UGB). The consolidated financial statements are based on the acquisition cost method, with the exception of investment properties (including standing investments and properties under develop-ment), properties held for sale, available-for-sale financial assets, derivative financial instruments and provisions for cash-settled share-based payment plans, which are measured at fair value. The net item from pension obligations is presented as a provision, comprising the present value of the obligations less the fair value of the plan asset.
The consolidated financial statements are presented in thousand of Euros ("€ K"), rounded according to the commer-cial rounding method. The use of automatic data processing equipment may lead to rounding differences in the addi-tion of rounded amounts and percentage rates.
3. Significant aspects of presentation and accounting principles a) Presentation and structuring of group notes
The preparation and presentation of the financial statements requires management to make relevant decisions regard-ing the choice of the accounting methods as well as the sequence and the relevance of the disclosures, taking into ac-count the requirements of the users of the financial statements. CA Immo Group presents at the beginning of the group notes main decisions, assumptions and estimations and subsequently the accounting policies used. The explanatory notes to the items in the consolidated income statement and in the consolidated statement of financial position are listed in accordance with order of the main statements. This structure allows the users of the financial statements to easily find the relevant information for individual items.
The financial statements contain financial information prepared by taking into account materiality considerations. The materiality of the CA Immo Group is determined by quantitative and qualitative aspects. The quantitative aspects are assessed by means of ratios to balance sheet total, performance indicators and/or main items of cashflow. The dis-closures in the notes of the CA Immo Group are assessed at every financial statement period end, weighing the efficient preparation of the annual financial statements and the transparent presentation of the relevant information.
b) Significant judgments, assumptions and estimates When preparing the consolidated financial statements, senior management is required to make judgments, assump-
tions and estimates that affect both the recognition and measurement of assets, liabilities, income and expenses, and the information contained in the notes. Actually, future amounts can differ from the initial assumptions.
Property valuation The global financial systems are subject to considerable fluctuations. Especially in commercial real estate markets,
these fluctuations may have significant effects on prices and values. In particular, restricted liquidity in the capital markets can make it more difficult to successfully sell the properties in the short term.
F. NOTES TO THE CONSOLIDATED FINANCIAL STATEMENTS AS AT 31.12.2016

CONSOLIDATED FINANCIAL STATEMENTS
CO
NS
OL
IDA
TE
D F
INA
NC
IAL
STA
TE
ME
NT
S
91
All valuations represent an estimate of the price that could be obtained in a transaction taking place at the valuation date.
Valuations are based on assumptions, such as the existence of an active market in the region concerned. Unforeseen macroeconomic or political crises could have a significant influence on the market. Such events can trigger panic buy-ing or selling, or a general reluctance to conclude business transactions. If a valuation date falls within a period imme-diately following an event of this kind, the data underlying the valuation may be questionable, incomplete or incon-sistent, which inevitably affects the reliability of the estimate.
For properties that currently have a high vacancy rate or short-term leases, the influence of the appraiser’s assump-tions on the property value is higher than it is in case of properties with cash flows that are secured by long-term con-tracts.
The property values established by external appraisers depend on several parameters, some influence each other in a complex way. For the purposes of a sensitivity analysis for sub-portfolios in respect of changes in value caused by the change in one parameter, individual input factors vary (while other factors stay unchanged) in order to present possi-ble changes.
The following below tables illustrate the sensitivity of the fair value to a change in rental income (for the purposes of this model, defined as market rent) and in the yields (term yield – capitalization interest rate for the average remaining term of the current rental contracts and reversionary yield – capitalization interest rate for expected rental income after expiration of the current rental contracts) for all investment properties, other than non-current assets held for sale.
Office Austria
Change in Yield (in % of
initial yield) – 10% – 5% 0% 5%
Change in market
rent of
10%
– 10% 2.51% 6.87% 11.23% 15.59% 19.95%
– 5% – 2.81% 1.25% 5.32% 9.38% 13.45%
0% – 7.60% – 3.80% 0.00% 3.80% 7.60%
+5% – 11.94% – 8.37% – 4.81% – 1.25% 2.31%
+10% – 15.88% – 12.53% – 9.19% – 5.84% – 2.50%
Office Germany
Change in Yield (in % of
initial yield) – 10% – 5% 0% 5%
Change in market
rent of
10%
– 10% 2.21% 6.85% 11.50% 16.14% 20.78%
– 5% – 3.23% 1.11% 5.44% 9.78% 14.12%
0% – 8.13% – 4.06% 0.00% 4.06% 8.13%
+5% – 12.56% – 8.74% – 4.93% – 1.11% 2.71%
+10% – 16.59% – 13.00% – 9.40% – 5.81% – 2.22%
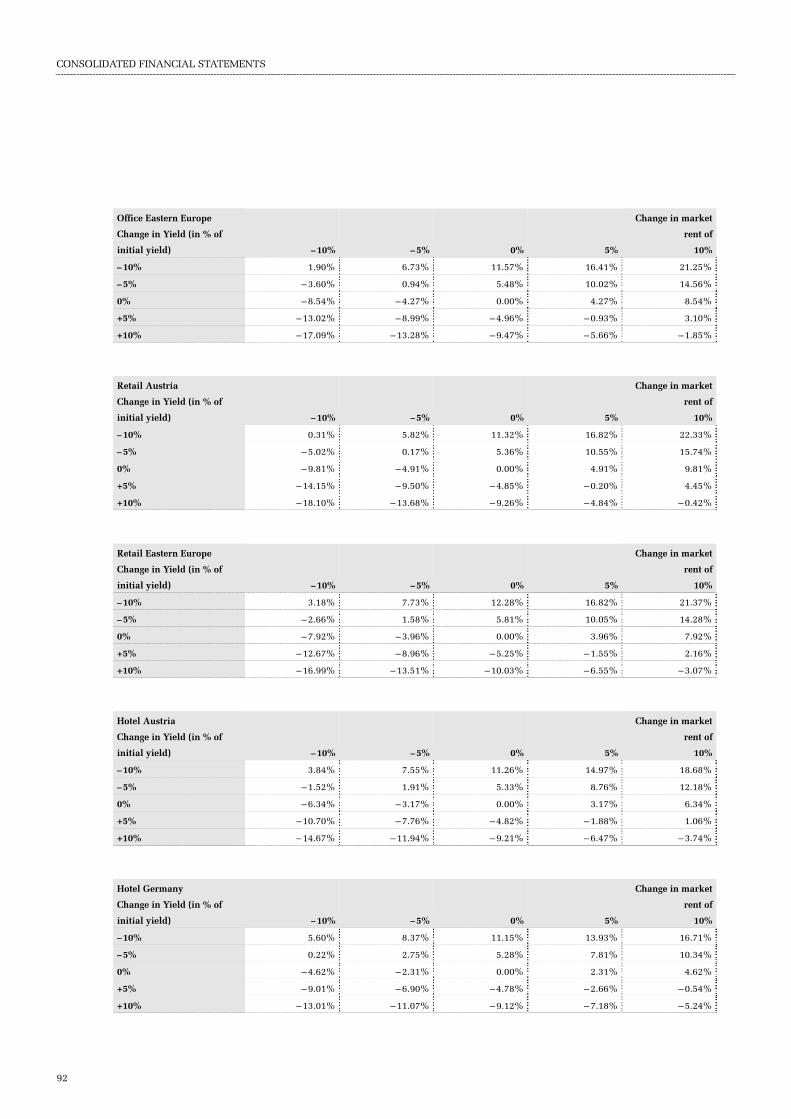
CONSOLIDATED FINANCIAL STATEMENTS
92
Office Eastern Europe
Change in Yield (in % of
initial yield) – 10% – 5% 0% 5%
Change in market
rent of
10%
– 10% 1.90% 6.73% 11.57% 16.41% 21.25%
– 5% – 3.60% 0.94% 5.48% 10.02% 14.56%
0% – 8.54% – 4.27% 0.00% 4.27% 8.54%
+5% – 13.02% – 8.99% – 4.96% – 0.93% 3.10%
+10% – 17.09% – 13.28% – 9.47% – 5.66% – 1.85%
Retail Austria
Change in Yield (in % of
initial yield) – 10% – 5% 0% 5%
Change in market
rent of
10%
– 10% 0.31% 5.82% 11.32% 16.82% 22.33%
– 5% – 5.02% 0.17% 5.36% 10.55% 15.74%
0% – 9.81% – 4.91% 0.00% 4.91% 9.81%
+5% – 14.15% – 9.50% – 4.85% – 0.20% 4.45%
+10% – 18.10% – 13.68% – 9.26% – 4.84% – 0.42%
Retail Eastern Europe
Change in Yield (in % of
initial yield) – 10% – 5% 0% 5%
Change in market
rent of
10%
– 10% 3.18% 7.73% 12.28% 16.82% 21.37%
– 5% – 2.66% 1.58% 5.81% 10.05% 14.28%
0% – 7.92% – 3.96% 0.00% 3.96% 7.92%
+5% – 12.67% – 8.96% – 5.25% – 1.55% 2.16%
+10% – 16.99% – 13.51% – 10.03% – 6.55% – 3.07%
Hotel Austria
Change in Yield (in % of
initial yield) – 10% – 5% 0% 5%
Change in market
rent of
10%
– 10% 3.84% 7.55% 11.26% 14.97% 18.68%
– 5% – 1.52% 1.91% 5.33% 8.76% 12.18%
0% – 6.34% – 3.17% 0.00% 3.17% 6.34%
+5% – 10.70% – 7.76% – 4.82% – 1.88% 1.06%
+10% – 14.67% – 11.94% – 9.21% – 6.47% – 3.74%
Hotel Germany
Change in Yield (in % of
initial yield) – 10% – 5% 0% 5%
Change in market
rent of
10%
– 10% 5.60% 8.37% 11.15% 13.93% 16.71%
– 5% 0.22% 2.75% 5.28% 7.81% 10.34%
0% – 4.62% – 2.31% 0.00% 2.31% 4.62%
+5% – 9.01% – 6.90% – 4.78% – 2.66% – 0.54%
+10% – 13.01% – 11.07% – 9.12% – 7.18% – 5.24%

CONSOLIDATED FINANCIAL STATEMENTS
CO
NS
OL
IDA
TE
D F
INA
NC
IAL
STA
TE
ME
NT
S
93
Hotel Eastern Europe
Change in Yield (in % of
initial yield) – 10% – 5% 0% 5%
Change in market
rent of
10%
– 10% 4.13% 7.59% 11.06% 14.53% 17.99%
– 5% – 1.15% 2.04% 5.24% 8.43% 11.63%
0% – 5.90% – 2.95% 0.00% 2.95% 5.90%
+5% – 10.21% – 7.47% – 4.74% – 2.00% 0.73%
+10% – 14.12% – 11.58% – 9.04% – 6.50% – 3.96%
Other Austria
Change in Yield (in % of
initial yield) – 10% – 5% 0% 5%
Change in market
rent of
10%
– 10% 1.61% 7.61% 13.60% 19.59% 25.58%
– 5% – 4.81% 0.81% 6.44% 12.07% 17.70%
0% – 10.60% – 5.30% 0.00% 5.30% 10.60%
+5% – 15.83% – 10.83% – 5.83% – 0.82% 4.18%
+10% – 20.59% – 15.86% – 11.12% – 6.39% – 1.66%
Other Germany
Change in Yield (in % of
initial yield) – 10% – 5% 0% 5%
Change in market
rent of
10%
– 10% 0.64% 6.00% 11.37% 16.73% 22.09%
– 5% – 4.70% 0.34% 5.38% 10.43% 15.47%
0% – 9.52% – 4.76% 0.00% 4.76% 9.52%
+5% – 13.87% – 9.37% – 4.87% – 0.37% 4.13%
+10% – 17.83% – 13.57% – 9.30% – 5.03% – 0.77%
For the development projects, the table below illustrates the sensitivity of the fair value to an increase or decrease in the calculated outstanding development and construction costs. Existing development projects under construction were used as basis.
Still outstanding capital expenditures
in € m – 10% – 5% Initial value +5% +10%
Still outstanding capital
expenditures 608.1 641.8 675.6 709.4 743.2
Fair value 267.8 234.0 200.2 166.4 132.7
Changes to initial value 33.7% 16.9% 0.0% – 16.9% – 33.7%
The sensitivity analysis of the projects under development are based on an average percentage of completion of ap-proximately 15% as at balance sheet date, related to total construction costs. The sensitivity only relates to the out-standing costs of the building constructions works. The outstanding capital expenditures will reduce with the increase of the percentage of completion. Based on the residual value method this leads to an increase of the fair value of the projects under development. An increase or decrease of capital expenditures still outstanding leads to an inversely development of the fair value of the projects under development, within the residual value method.

CONSOLIDATED FINANCIAL STATEMENTS
94
Taxes All companies are subject to local income tax on rental income, capital gains and other income in their respective
countries. Significant estimates are required in respect of the amount of income tax provisions to be recognised. More-over, it needs to be determined to which extent the deferred tax assets should be recognised in the group’s consolidated financial statements.
Income from the disposal of investments in real estate companies in Germany and Eastern Europe is wholly or partial-ly exempt from income tax in Austria when certain conditions are met. Even if the group intends to meet these condi-tions, the full amount of deferred taxes according to IAS 12 is recognised for investment properties.
Material assumptions also need to be assessed if temporary differences and losses carried forward can be offset against taxable profits in the future and if the deferred tax assets can be capitalised. Uncertainties exist concerning the amount and effective date of future taxable income and the interpretation of complex tax regulations. Where there is uncertain-ty over income tax treatments of transactions and assessment is required in order to evaluate whether it is probable or not that the tax authority will accept the tax treatment. Based on this judgement CA Immo Group recognizes the tax obligations with their most likely classified amount. These uncertainties and complexities can result in future tax pay-ments which are much higher or lower than those currently estimated and recognised in the balance sheet as liabilities or assets.
CA Immo Group holds a significant part of its real estate portfolio in Germany, being subject to numerous complex tax regulations. In particular, the issuer has to constantly deal with (i) roll-over schemes in order to transfer undisclosed, hidden reserves to other investments, (ii) legal provisions relevant to the real estate transfer tax liability/possible incur-rence of real estate transfer tax in the event of direct or indirect shareholder changes in German partnerships and cor-porations, as well as (iii) the deduction of input VAT on construction costs, as an ongoing issue in the development phase of projects. CA Immo Group takes all necessary steps in order to comply with the relevant tax rules. However, because of circumstances that are out of CA Immo Groups control, such as changes in ownership structure, tax laws as well as alterations of interpretation by the tax administration and courts, the aforementioned tax issues might be treat-ed differently and, therefore, could have an impact on the tax position in the consolidated financial statements.
Measurement of interest rate derivatives CA Immo Group uses interest rate swaps, caps and swaptions in order to mitigate the risk of interest rate fluctuations.
These interest rate derivatives are recognised at fair value. The fair values are calculated by discounting the future cash flows from variable payments on the basis of generally recognised finance-mathematical methods. The interest rates for discounting the future cash flows are estimated by reference to an observable market yield curve. The calculation is based on inter-bank middle rates. The fair value of interest rate derivatives corresponds therefore to level 2 of the measurement hierarchy according to IFRS 13.
A correction of the measurement of the interest rate derivatives due to CVA (Credit Value Adjustment) and DVA (Debt Value Adjustment) is only conducted when the adjustment reaches a significant extent.
The application of cash flow hedge accounting (hedging of future cash flows) for interest rate swaps requires an as-sessment of the probability of occurrence of the future hedged cash flows from variable interest payments for financial liabilites. The probability depends on the existence of the financial liability. As soon as it is no longer highly probable that the hedged cash flows will occur, hedge accounting is no longer used.

CONSOLIDATED FINANCIAL STATEMENTS
CO
NS
OL
IDA
TE
D F
INA
NC
IAL
STA
TE
ME
NT
S
95
Business Combinations CA Immo Group determines at the time of acquisition of companies (legal entities) whether the acquisition is a busi-
ness or a group of assets and liabilities. The following indicators are used for the assessment of business units:
‐ the acquired entity comprises a number of properties ‐ the acquired entity conducts major processes, apart from owning and letting properties ‐ the entity employs personnel carrying out major processes
Consolidation The concept of control under IFRS 10 leads to the existence of joint ventures in the the CA Immo Group, which, due
to contractual arrangements, despite a shareholding percentage higher than 50% are included in the consolidated fi-nancial statements using the at-equity method in line with IFRS 11.
Effective date of initial or deconsolidation The consolidation of a subsidiary begins on the day on which the group acquires control over the subsidiary. It ends
when the group loses control over the subsidiary. Assets, liabilities, income and expenses of a subsidiary are recog-nized in the financial statements as of the date on which the group acquires control of the subsidiary until the date the control ceases. For efficiency and materiality considerations, CA Immo Group determines the date of the initial consol-idation and the deconsolidation respectively with an available reporting date.
Determination of the functional currency In determining the functional currency CA Immo Group differentiates basically between property entities and man-
agement entities. Functional currency: property entities In the real estate transaction market in the countries where CA Immo Group owns investment properties, the proper-
ties and property entities are usually purchased and sold in Euro due to the active international investors in those markets. In addition, CA Immo Group predominantly concludes lease contracts in Euro, or, in case these contracts are not concluded in Euro, they are indexed to the Euro exchange rate.
Hence, the Euro has the most influence on the sales price of goods (real estate sales) and services (rental services) of-fered by CA Immo. This fact is also expressed in external valuation reports, as values are stated in EUR.
Moreover, CA Immo mainly finances its property in Euro. The price of the most essential cost factor of a real estate company is therefore also determined in Euro.
In consideration of the above mentioned factors, the Euro is determined as the functional currency of CA Immo’s property companies, which are included in the consolidated financial statements and located outside the territory of the European Monetary Union.
Functional currency: management entities The invoicing of services (management services provided to the property companies by management companies) in
Eastern Europe is carried out in the respective local currency. The prices are set in the respective local currency, which therefore have the most significant influence on the sales prices of the provided services. Furthermore, these companies also employ staff who are paid in the respective local currency. The prices for the key cost factors are therefore deter-mined based on the respective local currency. Cash flow is generated mostly independently from the parent company.

CONSOLIDATED FINANCIAL STATEMENTS
96
In consideration of the above mentioned factors, the respective local currency is the functional currency of CA Immo’s management companies, which are included in the consolidated financial statements and located outside the territory of the European Monetary Union.
Classification of real estate assets with mixed utilisation Some properties are of mixed use – they are used both to generate rental income and appreciation in value as well as
partially for management functions. If these respective portions can be sold individually, CA Immo Group recognises them separately. If the portions cannot be separated, the entire property is only classified as an investment property if the own used part occupies less than 5.0% of the total useful area. Otherwise, the entire property is classified as own used.
Classification of real estate assets with change in use Changes in classification for real estate assets (standing investments, investments under development, own used,
available for sale) are to be considered when a change in the use is made. Transfers in or out from investment property are made, for example when:
‐ beginning or ending of owner occupied property (transfer in or from own used properties), ‐ beginning of the development with the purpose of sale (transfer from investment property to assets held for sale).
Classification of leases as operating lease CA Immo Group classifies leases as operating lease when the underlying contract does not represent a finance lease. A
finance lease exists when:
‐ at the end of the lease term the ownership of the asset will be transferred to the lessee; ‐ the lessee has the option to purchase the asset at a price which is expected to be sufficiently lower than the fair
value at the date the option becomes exercisable that at the inception of the lease it is reasonably certain that the option will be exercised:
‐ the lease term is for the major part of the economic life of the asset, even if title is not transferred; ‐ at the inception of the lease, the present value of the minimum lease payments amounts to at least substantially
all of the fair value of the leased asset; and ‐ the leased assets are of a specialized nature such that only the lessee can use them without major modifications
being made.
4. Scope of consolidation The consolidated financial statements comprise the ultimate parent company CA Immo AG and the companies listed
in Annex I.
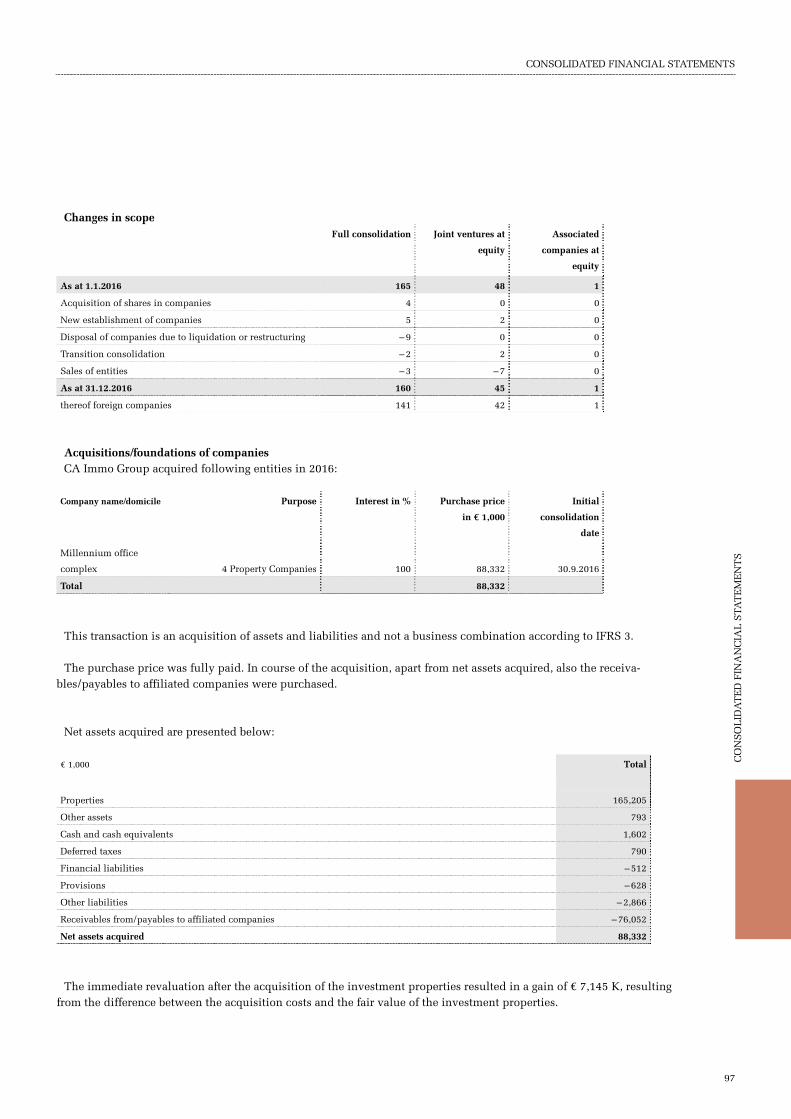
CONSOLIDATED FINANCIAL STATEMENTS
CO
NS
OL
IDA
TE
D F
INA
NC
IAL
STA
TE
ME
NT
S
97
Changes in scope Full consolidation Joint ventures at
equity
Associated
companies at
equity
As at 1.1.2016 165 48 1
Acquisition of shares in companies 4 0 0
New establishment of companies 5 2 0
Disposal of companies due to liquidation or restructuring – 9 0 0
Transition consolidation – 2 2 0
Sales of entities – 3 – 7 0
As at 31.12.2016 160 45 1
thereof foreign companies 141 42 1
Acquisitions/foundations of companies CA Immo Group acquired following entities in 2016:
Company name/domicile Purpose Interest in % Purchase price
in € 1,000
Initial
consolidation
date
Millennium office
complex 4 Property Companies 100 88,332 30.9.2016
Total 88,332
This transaction is an acquisition of assets and liabilities and not a business combination according to IFRS 3.
The purchase price was fully paid. In course of the acquisition, apart from net assets acquired, also the receiva-bles/payables to affiliated companies were purchased.
Net assets acquired are presented below:
€ 1,000 Total
Properties 165,205
Other assets 793
Cash and cash equivalents 1,602
Deferred taxes 790
Financial liabilities – 512
Provisions – 628
Other liabilities – 2,866
Receivables from/payables to affiliated companies – 76,052
Net assets acquired 88,332
The immediate revaluation after the acquisition of the investment properties resulted in a gain of € 7,145 K, resulting from the difference between the acquisition costs and the fair value of the investment properties.

CONSOLIDATED FINANCIAL STATEMENTS
98
For all newly founded companies, equity in the amount of € 92 K was paid.
Disposals of companies CA Immo Group disposed the following interests in entities in the business year 2016:
Company name/domicile Interest held
in %
Consolidation method before
change in participation
Sales price
€ 1,000
Deconsolidation
date
Europolis Harbour City 100 Full consolidation 3,486 17.5.2016
TK Czech Development IX s.r.o. 100 Full consolidation 8,461 20.10.2016
Office Center Mladost EOOD 100 Full consolidation 1,174 30.11.2016
Eggarten Projektentwicklung GmbH & Co. KG 50 Full consolidation 41,943 30.11.2016
Eggarten Projektentwicklung Verwaltung 50 Full consolidation 0 30.11.2016
Total affiliated entities 55,064
Poleczki Business Park Portfolio (7 entities) 50 At-equity Joint Ventures 3,551 1.1.2016
Total joint ventures 3,551
Total 58,615
Due to the sale of 50% of the Eggarten entities in Germany, CA Immo Group has no control over these entities, any longer. Therefore, these companies have been deconsolidated and the remaining interest is recognised as investment in joint ventures through profit and loss.
The receivables from sales prices amounted to € 10,500 K as at 31.12.2016.
The above-mentioned disposals (measured as of date of deconsolidation) had the following effect on the consolidated financial statements:
€ 1,000 Eastern Europe Germany Total
Properties – 34,174 – 63,052 – 97,226
Other assets – 168 – 20,968 – 21,137
Cash and cash equivalents – 1,692 – 53 – 1,746
Deferred taxes 178 0 178
Current income tax liabilities 73 0 73
Provisions 665 60 725
Other liabilities 868 27 895
Receivables from/payables to affiliated
companies 21,930 24 21,954
Net change – 12,320 – 83,963 – 96,283
thereof proportional net assets sold – 12,320 – 41,981 – 54,302
thereof additions to investments in joint
ventures 0 41,981 41,981
Investments in not consolidated structured entities As at 31.12.2016 – as in the previous year – there are no investments in not consolidated structured entities.
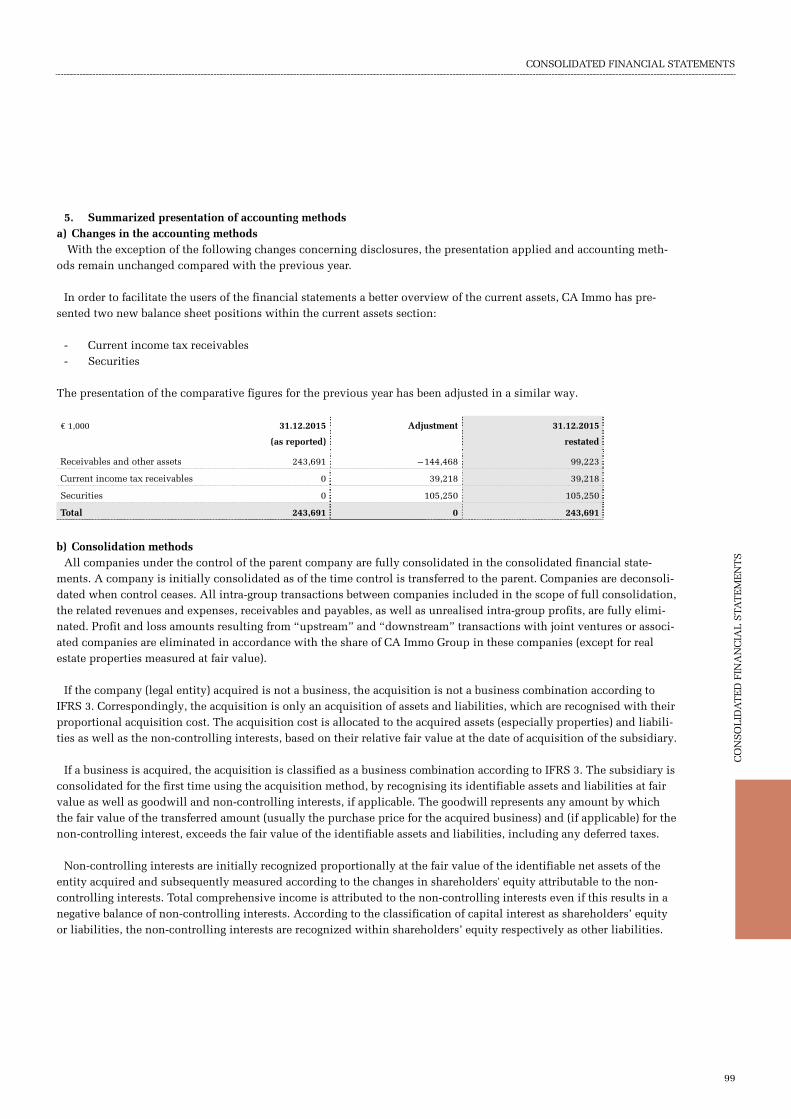
CONSOLIDATED FINANCIAL STATEMENTS
CO
NS
OL
IDA
TE
D F
INA
NC
IAL
STA
TE
ME
NT
S
99
5. Summarized presentation of accounting methods a) Changes in the accounting methods
With the exception of the following changes concerning disclosures, the presentation applied and accounting meth-ods remain unchanged compared with the previous year.
In order to facilitate the users of the financial statements a better overview of the current assets, CA Immo has pre-sented two new balance sheet positions within the current assets section:
- Current income tax receivables - Securities
The presentation of the comparative figures for the previous year has been adjusted in a similar way.
€ 1,000 31.12.2015
(as reported)
Adjustment 31.12.2015
restated
Receivables and other assets 243,691 – 144,468 99,223
Current income tax receivables 0 39,218 39,218
Securities 0 105,250 105,250
Total 243,691 0 243,691 b) Consolidation methods
All companies under the control of the parent company are fully consolidated in the consolidated financial state-ments. A company is initially consolidated as of the time control is transferred to the parent. Companies are deconsoli-dated when control ceases. All intra-group transactions between companies included in the scope of full consolidation, the related revenues and expenses, receivables and payables, as well as unrealised intra-group profits, are fully elimi-nated. Profit and loss amounts resulting from “upstream” and “downstream” transactions with joint ventures or associ-ated companies are eliminated in accordance with the share of CA Immo Group in these companies (except for real estate properties measured at fair value).
If the company (legal entity) acquired is not a business, the acquisition is not a business combination according to IFRS 3. Correspondingly, the acquisition is only an acquisition of assets and liabilities, which are recognised with their proportional acquisition cost. The acquisition cost is allocated to the acquired assets (especially properties) and liabili-ties as well as the non-controlling interests, based on their relative fair value at the date of acquisition of the subsidiary.
If a business is acquired, the acquisition is classified as a business combination according to IFRS 3. The subsidiary is consolidated for the first time using the acquisition method, by recognising its identifiable assets and liabilities at fair value as well as goodwill and non-controlling interests, if applicable. The goodwill represents any amount by which the fair value of the transferred amount (usually the purchase price for the acquired business) and (if applicable) for the non-controlling interest, exceeds the fair value of the identifiable assets and liabilities, including any deferred taxes.
Non-controlling interests are initially recognized proportionally at the fair value of the identifiable net assets of the entity acquired and subsequently measured according to the changes in shareholders' equity attributable to the non-controlling interests. Total comprehensive income is attributed to the non-controlling interests even if this results in a negative balance of non-controlling interests. According to the classification of capital interest as shareholders’ equity or liabilities, the non-controlling interests are recognized within shareholders’ equity respectively as other liabilities.

CONSOLIDATED FINANCIAL STATEMENTS
100
Acquisitions or sales of shares in a subsidiary that do not result in an establishment or loss of control are accounted for as equity transactions. The book values of the controlling and non-controlling interests are adjusted to reflect the changes in the respective interests in the subsidiary. Any difference between the amount by which the non-controlling interests are adjusted and the fair value of the consideration paid or received is recognised directly in equity and at-tributed to the shareholders of the parent company.
In case a partial sale of shares in a subsidiary, previously fully consolidated, all assets and liabilities of the former subsidiary are excluded from the consolidated balance sheet, at the moment control is lost. As a result, the remaining shares are recognised as joint ventures, associated entities or finance instrumed according to IAS 39, with applicable fair value at the transition consolidation date through profit and loss.
Joint ventures CA Immo Group enters into joint ventures with one or more partner companies in the course of establishing property
rental or project development partnerships, whereby joint management of these ventures is established by contract. Interests in jointly managed companies are accounted for according to the equity method in the consolidated financial statements of CA Immo Group (AEJV – at equity joint ventures).
Associated companies An associated company is an entity under significant influence of the Group that is neither a subsidiary nor an inter-
est in a joint venture. The results, assets and liabilities of associated companies are included in the financial statements using the equity method of accounting (AEA – at equity associates).
Equity method According to the equity method, investments in joint ventures and associates are initially recognised at the date of
acquisition in the consolidated statement of financial position at cost, including directly attributable ancillary costs. The subsequent measurement is affected by any increase/decrease of this value, based on the group’s share in the peri-od profit or loss and the other comprehensive income (corrected by interim gains and losses resulting from transactions with the group), dividends, contributions and other changes in the equity of the associated company, as well as by impairment.
Once the book value of the interests in an associated company has decreased to zero and possible long-term loans to the associated companies are impaired to zero as well, additional losses are recognised as a liability only to the extent that CA Immo Group has incurred a legal or effective obligation to make further payments to the associated company.
c) Foreign currency translation Transactions in foreign currencies The individual group companies record foreign currency transactions at the exchange rate prevailing at the date of the
relevant transaction. Monetary assets and liabilities in foreign currency existing at the reporting date are translated into the particular functional currency at the exchange rate prevailing at that date. Any resulting foreign currency gains or losses are recognised in the income statement of the relevant business year.

CONSOLIDATED FINANCIAL STATEMENTS
CO
NS
OL
IDA
TE
D F
INA
NC
IAL
STA
TE
ME
NT
S
101
The currency translation of assets and liabilities is based on the following exchange rates:
Bid Ask Bid Ask
31.12.2016 31.12.2016 31.12.2015 31.12.2015
Switzerland CHF 1.0694 1.0822 1.0675 1.0751
USA USD 1.0513 1.0613 1.0768 1.0848
In the CA Immo Group there are four subsidiaries in Hungary whose financial statements are already set up in Euro. The monetary assets and liabilities in foreign currency are converted at the exchange rate of the reporting date. The resulting foreign currency gains and losses are recorded in the respective financial year.
Translation of subsidiaries’ individual financial statements denominated in foreign currencies The group reporting currency is the Euro (EUR). Since the Euro is generally also the functional currency of those
companies included in the consolidated financial statements that are domiciled outside the European Monetary Union in Eastern Europe, the financial statements prepared in a foreign currency are translated in accordance with the tem-poral method. Under this method, investment properties (including properties under development) as well as monetary assets and liabilities are translated at closing rates, whereas own used properties as well as other non-monetary assets are translated at historical exchange rates. Items of the income statement are translated at the average exchange rates of the relevant reporting period. Gains or losses resulting from the currency translation are recognised in the income statement.
The functional currency of the subsidiaries in Ukraine and of management companies in Eastern Europe is the respec-tive local currency in each case. The amounts in the statements of financial position are translated at the exchange rate at the reporting date. Only shareholders' equity is translated at historical rates. Items of the income statement are trans-lated at the average exchange rates of the relevant reporting period. Gains and losses arising from the application of the closing rate method are recognised in other comprehensive income.
Individual financial statements were translated on the basis of the following rates of exchange:
Closing rate Closing rate Average exchange rate Average exchange rate
31.12.2016 31.12.2015 2016 2015
Bulgaria BGN 1.9558 1.9558 1.9558 1.9558
Croatia HRK 7.5578 7.6352 7.5265 7.6186
Poland PLN 4.4240 4.2615 4.3783 4.1810
Romania RON 4.5411 4.5245 4.4919 4.4422
Russia RUB 64.3000 80.6736 73.0584 68.7681
Serbia RSD 123.4723 121.6261 123.1961 120.7636
Czech Republic CZK 27.0200 27.0250 27.0396 27.2688
Ukraine UAH 28.4226 26.2231 28.2202 24.4147
Hungary HUF 311.0200 313.1200 311.8425 309.3217

CONSOLIDATED FINANCIAL STATEMENTS
102
d) Properties Classification The item “investment properties” consists of investment properties and properties under development that are held
neither for own use nor for sale in the ordinary course of business, but to generate rental income and to appreciate in value.
Properties under development are reclassified to investment properties upon completion of the main construction services.
Properties are recognised as held for trading if the relevant property is intended for sale in the ordinary course of business or is under construction and intended for subsequent sale. Thus, a property can be sold via a forward-sale agreement and CA Immo Group hands over the finished property at a later point in time.
Properties used for administration purposes are presented under the line “own used properties”.
Valuation Investment properties are measured according to the fair value model. Changes in the current book value before re-
valuation (fair value of previous year plus subsequent/ additional acquisition or production cost less subsequent acqui-sition cost reductions as well as the impact from the deferral of rent incentives) are recognised in the income statement under “result from revaluation”.
Properties held for trading are measured at the lower of acquisition or production cost and net realisable value as of the relevant reporting date.
Own used properties and office furniture, equipment and other assets are measured in accordance with the cost method, i.e. acquisition or production cost or fair value at the date of reclassification less regular depreciation and impairment losses.
Investment grants are accounted for as deduction of production costs.
Office furniture, equipment and other assets are depreciated on a straight-line basis over their estimated useful life, which generally ranges from 2 to 15 years. The estimated useful life of the own used properties, applying the principle that each part of an item with a significant cost shall be depreciated separately, is 70 to 75 years for the structural work, 15 to 70 years for the facade, 20 years for the building equipment and appliances, 15 to 20 years for the roof, and 10 to 20 years for the tenant’s finishing works.
Borrowing costs arising during property construction are allocated to the production costs if they are directly attribut-able to a qualifying asset. A qualifying asset is an asset that takes a substantial period of time to be ready for its intend-ed use or sale. In cases in which debt is not directly attributable to an individual qualifying asset, the proportional amount of the total finance costs is allocated to the qualifying asset. All other borrowing costs are recognised in profit or loss in the period in which they are incurred.
Determination of fair value Around 97.5 % (31.12.2015: 99.8 %) of the properties in Austria, about 94.2 % (31.12.2015: 95.6 %) of the properties
in Germany, and about 98.0 % (31.12.2015: 90.6 %) of the properties in Eastern Europe were subject to an external valuation as of the reporting date 31.12.2016. The values of the other properties were determined internally on the basis of the previous year’s valuations or binding purchase agreements.

CONSOLIDATED FINANCIAL STATEMENTS
CO
NS
OL
IDA
TE
D F
INA
NC
IAL
STA
TE
ME
NT
S
103
The external valuations are made in accordance with the standards defined by the Royal Institution of Chartered Sur-veyors (RICS). The RICS defines the market value as the estimated amount for which an asset or liability could be ex-changed on the valuation date between a willing buyer and a willing seller in an arm’s length transaction, after proper marketing and where the parties had each acted knowledgeably, prudently and without compulsion.
The valuation method applied by the expert for each property particularly depends on the property’s stage of devel-opment and its type of use.
Rented commercial properties, which constitute the largest portion of CA Immo Group’s portfolio, are mainly valued by the investment method. The fair value represents the present value of the future expected rental income. These are calculated based on two time units: firstly “term”, with mainly contractual secured rents over the average remaining lease term and secondly “reversion”, for which the experts include further parameters, in particular the market rent achievable for the object. Both periods are capitalized with an adequate interest rate (term yield/ reversionary yield).
For properties under development and construction, the residual method is applied. Under this method, the market value is based on the estimated market value upon completion, less expected outstanding expenses and after applying a reasonable developer profit in the range of 7.5 % to 15.7 % of the market value upon completion (31.12.2015: 3.0 % to 25.0 %). Developer profit for properties under development, which are nearly completed, ranges at the bottom of the margin according to their reduced risk. Among possible potential risks that are considered are, the estimated future rents and initial yields in the range from 3.5 % to 7.9 % and financing interest rates in the range from 2.3 % to 4.0 %. The rates vary in particular depending on the general market climate, location and type of use. The nearer a project is to completion, the greater the portion of parameters that are based on actual or contractually fixed amounts. After com-pletion or immediately before completion, the properties are valued by applying the investment method (see above), adjusted for outstanding work.

CONSOLIDATED FINANCIAL STATEMENTS
104
The following table shows the essential input factors for the valuation of investment property and property under de-velopment:
Classification investment
properties incl. own used
properties
Fair value
31.12.2016
Fair value
31.12.2015
Inputs Range 2016 Range 2015
Valuation technique
investment method
€ 1,000 € 1,000
Office Austria 314,610 319,030 Actual-rent €/m² p. m. 7.44 – 25.37 7.51 – 22.97
Market-rent €/m² p. m. 7.12 – 23.63 6.79 – 22.99
average remaining lease term in years 7.42 7.79
average vacancy % 7.29 6.93
Yield Term min/max/weighted average % 3.85 / 6.50 / 5.34 4.15 / 6.25 / 5.39
Yield Reversion min/max/weighted average % 3.65 / 6.75 / 5.45 4.15 / 6.25 / 5.39
Office Germany 851,750 753,544 Actual-rent €/m² p. m. 9.47 – 21.56 9.27 – 21.52
Market-rent €/m² p. m. 9.49 – 21.53 9.24 – 21.39
average remaining lease term in years 6.65 7.54
average vacancy % 2.91 7.7
Yield Term min/max/weighted average % 4.10 / 5.65 / 4.53 3.25 / 5.75 / 4.43
Yield Reversion min/max/weighted average % 4.10 / 5.65 / 4.54 4.40 / 5.75 / 4.86
Office Eastern Europe 1,378,595 1,201,280 Actual-rent €/m² p. m. 7.59 – 21.75 7.64 – 22.37
Market-rent €/m² p. m. 7.91 – 20.06 7.87 – 20.76
average remaining lease term in years 3.04 2.95
average vacancy % 10.17 8.75
Yield Term min/max/weighted average % 5.95 / 8.50 / 7.34 6.20 / 9.25 / 7.54
Yield Reversion min/max/weighted average % 5.95 / 8.50 / 7.36 6.20 / 9.50 / 7.59
Office total 2,544,955 2,273,854
Retail Austria 97,200 107,300 Actual-rent €/m² p. m. 13.36 – 13.36 9.16 – 13.54
Market-rent €/m² p. m. 13.90 – 13.90 9.00 – 14.63
average remaining lease term in years 2.21 5.12
average vacancy % 5.92 2.85
Yield Term min/max/weighted average % 4.55 / 4.55 / 4.55 4.85 / 6.00 / 5.01
Yield Reversion min/max/weighted average % 4.65 / 4.65 / 4.65 4.85 / 6.75 / 5.10
Retail Eastern Europe 8,800 37,700 Actual-rent €/m² p. m. 4.36 – 4.36 4.37 – 11.32
Market-rent €/m² p. m. 5.10 – 5.10 6.51 – 8.08
average remaining lease term in years 3.90 3.80
average vacancy % 17.86 13.97
Yield Term min/max/weighted average % 9.00 / 9.00 / 9.00 9.00 / 9.00 / 9.00
Yield Reversion min/max/weighted average % 9.00 / 9.00 / 9.00 9.00 / 9.00 / 9.00
Retail total 106,000 145,000

CONSOLIDATED FINANCIAL STATEMENTS
CO
NS
OL
IDA
TE
D F
INA
NC
IAL
STA
TE
ME
NT
S
105
Classification investment
properties incl. own used
properties
Fair value
31.12.2016
Fair value
31.12.2015
Inputs Range 2016 Range 2015
Valuation technique
investment method
€ 1,000 € 1,000
Hotel Austria 84,600 85,200 Actual-rent €/m² p. m. 9.39 – 10.40 8.89 – 10.40
Market-rent €/m² p. m. 9.35 – 10.50 9.15 – 11.00
average remaining lease term in years 10.79 11.65
average vacancy % 2.41 1.79
Yield Term min/max/weighted average % 4.75 / 5.50 / 5.05 4.75 / 5.75 / 5.08
Yield Reversion min/max/weighted average % 5.00 / 5.75 / 5.12 5.00 / 5.75 / 5.29
Hotel Germany 83,400 73,800 Actual-rent €/m² p. m. 13.65 – 15.86 12.95 – 15.86
Market-rent €/m² p. m. 13.79 – 15.86 13.16 – 15.86
average remaining lease term in years 16.12 17.09
average vacancy % 1.61 1.61
Yield Term min/max/weighted average % 5.10 / 5.25 / 5.13 5.50 / 5.90 / 5.57
Yield Reversion min/max/weighted average % 5.10 / 5.25 / 5.13 5.50 / 5.90 / 5.57
Hotel Eastern Europe 11,400 11,300 Actual-rent €/m² p. m. 4.64 – 4.64 4.63 – 4.63
Market-rent €/m² p. m. 4.58 – 4.58 4.54 – 4.54
average remaining lease term in years 7.67 6.99
average vacancy % 6.16 7.51
Yield Term min/max/weighted average % 7.50 / 7.50 / 7.50 7.50 / 7.50 / 7.50
Yield Reversion min/max/weighted average % 8.00 / 8.00 / 8.00 8.00 / 8.00/ 8.00
Hotel total 179,400 170,300
Other Austria 59,040 84,630 Actual-rent €/m² p. m. 4.86 – 12.00 4.81 – 11.30
Market-rent €/m² p. m. 12.55 – 12.55 8.22 – 11.34
average remaining lease term in years 3.91 4.37
average vacancy % 15.28 6.44
Yield Term min/max/weighted average % 4.00 / 6.35 / 5.85 4.00 / 6.35 / 5.56
Yield Reversion min/max/weighted average % 4.00 / 6.25 / 5.77 4.00 / 6.25 / 5.45
Other Germany 46,970 52,540 Actual-rent €/m² p. m. 3.24 – 3.51 3.24 – 3.51
Market-rent €/m² p. m. 3.05 – 3.44 3.06 – 6.00
average remaining lease term in years 2.45 2.96
average vacancy % 19.02 19.23
Yield Term min/max/weighted average % 6.00 / 9.00 / 6.96 4.00 / 8.50 / 6.12
Yield Reversion min/max/weighted average % 6.00 / 9.00 / 6.99 5.25 / 8.50 / 6.36
Other total 106,010 137,170
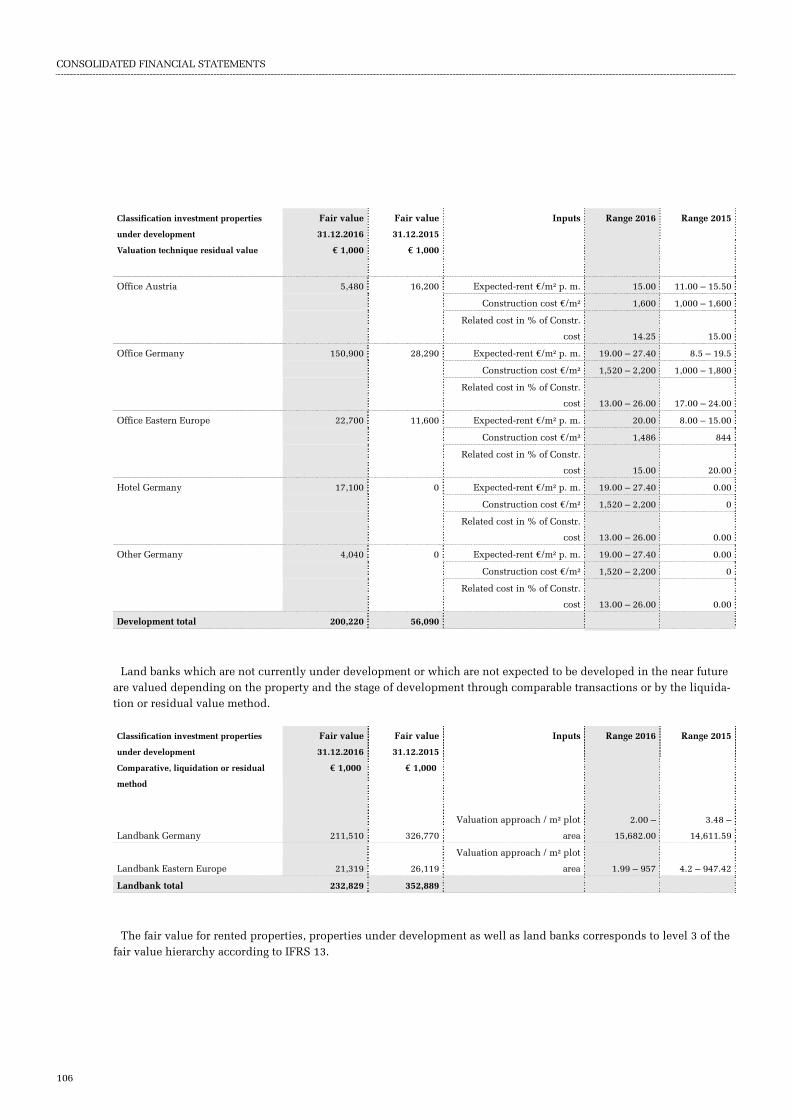
CONSOLIDATED FINANCIAL STATEMENTS
106
Classification investment properties
under development
Fair value
31.12.2016
Fair value
31.12.2015
Inputs Range 2016 Range 2015
Valuation technique residual value € 1,000 € 1,000
Office Austria 5,480 16,200 Expected-rent €/m² p. m. 15.00 11.00 – 15.50
Construction cost €/m² 1,600 1,000 – 1,600
Related cost in % of Constr.
cost 14.25 15.00
Office Germany 150,900 28,290 Expected-rent €/m² p. m. 19.00 – 27.40 8.5 – 19.5
Construction cost €/m² 1,520 – 2,200 1,000 – 1,800
Related cost in % of Constr.
cost 13.00 – 26.00 17.00 – 24.00
Office Eastern Europe 22,700 11,600 Expected-rent €/m² p. m. 20.00 8.00 – 15.00
Construction cost €/m² 1,486 844
Related cost in % of Constr.
cost 15.00 20.00
Hotel Germany 17,100 0 Expected-rent €/m² p. m. 19.00 – 27.40 0.00
Construction cost €/m² 1,520 – 2,200 0
Related cost in % of Constr.
cost 13.00 – 26.00 0.00
Other Germany 4,040 0 Expected-rent €/m² p. m. 19.00 – 27.40 0.00
Construction cost €/m² 1,520 – 2,200 0
Related cost in % of Constr.
cost 13.00 – 26.00 0.00
Development total 200,220 56,090
Land banks which are not currently under development or which are not expected to be developed in the near future are valued depending on the property and the stage of development through comparable transactions or by the liquida-tion or residual value method.
Classification investment properties
under development
Fair value
31.12.2016
Fair value
31.12.2015
Inputs Range 2016 Range 2015
Comparative, liquidation or residual
method
€ 1,000 € 1,000
Landbank Germany 211,510 326,770
Valuation approach / m² plot
area
2.00 –
15,682.00
3.48 –
14,611.59
Landbank Eastern Europe 21,319 26,119
Valuation approach / m² plot
area 1.99 – 957 4.2 – 947.42
Landbank total 232,829 352,889
The fair value for rented properties, properties under development as well as land banks corresponds to level 3 of the fair value hierarchy according to IFRS 13.

CONSOLIDATED FINANCIAL STATEMENTS
CO
NS
OL
IDA
TE
D F
INA
NC
IAL
STA
TE
ME
NT
S
107
Interdependencies between the input factors The essential input factors that determine the fair values for investment property are the actual rents and market rents
as well as the interest rates (yields). Increasing rents (e.g. a short supply and increased demand) would cause increasing fair values. Vice versa, the fair value decreases when the rents are decreasing.
Increasing yields (e.g. the market expects increasing interest rates due to increasing risks – excessive supply, etc.) would cause decreasing fair values. Vice versa, the fair value would increase if the yield decreases (e.g. higher demand for this type of investment property).
Both input factors act reinforcing – as well in a positive or negative way – when they appear jointly. This means that a strengthened demand for rental space as well as a simultaneously strengthened demand for such investment property would cause an even greater increase of the fair value. Vice versa, a decrease in the demand for rental space as well as a decreased market demand for investment property would cause an even heavier decrease of the fair value.
For properties under development construction costs are another essential input factor. The market value of proper-ties is mainly determined by the expected rental income and the yield. It is in this area of conflict that new develop-ment projects are planned and calculated. Given that the calculated construction costs, which are a major influencing factor in development, could change during the development phase because of both market related factors (e.g. shortage of resources on the markets or oversupply) and planning-related factors (e.g. necessary additional changes, unforeseea-ble problems, subsequent savings, etc.), they have a significant influence on profitability. These additional opportuni-ties/ risks are given appropriate consideration in a developer’s profit (risk/profit) based on the total construction costs.
Valuation Process For the major part of the real estate portfolio, CA Immo Group commissions independent, external real estate experts
to issue a market valuation and provided the appraisers with all the necessary documents twice in 2016 (2015: once). After clarification of any queries the experts create drafts valuation. These drafts are checked for credibility and integri-ty and finally approved for issuance.
The selection of the independent, external real estate experts for CA Immo Group is based, on the one hand on profes-sional qualification, which is measured by national and international standards, such as HypZert or RICS, and on the other hand by giving consideration to local market presence and penetration. If market conditions allow, the selected real estate experts are ones that do not act as an agent in any leasing or investment business.
e) Intangible assets The goodwill represents the amount by which the fair value of the amount transferred (usually the purchase price for
the acquired business) and (if applicable) for the non-controlling interest, exceeds the fair value of the identifiable assets and liabilities, including any deferred taxes. Mainly, it represents the benefit resulting from the fact that the deferred tax liabilities acquired will become due only in a future period. Goodwill is not amortised, but is tested for impairment at each period end.
A possible impairment is directly connected to the reduction of the fair value of the property or to taxation changes in the country of the cash generating unit. Essentially, parameters determined by the appraisers within the scope of the external property valuation are used for the impairment test.
Other intangible assets mainly comprise software and are recognised at acquisition cost less straight-line amortisation and impairment losses. Software is amortised over a useful life of 3 to 5 years.

CONSOLIDATED FINANCIAL STATEMENTS
108
f) Impairment losses If an indication exists that a long term non-financial asset (own used properties, office furniture, equipment and other
assets as well as intangible assets) might be impaired, CA Immo Group performs an impairment test. CA Immo calcu-lates the recoverable amount for the asset or smallest identifiable group of assets.
The recoverable amount is the higher of the fair value less the cost to sell (net realisable value) and the value in use of the corresponding asset (or group of assets). The value in use is the present value of the expected future cash flows that are likely to be generated by the continued use of an asset (or group of assets) and its retirement at the end of its useful life.
If this recoverable amount is lower than the carrying value of the asset (or group of assets), the asset is written down to the lower value. These write-offs are reported in the consolidated income statement under “depreciation and im-pairment/reversal”.
If, at a later date the impairment ceases to exist (except for goodwill), the impairment loss is reversed to profit or loss up to the carrying amount of the amortised original acquisition or production cost.
Goodwill is tested for impairment at each balance sheet date, with individual properties representing the cash gener-ating units. Due to the specific nature of the recognised goodwill, the recoverable amount for the cash generating unit cannot be determined without taking into account the expected tax charge. Hence, the book value of the cash generat-ing unit includes, in addition to the allocated goodwill, the directly attributable deferred taxes of the single properties. The recoverable amount is determined on the basis of fair value. The fair value of a property is mainly determined on the basis of external valuation reports. The present value of the income tax payments is determined considering after-tax yield (which represents the yield of the property after tax effects of the relevant country) on the expected income tax payments.
The impairment test assumes, based on experience, an average retention period for properties held by CA Immo Group of 2.5 to 16 years for investment properties. Due to the assumption of the retention period decreasing each year and thus of a reduced discounting period each year, further impairment losses of the goodwill corresponding to the reduction in the present value benefit are expected in future periods.
The following sensitivity analysis shows the impact in goodwill impairment of changes in significant parameters for the impairment test.
Goodwill impairment in € K
Change in yield (in % of initial yield) +5% +5% +10% +10%
Change in market rent – 5% – 10% – 5% – 10%
Impact on the profit and loss statement – 435.0 – 714.3 – 720.0 – 984.2
g) Financial assets and liabilities (FI - financial instruments) Interests in companies (Available for sale investments) and securities Interests in companies which are not consolidated due to lack of control, and which are neither significantly influ-
enced by the Group are assigned to the category “available for sale” (AFS – available for sale). The valuation of the stake purchased is made at fair value. Subsequent changes in value – as long as there are no impairments – are pre-sented in other comprehensive income and reclassified in profit and loss upon the sale of the investment. If a listed price on an active market is not available, the fair value will be updated based on internal valuation, which is mostly based on external professional opinion regarding investment property.
CONSOLIDATED FINANCIAL STATEMENTS
CO
NS
OL
IDA
TE
D F
INA
NC
IAL
STA
TE
ME
NT
S
109
Securities are primary financial instruments that are quoted on an active market and available for sale. They are clas-sified as “available for sale” (AFS-available for sale). The initial recognition is at fair value including any transaction costs and the subsequent valuation is at fair value (stock market quotation).
In case of impairments of available-for-sale financial assets, the difference between acquisition costs and the lower fair value is recognized in profit or loss. Changes in value previously recognized in equity, are transferred from equity to profit or loss. A subsequent appreciation in value is shown in other comprehensive income. This can also lead to the fact that an impairment is booked in profit and loss during the year and in the subsequent quarters the value change is recorded in the other comprehensive income. CA Immo Group recognizes securities at the conclusion of the transaction agreement.
Loans Loans granted by the company are assigned to the category “loans and receivables” (L&R). They are measured at fair
value upon recognition, and subsequently at amortised cost, applying the effective interest-rate method and taking into account any impairment.
Receivables and other financial assets Trade receivables from the provision of services, other receivables and other financial assets are primary financial in-
struments that are not listed on active markets and not intended for sale. They are assigned to the measurement catego-ry “loans and receivables” (L&R). They are initially measured at fair value, and thereafter at amortised cost, applying the effective interest-rate method and less impairment losses.
An impairment loss on receivables is calculated based on the status of the dunning procedure, the past due date, and the individual credit rating of the relevant debtor, taking into account any security received and is recognised when there is objective indication that the receivables cannot be collected in full. Uncollectible receivables are derecognised. Subsequent payments in respect of receivables for which impairment losses have been incurred, are recognised in the consolidated income statement.
Receivables from the sale of properties having a maturity of more than one year are recognised as non-current receiva-bles at their present values as of the respective reporting date.
Cash and cash equivalents Cash and cash equivalents include cash, deposits in banks, as well as fixed-term deposits with an original term of up
to three months. This item also includes cash in banks subject to drawing restrictions for a period of less than 3 months which is used for securing outstanding loans (principal and interests) as well as current investments in development projects. Cash in banks subject to drawing restrictions up to 12 months is presented in caption “receivables and other assets”. Restricted cash with a longer lock-up period (over 12 months), is presented under financial assets.
Interest-bearing liabilities Interest-bearing liabilities are assigned to the category "financial liabilities at amortised cost" (FLAC) and recognised
upon disbursement at the amount actually received less transaction costs. Any difference between the amount received and the repayment amount is allocated over the term of the financing according to the effective interest-rate method and is recognised in financing costs or, if the conditions set forth in IAS 23 are met, capitalised as part of the construc-tion cost.
CONSOLIDATED FINANCIAL STATEMENTS
110
Other liabilities Other financial liabilities, such as trade payables, are assigned to the category “financial liabilities at amortised cost”
(FLAC) and measured upon recognition at fair value and subsequently at amortised acquisition cost.
For other current liabilities, the fair value generally corresponds to the estimated sum of all future payments.
Other non-current liabilities are measured at fair value on initial recognition and are compounded with a timely and risk adequate market rate.
Derivative financial instruments CA Immo Group recognizes derivative financial instruments upon the conclusion of the transaction agreement.
CA Immo Group uses derivative financial instruments, such as interest rate caps, floors, swaps, swaptions and for-ward exchange transactions, in order to hedge against interest and currency risks. These derivative financial instru-ments are recognised at fair value at the time the contract is concluded and remeasured at fair value in the following periods. Derivative financial instruments are recognised as financial assets if their value is positive and as financial liabilities if their fair value is negative.
Derivative financial instruments are presented in non-current financial assets or liabilities if their remaining term ex-ceeds twelve months and realisation within twelve months is not expected. All other derivative financial instruments, whose remaining term is below twelve months, are presented in current assets or liabilities.
The method applied by CA Immo Group when recognising gains and losses from derivative financial instruments de-pends on whether or not the criteria for cash-flow hedge accounting (hedging of future cash flows) are met. CA Immo Group exclusively pursues a micro-hedging strategy, whereby the hedging instrument is directly assigned to an indi-vidual underlying transaction (loan agreement).
In case the derivative financial instruments fulfil the criteria for cash flow hedge accounting (CFH – Cash flow hedge), the effective portion of the change in fair value is recognised in other comprehensive income, not in profit and loss. The ineffective portion is immediately recognised as an expense in the item “Result from interest rate derivative trans-actions”. The gains or losses from the measurement of the cash flow hedges recognised in other comprehensive income are reclassified into profit or loss in the period in which the underlying transaction becomes effective, or the expected cash flows are no longer expected to occur. The effectiveness of the hedging relationship between the hedging instru-ment and the underlying transaction is assessed and documented at the inception of the hedge and subsequently reas-sessed on an ongoing basis.
Derivative financial instruments no longer qualifying for cash flow hedge accounting, such as interest rate caps, floors and swaps without a concurrent loan agreement, are referred to as “fair value derivatives”, to clearly distinguish these instruments from cash flow hedges. These are, for example, interest rate swaps, without a concurrent credit loan agreement as well as swaptions, interest caps and interest floors. Pursuant to IAS 39, derivatives not qualifying for hedge accounting are assigned to the category “held for trading” (HFT). Changes in the fair value are therefore recog-nised entirely in profit or loss in the item “Result from interest derivative transactions”.
CONSOLIDATED FINANCIAL STATEMENTS
CO
NS
OL
IDA
TE
D F
INA
NC
IAL
STA
TE
ME
NT
S
111
The fair values of interest rate swaps, swaptions, caps and floors are calculated by discounting the future cash flows from variable payments on the basis of generally accepted financial models. The interest rates for the discount of the future cash flows are estimated on basis of an interest rate curve which is observable on the market. For the calculation inter- bank middle rates are used.
h) Income from services rendered The position “income from services rendered” at CA Immo Group includes income from services rendered, which are
booked in accordance with IAS 18 as well as income from construction contracts for development works in accordance with IAS 11.
A service rendered is a service recorded in time units for a client (e.g. time-dependent advice for reconstruction, planning service or project support).
The income from a construction contract for development works (e.g. project management, construction support and approval of e.g. building construction, interior construction or property development) is recorded proportionally ac-cording to the percentage of completion (“percentage of completion method”) of the total contract.
For construction contracts, the revenues are calculated proportionally, based on the ratio between contract costs borne, incurred for work performed to date, and the estimated total contract costs (“cost-to-cost method”) and thus, recorded as receivables and revenues. An expected loss is recognised as an expense as soon as such loss is probable.
i) Construction work Construction work covers the construction of buildings on the property of the customers where CA Immo Group exe-
cutes the construction, with or without a general constructor.
The revenues from construction works are recorded based on the proportion of the work performed („percentage of completion method“) and thus presented as receivables and revenues. The stage of completion is calculated as percent-age of the construnction costs incurred at the reporting date from the estimated total construction cost (cost-to-cost method) and thus, is presented as receivables and revenues. An expected loss on a construction contract is recognised as an expense as soon as such loss is probable.
j) Other non-financial instruments (Non-FI – non financial instrument) Other non-financial assets mainly consist of prepayments made on investment properties, accrued services in pro-
gress receivables from fiscal authorities and prepaid expenses. They are measured at cost less any impairment losses.
Other non-financial liabilities refer to liabilities to fiscal authorities (including social insurance related liabilities), short-term rent prepayments and advance payments. They are recognized at the date of acquisition at the amount corre-sponding to the expected outflow of resources and the cost of acquisition. Changes in value arising from updated in-formation are recognised in profit or loss.
k) Assets held for sale and disposal groups Non-current assets and disposal groups are classified as held for sale if the relevant book value is expected to be real-
ised from a disposal and not from continued use. This is the case when the relevant non-current assets and disposal groups are available for immediate sale in their current condition and a disposal is highly probable. Furthermore, the sale must be expected to be completed within one year of the classification as held for sale. Disposal groups consist of assets that are to be sold together in a single transaction and the associated liabilities that are to be transferred in the course of this transaction.

CONSOLIDATED FINANCIAL STATEMENTS
112
Non-current assets and disposal groups that are classified as held for sale are generally recognised at the lower of book and fair value less costs to sell. Investment properties, which are still measured according to the fair value model, are exempted from this rule and interest bearing liabilities that are still measured at amortised cost as well as deferred taxes according to IAS 12.
l) Payment obligations to employees Variable remuneration As a part of their variable remuneration components, Management Board members could participate in a long term
incentive scheme (LTI) from business year 2010 until 2014. LTI is a revolving programme with a term (holding period) of three years per tranche; it presupposed a personal investment limited to 50% of the fixed annual salary for Manage-ment Board members. The investment is evaluated at the closing rate on 31.12., with the number of associated shares determined on the basis of this evaluation. At the end of each three-year performance period, a target/actual compari-son is applied to define target attainment. The critical factor is the value generated within the Group in terms of NAV growth, TSR (total shareholder return) and growth of FFO (funds from operations); weighting and respective target figures are set each year. Payments are made in cash. Within the remuneration system for the Management Board, the LTI programme was dissolved in 2015 and replaced by bonus payments based on phantom shares. The LTI programme remains effective for managerial staff with the personal investment being limited to 35 % of the fixed annual salary.
Since 2015, performance-related payments to the Management Board have been restricted to 200 % of the gross annu-al salary. The bonus payment is linked to long-term operational and quality-based targets and also takes account of non-financial performance criteria. Of the variable remuneration, 50% is linked to the attainment of short-term targets defined annually (annual bonus); the other half of the performance-related components depends on the exceeding of annually defined indicators such as return on equity (ROE), funds from operations (FFO) and NAV growth. The level of the bonus actually paid depends on the degree of target attainment: the values agreed and actually achieved at the end of each business year are compared and confirmed by the Remuneration Committee. Half of performance-related remu-neration takes the form of immediate payments (short term incentive); the remaining 50% is converted into phantom shares on the basis of the average rate for the last 60 days of the business year relevant to target attainment. The pay-ment of phantom shares is made in cash in three parts after 12 months, 24 months (mid term incentive) and 36 months (long term incentive) at the average rate for the last 60 days of the payment year.
For this kind of share-based remuneration, which is settled in cash, the liability incurred is recognised as a provision in the amount of the attributable fair value. Until the debt is settled, the attributable fair value is determined afresh on every closing date and settlement date. All changes are recognised in the income statement in the relevant business year.
Defined benefit plans upon termination of employment Obligations arising from defined benefit pension plans exist for four persons in the CA Immo Germany Group. The
commitments relate to three pension benefits for already retired managing directors, as well as one ongoing pension benefit. In accordance with IAS 19.63, reinsurance contracts in respect of defined benefit pension obligations are pre-sented as a net debt (asset).

CONSOLIDATED FINANCIAL STATEMENTS
CO
NS
OL
IDA
TE
D F
INA
NC
IAL
STA
TE
ME
NT
S
113
Each year, external actuarial calculations are obtained for the defined benefit pension obligations. The defined benefit obligation or liability is calculated according to IAS 19 using the projected unit credit method and based on the follow-ing parameters:
31.12.2016 31.12.2015
Interest rate 1.65% 2.01%
Salary increases expected in the future 2.0% 2.0%
Accumulation period 25 years 25 years
Expected income from plan asset 1.65% 2.01%
The actual return on plan assets for 2016 is 2.00 % (31.12.2015: 1.56 %).
Service cost and interest expense related to the obligation as well as the interest income related to the plan assets are recognised in the year in which they arise. Actuarial gains and losses less deferred taxes related to the obligation and the plan assets are recognised in other comprehensive income.
CA Immo Group has a legal obligation to make a one-time severance payment to staff employed in Austria before 1.1.2003 in the event of dismissal or retirement. The amount of this payment depends on the number of years of service and the relevant salary at the time the settlement is payable. It varies between two and twelve monthly salary payments. In CA Immo Group, contract stipulated severance exists for several employees. According to IAS 19, a provision is recognised for this defined benefit obligation. The interest rate used for the computation of this provision amounts to 0.00 % (2015: 0.49 %).
Defined contribution plans CA Immo Group has the legal obligation to pay 1.53% of the monthly salary of all staff joining companies in Austria
after 31.12.2002 into a staff pension fund. No further obligations exist. The payments are considered as staff expenses and included in indirect expenses.
Based on agreements with three different pension funds in Austria and a benevolent fund for small and medium-sized enterprises in Germany, a defined contribution pension commitment exists for employees in Austria and Germany after a certain number of years of service (Austria: 1 or 3 years, irrespective of age; Germany: immediately upon reaching the age of 27). The contribution is calculated as a percentage of the relevant monthly gross salary, namely 2.5% or 2.7% in Austria, and 2.0% in Germany. The contributions paid vest after a certain period (Austria: 3 or 4 years; Germany: 3 years) and are paid out as monthly pension upon retirement.
m) Provisions and contingent liabilities Provisions are recognised if CA Immo Group has a legal or constructive obligation towards a third party as a result of
a past event and the obligation is likely to lead to an outflow of funds. Such provisions are recognised in the amount representing the best possible estimate at the time the consolidated financial statements are prepared. If the present value of the provision determined on the basis of prevailing market interest rates differs substantially from the nominal value, the present value of the obligation is recognised.
If the amount of an obligation cannot be estimated reliably, the outflow of funds from the obligation is not likely, or the occurrence of the obligation depends on future events it represents a contingent liability. In such cases, a provision is not recognised and an explanation of material facts is disclosed in the notes.

CONSOLIDATED FINANCIAL STATEMENTS
114
n) Taxes The income tax expense reported for the business year contains the income tax on the taxable income (current and for
other periods) of the individual subsidiaries calculated at the tax rate applicable in the relevant country (“current tax”), and the change in deferred taxes recognised in profit and loss (“deferred tax”), as well as the tax effect arising from amounts recognised in equity not giving rise to temporary differences and recognised in equity (e.g. the tax related to ancillary expenses for capital increases and subscription rights due to convertible bonds as well as the valuation of derivative transactions to some extent). Changes in deferred taxes resulting from foreign currency translation are in-cluded in deferred income tax expense.
In line with IAS 12, the calculation of deferred taxes is based on all temporary differences between the tax base of as-sets or liabilities and their book values in the consolidated statement of financial position. Deferred tax assets on tax losses carried forward are recognised taking into account the fact whether they can be carried forward indefinitely or only up to a certain time as well as the extent of their expected use in the future. The amount of the deferred tax asset recognised is determined based on projections for the next 3 to 5 years which show the expected use of the tax losses carried forward in the near future and on the existence of sufficient taxable temporary differences, mainly resulting from investment property.
The deferred taxes are calculated based on the following tax rates:
Country Tax rate Country Tax rate
2016 2015 2016 2015
Bulgaria 10.0% 10.0% Serbia 15.0% 15.0%
Germany 15.8% to 31.9% 15.8% to 31.9% Slovakia 21.0% 22.0%
Croatia 18.0% 20.0% Slovenia 19.0% 17.0%
Netherlands 20.0% / 25.0% 20.0% / 25.0% Czech Republic 19.0% 19.0%
Austria 25.0% 25.0% Ukraine 18.0% 18.0%
Poland 19.0% 19.0% Hungary 9.0% 10.0% / 19.0%
Romania 16.0% 16.0% Cyprus 12.5% 12.5%
Russia 20.0% 20.0%
A group and tax compensation agreement was concluded in Austria for the formation of a tax group as defined by Section 9 of the Austrian Personal Income Tax and Corporate Income Tax Act (KStG) for almost all companies of CA Immo Group. The head of the group is CA Immobilien Anlagen Aktiengesellschaft, Vienna.
For certain entities within the CA Immo Germany Group a tax group has been established in accordance with German income tax legislation. The head of the tax group is CA Immo Deutschland GmbH, Frankfurt. Based on profit and loss transfer agreements the members of the tax group are required to transfer their entire profit to the head of the group (being the annual surplus before the profit transfer, less any loss carried forward from the previous year and after recognition or release of reserves). The head of the group has an obligation to balance any annual deficit arising in a group entity during the term of the agreement to the extent that such deficits exceed the amounts which can be released from other reserves that have been allocated out of profits earned during the term of the agreement.
o) Leases CA Immo Group determines whether an arrangement contains a lease based on the economic substance of the ar-
rangement and evaluates whether the fulfilment of the arrangement is dependent on the use of a specific asset or assets and whether the arrangement contains a right to use the asset, even if such right is not explicitly stated in the agree-ment.
CONSOLIDATED FINANCIAL STATEMENTS
CO
NS
OL
IDA
TE
D F
INA
NC
IAL
STA
TE
ME
NT
S
115
According to IAS 17, the allocation of a leased asset to the lessor or lessee is based on the criterion of accountability of all significant risks and rewards associated with ownership of the leased asset. The characteristics of the CA Immo Group as lessor of investment properties corresponds to an operating lease because the economic ownership remains with CA Immo Group for the rented properties and thus the significant risks and rewards are not transferred.
p) Operating segments The segments were identified on the basis of the information regularly used by the company’s principal decision
makers when deciding on the allocation of resources and assessing profitability. The principal decision-making body of CA Immo Group is the Management Board. It controls the individual properties (basic reporting segments) that are aggregated into reportable business segments by regions (based on the geographic region), and within the regions by income producing property and property under development based on the stage of development of the properties. The aggregation of the regions mainly takes place based on evaluation of the market dynamics and the risk profiles which mainly impact economic characteristics. According to the assessment of CA Immo Group, the properties in the portfo-lio need to be separated into investment properties and investment properties under development, based on the criteria “nature of products and services” and “nature of production processes” according to IFRS 8.
The properties are allocated to the reporting segments according to location/region, their category and the main activi-ties of the management/holding companies. Items that cannot be directly attributed to a property or segment manage-ment structure are disclosed in the column “Holding”. The presentation corresponds to CA Immo Group’s internal reporting system. The following segments have been identified:
– Income producing properties: Investment properties rented, own used properties and investment properties pursu-ant to IFRS 5
– Development: Properties under development and land banks, completed development properties (investment prop-erties) until the second annual reporting date after completion (depending on the tenancy rate or beginning of the sales process), development services for third parties, properties under development pursuant to IFRS 5, and prop-erties held for trading
– Holding: general management and financing activities of CA Immo Group.
The reporting Eastern Europe core regions segment comprises the Czech Republic, Slovakia, Hungary, Poland and Romania. The reporting Eastern Europe other regions segment consists of Bulgaria, Croatia, Slovenia, Russia, Ukraine and Serbia. Joint ventures are included with 100% of the assets and liabilities as well as revenues and expenses of the entities in the segment, irrespective of the method of consolidation into the financial statements. Adjustments in ac-cordance with the consolidation method in CA Immo Group are shown in the column Consolidation.
q) Revenue recognition Rental revenues Rental revenues are recognised on a straight-line basis over the term of the lease. Lease incentive agreements, such as
rent-free periods, reduced rents for a certain period or one-off payments to the tenants, which can be freely used in the course of their businesses, are included in rental income. Therefore, the lease incentives are allocated on a straight-line basis over the entire expected contractual lease term accordingly. In the case of leases with constant rent adjustment over the term (graduated rents), such adjustments are likewise recognised on a straight-line basis over the term of the lease. Any adjustments attributable to inflation, in contrast, are not spread over the underlying term of the lease. The term of a lease over which rental income is allocated on a straight-line basis comprises the non-terminable period as well as any further periods for which the tenant can exercise an option, with or without making additional payments, provided that the exercise of the option is estimated as being probable at the inception of the lease.
CONSOLIDATED FINANCIAL STATEMENTS
116
Conditional rental income, such as any amounts that are conditional on the revenues generated in the business prem-ises, are recognised in profit or loss in the period in which they are assessed.
Rental income is measured at the fair value of the consideration received or outstanding, less any directly related re-ductions.
Payments received from tenants for the early termination of a lease and payments for damage to rented premises are recognised as rental income in the period in which they are incurred.
Service charge income Operating costs incurred by CA Immo Group for properties rented to third parties, which are charged to tenants, are
presented in the consolidated income statement in “Operating costs charged to tenants”.
Revenues from the sale of investment properties Income from the sale of properties is recognised when:
– all material economic risks and rewards associated with ownership have passed to the buyer, – CA Immo Group does not retain any rights of disposal or effective power of disposition in respect of the object
sold, – the amount of the revenues and the expenses incurred or to be incurred in connection with the sale can be relia-
bly determined, and – it is sufficiently probable that the economic benefit from the sale will flow to CA Immo Group.
Non-current earnings received in advance are measured at par value and subsequently with a reasonable market inter-est rate reflecting maturity and risk. The accrued interest is recognised in the consolidated income statement in the financial result.
Income from the sale of properties under construction is assessed according to IFRIC 15 in order to establish whether IAS 11 (construction contracts) or IAS 18 (revenue recognition) applies and thus to determine when income from the sale during the construction period shall be recognised. Requirement for the recognition of a disposal is that CA Immo Group has no more effective power to dispose in respect of the constructed property.
Revenues from construction contracts and construction works In case of a construction contract for development works, respectively construction works (construction of a building
on the land of a customer), the sponsor can exercise significant influence on the construction of the property. In com-pliance with IAS 11, related income is recognised– by reference to the stage of completion of the contract activity at the end of the reporting period. The stage of completion is determined according to the ratio between contract costs in-curred for work performed as of the reporting date and the estimated total contract costs.
Given there is no customized project planning which means that the purchaser has only limited options to influence the specification of the property, it is an agreement for the sale of goods and the revenue is recognized according to the forenamed criteria for the sale of real estate properties. For the purpose of revenue recognition in accordance with IAS 18, contracts are separated into their individual components if materially different services are combined into a single arrangement. Such a multi-component transaction is assumed to exist when a contract contains several complementary but different elements, such as a service provided alongside a sale of an investment property. In such cases, revenue is recognised separately for each of these different elements. The purchase price of the property is recognised according to the revenue recognition criteria applicable to sales. Service revenue is recognised in accordance with the stage of com-pletion. The following have been identified as material components of investment properties: procurement of planning permission, site development, surface construction and interior works. The allocation of the total revenues to the indi-vidual components is done by residual value method. The fair value of the components already delivered is obtained by deducting the fair value of the components not yet delivered.

CONSOLIDATED FINANCIAL STATEMENTS
CO
NS
OL
IDA
TE
D F
INA
NC
IAL
STA
TE
ME
NT
S
117
Income from service rendered Income from service contracts are recorded in accordance to the service rendered (counter-value of time-based units)
until the reporting date.
r) Result from the sale of investment properties In accordance with IAS 40, investment properties are measured as of each quarterly reporting date and, as a general
rule, changes in fair values are recognised in profit and loss, as result from revaluation (revaluation gain/loss). When property assets are sold, the valuation gain/loss realised during the current business year to date is reclassified to the result from the sale of investment properties together with the other gain/loss on disposal. The book value of goodwill that has been allocated to a property sold is recognised as part of the disposal within the result from the sale of invest-ment properties.
s) Indirect expenses CA Immo Group capitalizes indirect expenses (mainly personnel expenses) to the extent that they can be attributed to
the construction cost of properties under development and properties held for trading. These internally-produced capi-talised expenses and capitalised changes in work-in-progress respectively are reported as correction of the indirect expenses.
t) Financial result Finance costs comprise interest payable for external financing, interest recognised by the effective interest-rate meth-
od (if not required to be capitalised according to IAS 23), interest for committed external funds not yet received, current interest on derivative transactions, the interest costs arising from the calculation of retirement benefits, the net result attributable to non-controlling interests in limited partnerships and expenses similar to interest. Interest is deferred over time by the effective interest-rate method. The net result of non-controlling interests in limited partnerships con-tains the pro rata net income of non-controlling partners of limited partnerships in Germany, whose capital contribu-tion, updated with the profit share, is recognised as debt in the statement of financial position under “other liabilities”.
Other financial result comprises the result from the repurchase of own interest-bearing liabilities (e.g. loans, bonds) if the purchase price was below the book value.
Foreign currency gains and losses mainly relate to the result of exchange rate differences in connection with financing and investment transactions, as well as the changes in value and the result from the realisation of forward exchange transactions.
The result from derivative transactions consists of gains and losses from the sale or measurement of interest rate swaps, caps and the swaption unless they are recognised in other comprehensive income as cash flow hedges. The ineffective portion of the cash flow hedge relationships is also recognised in the result from derivative transactions.
The result from financial investments includes interest, dividends and other income from the investment of funds and investments in financial assets and the expected return on plan assets.
The result from other financial investments mainly relates to the valuation of loans as well as impairments of securi-ties available for sale.
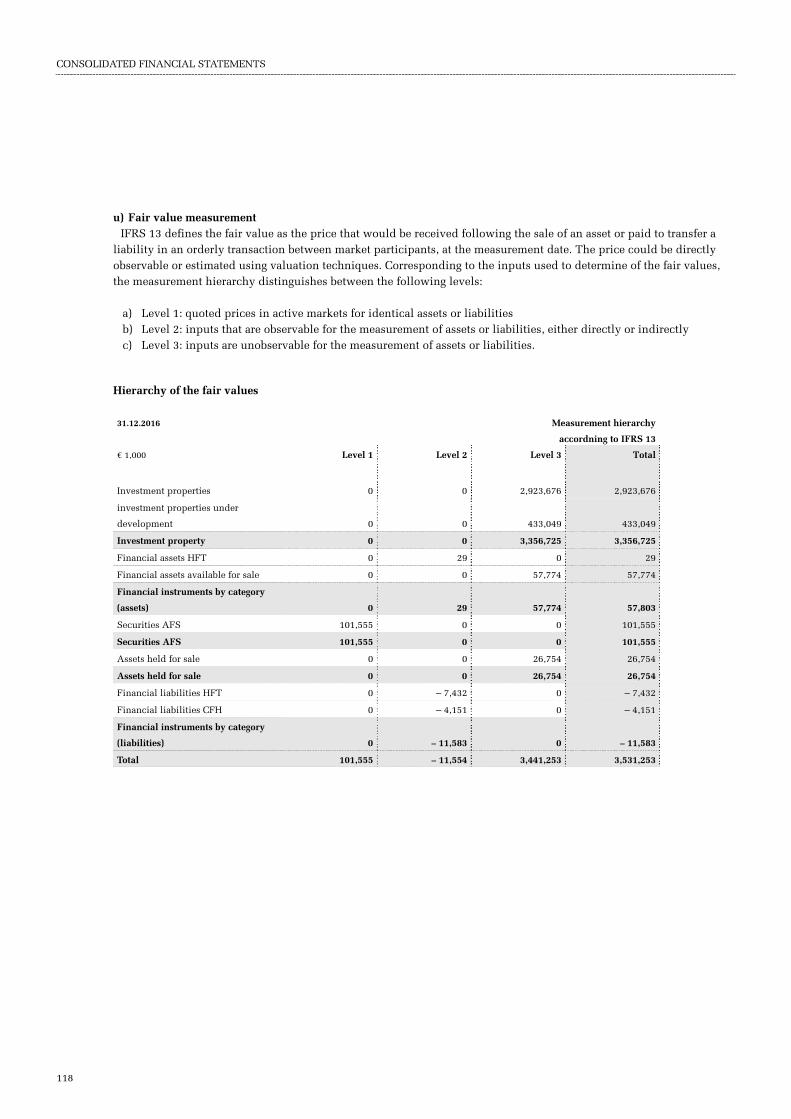
CONSOLIDATED FINANCIAL STATEMENTS
118
u) Fair value measurement IFRS 13 defines the fair value as the price that would be received following the sale of an asset or paid to transfer a
liability in an orderly transaction between market participants, at the measurement date. The price could be directly observable or estimated using valuation techniques. Corresponding to the inputs used to determine of the fair values, the measurement hierarchy distinguishes between the following levels:
a) Level 1: quoted prices in active markets for identical assets or liabilities b) Level 2: inputs that are observable for the measurement of assets or liabilities, either directly or indirectly c) Level 3: inputs are unobservable for the measurement of assets or liabilities.
Hierarchy of the fair values
31.12.2016 Measurement hierarchy
accordning to IFRS 13
€ 1,000 Level 1 Level 2 Level 3 Total
Investment properties 0 0 2,923,676 2,923,676
investment properties under
development 0 0 433,049 433,049
Investment property 0 0 3,356,725 3,356,725
Financial assets HFT 0 29 0 29
Financial assets available for sale 0 0 57,774 57,774
Financial instruments by category
(assets) 0 29 57,774 57,803
Securities AFS 101,555 0 0 101,555
Securities AFS 101,555 0 0 101,555
Assets held for sale 0 0 26,754 26,754
Assets held for sale 0 0 26,754 26,754
Financial liabilities HFT 0 – 7,432 0 – 7,432
Financial liabilities CFH 0 – 4,151 0 – 4,151
Financial instruments by category
(liabilities) 0 – 11,583 0 – 11,583
Total 101,555 – 11,554 3,441,253 3,531,253

CONSOLIDATED FINANCIAL STATEMENTS
CO
NS
OL
IDA
TE
D F
INA
NC
IAL
STA
TE
ME
NT
S
119
31.12.2015 Measurement hierarchy
according to IFRS 13
€ 1,000 Level 1 Level 2 Level 3 Total
Investment properties 0 0 2,714,305 2,714,305
investment properties under development 0 0 408,979 408,979
Investment property 0 0 3,123,284 3,123,284
Financial assets HFT 0 238 0 238
Financial assets available for sale 0 0 58,660 58,660
Financial instruments by category (assets) 0 238 58,660 58,898
Securities AFS 105,250 0 0 105,250
Securities AFS 105,250 0 0 105,250
Assets held for sale 0 0 54,048 54,048
Assets held for sale 0 0 54,048 54,048
Financial liabilities HFT 0 – 5,801 0 – 5,801
Financial liabilities CFH 0 – 6,942 0 – 6,942
Financial instruments by category (liabilities) 0 – 12,743 0 – 12,743
Total 105,250 – 12,505 3,235,993 3,328,738
Reclassifications between levels did not occur.
Hierarchy classification The following tables show the development of separate classes that are assigned according to IFRS 13 to level 3 of the
fair value hierarchy:
2016 Office Office Office Retail Retail Hotel
€ 1,000 Austria* Germany* Eastern Europe Austria Eastern Europe Austria
As at 1.1. 319,030 753,544 1,201,280 107,300 37,700 85,200
Additions 1,305 16,171 25,633 442 – 168 92
Disposals – 10,991 0 – 4,000 – 13,040 – 26,784 – 41
Purchase of real estate companies 0 0 165,205 0 0 0
Valuation 5,163 81,517 – 8,225 2,512 – 1,825 – 663
Reclassification IFRS 5 0 0 0 0 0 0
Reclassification 0 0 0 0 0 0
Change in lease incentives 103 518 – 1,298 – 15 – 123 12
Currency translation adjustments 0 0 0 0 0 0
As at 31.12. 314,610 851,750 1,378,595 97,200 8,800 84,600 * The fair value of the classes Office Austria and Office Germany also includes the fair value of the own used properties.
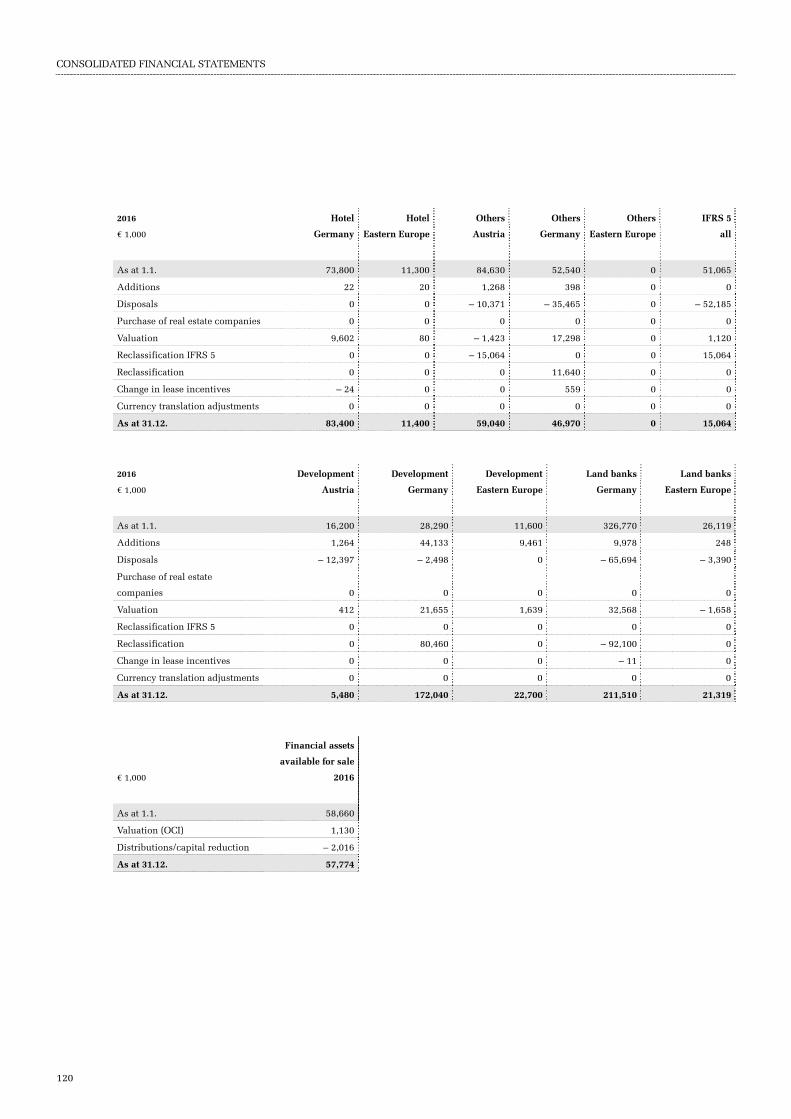
CONSOLIDATED FINANCIAL STATEMENTS
120
2016 Hotel Hotel Others Others Others IFRS 5
€ 1,000 Germany Eastern Europe Austria Germany Eastern Europe all
As at 1.1. 73,800 11,300 84,630 52,540 0 51,065
Additions 22 20 1,268 398 0 0
Disposals 0 0 – 10,371 – 35,465 0 – 52,185
Purchase of real estate companies 0 0 0 0 0 0
Valuation 9,602 80 – 1,423 17,298 0 1,120
Reclassification IFRS 5 0 0 – 15,064 0 0 15,064
Reclassification 0 0 0 11,640 0 0
Change in lease incentives – 24 0 0 559 0 0
Currency translation adjustments 0 0 0 0 0 0
As at 31.12. 83,400 11,400 59,040 46,970 0 15,064
2016 Development Development Development Land banks Land banks
€ 1,000 Austria Germany Eastern Europe Germany Eastern Europe
As at 1.1. 16,200 28,290 11,600 326,770 26,119
Additions 1,264 44,133 9,461 9,978 248
Disposals – 12,397 – 2,498 0 – 65,694 – 3,390
Purchase of real estate
companies 0 0 0 0 0
Valuation 412 21,655 1,639 32,568 – 1,658
Reclassification IFRS 5 0 0 0 0 0
Reclassification 0 80,460 0 – 92,100 0
Change in lease incentives 0 0 0 – 11 0
Currency translation adjustments 0 0 0 0 0
As at 31.12. 5,480 172,040 22,700 211,510 21,319
Financial assets
available for sale
€ 1,000 2016
As at 1.1. 58,660
Valuation (OCI) 1,130
Distributions/capital reduction – 2,016
As at 31.12. 57,774
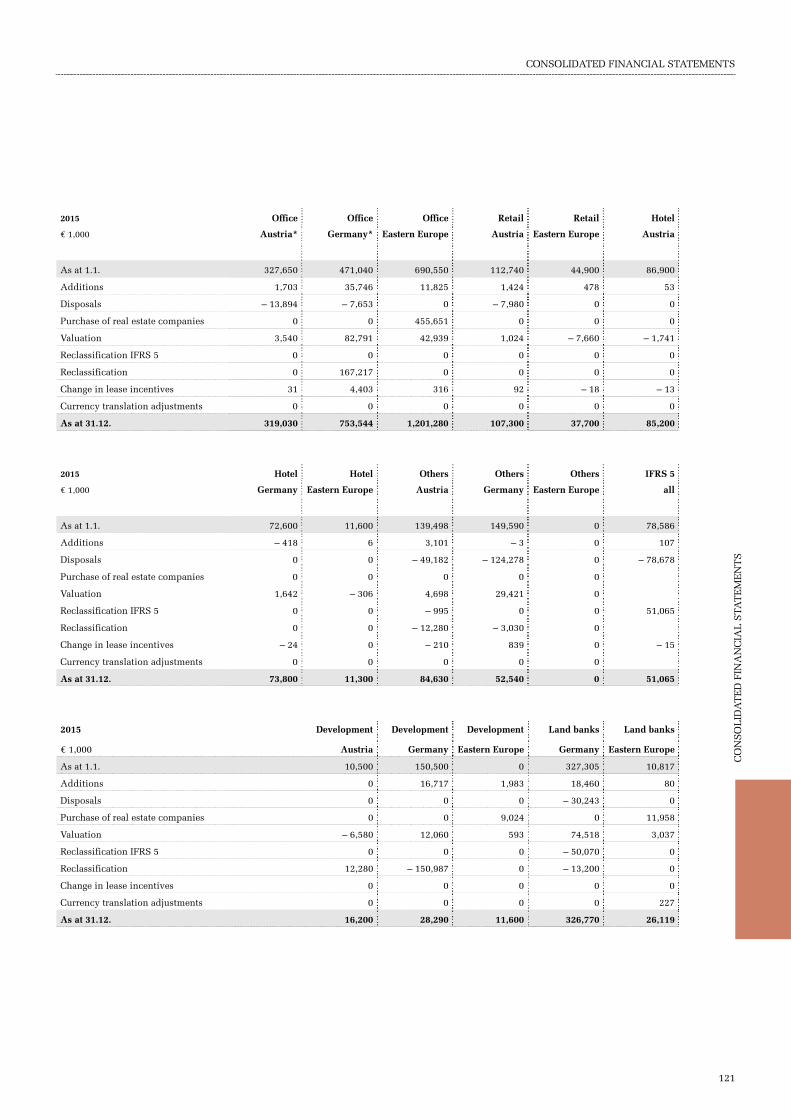
CONSOLIDATED FINANCIAL STATEMENTS
CO
NS
OL
IDA
TE
D F
INA
NC
IAL
STA
TE
ME
NT
S
121
2015 Office Office Office Retail Retail Hotel
€ 1,000 Austria* Germany* Eastern Europe Austria Eastern Europe Austria
As at 1.1. 327,650 471,040 690,550 112,740 44,900 86,900
Additions 1,703 35,746 11,825 1,424 478 53
Disposals – 13,894 – 7,653 0 – 7,980 0 0
Purchase of real estate companies 0 0 455,651 0 0 0
Valuation 3,540 82,791 42,939 1,024 – 7,660 – 1,741
Reclassification IFRS 5 0 0 0 0 0 0
Reclassification 0 167,217 0 0 0 0
Change in lease incentives 31 4,403 316 92 – 18 – 13
Currency translation adjustments 0 0 0 0 0 0
As at 31.12. 319,030 753,544 1,201,280 107,300 37,700 85,200
2015 Hotel Hotel Others Others Others IFRS 5
€ 1,000 Germany Eastern Europe Austria Germany Eastern Europe all
As at 1.1. 72,600 11,600 139,498 149,590 0 78,586
Additions – 418 6 3,101 – 3 0 107
Disposals 0 0 – 49,182 – 124,278 0 – 78,678
Purchase of real estate companies 0 0 0 0 0
Valuation 1,642 – 306 4,698 29,421 0
Reclassification IFRS 5 0 0 – 995 0 0 51,065
Reclassification 0 0 – 12,280 – 3,030 0
Change in lease incentives – 24 0 – 210 839 0 – 15
Currency translation adjustments 0 0 0 0 0
As at 31.12. 73,800 11,300 84,630 52,540 0 51,065
2015 Development Development Development Land banks Land banks
€ 1,000 Austria Germany Eastern Europe Germany Eastern Europe
As at 1.1. 10,500 150,500 0 327,305 10,817
Additions 0 16,717 1,983 18,460 80
Disposals 0 0 0 – 30,243 0
Purchase of real estate companies 0 0 9,024 0 11,958
Valuation – 6,580 12,060 593 74,518 3,037
Reclassification IFRS 5 0 0 0 – 50,070 0
Reclassification 12,280 – 150,987 0 – 13,200 0
Change in lease incentives 0 0 0 0 0
Currency translation adjustments 0 0 0 0 227
As at 31.12. 16,200 28,290 11,600 326,770 26,119

CONSOLIDATED FINANCIAL STATEMENTS
122
Financial assets
available for sale
€ 1,000 2015
As at 1.1. 56,655
Valuation (OCI) 2,566
Distributions – 561
As at 31.12. 58,660
v) New and revised standards and interpretations First-time application of new and revised standards and interpretations not materially influencing the consolidated financial statements The following standards and interpretations, already adopted by the EU, were applicable for the first time in the busi-
ness year 2016:
Standard / Interpretation Content entry into force1)
Changes in IAS 19 Defined benefit plans: employees contributions 1.2.2015
Annual improvement (cycle 2010– 2012) Miscellaneous 1.2.2015
Changes to IFRS 11 Accounting for acquisitions of interests in joint operations 1.1.2016
Changes to IAS 16 and IAS 38 Clarification of acceptable methods of depreciation and amortisation 1.1.2016
Changes to IAS 27 Equity method in separate financial statements 1.1.2016
IAS 1 Disclosure initiative 1.1.2016
Annual improvement (cycle 2012– 2014) Miscellaneous 1.1.2016
Changes to IAS 16 and IAS 41 Agriculture: bearer plants 1.1.2016
IFRS 10, 12 and IAS 28 Investment entities: applying the consolidation exception 1.1.2016 1) The standards and interpretations are to be applied to business years commencing on or after the effective date.
New and revised standards and interpretations that are not yet compulsory Standard / Interpretation Content entry into force1)
IFRS 15 Revenue from Contracts with Customers 01.01.2018
IFRS 9 Financial instruments 01.01.2018
IFRS 16 Leasing 1.1.2019²
Amendments to IAS 7 Statements of Cash Flows - Disclosure Initiative 1.1.2017²
Amendments to IAS 12 Income Taxes - Recognition of Deferred Tax Assets for Unrealised Losses 1.1.2017²
Amendments to IFRS 15 Clarifications to IFRS 15 Revenue from Contracts with Customers 1.1.2018²
Amendments to IFRS 2 Classification and Measurement of Share-based Payment Transactions 1.1.2018²
Amendments to IFRS 4 Applying IFRS 9 with IFRS 4 Insurance Contracts 1.1.2018²
Annual Improvements to IFRS Standards
(cycle 2014– 2016) Miscellaneous 1.1.2018²/1.1.2017²
IFRIC 22 Foreign Currency Transactions and Advance Considerations 1.1.2018²
Amendments to IAS 40 Transfers of Investment Property 1.1.2018² 1) The standards and interpretations are to be applied to business years commencing on or after the effective date. 2) Not yet adopted by the EU as of the reporting date. The effective date envisaged by an EU Regulation may differ from the date indicated by the IASB.
The above listed revisions and interpretations are not being early adopted by CA Immo Group.

CONSOLIDATED FINANCIAL STATEMENTS
CO
NS
OL
IDA
TE
D F
INA
NC
IAL
STA
TE
ME
NT
S
123
IFRS 9: Financial instruments “IFRS 9 Financial Instruments” replaces “IAS 39 Financial Instruments: Recognition and Measurement”. The main
requirements set out in IFRS 9 can be summarized as follows:
The regulations of IFRS 9 provide a new classification model for financial assets / liabilities. While IAS 39 stipulated four measurement categories, IFRS 9 provides only the categories “amortized cost”, “fair value” and for equity instru-ments an option to be recognized in the “other comprehensive income”.
The subsequent measurement of financial assets/ liabilities will be based on three categories with different valuations and a different recognition of changes in value. The categorization results both from the dependence of the contractual cash flows of the instrument and from the business model according to which the instrument is held / managed. As financial instruments measured at “amortized cost” qualify only those, whose contractual terms give rise on specified dates to cash flows that are solely payments of principal and interests. All other financial assets are measured at fair value through profit and loss. For equity instruments that are not held / managed for trading purposes, i.e. for which the primary objective is not the short term value appreciation/realization, an option for recognition in the other com-prehensive income continues to exist.
IFRS 9 provides a three-step model for the recognition of losses and interest. Accordingly, in the first step the losses expected at the date of the acquisition should be recognized at the present value of an expected 12-month loss. In the second step, a significant increase in the risk of default should lead to an increase in the risk provision for the expected loss of the entire residual term. In the third step, upon occurrence of an objective indication of impairment, the interest has to be recognized based on the net book value (book value less risk provision).
For financial liabilities the existing regulations of IAS 39 were carried forward in IFRS 9. The only significant new aspect concerns financial liabilities within the fair value option. For these liabilities, the fair value fluctuations due to changes in the group’s own default risk have to be recognized in the other comprehensive income.
In addition to options regarding transitional regulations, IFRS 9 involves also extensive disclosure requirements. Changes in this regard result mainly from the regulations concerning impairments.
From the current perspective, CA Immo Group is not significantly affected by the recognition of the impairment of receivables. No decision has yet been made on the exercise of the available options regarding transitional regulations.
IFRS 15: Revenue from contracts with customers IFRS 15 supersedes IAS 11, IAS 18 and the related interpretations and stipulates when and in which amount revenue
is recognized. The new standard provides a single, principle-based five-step model, which, apart from certain excep-tions, has to be applied to all contracts with customers.
1. Identification of the contract with the customer 2. Identification of the performance obligations in the contract 3. Determination of the transaction price of the performance obligations in the contract. Explicit rules are provided
about variable consideration, financing components, payments to the customers and non-cash transactions 4. Allocation of the transaction price to the performance obligations in the contract based on stand-alone selling
prices of the individual performance obligations 5. Recognition of revenue when the entity fulfills a performance obligation.
According to IFRS 15, when entering into a contract, it has to be defined if the revenues resulting from contract have to be recorded over time or at a specific point in time. First, it is necessary to clarify based on specific criteria whether the control over a performance obligation is passed over time. If this is not the case, the revenues must be recognised at the point in time when control is passed to the customer.

CONSOLIDATED FINANCIAL STATEMENTS
124
If control is passed over time the revenue may be recognized over time only to the extent that the stage of completion for the performance obligation can be determined reliably using input or output oriented methods.
The standard also contains extensive regulations in respect of qualitative and quantitative information related to the following:
- contracts with customers - significant judgments and other changes - assets resulting from incremental costs for obtaining a contract
The effects of IFRS 15 are not comprehensively analysed as CA Immo Group currently realizes both revenues at a pe-cific point in time and revenues over time. In contrast to IAS 11, the regulations of IFRS 15 can lead to the possibility of an earlier realization of income in the case of residential construction. This realization over time of the revenues in the above-mentioned sector depends significantly on the contractual structure and will be analyzed in detail for each prop-erty. An earlier realization of revenue may impact the result from joint ventures as residential projects are carried out in joint venture structures within CA Immo Group.
No decision has been yet made on the exercise of available options regarding the transition.
IFRS 16: Leases The new standard defines a lease as a contract that conveys the right to control the use of an identified asset for a pe-
riod of time in exchange for consideration. To be classified as lease, the contract needs to fulfill the following criteria:
- The fulfillment of the contract depends on the use of an identified asset. - The contract must convey the right to control the use of an identified asset.
Under IFRS 16, lessors classify all leases in the same manner as under IAS 17, distinguishing between two types of leases: finance and operating. Lessees, however, do not need to separate between the types of leases but need to recog-nize an asset as a “right of use” for all lease contracts upon lease commencement and need to book a corresponding leasing liability. Leases of low-value assets and short-term leases are excepted.
The changes of IFRS 16 on the operating leases of CA Immo Group will have no material impact on the financial statements of CA Immo Group, since these mainly concern leases for furniture and office equipment and immaterial rental agreements in Germany.
The application of IFRS 16 may lead to the recognition of a right of use and a liability in those cases where CA Immo Group is lessee and not owner of a land plot. The exact impact of IFRS 16 on CA Immo Group is still being analyzed; from the current perspective the effect on the financial statements of the CA Immo Group is not material.
Other changes The first time adoption of all other new standards interpretations is not likely to have any material impact on consoli-
dated financial statements.

CONSOLIDATED FINANCIAL STATEMENTS
CO
NS
OL
IDA
TE
D F
INA
NC
IAL
STA
TE
ME
NT
S
125
NOTES TO THE CONSOLIDATED INCOME STATEMENT, CONSOLIDATED STATEMENT OF COMPREHENSIVE INCOME, CONSOLIDATED STATEMENT OF FINANCIAL POSITION AND CONSOLIDATED CASH FLOW STATEMENT
1. Segment reporting The operating segments generate gross revenues and other income from rental activities, the sale of properties held for
trading, the sale of properties as well as from development services. Gross revenues and other income are allocated to the country and segment the properties or services are located/provided in.
Business relationships within an operating segment are consolidated within the segment. Business relationships with other operating segments are disclosed separately and reconciliations to the consolidated income statement and consol-idated statement of financial position are presented in the “Consolidation” column.
The accounting principles of the reportable segments correspond to those described under “Summarized presentation of accounting methods”.
Transactions between operating segments are allocated as follows:
– Management fees for services performed by the holding segment (e.g. property management, financial negotiation, purchase and sale of properties, accounting, controlling) are charged on the basis of actual fees and allocated to the individual segments on the basis of the invoiced services. They are recognised in the column “Holding” as in-come from services rendered.
– Management companies are assigned to the segments according to their main activities. Management fees charged by these companies are allocated based on the invoiced services to the individual operating segment of the respec-tive region and are recognised in the segment, which the management company has been assigned to, as income from services rendered.
– Eastern Europe core region segment consists of Hungary, Poland, Romania, the Czech Republic as well as Slovakia. – Eastern Europe other region segment consists of Bulgaria, Croatia, Slovenia, Russia, Ukraine and Serbia.

CONSOLIDATED FINANCIAL STATEMENTS
126
€ 1,000 Austria Germany
2016
Income
producing
Development Total Income
producing
Development
Total Income
producing
Rental income 32,205 0 32,205 59,563 16,954 76,516 82,474
Rental income with other operating
segments 520 0 520 732 0 732 0
Operating costs charged to tenants 7,518 0 7,518 14,089 2,620 16,709 29,543
Operating expenses – 8,553 0 – 8,553 – 15,274 – 3,503 – 18,777 – 32,090
Other expenses directly related to
properties rented – 3,465 0 – 3,465 – 4,005 – 852 – 4,857 – 7,178
Net rental income 28,225 0 28,225 55,104 15,218 70,322 72,750
Result from hotel operations 0 0 0 0 0 0 0
Other expenses directly related to
properties under development 0 – 309 – 309 0 – 2,813 – 2,813 0
Result from trading and construction
works 0 2,339 2,339 0 16,181 16,181 0
Result from the sale of investment
properties 2,114 – 167 1,948 15,052 5,152 20,204 675
Income from services rendered 0 0 0 291 10,966 11,257 1,300
Indirect expenses – 1,851 – 65 – 1,917 – 6,346 – 14,265 – 20,611 – 11,445
Other operating income 55 0 55 228 713 941 65
EBITDA 28,543 1,798 30,341 64,329 31,152 95,481 63,345
Depreciation and impairment/reversal – 1,425 0 – 1,425 – 125 – 572 – 696 – 717
Result from revaluation 2,028 387 2,415 79,847 96,890 176,738 – 21,357
Result from joint ventures 0 0 0 0 0 0 0
Result of operations (EBIT) 29,145 2,185 31,331 144,052 127,471 271,522 41,270
31.12.2016
Property assets1) 566,323 29,382 595,705 1,205,942 946,504 2,152,446 1,358,965
Other assets 23,287 15,928 39,215 259,594 463,588 723,181 255,894
Deferred tax assets 0 0 0 499 692 1,191 936
Segment assets 589,610 45,311 634,920 1,466,034 1,410,784 2,876,819 1,615,795
Interest-bearing liabilities 230,104 34,051 264,154 676,212 336,364 1,012,576 780,914
Other liabilities 14,402 4,669 19,071 33,129 277,335 310,464 41,740
Deferred tax liabilities incl. current
income tax liabilities 48,025 1,690 49,715 129,673 106,471 236,144 34,806
Liabilities 292,531 40,409 332,941 839,014 720,170 1,559,184 857,460
Shareholders' equity 297,078 4,902 301,980 627,021 690,614 1,317,634 758,335
Capital expenditures2) 3,081 12,095 15,176 10,918 133,609 144,528 184,696 1) Property assets include rental investment properties, investment properties under development, hotels and other own used properties, proper-
ties held for trading and properties available for sale. 2) Capital expenditures include all acquisitions of properties (long-term and short-term) including additions from initial consolidation, office
furniture and other equipment and intangible assets; thereof € 14,906 K (31.12.2015: € 6,610 K) in properties held for trading.

CONSOLIDATED FINANCIAL STATEMENTS
CO
NS
OL
IDA
TE
D F
INA
NC
IAL
STA
TE
ME
NT
S
127
Eastern
Europe
core regions
Eastern
Europe
other regions
Total segments Transition Total
Development Total Income
producing
Development Total Holding Consolidation
1,681 84,155 16,421 0 16,421 209,298 0 – 43,695 165,603
0 0 0 0 0 1,252 0 – 1,252 0
728 30,271 5,540 0 5,540 60,038 0 – 13,131 46,906
– 657 – 32,747 – 6,011 0 – 6,011 – 66,088 0 13,362 – 52,726
– 162 – 7,341 – 552 0 – 552 – 16,215 57 3,525 – 12,633
1,589 74,339 15,398 0 15,398 188,284 57 – 41,191 147,150
0 0 0 0 0 0 0 0 0
– 131 – 131 0 – 51 – 51 – 3,304 0 971 – 2,333
0 0 0 0 0 18,520 0 – 9,090 9,430
425 1,100 – 1,149 0 – 1,149 22,103 – 68 1,306 23,340
0 1,300 0 0 0 12,557 10,893 – 10,185 13,265
– 807 – 12,252 – 1,428 – 102 – 1,530 – 36,311 – 21,335 13,505 – 44,140
11 77 10 0 10 1,082 293 – 502 873
1,087 64,432 12,831 – 153 12,678 202,932 – 10,161 – 45,186 147,585
– 55 – 772 – 1 0 – 1 – 2,895 – 534 – 3 – 3,432
– 101 – 21,458 2,173 – 1,480 693 158,387 0 – 20,127 138,260
0 0 0 0 0 0 0 11,419 11,420
932 42,202 15,002 – 1,633 13,369 358,425 – 10,694 – 53,897 293,833
79,739 1,438,704 229,200 1,920 231,120 4,417,975 0 – 1,005,397 3,412,579
11,859 267,753 7,624 8,820 16,444 1,046,594 655,295 – 806,892 894,997
88 1,024 0 0 0 2,215 40,182 – 40,834 1,563
91,686 1,707,481 236,824 10,740 247,564 5,466,784 695,477 – 1,853,123 4,309,138
62,861 843,775 136,578 14,796 151,374 2,271,880 653,677 – 1,359,918 1,565,639
6,435 48,175 5,135 8 5,143 382,854 12,177 – 112,778 282,253
2,789 37,594 7,621 0 7,621 331,074 1,401 – 75,770 256,705
72,085 929,545 149,334 14,804 164,138 2,985,808 667,255 – 1,548,466 2,104,597
19,601 777,936 87,490 – 4,064 83,426 2,480,976 28,223 – 304,658 2,204,541
12,481 197,177 7,115 0 7,115 363,995 472 – 72,824 291,644

CONSOLIDATED FINANCIAL STATEMENTS
128
€ 1,000 Austria Germany
2015
Income
producing
Development Total Income
producing
Development Total Income
producing
Rental income 35,507 0 35,507 60,181 13,856 74,037 95,364
Rental income with other operating
segments 520 0 520 616 0 616 0
Operating costs charged to tenants 8,890 0 8,890 12,405 2,105 14,510 31,644
Operating expenses – 9,785 0 – 9,785 – 14,215 – 2,984 – 17,199 – 35,024
Other expenses directly related to properties
rented – 3,271 0 – 3,271 – 3,699 – 2,781 – 6,480 – 7,567
Net rental income 31,861 0 31,861 55,288 10,196 65,484 84,418
Result from hotel operations 0 0 0 0 0 0 251
Other expenses directly related to properties
under development 0 0 0 0 – 3,354 – 3,354 0
Result from trading and construction works 0 245 245 0 4,396 4,396 0
Result from the sale of investment
properties 2,967 – 827 2,140 39,944 11,211 51,155 895
Income from services rendered 84 0 84 614 11,270 11,884 535
Indirect expenses – 995 – 460 – 1,454 – 4,777 – 15,885 – 20,662 – 9,677
Other operating income 54 0 54 565 1,931 2,496 680
EBITDA 33,971 – 1,043 32,928 91,634 19,764 111,398 77,102
Depreciation and impairment/reversal – 1,115 0 – 1,115 – 135 – 169 – 305 – 380
Result from revaluation 710 4,728 5,438 47,050 135,571 182,621 10,007
Result from joint ventures 0 0 0 0 0 0 0
Result of operations (EBIT) 33,566 3,685 37,251 138,548 155,165 293,714 86,729
31.12.2015
Property assets1) 593,142 16,958 610,100 1,090,654 891,437 1,982,090 1,361,708
Other assets 50,266 2,528 52,795 185,431 400,617 586,048 215,034
Deferred tax assets 0 0 0 1,165 433 1,598 1,223
Segment assets 643,408 19,486 662,894 1,277,250 1,292,487 2,569,736 1,577,966
Interest-bearing liabilities 264,694 1,214 265,908 623,127 336,002 959,129 925,850
Other liabilities 14,520 2,548 17,068 26,374 245,628 272,001 35,797
Deferred tax liabilities incl. current income
tax liabilities 50,030 3,724 53,754 102,089 79,128 181,218 46,961
Liabilities 329,244 7,486 336,731 751,590 660,759 1,412,348 1,008,608
Shareholders' equity 314,164 12,000 326,164 525,660 631,728 1,157,388 569,357
Capital expenditures2) 3,181 2,489 5,670 72,237 113,458 185,695 16,376
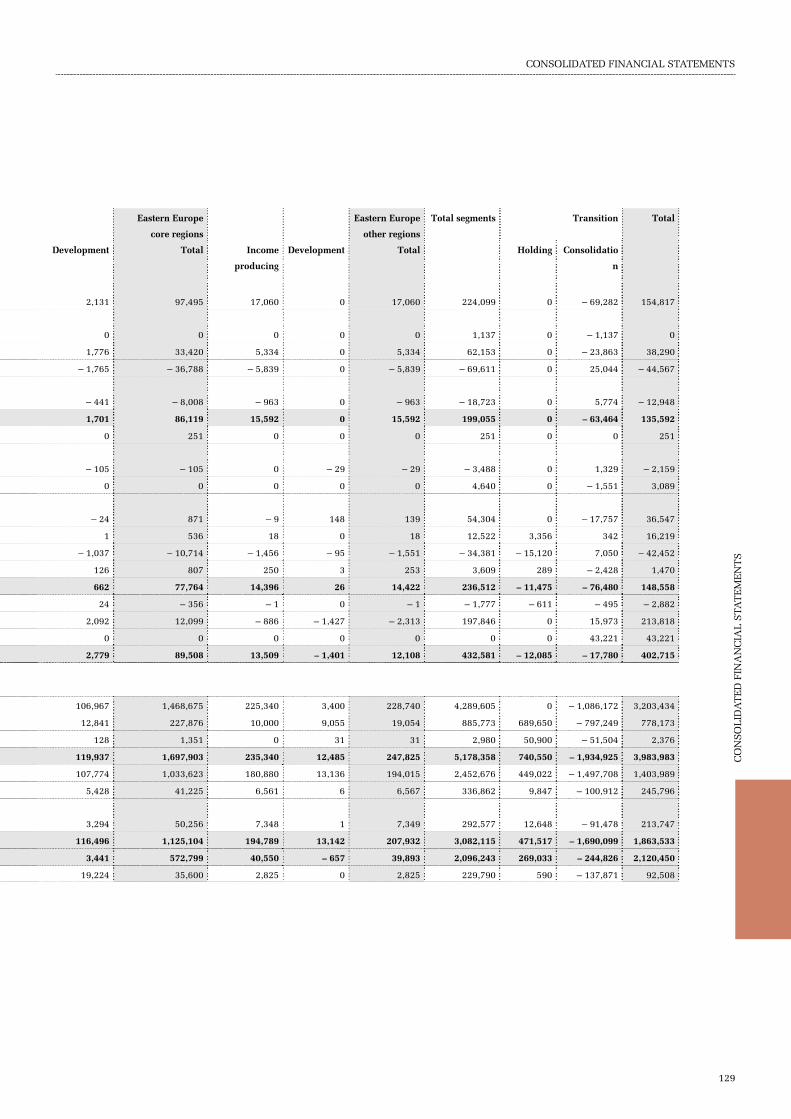
CONSOLIDATED FINANCIAL STATEMENTS
CO
NS
OL
IDA
TE
D F
INA
NC
IAL
STA
TE
ME
NT
S
129
Eastern Europe
core regions
Eastern Europe
other regions
Total segments Transition Total
Development Total Income
producing
Development Total Holding Consolidatio
n
2,131 97,495 17,060 0 17,060 224,099 0 – 69,282 154,817
0 0 0 0 0 1,137 0 – 1,137 0
1,776 33,420 5,334 0 5,334 62,153 0 – 23,863 38,290
– 1,765 – 36,788 – 5,839 0 – 5,839 – 69,611 0 25,044 – 44,567
– 441 – 8,008 – 963 0 – 963 – 18,723 0 5,774 – 12,948
1,701 86,119 15,592 0 15,592 199,055 0 – 63,464 135,592
0 251 0 0 0 251 0 0 251
– 105 – 105 0 – 29 – 29 – 3,488 0 1,329 – 2,159
0 0 0 0 0 4,640 0 – 1,551 3,089
– 24 871 – 9 148 139 54,304 0 – 17,757 36,547
1 536 18 0 18 12,522 3,356 342 16,219
– 1,037 – 10,714 – 1,456 – 95 – 1,551 – 34,381 – 15,120 7,050 – 42,452
126 807 250 3 253 3,609 289 – 2,428 1,470
662 77,764 14,396 26 14,422 236,512 – 11,475 – 76,480 148,558
24 – 356 – 1 0 – 1 – 1,777 – 611 – 495 – 2,882
2,092 12,099 – 886 – 1,427 – 2,313 197,846 0 15,973 213,818
0 0 0 0 0 0 0 43,221 43,221
2,779 89,508 13,509 – 1,401 12,108 432,581 – 12,085 – 17,780 402,715
106,967 1,468,675 225,340 3,400 228,740 4,289,605 0 – 1,086,172 3,203,434
12,841 227,876 10,000 9,055 19,054 885,773 689,650 – 797,249 778,173
128 1,351 0 31 31 2,980 50,900 – 51,504 2,376
119,937 1,697,903 235,340 12,485 247,825 5,178,358 740,550 – 1,934,925 3,983,983
107,774 1,033,623 180,880 13,136 194,015 2,452,676 449,022 – 1,497,708 1,403,989
5,428 41,225 6,561 6 6,567 336,862 9,847 – 100,912 245,796
3,294 50,256 7,348 1 7,349 292,577 12,648 – 91,478 213,747
116,496 1,125,104 194,789 13,142 207,932 3,082,115 471,517 – 1,690,099 1,863,533
3,441 572,799 40,550 – 657 39,893 2,096,243 269,033 – 244,826 2,120,450
19,224 35,600 2,825 0 2,825 229,790 590 – 137,871 92,508

CONSOLIDATED FINANCIAL STATEMENTS
130
A significant percentage of total rental income is generated by CA Immo Group in the core regions of the Eastern Eu-rope segment. In these countries a material proportion of the investment properties of CA Immo Group is located:
2016 2015
Segment Eastern Europe core regions before
consolidation
€ 1,000 Share in % € 1,000 Share in %
Rental income
Poland 18,796 22.3 32,156 33.0
Romania 18,258 21.7 19,890 20.4
Czech Republic / Slovakia 20,708 24.6 21,974 22.5
Hungary 26,393 31.4 23,475 24.1
Total rental income 84,155 100 97,495 100
Fair value of investment properties IAS 40
Poland 319,900 22.8 492,736 33.5
Romania 288,155 20.5 280,270 19.1
Czech Republic / Slovakia 324,029 23.1 347,519 23.7
Hungary 472,450 33.6 348,150 23.7
Total fair value investment property
according to IAS 40 1,404,534 100 1,468,675 100
In Eastern Europe other regions development segment, the impairment for associated entity amounting to € - 4,077 K and in Holding segment, an impairment for the available for sale securities amounting to € - 15,768 were included.
2. Rental income € 1,000 2016 2015
Basic rental income 163,852 148,824
Conditional rental income 1,344 1,347
Change in accrued rental income related to lease incentive agreements – 278 4,155
Settlement from cancellation of rent agreements 686 490
Rental income 165,603 154,817
CA Immo Group generates rental income from the following types of property:
2016 Austria Germany Eastern Europe core
regions
Eastern Europe
other regions
Total
€ 1,000 Share
in %
€ 1,000 Share
in %
€ 1,000 Share
in %
€ 1,000 Share
in %
€ 1,000 Share
in %
Offices 17,452 54.2% 37,762 77.7% 70,483 95.7% 10,251 91.7% 135,948 82.1%
Hotels 5,335 16.6% 4,687 9.6% 0 0.0% 933 8.3% 10,954 6.6%
Retail 5,680 17.6% 278 0.6% 3,141 4.3% 0 0.0% 9,099 5.5%
Logistics 0 0.0% 1,029 2.1% 0 0.0% 0 0.0% 1,029 0.6%
Residential 1,193 3.7% 222 0.5% 0 0.0% 0 0.0% 1,415 0.9%
Other properties 2,546 7.9% 4,611 9.5% 0 0.0% 0 0.0% 7,158 4.3%
Rental income 32,205 100% 48,590 100% 73,624 100% 11,184 100% 165,603 100%

CONSOLIDATED FINANCIAL STATEMENTS
CO
NS
OL
IDA
TE
D F
INA
NC
IAL
STA
TE
ME
NT
S
131
2015 Austria Germany Eastern Europe
core regions
Eastern Europe
other regions
Total
€ 1,000
Share
in %
€ 1,000 Share
in %
€ 1,000 Share
in %
€ 1,000 Share
in %
€ 1,000
Share
in %
Offices 18,756 52.8% 33,365 68.2% 55,890 93.0% 9,378 91.2% 117,389 75.8%
Hotels 5,416 15.3% 4,372 8.9% 213 0.4% 903 8.8% 10,903 7.0%
Retail 6,209 17.5% 310 0.6% 3,845 6.4% 0 0.0% 10,365 6.7%
Logistics 0 0.0% 7,074 14.5% 156 0.3% 0 0.0% 7,230 4.7%
Residential 1,451 4.1% 247 0.5% 0 0.0% 0 0.0% 1,698 1.1%
Other properties 3,674 10.3% 3,555 7.3% 2 0.0% 0 0.0% 7,232 4.7%
Rental income 35,507 100% 48,923 100% 60,106 100% 10,281 100% 154,817 100%
CA Immo Group generates rental income from a multitude of tenants. No single tenant generates more than 10 % of total rental income of CA Immo Group.
3. Result from operating costs and other expenses directly related to properties rented € 1,000 2016 2015
Operating costs charged to tenants 46,906 38,290
Operating expenses – 52,726 – 44,567
Own operating costs – 5,820 – 6,277
Maintenance costs – 6,907 – 5,606
Agency fees – 2,373 – 3,589
Bad debt losses and reserves for bad debts – 309 – 353
Other directly related expenses – 3,044 – 3,401
Other expenses directly related to properties rented – 12,633 – 12,948
Total – 18,453 – 19,225
4. Result from hotel operations CA Immo Group operated two hotels in Czech Republic until the 2nd quarter 2015. Other expenses from hotel opera-
tions mainly included expenses for food and beverages, catering, hotel rooms, licence and management fees, personnel expenses, advertising costs, bad debts, operating costs, maintenance costs and other costs related to properties. In 2015, these two hotels in the Czech Republic (2P s.r.o., Europort Airport Center a.s.) and their related management and oper-ating companies (Hotel Operation Plzen Holding s.r.o. and Hotel Operations Europort s.r.o.) were sold.
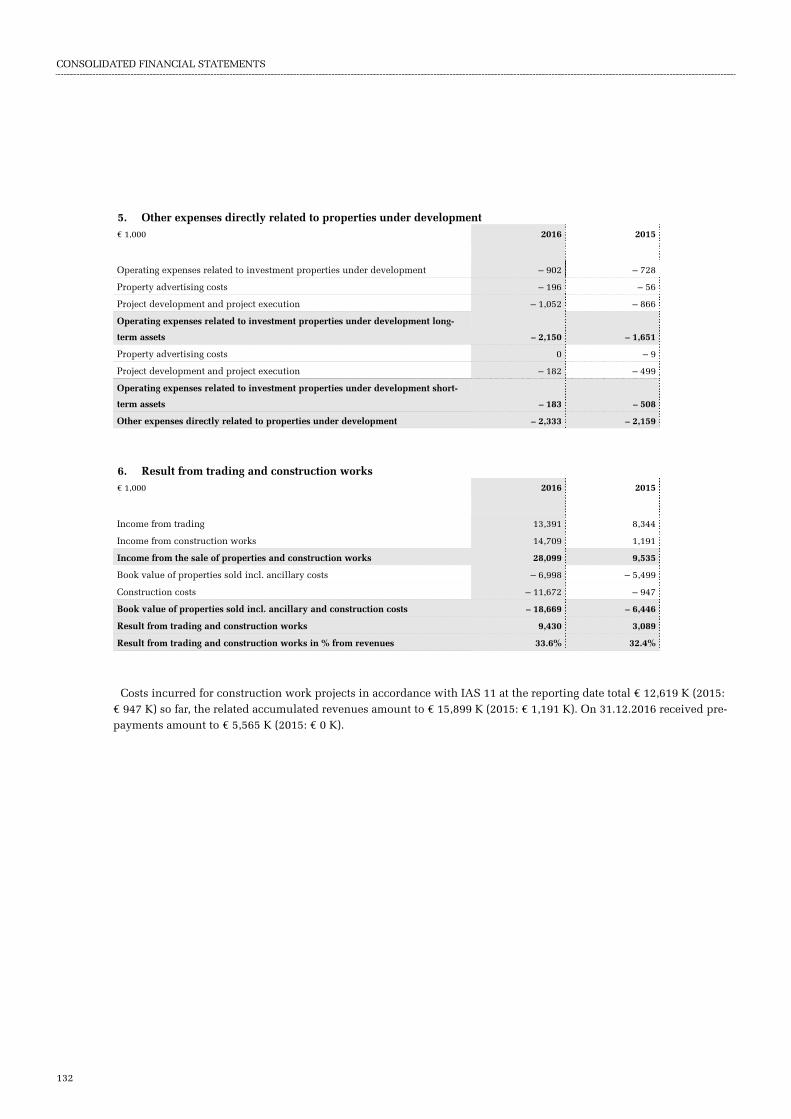
CONSOLIDATED FINANCIAL STATEMENTS
132
5. Other expenses directly related to properties under development € 1,000 2016 2015
Operating expenses related to investment properties under development – 902 – 728
Property advertising costs – 196 – 56
Project development and project execution – 1,052 – 866
Operating expenses related to investment properties under development long-
term assets – 2,150 – 1,651
Property advertising costs 0 – 9
Project development and project execution – 182 – 499
Operating expenses related to investment properties under development short-
term assets – 183 – 508
Other expenses directly related to properties under development – 2,333 – 2,159
6. Result from trading and construction works € 1,000 2016 2015
Income from trading 13,391 8,344
Income from construction works 14,709 1,191
Income from the sale of properties and construction works 28,099 9,535
Book value of properties sold incl. ancillary costs – 6,998 – 5,499
Construction costs – 11,672 – 947
Book value of properties sold incl. ancillary and construction costs – 18,669 – 6,446
Result from trading and construction works 9,430 3,089
Result from trading and construction works in % from revenues 33.6% 32.4%
Costs incurred for construction work projects in accordance with IAS 11 at the reporting date total € 12,619 K (2015: € 947 K) so far, the related accumulated revenues amount to € 15,899 K (2015: € 1,191 K). On 31.12.2016 received pre-payments amount to € 5,565 K (2015: € 0 K).

CONSOLIDATED FINANCIAL STATEMENTS
CO
NS
OL
IDA
TE
D F
INA
NC
IAL
STA
TE
ME
NT
S
133
7. Result from sale of investment properties € 1,000 Austria Germany Eastern
Europe
other
regions
Eastern
Europe
other
regions
2016 Austria Germany Eastern
Europe
other
regions
Eastern
Europe
other
regions
2015
Sales prices for interests
in property companies 0 87,163 11,948 1,174 100,285 0 48,862 2,095 0 50,957
Book value of net assets
sold excl. goodwill 0 – 83,964 – 12,317 – 3 – 96,285 0 – 36,352 – 1,497 0 – 37,849
Goodwill of sold
properties 0 – 605 0 0 – 605 0 0 0 0 0
Revaluation result for
the year 0 4,238 – 1,519 0 2,718 0 26,160 – 1 0 26,158
Subsequent costs and
ancillary costs 0 – 3,012 15 – 60 – 3,058 0 – 2,666 – 429 – 9 – 3,104
Results from the sale of
investment property
(share deals) 0 3,820 – 1,875 1,111 3,056 0 36,003 168 – 9 36,162
Income from the sale of
investment properties 47,777 104,987 141 0 152,905 90,312 66,279 24,087 0 180,678
Book value of properties
sold – 47,696 – 91,897 0 0 – 139,593 – 88,966 – 42,286 – 24,022 0 – 155,274
Goodwill of sold
properties – 999 – 13 0 0 – 1,012 – 2,673 – 737 0 0 – 3,410
Revaluation result for
the year 3,677 14,444 0 0 18,122 4,984 – 1 0 0 4,983
Subsequent costs and
ancillary costs – 763 – 9,381 5 0 – 10,138 – 1,517 – 25,065 – 10 0 – 26,592
Results from the sale of
investment property
(asset deals) 1,996 18,141 147 0 20,284 2,140 – 1,810 55 0 385
Result from the sale of
investment properties 1,996 21,961 – 1,728 1,111 23,340 2,140 34,194 223 – 9 36,547
The book value of net assets sold (= equity) includes investment property in the amount of € 97,226 K (2015: € 148,585 K), for which selling prices totaling to € 97,850 K (2015: € 153,200 K) were agreed.
In Germany, in the sales prices for interests in property companies, given the change from full to at-equity consolida-tion, fair value of the remaining Eggarten joint venture stake is included. As at 31.12.2016, CA Immo Group holds a 50 % stake in Eggarten.

CONSOLIDATED FINANCIAL STATEMENTS
134
8. Income from services rendered € 1,000 2016 2015
Revenues from construction contracts according to IAS 11 2,044 2,256
Revenues from service contracts 8,944 9,226
Income from management 1,990 4,459
Property management revenues and other fees 287 279
Income from services rendered 13,265 16,219
Costs incurred for construction contracts in accordance with IAS 11 for development works in progress at the report-ing date total € 5,667 K (2015: € 4,614 K) so far and the related accumulated revenues amount to € 7,706 K (2015: € 5,723 K). In 2016, losses recognised by reference to the stage of completion of the contract amount to € 39 K (2015: € 173 K loss). Prepayments amount to € 6,983 K as at 31.12.2016 (31.12.2015: € 5,336 K).
9. Indirect expenses € 1,000 2016 2015
Personnel expenses – 33,318 – 31,271
Legal, auditing and consulting fees – 8,611 – 6,019
Third party acquired development services – 2,975 – 4,578
Office rent – 1,514 – 1,467
Travel expenses and transportation costs – 1,194 – 1,208
Other expenses internal management – 2,682 – 2,906
Other indirect expenses – 3,696 – 4,231
Subtotal – 53,989 – 51,679
Own work capitalised in investment property 8,136 7,829
Change in properties held for trading 1,713 1,399
Indirect expenses – 44,140 – 42,452
Personnel expenses include contributions to staff welfare funds in the amount of € 114 K (2015: € 99 K) and to pen-sion and relief funds in the amount of € 386 K (2015: € 319 K).
10. Other operating income € 1,000 2016 2015
Discharge of lapsed liabilities 203 114
Other income 670 1,357
Other operating income 873 1,470
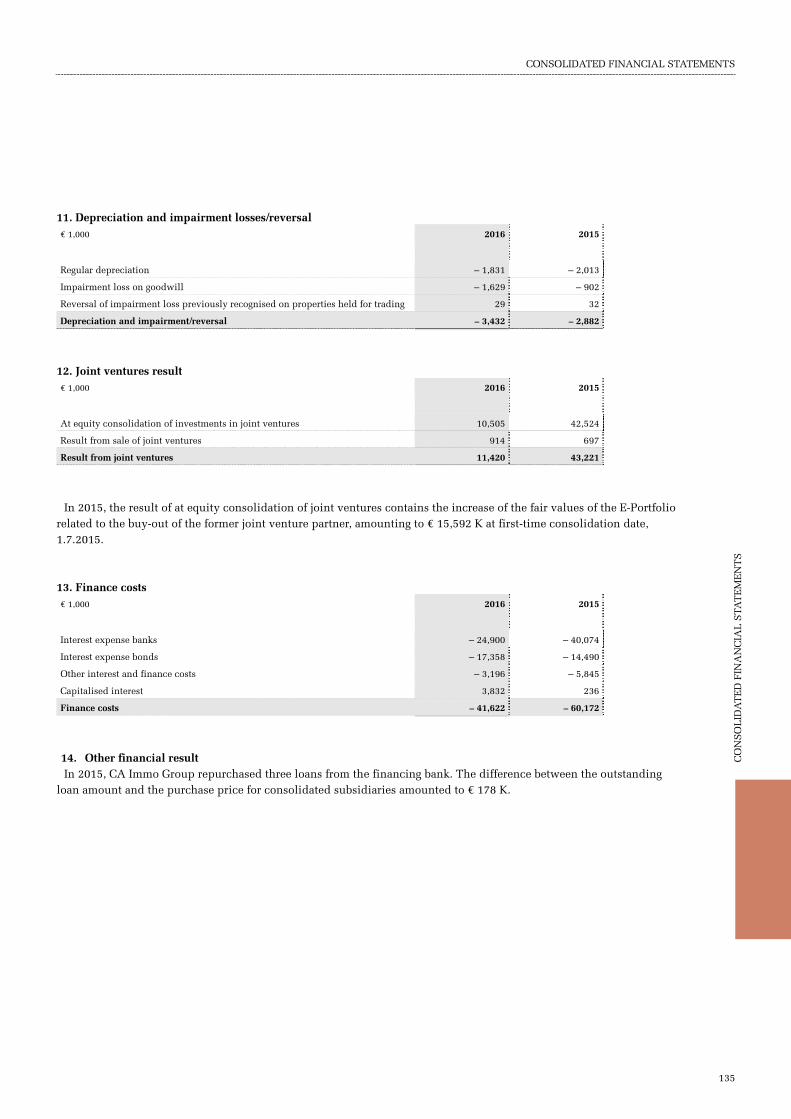
CONSOLIDATED FINANCIAL STATEMENTS
CO
NS
OL
IDA
TE
D F
INA
NC
IAL
STA
TE
ME
NT
S
135
11. Depreciation and impairment losses/reversal € 1,000 2016 2015
Regular depreciation – 1,831 – 2,013
Impairment loss on goodwill – 1,629 – 902
Reversal of impairment loss previously recognised on properties held for trading 29 32
Depreciation and impairment/reversal – 3,432 – 2,882
12. Joint ventures result € 1,000 2016 2015
At equity consolidation of investments in joint ventures 10,505 42,524
Result from sale of joint ventures 914 697
Result from joint ventures 11,420 43,221
In 2015, the result of at equity consolidation of joint ventures contains the increase of the fair values of the E-Portfolio related to the buy-out of the former joint venture partner, amounting to € 15,592 K at first-time consolidation date, 1.7.2015.
13. Finance costs € 1,000 2016 2015
Interest expense banks – 24,900 – 40,074
Interest expense bonds – 17,358 – 14,490
Other interest and finance costs – 3,196 – 5,845
Capitalised interest 3,832 236
Finance costs – 41,622 – 60,172
14. Other financial result In 2015, CA Immo Group repurchased three loans from the financing bank. The difference between the outstanding
loan amount and the purchase price for consolidated subsidiaries amounted to € 178 K.
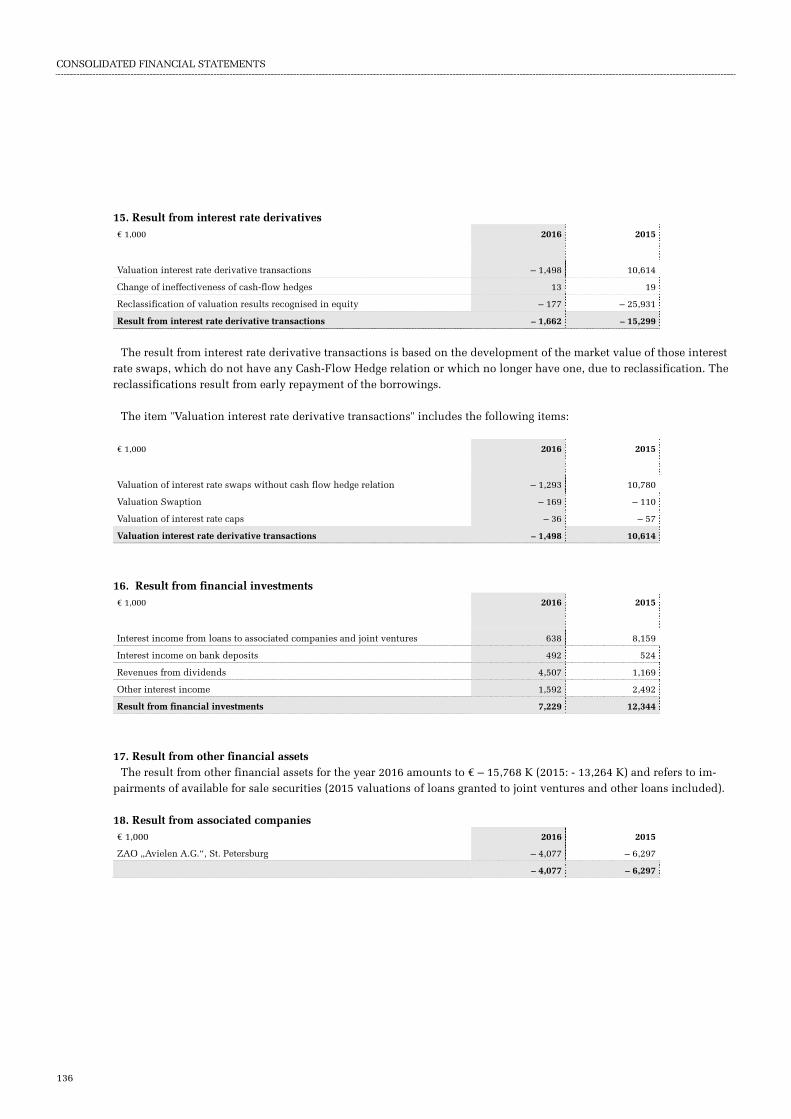
CONSOLIDATED FINANCIAL STATEMENTS
136
15. Result from interest rate derivatives € 1,000 2016 2015
Valuation interest rate derivative transactions – 1,498 10,614
Change of ineffectiveness of cash-flow hedges 13 19
Reclassification of valuation results recognised in equity – 177 – 25,931
Result from interest rate derivative transactions – 1,662 – 15,299
The result from interest rate derivative transactions is based on the development of the market value of those interest rate swaps, which do not have any Cash-Flow Hedge relation or which no longer have one, due to reclassification. The reclassifications result from early repayment of the borrowings.
The item "Valuation interest rate derivative transactions" includes the following items:
€ 1,000 2016 2015
Valuation of interest rate swaps without cash flow hedge relation – 1,293 10,780
Valuation Swaption – 169 – 110
Valuation of interest rate caps – 36 – 57
Valuation interest rate derivative transactions – 1,498 10,614
16. Result from financial investments € 1,000 2016 2015
Interest income from loans to associated companies and joint ventures 638 8,159
Interest income on bank deposits 492 524
Revenues from dividends 4,507 1,169
Other interest income 1,592 2,492
Result from financial investments 7,229 12,344
17. Result from other financial assets The result from other financial assets for the year 2016 amounts to € – 15,768 K (2015: - 13,264 K) and refers to im-
pairments of available for sale securities (2015 valuations of loans granted to joint ventures and other loans included).
18. Result from associated companies € 1,000 2016 2015
ZAO „Avielen A.G.“, St. Petersburg – 4,077 – 6,297
– 4,077 – 6,297

CONSOLIDATED FINANCIAL STATEMENTS
CO
NS
OL
IDA
TE
D F
INA
NC
IAL
STA
TE
ME
NT
S
137
19. Financial result € 1,000 Category1) 2016 2015
Interest expense Interest FLAC – 41,622 – 60,172
Other financial results Valuation L&R 0 178
Foreign currency gains/losses Valuation – 1,183 – 8,914
Realisation 854 4,723
Interest rate swaps Valuation HFT – 1,293 10,780
Ineffectiveness CFH 13 19
Reclassification CFH – 177 – 25,931
Swaption Valuation HFT – 169 – 110
Interest rate caps Valuation HFT – 36 – 57
Interest income Interest L&R 2,722 11,174
Financial investments Dividends AFS 4,507 1,169
Other financial assets Valuation AFS – 15,768 – 13,264
Net result of financial instruments – 52,151 – 80,405
Result from associated companies Valuation AEA – 4,077 – 6,296
Result from associated companies – 4,077 – 6,296
Financial result – 56,228 – 86,702 1) FLAC – financial liabilities at amortised cost, L&R – loans and receivables, HFT – held for trading, CFH – Cash-flow Hedge, FV/PL – at fair value through
profit or loss, AFS - available for sale, AEA – at equity
20. Income tax € 1,000 2016 2015
Current income tax (current year) – 17,304 – 9,248
Current income tax (previous years) 7,168 – 27,392
Current income tax – 10,136 – 36,639
Change in deferred taxes – 43,524 – 58,633
Tax benefit on valuation of assets available for sale in equity – 29 99
Income tax expense – 53,688 – 95,174
Effective tax rate (total) 22.6% 30.1%
In 2016, current income tax (current year) arises mainly from Germany.
In 2015, current income tax (previous year) mainly resulted from effects of a tax audit, especially in relation to the tax deductibility of interest expenses in Germany, for the period 2008-2010 and follow-up effects until 2013. In 2016, current income tax (previous year) mainly includes corresponding offsetting effects from appeals and rulings related to the outlined tax audits and follow-up effects. CA Immo Group has appealed for the findings of the tax audit and has pursued further legal steps in this respect.

CONSOLIDATED FINANCIAL STATEMENTS
138
The reasons for the difference between expected income tax expense and effective income tax expense are outlined in the following table:
€ 1,000 2016 2015
Net result before taxes 237,605 316,013
Expected tax expenses (tax rate Austria 25.0% / prior year 25.0%) – 59,401 – 79,003
Tax-effective impairment and reversal of impairment losses of investments in affiliated entities 8,454 995
Non-usable tax losses carried forward – 193 – 6,503
Non tax-deductible expense and permanent differences – 2,921 – 1,153
Differing tax rates abroad – 5,741 – 957
Capitalisation of prior years non-capitalised tax losses 810 765
Tax-exempt income 2,308 2,275
Adjustment of prior periods 5,237 – 14,489
Utilization of prior years non-capitalised tax losses 1,467 264
Trade tax effects – 1,789 – 706
Amortisation/Reversal of amortisation of deferred tax assets – 6,619 – 4,943
At equity consolidation of investments in joint ventures – 1,497 8,143
Exchange rate differences not affecting tax – 764 – 135
Change in tax rate 7,776 0
Others – 815 274
Effective tax expense – 53,688 – 95,174
21. Other comprehensive income 2016
€ 1,000 Valuation result/
Reclassification
(Hedging)
Currency
translation
reserve
Reserves for available
for sale valuation
Reserve
according to
IAS 19
Total
Other comprehensive income before taxes 2,610 359 1,128 – 413 3,683
Income tax related to other comprehensive
income – 680 0 – 301
149
– 831
Other comprehensive income for the period 1,930 359 827 – 264 2,852
thereof: attributable to the owners of the
parent 1,930 359 827 – 264 2,852

CONSOLIDATED FINANCIAL STATEMENTS
CO
NS
OL
IDA
TE
D F
INA
NC
IAL
STA
TE
ME
NT
S
139
2015
€ 1,000 Valuation result/
Reclassification
(Hedging)
Currency
translation
reserve
Reserves for available
for sale valuation
Reserve
according to
IAS 19
Total
Other comprehensive income before taxes 27,687 597 2,164 870 31,317
Income tax related to other comprehensive
income – 5,315 0 – 759 – 284 – 6,359
Other comprehensive income for the period 22,372 597 1,405 585 24,958
thereof: attributable to the owners of the
parent 22,372 597 1,405 585 24,958
In 2015, the reclassification of € 25,931 K was related to the fair values of cash flow hedges recorded in equity as at previous year’s reporting date, for which the underlying loans were repaid in advance during business year.
Reserves according to IAS 19 include actuarial gains and losses from post-employment defined benefit plans as well as actuarial gains and losses from the plan assets.
22. Long-term assets € 1,000 Income producing
investment
properties
Investment
properties under
development
Own used
properties
Total
Book values
1.1.2015 2,092,917 496,252 7,533 2,596,702
Purchase of real estate companies 455,651 20,981 0 476,632
Current investment/construction 50,210 40,947 0 91,156
Disposals – 191,988 – 41,223 0 – 233,210
Depreciation and amortisation 0 0 – 517 – 517
Reclassification to assets held for sale – 995 – 50,070 0 – 51,065
Other reclassifications 147,217 – 147,217 0 0
Revaluation 155,892 89,068 0 244,961
Currency translation adjustments 0 227 0 227
Change in lease incentives 5,401 14 0 5,416
As at 31.12.2015 = 1.1.2016 2,714,305 408,979 7,016 3,130,301
Purchase of real estate companies 165,205 0 0 165,205
Current investment/construction 39,470 65,488 0 104,958
Disposals – 100,666 – 83,979 0 – 184,645
Depreciation and amortisation 0 0 – 373 – 373
Reclassification to assets held for sale – 15,064 0 0 – 15,064
Other reclassifications 11,640 – 11,640 0 0
Revaluation 103,768 54,212 0 157,980
Currency translation adjustments 0 0 0 0
Change in lease incentives 5,017 – 11 0 5,006
As at 31.12.2016 2,923,676 433,049 6,643 3,363,367
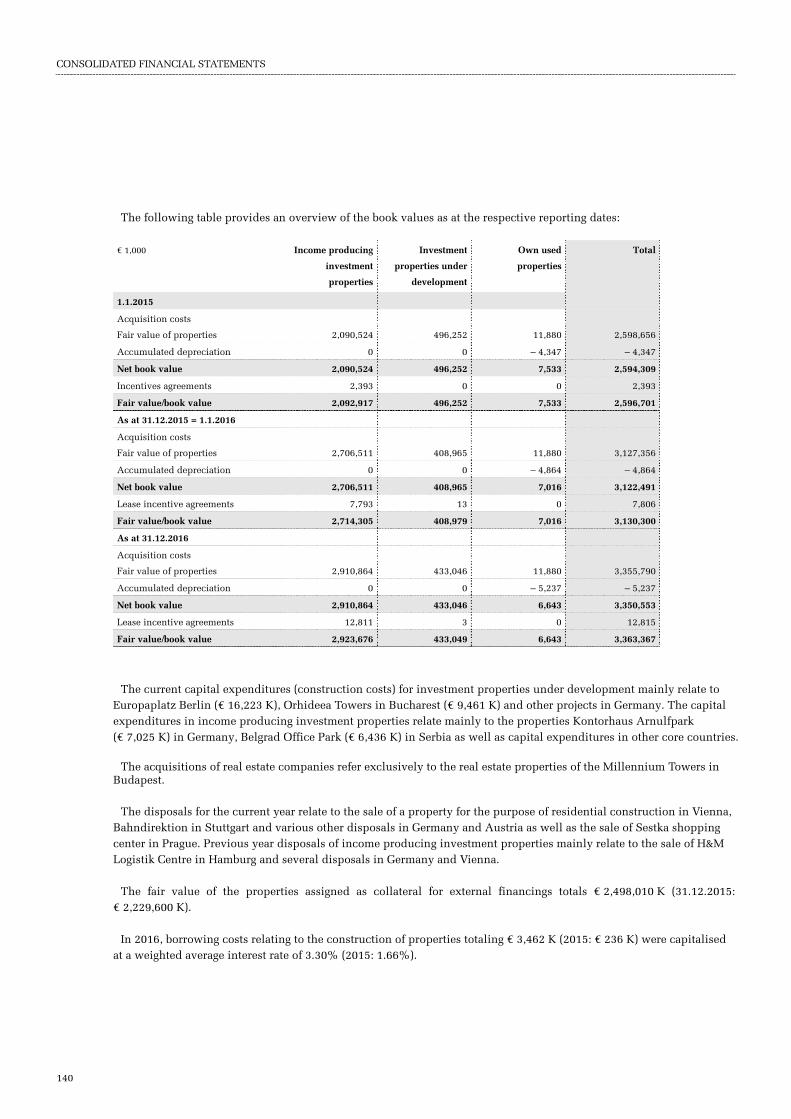
CONSOLIDATED FINANCIAL STATEMENTS
140
The following table provides an overview of the book values as at the respective reporting dates:
€ 1,000 Income producing
investment
properties
Investment
properties under
development
Own used
properties
Total
1.1.2015
Acquisition costs
Fair value of properties 2,090,524 496,252 11,880 2,598,656
Accumulated depreciation 0 0 – 4,347 – 4,347
Net book value 2,090,524 496,252 7,533 2,594,309
Incentives agreements 2,393 0 0 2,393
Fair value/book value 2,092,917 496,252 7,533 2,596,701
As at 31.12.2015 = 1.1.2016
Acquisition costs
Fair value of properties 2,706,511 408,965 11,880 3,127,356
Accumulated depreciation 0 0 – 4,864 – 4,864
Net book value 2,706,511 408,965 7,016 3,122,491
Lease incentive agreements 7,793 13 0 7,806
Fair value/book value 2,714,305 408,979 7,016 3,130,300
As at 31.12.2016
Acquisition costs
Fair value of properties 2,910,864 433,046 11,880 3,355,790
Accumulated depreciation 0 0 – 5,237 – 5,237
Net book value 2,910,864 433,046 6,643 3,350,553
Lease incentive agreements 12,811 3 0 12,815
Fair value/book value 2,923,676 433,049 6,643 3,363,367
The current capital expenditures (construction costs) for investment properties under development mainly relate to Europaplatz Berlin (€ 16,223 K), Orhideea Towers in Bucharest (€ 9,461 K) and other projects in Germany. The capital expenditures in income producing investment properties relate mainly to the properties Kontorhaus Arnulfpark (€ 7,025 K) in Germany, Belgrad Office Park (€ 6,436 K) in Serbia as well as capital expenditures in other core countries.
The acquisitions of real estate companies refer exclusively to the real estate properties of the Millennium Towers in Budapest.
The disposals for the current year relate to the sale of a property for the purpose of residential construction in Vienna, Bahndirektion in Stuttgart and various other disposals in Germany and Austria as well as the sale of Sestka shopping center in Prague. Previous year disposals of income producing investment properties mainly relate to the sale of H&M Logistik Centre in Hamburg and several disposals in Germany and Vienna.
The fair value of the properties assigned as collateral for external financings totals € 2,498,010 K (31.12.2015: € 2,229,600 K).
In 2016, borrowing costs relating to the construction of properties totaling € 3,462 K (2015: € 236 K) were capitalised at a weighted average interest rate of 3.30% (2015: 1.66%).

CONSOLIDATED FINANCIAL STATEMENTS
CO
NS
OL
IDA
TE
D F
INA
NC
IAL
STA
TE
ME
NT
S
141
In 2016, government grants amounted to € 2,266 K (2015: € 0 K).
23. Intangible assets and office furniture and equipment € 1,000 Goodwill Software Total Office furniture
and Equipment
Book values
1.1.2015 14,711 1,135 15,846 1,399
Purchase of real estate companies 0 11 11 4,640
Currency translation adjustments 0 3 3 – 44
Current additions 0 854 854 489
Disposals – 3,410 – 13 – 3,423 – 98
Depreciation and amortisation 0 – 821 – 821 – 675
Impairment – 902 0 – 902 0
As at 31.12.2015 = 1.1.2016 10,399 1,168 11,567 5,710
Currency translation adjustments 0 0 0 – 1
Current additions 0 618 618 646
Disposals – 1,617 – 36 – 1,653 – 6
Depreciation and amortisation 0 – 708 – 708 – 750
Impairment – 1,629 0 – 1,629 0
As at 31.12.2016 7,153 1,042 8,195 5,599
The following table shows the composition of the book values at each of the reporting dates:
€ 1,000 Goodwill Software Total Office furniture
and Equipment
1.1.2015
Acquisition costs 34,736 3,456 38,192 4,686
Accumulated
impairment/amortisation – 20,025 – 2,323 – 22,346 – 3,287
Book values 14,711 1,135 15,845 1,399
As at 31.12.2015 = 1.1.2016
Acquisition costs 28,153 3,118 31,271 9,770
Accumulated
impairment/amortisation – 17,754 – 1,950 – 19,704 – 4,060
Book values 10,399 1,168 11,567 5,710
As at 31.12.2016
Acquisition costs 24,213 3,688 27,901 10,191
Accumulated
impairment/amortisation – 17,060 – 2,646 – 19,706 – 4,592
Book values 7,153 1,042 8,195 5,599
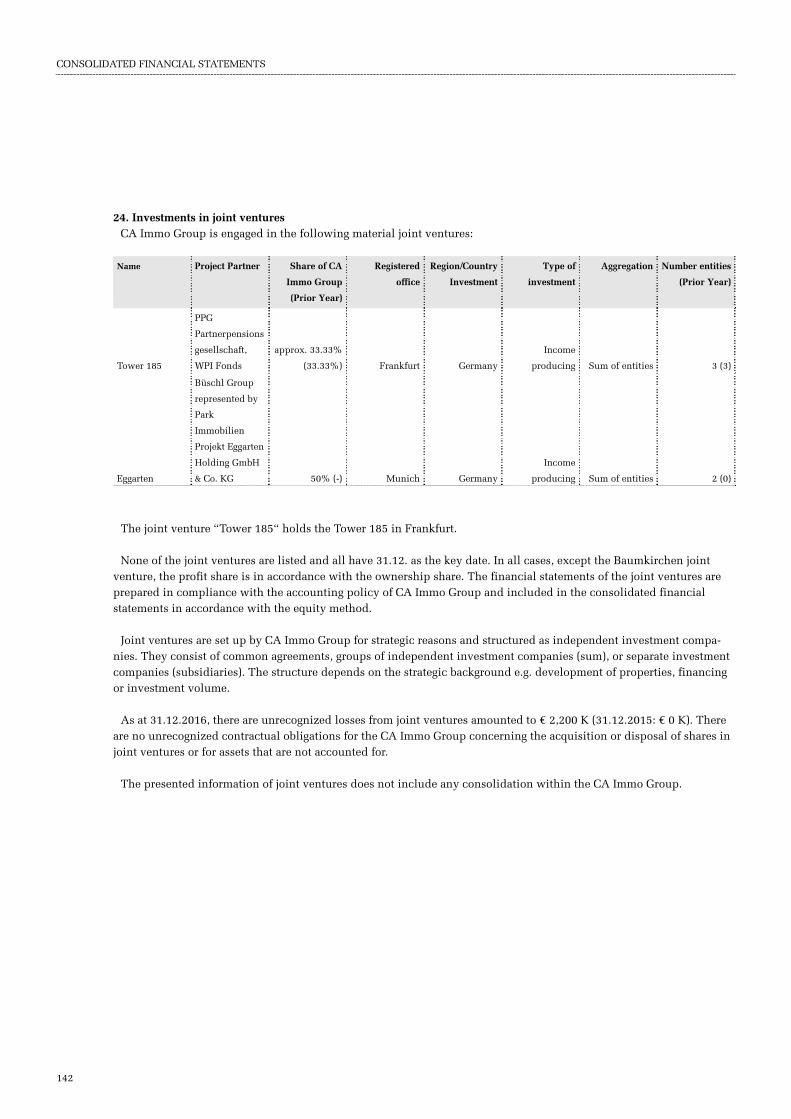
CONSOLIDATED FINANCIAL STATEMENTS
142
24. Investments in joint ventures CA Immo Group is engaged in the following material joint ventures:
Name Project Partner Share of CA
Immo Group
(Prior Year)
Registered
office
Region/Country
Investment
Type of
investment
Aggregation Number entities
(Prior Year)
Tower 185
PPG
Partnerpensions
gesellschaft,
WPI Fonds
approx. 33.33%
(33.33%) Frankfurt Germany
Income
producing Sum of entities 3 (3)
Eggarten
Büschl Group
represented by
Park
Immobilien
Projekt Eggarten
Holding GmbH
& Co. KG 50% (-) Munich Germany
Income
producing Sum of entities 2 (0)
The joint venture “Tower 185“ holds the Tower 185 in Frankfurt.
None of the joint ventures are listed and all have 31.12. as the key date. In all cases, except the Baumkirchen joint venture, the profit share is in accordance with the ownership share. The financial statements of the joint ventures are prepared in compliance with the accounting policy of CA Immo Group and included in the consolidated financial statements in accordance with the equity method.
Joint ventures are set up by CA Immo Group for strategic reasons and structured as independent investment compa-nies. They consist of common agreements, groups of independent investment companies (sum), or separate investment companies (subsidiaries). The structure depends on the strategic background e.g. development of properties, financing or investment volume.
As at 31.12.2016, there are unrecognized losses from joint ventures amounted to € 2,200 K (31.12.2015: € 0 K). There are no unrecognized contractual obligations for the CA Immo Group concerning the acquisition or disposal of shares in joint ventures or for assets that are not accounted for.
The presented information of joint ventures does not include any consolidation within the CA Immo Group.

CONSOLIDATED FINANCIAL STATEMENTS
CO
NS
OL
IDA
TE
D F
INA
NC
IAL
STA
TE
ME
NT
S
143
The following table shows material interests in joint ventures:
€ 1,000 2016 2015
Eggarten Tower 185 E-Fonds Tower 185
Rental income 0 27,709 18,217 25,425
Depreciation and
impairment/reversal 0 – 5 – 139 – 11
Finance costs 0 – 17,457 – 8,096 – 15,748
Income tax expense 0 – 6,581 – 29 – 2,728
Consolidated net income 0 33,015 5,704 4,328
Total comprehensive income 0 0 – 4,886 0
Comprehensive income for the
period 0 33,015 817 4,328
Long-term assets 0 596,049 0 556,103
Other short-term assets 84,022 13,857 0 20,438
Cash and cash equivalents 53 10,736 0 22,817
Total assets 84,075 620,643 0 599,358
Other long-term liabilities 0 22,111 0 15,981
Interest-bearing liabilities 0 290,434 0 294,848
Long-term liabilities 0 312,536 0 310,829
Other short-term liabilities 113 4,375 0 3,417
Interest-bearing liabilities 0 4,414 0 4,390
Short-term liabilities 113 8,789 0 8,322
Shareholders' equity 83,963 299,300 0 280,208
Proportional equity as at 1.1. 0 93,367 25,520 88,190
Proportional profit of the period 0 11,202 3,801 1,443
Proportional other income 0 0 – 3,181 0
Capital decrease 0 – 4,636 0 0
Capital increases 0 0 273 5,644
Dividends received 0 0 0 – 1,909
Transition consolidation 41,981 – 208 – 26,413 0
Proportional equity as at 31.12. 41,981 99,724 0 93,366
Intercompany profit elimination and
other consolidation effects 0 – 2,982 0 0
Book value investments into joint
ventures 31.12 41,981 96,742 0 93,366

CONSOLIDATED FINANCIAL STATEMENTS
144
The following table summarizes none-material interests in joint ventures:
€ 1,000 2016 2015
Proportional equity as at 1.1. 62,130 74,373
Proportional profit of the period 456 20,179
Capital increases 13,863 3,778
Capital decrease – 15,803 – 27,699
Dividends received – 1,564 – 1,349
Proportional equity as at 31.12. 59,081 69,283
Goodwill 895 2,034
Intercompany profit elimination and other consolidation effects – 88 616
Addition / Disposal / Reclassification IFRS 5 – 16,382 – 10,872
Allowance of loans and receivables 6,940 17,860
Not recognised losses 2,200 0
Book value investments into joint ventures 31.12 52,646 78,920
25. Investments in associated companies As at 31.12.2016 there are no unrecognised losses from associated companies (31.12.2015: € 0 K).
The following table shows the interests in associated companies:
€ 1,000 2016 2015
Proportional equity as at 1.1. – 20,989 – 11,455
Proportional profit of the period 2,181 – 9,515
Deconsolidation 0 – 18
Impairment – 7,663 0
Allowance of loans and interests 26,471 20,002
Other consolidation adjustments 0 987
Not recognised losses 0 0
Book value 31.12. 0 0
26. Financial assets € 1,000 31.12.2016 31.12.2015
Other financial assets 70,144 114,526
Long-term receivables and other assets 19,569 20,299
89,713 134,824

CONSOLIDATED FINANCIAL STATEMENTS
CO
NS
OL
IDA
TE
D F
INA
NC
IAL
STA
TE
ME
NT
S
145
€ 1,000 Acquisition costs incl.
recognized interest as at
31.12.2016
Changes in value
recognised in profit or
loss 2016
Changes in the
value through OCI
2016
Changes in value
accumulated until
31.12.2016
Book values as at
31.12.2016
Loans to joint ventures 8,926 – 1,610 0 – 5,318 3,608
Loans to associated
companies 22,402 – 4,077 0 – 13,652 8,750
Other loans 27,249 0 0 – 27,249 0
Loans and receivables 58,577 – 5,687 0 – 46,219 12,358
Investments available
for sale 54,077 0 1,130 3,696 57,774
Financial assets
available for sale 54,077 0 1,130 3,696 57,774
Interest rate caps 106 – 36 0 – 94 12
Swaption 0 – 169 0 0 0
Derivative financial
instruments 106 – 206 0 – 94 12
Total other financial
assets 112,761 – 5,893 1,130 – 42,617 70,144
Due to maturity reasons the swaption was reclassified from financial assets to receivables and other assets at the end of 2016.
€ 1,000 Acquisition costs incl.
recognized interest as at
31.12.2015
Changes in value
recognised in profit or
loss 2015
Changes in the
value through OCI
2015
Changes in value
accumulated until
31.12.2015
Book values as
at 31.12.2015
Loans to joint ventures 18,277 – 301 0 – 12,114 6,162
Loans to associated
companies 22,402 – 6,296 0 – 9,575 12,827
Other loans 27,249 0 0 – 27,249 0
Loans and receivables 67,927 – 6,598 0 – 48,938 18,990
Long-term receivables 36,638 0 0 0 36,638
Long-term receivables 36,638 0 0 0 36,638
Investments available
for sale 56,094 0 2,566 2,566 58,660
Financial assets
available for sale 56,094 0 2,566 2,566 58,660
Interest rate caps 107 – 57 0 – 58 49
Swaption 245 – 167 0 – 56 189
Derivative financial
instruments 352 – 224 0 – 114 238
Total other financial
assets 161,011 – 6,822 2,566 – 46,485 114,526
Investments available for sale contain minority interests in Germany.

CONSOLIDATED FINANCIAL STATEMENTS
146
Long-term receivables and other assets € 1,000 31.12.2016 31.12.2015
Cash and cash equivalents with drawing restrictions 8,288 9,026
Receivables from property sales 11,250 11,250
Other receivables and assets 31 22
Long-term receivables and other assets 19,569 20,299
27. Deferred taxes € 1,000 2016 2015
Deferred taxes as at 1.1. (net) – 194,989 – 141,690
Changes from sale of companies 178 8,665
Changes from first consolidation 790 2,842
Changes due to exchange rate fluctuations – 1 1
Changes recognised in equity – 861 – 6,263
Changes recognised in profit or loss (incl. in disposal groups) – 43,524 – 58,633
Changes in disposal groups 0 90
Deferred taxes as at 31.12. (net) – 238,406 – 194,989

CONSOLIDATED FINANCIAL STATEMENTS
CO
NS
OL
IDA
TE
D F
INA
NC
IAL
STA
TE
ME
NT
S
147
€ 1,000 31.12.2015 31.12.2016
Type Deferred
tax asset
Deferred
tax
liabilities
Net
amount
Consolidated
Income
Statement
Other
income
Addition /
Disposal /
IFRS 5 /
exchange rate
fluctuations
Net
amount
Deferred
tax asset
Deferred
tax
liabilities
Book value differences
IFRS/tax of investment
properties 1,042 – 241,846 – 240,804 – 44,305 0 251 – 284,857 0 – 284,857
Difference in
depreciation of own used
properties 533 – 122 411 349 0 0 760 760 0
Difference in acquisition
costs for assets held for
trading 0 – 1,118 – 1,118 – 73 0 0 – 1,192 0 – 1,192
Difference in useful life
for intangible assets 65 0 65 – 65 0 0 0 0 0
Difference in useful life
for equipment 218 – 1 217 – 32 0 0 185 186 – 1
Investments in joint
ventures 128 – 10,342 – 10,214 – 471 0 0 – 10,685 540 – 11,225
Loans and assets
available for sale 0 – 14,238 – 14,238 7,965 – 330 0 – 6,603 0 – 6,603
Assets held for sale 0 – 11,955 – 11,955 8,240 0 0 – 3,716 0 – 3,716
Revaluation of
receivables and other
assets 759 – 850 – 92 – 1,500 0 0 – 1,592 366 – 1,957
Revaluation of
derivatives assets 0 – 2 – 2 2 0 0 0 0 0
Revaluation of cash and
cash equivalents 1 – 58 – 57 38 0 0 – 19 0 – 19
Revaluation of
derivatives liabilities 2,149 0 2,149 – 165 – 680 0 1,304 1,304 0
Liabilities 8,570 – 1,702 6,868 96 0 – 1 6,964 7,578 – 615
Provisions 6,333 – 10 6,323 903 150 0 7,377 7,377 0
Tax losses 67,455 0 67,455 – 14,505 0 717 53,666 53,666 0
Deferred tax
assets/liabilities before
offset 87,255 – 282,244 – 194,989 – 43,524 – 861 967 – 238,406 71,778 – 310,184
Computation of taxes – 84,878 84,878 0 0 – 70,215 70,215
Deferred tax
assets/liabilities net 2,376 – 197,365 – 194,989 – 238,406 1,563 – 239,969
The recorded tax losses include deferred tax assets related to impairment losses on investments in subsidiaries in Austria amounting to € 11,475 K (31.12.2015: € 16,976 K), which have to be deferred over 7 years for income tax pur-poses. The changes were fully recognized in consolidated income statement.
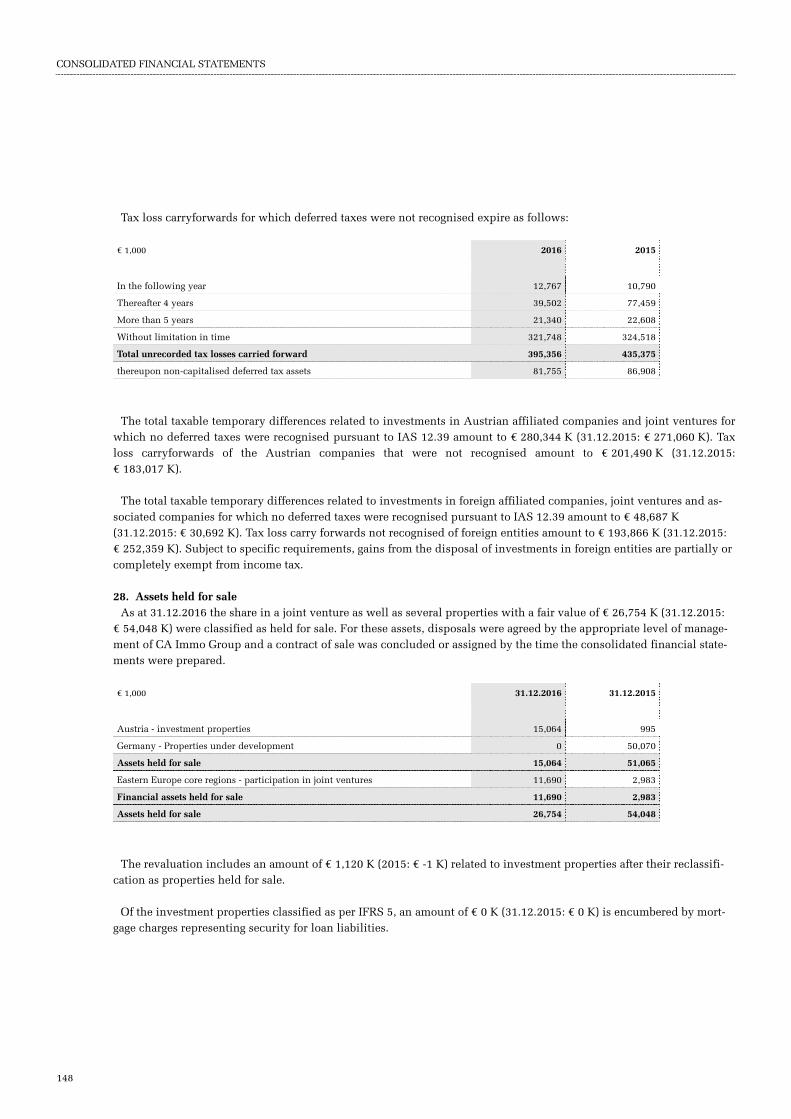
CONSOLIDATED FINANCIAL STATEMENTS
148
Tax loss carryforwards for which deferred taxes were not recognised expire as follows:
€ 1,000 2016 2015
In the following year 12,767 10,790
Thereafter 4 years 39,502 77,459
More than 5 years 21,340 22,608
Without limitation in time 321,748 324,518
Total unrecorded tax losses carried forward 395,356 435,375
thereupon non-capitalised deferred tax assets 81,755 86,908
The total taxable temporary differences related to investments in Austrian affiliated companies and joint ventures for which no deferred taxes were recognised pursuant to IAS 12.39 amount to € 280,344 K (31.12.2015: € 271,060 K). Tax loss carryforwards of the Austrian companies that were not recognised amount to € 201,490 K (31.12.2015: € 183,017 K).
The total taxable temporary differences related to investments in foreign affiliated companies, joint ventures and as-sociated companies for which no deferred taxes were recognised pursuant to IAS 12.39 amount to € 48,687 K (31.12.2015: € 30,692 K). Tax loss carry forwards not recognised of foreign entities amount to € 193,866 K (31.12.2015: € 252,359 K). Subject to specific requirements, gains from the disposal of investments in foreign entities are partially or completely exempt from income tax.
28. Assets held for sale As at 31.12.2016 the share in a joint venture as well as several properties with a fair value of € 26,754 K (31.12.2015:
€ 54,048 K) were classified as held for sale. For these assets, disposals were agreed by the appropriate level of manage-ment of CA Immo Group and a contract of sale was concluded or assigned by the time the consolidated financial state-ments were prepared.
€ 1,000 31.12.2016 31.12.2015
Austria - investment properties 15,064 995
Germany - Properties under development 0 50,070
Assets held for sale 15,064 51,065
Eastern Europe core regions - participation in joint ventures 11,690 2,983
Financial assets held for sale 11,690 2,983
Assets held for sale 26,754 54,048
The revaluation includes an amount of € 1,120 K (2015: € -1 K) related to investment properties after their reclassifi-cation as properties held for sale.
Of the investment properties classified as per IFRS 5, an amount of € 0 K (31.12.2015: € 0 K) is encumbered by mort-gage charges representing security for loan liabilities.

CONSOLIDATED FINANCIAL STATEMENTS
CO
NS
OL
IDA
TE
D F
INA
NC
IAL
STA
TE
ME
NT
S
149
29. Properties held for trading 31.12.2016 31.12.2015
€ 1,000 Acquisition /
production
costs
Accumulated
impairment
Book values Acquisition /
production
costs
Accumulated
impairment
Book values
At acquisition/production costs 33,053 0 33,053 21,759 0 21,759
At net realisable value 3,745 – 2,650 1,095 2,989 – 2,679 310
Total properties held for trading 36,798 – 2,650 34,147 24,748 – 2,679 22,069
The fair value of the properties held for trading which are recognised at acquisition/production costs amounts to € 58,955 K (31.12.2015: € 37,605 K), and correspond to level 3 of the fair value hierarchy.
Properties held for trading amounting to € 32,680 K (31.12.2015: € 19,688 K) are expected to be realised within a peri-od of more than 12 months. This applies to 12 properties (31.12.2015: 15 properties) in Germany.
In 2016, borrowing costs amounting to € 370 K (31.12.2015: € 0 K) were capitalised with a weighted average interest rate of 3.24 % (2015: 0 %) on properties held for trading. Interest bearing liabilities in connection with properties held for trading total € 0 K (31.12.2015: € 0 K).
30. Receivables and other assets € 1,000 Book values as at
31.12.2016
Book value as at
31.12.2015 restated
Receivables from joint ventures 6,922 39,718
Receivables from property sales 19,188 14,707
Rental and trade debtors 13,324 9,464
Cash and cash equivalents with drawing restrictions 7,800 9,322
Other accounts receivable 4,614 15,208
Receivables and other financial assets 51,848 88,420
Other receivables from fiscal authorities 9,496 8,262
Receivables IAS 11 11,045 1,572
Other non financial receivables 3,847 969
Other non financial assets 24,387 10,803
Receivables and other assets 76,235 99,223
Receivables in accordance with IAS 11 include a receivable from joint ventures amounting to € 48 K (31.12.2015: € 61 K).

CONSOLIDATED FINANCIAL STATEMENTS
150
The carrying amounts of receivables and other assets are based on nominal value and bad debt allowance, as follows:
€ 1,000 Nominal value Bad debt
allowance
Book value Nominal value Bad debt
allowance
Book value
31.12.2016 31.12.2016 31.12.2016 31.12.2015
restated
31.12.2015
restated
31.12.2015
restated
Receivables and other
financial assets without bad
debt allowance 50,675 0 50,675 86,229 0 86,229
Receivables and other
financial assets with bad debt
allowance 6,037 – 4,864 1,173 7,210 – 5,020 2,190
Receivables and other
financial assets 56,712 – 4,864 51,848 93,439 – 5,020 88,420
Other non financial assets 24,402 – 14 24,387 10,839 – 36 10,803
81,113 – 4,878 76,235 104,278 – 5,056 99,223
Movements in allowances for receivables and other assets are presented below:
€ 1,000 2016 2015 restated
As at 1.1. 5,056 6,261
Appropriation (value adjustment expenses) 1,353 1,218
Use – 540 – 1,981
Reversal – 658 – 468
Disposal deconsolidation – 311 0
Currency translation adjustments – 21 26
As at 31.12. 4,878 5,056
The aging of receivables and other financial assets, for which no allowance has been recognised is as follows:
not due overdue Total
< 30 days 31 – 180 days 181 – 360 days > 1 year
31.12.2016 44,065 3,943 1,768 243 655 50,675
31.12.2015 restated 81,373 3,426 1,145 126 159 86,229
For overdue not impaired receivables exist corresponding securities like deposits, bank guarantees or similar securi-ties.

CONSOLIDATED FINANCIAL STATEMENTS
CO
NS
OL
IDA
TE
D F
INA
NC
IAL
STA
TE
ME
NT
S
151
31. Current income tax receivables This item amounting to € 10,088 K (31.12.2015: € 36,370 K) related to the CA Immo Germany Group and comprises
corporate income tax and trade tax from the fiscal years 2013 until 2015 not yet assessed by the tax authorities, as well as results of partly finalized tax authorities’ audits.
32. Securities The securities disclosed in the balance sheet relate to transferable shares in IMMOFINANZ AG, Vienna, which were
classified as available for sale (AFS). The CA Immo Group holds as at reporting date 54,805,566 shares (31.12.2015: 50,095,263 shares), which have been valuated at a share price of € 1.853 (31.12.2015: € 2.101).
An impairment of securities amounting to € – 15,768 K (2015: € – 12,993 K) and a dividend income amounting to € 3,288 K (2015: € 0 K) was recorded in the income statement. In the other comprehensive income it was recorded a change in value not affecting the profit and loss in line with IAS 39 and amounting to € 0 K (2015: € – 398 K).
33. Cash and cash equivalents € 1,000 31.12.2016 31.12.2015
Cash in banks 374,805 198,917
Restricted cash 20,260 8,178
Cash on hand 23 16
395,088 207,112
34. Shareholders’ equity The share capital equals the fully paid in nominal capital of CA Immobilien Anlagen Aktiengesellschaft of
€ 718,336,602.72 (31.12.2015: € 718,336,602.72). It is divided into 98,808,332 (31.12.2015: 98,808,332) bearer shares and 4 registered shares of no par value. The registered shares are held by IMMOFINANZ AG, Vienna, each granting the right to nominate one member of the Supervisory Board. In addition to the members elected by the Ordinary General Meeting, the Supervisory Board consists of four members elected by the registered shares.
A total of 1,000,000 bearer shares in the company was acquired in the period between 13.1.2016 and 19.2.2016 at a total purchase price of € 15,392,916.72. The weighted average price per share is thus € 15.39. The highest consideration per share paid within the framework of the buyback program was € 16.38 and the lowest was € 14.39.
A total of 2,000,000 bearer shares in the company was acquired in the period between 25.3.2016 and 30.9.2016 at a total purchase price of € 32,347,069.75. The weighted average price per share is thus € 16.17. The highest consideration per share paid within the framework of the buyback program was € 17.50 and the lowest was € 14.66.
The third share buyback program started at the end of November 2016. The volume totals up to 1,000,000 shares (rep-resenting approximately 1 % of the current share capital of the company) with a maximum limit of € 17.50 per share. Additionally, the prize has to comply with the authorizing resolution of the Annual General Meeting, meaning that the lowest amount payable on repurchase is not to be less than 30 % and not to exceed 10 % of the average unweighted price at the close of the market on the ten trading days preceding the repurchase. The buyback will be made for any permitted purpose covered by the resolution of the Annual General Meeting and will end 2.11.2018 at the latest. As per balance sheet date 403,319 shares with a weighted average price per share of € 17.26 were acquired within the program. As at 31.12.2016, CA Immobilien Anlagen AG had acquired a total of 5,403,319 treasury shares through the share buy-back programs (around 5.5 % of the voting shares).
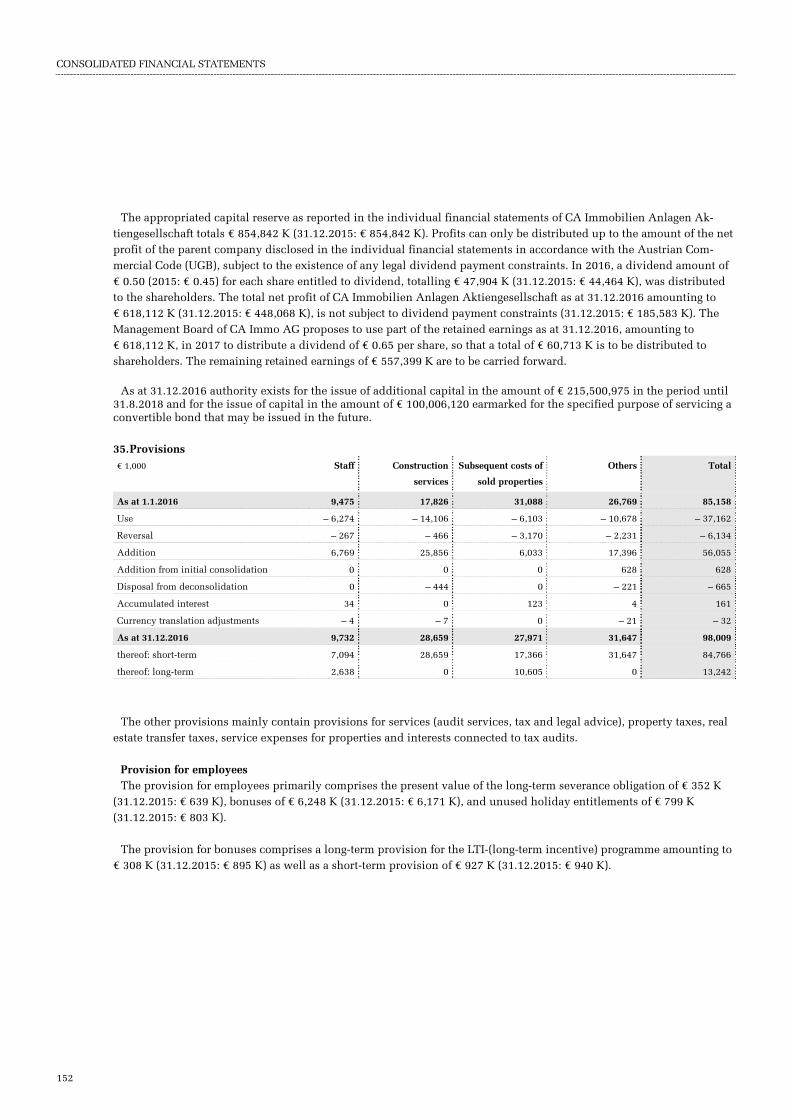
CONSOLIDATED FINANCIAL STATEMENTS
152
The appropriated capital reserve as reported in the individual financial statements of CA Immobilien Anlagen Ak-tiengesellschaft totals € 854,842 K (31.12.2015: € 854,842 K). Profits can only be distributed up to the amount of the net profit of the parent company disclosed in the individual financial statements in accordance with the Austrian Com-mercial Code (UGB), subject to the existence of any legal dividend payment constraints. In 2016, a dividend amount of € 0.50 (2015: € 0.45) for each share entitled to dividend, totalling € 47,904 K (31.12.2015: € 44,464 K), was distributed to the shareholders. The total net profit of CA Immobilien Anlagen Aktiengesellschaft as at 31.12.2016 amounting to € 618,112 K (31.12.2015: € 448,068 K), is not subject to dividend payment constraints (31.12.2015: € 185,583 K). The Management Board of CA Immo AG proposes to use part of the retained earnings as at 31.12.2016, amounting to € 618,112 K, in 2017 to distribute a dividend of € 0.65 per share, so that a total of € 60,713 K is to be distributed to shareholders. The remaining retained earnings of € 557,399 K are to be carried forward.
As at 31.12.2016 authority exists for the issue of additional capital in the amount of € 215,500,975 in the period until 31.8.2018 and for the issue of capital in the amount of € 100,006,120 earmarked for the specified purpose of servicing a convertible bond that may be issued in the future.
35. Provisions € 1,000 Staff Construction
services
Subsequent costs of
sold properties
Others Total
As at 1.1.2016 9,475 17,826 31,088 26,769 85,158
Use – 6,274 – 14,106 – 6,103 – 10,678 – 37,162
Reversal – 267 – 466 – 3,170 – 2,231 – 6,134
Addition 6,769 25,856 6,033 17,396 56,055
Addition from initial consolidation 0 0 0 628 628
Disposal from deconsolidation 0 – 444 0 – 221 – 665
Accumulated interest 34 0 123 4 161
Currency translation adjustments – 4 – 7 0 – 21 – 32
As at 31.12.2016 9,732 28,659 27,971 31,647 98,009
thereof: short-term 7,094 28,659 17,366 31,647 84,766
thereof: long-term 2,638 0 10,605 0 13,242
The other provisions mainly contain provisions for services (audit services, tax and legal advice), property taxes, real estate transfer taxes, service expenses for properties and interests connected to tax audits.
Provision for employees The provision for employees primarily comprises the present value of the long-term severance obligation of € 352 K
(31.12.2015: € 639 K), bonuses of € 6,248 K (31.12.2015: € 6,171 K), and unused holiday entitlements of € 799 K (31.12.2015: € 803 K).
The provision for bonuses comprises a long-term provision for the LTI-(long-term incentive) programme amounting to € 308 K (31.12.2015: € 895 K) as well as a short-term provision of € 927 K (31.12.2015: € 940 K).

CONSOLIDATED FINANCIAL STATEMENTS
CO
NS
OL
IDA
TE
D F
INA
NC
IAL
STA
TE
ME
NT
S
153
The following table presents the changes in the present value of the severance payment obligation:
€ 1,000 2016 2015
Present value of severance obligations as at 1.1 639 784
Use -554 -228
Current service costs 209 95
Interest cost 4 8
Revaluation 55 -21
Present value of severance obligations as at 31.12 352 639
The empirical adjustments of the present value of the obligation in respect of changes in projected employee turnover, early retirement or mortality rates are negligible.
Net position from pension obligations and plan assets CA Immo Group has a reinsurance policy for defined benefit obligations in Germany, which fulfils the criteria for dis-
closure as plan assets. As the capital value of these defined benefit obligations exceeds the plan assets at the closing date, the net position is presented under the provisions.
€ 1,000 31.12.2016 31.12.2015
Present value of obligation – 8,945 – 8,356
Fair value of plan asset 6,968 6,878
Net position recorded in consolidated statement of financial position – 1,977 – 1,479
Financial adjustments of present value of the obligation – 558 734
Experience adjustments of present value of the obligation 52 – 7
The development of the defined benefit obligation and of the plan asset is shown in the following table:
€ 1,000 2016 2015
Present value of obligation as at 1.1. – 8,356 – 8,965
Current Payment 84 21
Interest cost – 167 – 140
Revaluation – 506 727
Present value of obligation 31.12 – 8,945 – 8,356
Plan asset as at 1.1. 6,878 6,629
Expected income from plan asset 137 103
Revaluation 37 166
Current Payment – 84 – 21
Plan asset as at 31.12 6,968 6,878

CONSOLIDATED FINANCIAL STATEMENTS
154
The following income/expense was recognized in the income statement:
€ 1,000 2016 2015
Interest cost -167 -140
Expected income from plan asset 137 103
Pensions costs -30 -36
The following result was recognised in the other comprehensive income:
€ 1,000 2016 2015
Revaluation of pension obligation -506 727
Revaluation of plan assets 37 166
IAS 19 reserve -469 893
Sensitivity analysis regarding the financial mathematical assumptions is shown in the following table:
€ 1,000 – 0.25% + 0.25%
change interest rate of 0.25 percent points – 418 393
change pension trend of 0.25 percentage points 320 – 336
36. Interest bearing liabilities 31.12.2016 31.12.2015
€ 1,000 Short-term Long-term Total Short-term Long-term Total
Bonds 8,961 462,697 471,658 192,238 174,268 366,506
Bonds 8,961 462,697 471,658 192,238 174,268 366,506
Investment loans 143,743 949,937 1,093,681 313,612 684,508 998,120
Loans due to joint venture
partners 300 0 300 39,300 0 39,300
Liabilities to joint ventures 0 0 0 63 0 63
Other interest-bearing liabilities 144,043 949,937 1,093,981 352,975 684,508 1,037,483
153,004 1,412,635 1,565,639 545,214 858,776 1,403,989
The euro is the contract currency of 100% of the interest bearing liabilities (31.12.2015: 100% in EUR).

CONSOLIDATED FINANCIAL STATEMENTS
CO
NS
OL
IDA
TE
D F
INA
NC
IAL
STA
TE
ME
NT
S
155
Bonds 31.12.2016 Nominal value
in € 1,000
Book value
excl. interests
€ 1,000
Deferred
interest
in € 1,000
Nominal
interest rate
Effective
interest rate
Issue Repayment
Bond 2015– 2022 175,000 174,378 4,159 2.75% 2.83% 17.2.2015 17.2.2022
Bond 2016– 2023 150,000 149,234 3,576 2.75% 2.84% 17.2.2016 17.2.2023
Bond 2016– 2021 140,000 139,085 1,227 1.88% 2.03% 12.7.2016 12.7.2021
Total 465,000 462,697 8,961
31.12.2015 Nominal
value
in € 1,000
Book value
excl. interests
€ 1,000
Deferred
interest
in € 1,000
Nominal
interest rate
Effective
interest rate
Issue Repayment
Bonds 2006– 2016 185,992 185,462 2,618 5.13% 5.53% 22.9.2006 22.9.2016
Bond 2015– 2022 175,000 174,268 4,159 2.75% 2.83% 17.2.2015 17.2.2022
Total 360,992 359,730 6,776
Other interest-bearing liabilities As at 31.12.2016 and 31.12.2015, the terms of other interest-bearing liabilities are as follows:
Type of financing and
currency
Effective interest rate as at
31.12.2016 in %
Interest variable /
fixed / hedged
Maturity Nominal
value
in € 1,000
Book
value
in € 1,000
Fair value
of liability
in € 1,000
Investment loans 0.70%– 3.75% variable 3/2017 – 12/2029 358,480 348,061 348,061
Investment loans 1.15%– 5.08% hedged 12/2017 – 12/2024 442,272 450,802 450,802
Investment loans 0.70%– 3.95% fix 9/2018 – 12/2024 294,499 294,817 293,099
Investment loans (total) 1,095,251 1,093,681 1,091,962
Loans due to joint venture
partners
3.40% fix 12/2017
300 300 304
1,095,551 1,093,981 1,092,266

CONSOLIDATED FINANCIAL STATEMENTS
156
Type of financing and
currency
Effective interest rate as
at 31.12.2015 in %
Interest variable /
fixed / hedged
Maturity Nominal
value
in € 1,000
Book
value
in € 1,000
Fair value
of liability
in € 1,000
Investment loans 0.63 % – 4.00 % variable 6/2016 – 12/2029 616,323 610,268 610,268
Investment loans 0.54 % – 2.70 % hedged 6/2016 – 9/2019 288,801 292,620 292,620
Investment loans 1.95 % – 3.95 % fix 12/2018 – 12/2024 95,666 95,232 95,642
Investment loans (total) 1,000,790 998,120 998,530
Loans due to joint venture
partners 3.40 % – 3.50 % fix 12/2016 39,300 39,300 39,065
Liabilities to joint ventures 5.00% fix 12/2016 63 63 63
1,040,153 1,037,483 1,037,658
More than 90 % of the third-party financing of CA Immo Group is subject to financial covenants. These are generally for investment properties LTV (loan to value, i.e. ratio between loan amount and the fair value of the object), ISCR (in-terest service coverage ratio, i.e. the ratio between planned EBIT and financial expenditure) and DSCR (debt service coverage ratio, i.e. the ratio between EBIT and debt service of one period) and ratios for investment properties under development LTC (loan to cost, i.e. ratio between debt amount and total project costs) and ISCR (interest service cover-age ratio, i.e. the ratio between planned EBIT and financial expenditure) ratios for development projects.
Other interest-bearing liabilities, for which the relevant financial covenants were not met as at 31.12.2016, are pre-sented in short-term interest-bearing liabilities regardless of their maturity, because breaches of the financial covenants generally entitle the lender to early termination of the loan agreement. This applies irrespective of the state of negotia-tions with the banks regarding a continuation or amendment of the loan agreements. As at 31.12.2016 no loans were in breach of covenants (31.12.2015: no breaches).
Taking into account all interest hedging agreements, the average weighted interest rate for all other interest bearing liabilities denominated in EUR is 2.25% (31.12.2015: 2.9%).

CONSOLIDATED FINANCIAL STATEMENTS
CO
NS
OL
IDA
TE
D F
INA
NC
IAL
STA
TE
ME
NT
S
157
37. Other liabilities € 1,000 31.12.2016 31.12.2015
Short-term Long-term Total Short-term Long-term Total
Fair value derivative
transactions 1,515 10,068 11,583 602 12,142 12,743
Trade payables 13,801 1,779 15,581 10,568 1,564 12,131
Liabilities to joint
ventures 14,756 0 14,756 14,646 0 14,646
Rent deposits 1,588 9,610 11,198 1,442 8,929 10,371
Outstanding purchase
invoices 751 0 751 965 0 965
Settlement of operating
costs 2,606 0 2,606 2,400 0 2,400
Other 3,890 11,430 15,321 2,849 7,978 10,827
Financial liabilities 37,393 22,819 60,213 32,870 18,471 51,341
Operating taxes 3,463 0 3,463 6,493 0 6,493
Prepayments received 50,816 53,525 104,340 31,275 53,382 84,657
Prepaid rent and other
non financial liabilities 3,877 768 4,645 4,488 917 5,405
Non-financial liabilities 58,156 54,293 112,448 42,256 54,298 96,555
97,064 87,180 184,244 75,728 84,911 160,639
38. Income tax liabilities This caption includes an amount of € 15,984 K (31.12.2015: € 7,994 K) related to CA Immo Germany Group and com-
prises corporate income tax and trade tax for the years 2014 and 2016, which have not been finally assessed by tax authorities as well as results of partly finalized tax authorities’ audits.

CONSOLIDATED FINANCIAL STATEMENTS
158
39. Financial instruments Financial assets by categories
Category IAS 39 category 1) No financial
instruments
Book value Fair value
€ 1,000 HFT AFS L&R 31.12.2016 31.12.2016
Cash and cash equivalents with
drawing restrictions 0 0 8,288 0 8,288 8,288
Derivative financial instruments 12 0 0 0 12 12
Primary financial instruments 0 0 23,639 0 23,639
Investments available for sale 0 57,774 0 0 57,774 57,774
Financial assets 12 57,774 31,927 0 89,713
Cash and cash equivalents with
drawing restrictions 0 0 7,800 0 7,800 7,800
Derivative financial instruments 17 0 0 0 17 17
Other receivables and assets 0 0 44,031 24,387 68,418
Receivables and other assets 17 0 51,831 24,387 76,235
Current income tax receivables 0 0 0 15,552 15,552
Securities 0 101,555 0 0 101,555 101,555
Cash and cash equivalents 0 0 395,088 0 395,088
29 159,328 478,846 39,940 678,144
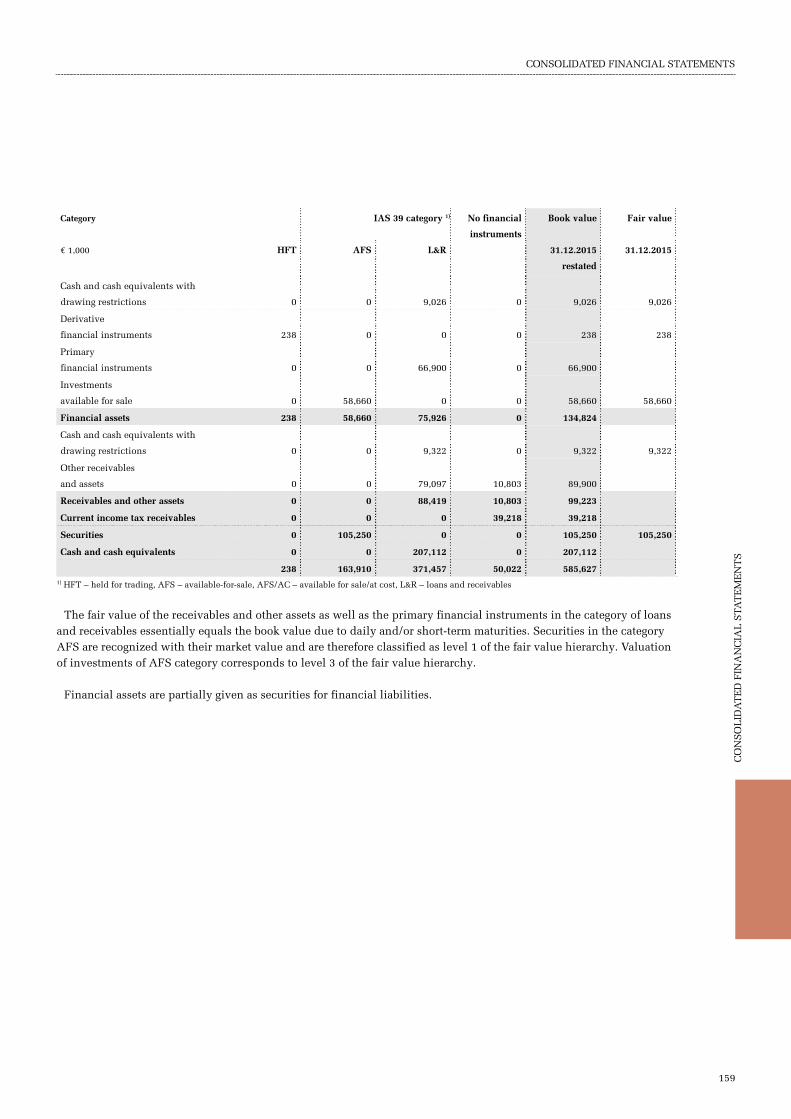
CONSOLIDATED FINANCIAL STATEMENTS
CO
NS
OL
IDA
TE
D F
INA
NC
IAL
STA
TE
ME
NT
S
159
Category IAS 39 category 1) No financial
instruments
Book value Fair value
€ 1,000 HFT AFS L&R 31.12.2015
restated
31.12.2015
Cash and cash equivalents with
drawing restrictions 0 0 9,026 0 9,026 9,026
Derivative
financial instruments 238 0 0 0 238 238
Primary
financial instruments 0 0 66,900 0 66,900
Investments
available for sale 0 58,660 0 0 58,660 58,660
Financial assets 238 58,660 75,926 0 134,824
Cash and cash equivalents with
drawing restrictions 0 0 9,322 0 9,322 9,322
Other receivables
and assets 0 0 79,097 10,803 89,900
Receivables and other assets 0 0 88,419 10,803 99,223
Current income tax receivables 0 0 0 39,218 39,218
Securities 0 105,250 0 0 105,250 105,250
Cash and cash equivalents 0 0 207,112 0 207,112
238 163,910 371,457 50,022 585,627 1) HFT – held for trading, AFS – available-for-sale, AFS/AC – available for sale/at cost, L&R – loans and receivables
The fair value of the receivables and other assets as well as the primary financial instruments in the category of loans and receivables essentially equals the book value due to daily and/or short-term maturities. Securities in the category AFS are recognized with their market value and are therefore classified as level 1 of the fair value hierarchy. Valuation of investments of AFS category corresponds to level 3 of the fair value hierarchy.
Financial assets are partially given as securities for financial liabilities.

CONSOLIDATED FINANCIAL STATEMENTS
160
Financial liabilities by categories Category IAS 39 category 1) No financial
instruments
Book value Fair value
€ 1,000 HFT CFH FLAC 31.12.2016 31.12.2016
Bonds 0 0 471,658 0 471,658 498,201
Other interest-bearing
liabilities 0 0 1,093,981 0 1,093,981 1,092,266
Interest-bearing
liabilities 0 0 1,565,639 0 1,565,639
Derivative financial
instruments 7,432 4,151 0 0 11,583 11,583
Other primary
liabilities 0 0 60,213 112,448 172,661
Other liabilities 7,432 4,151 60,213 112,448 184,244
7,432 4,151 1,625,852 112,448 1,749,883 1) HFT – held for trading, CFH – Cash-flow Hedge, FLAC – financial liabilities at amortised cost
Category IAS 39 category 1) No financial
instruments
Book value Fair value
€ 1,000 HFT CFH FLAC 31.12.2015 31.12.2015
Bonds 0 0 366,506 0 366,506 369,876
Other interest-bearing
liabilities 0 0 1,037,483 0 1,037,483 1,037,658
Interest-bearing liabilities 0 0 1,403,989 0 1,403,989
Derivative financial
instruments 5,801 6,942 0 0 12,743 12,743
Other primary liabilities 0 0 51,341 96,555 147,895
Other liabilities 5,801 6,942 51,341 96,555 160,639
5,801 6,942 1,455,330 96,555 1,564,628 1) HFT – held for trading, CFH – Cash-flow Hedge, FLAC – financial liabilities at amortised cost
The fair value recognised of the other non-derivative liabilities basically equals the book value, based on the daily and short term due date.
40. Derivative financial instruments and hedging transactions 31.12.2016 31.12.2015
€ 1,000 Nominal value Fair value Book value Nominal value Fair value Book value
Interest rate swaps 397,766 – 11,583 – 11,583 243,227 – 12,743 – 12,743
Swaption 20,000 17 17 139,600 189 189
Interest rate caps 44,196 12 12 45,277 48 48
Total 461,962 – 11,554 – 11,554 428,104 – 12,506 – 12,505
- thereof hedging (cash flow
hedges) 92,360 – 4,151 – 4,151 95,555 – 6,942 – 6,942
- thereof stand alone (fair value
derivatives) 369,602 – 7,403 – 7,403 332,549 – 5,563 – 5,563
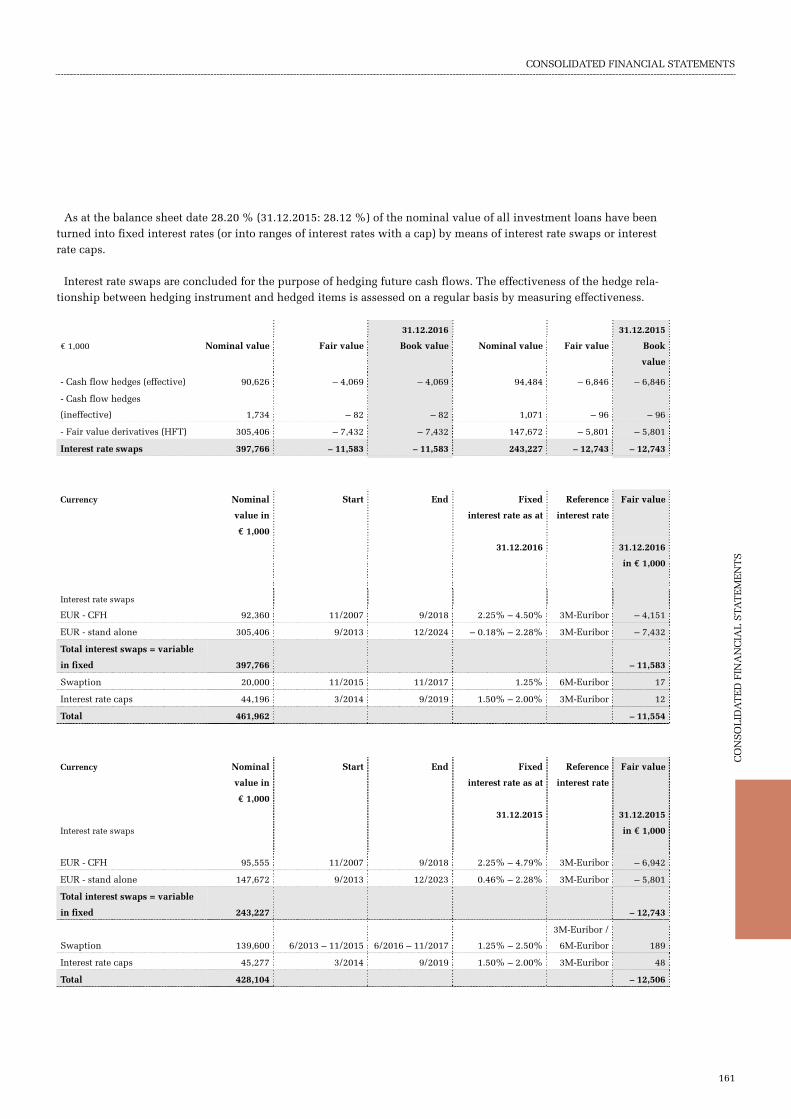
CONSOLIDATED FINANCIAL STATEMENTS
CO
NS
OL
IDA
TE
D F
INA
NC
IAL
STA
TE
ME
NT
S
161
As at the balance sheet date 28.20 % (31.12.2015: 28.12 %) of the nominal value of all investment loans have been turned into fixed interest rates (or into ranges of interest rates with a cap) by means of interest rate swaps or interest rate caps.
Interest rate swaps are concluded for the purpose of hedging future cash flows. The effectiveness of the hedge rela-tionship between hedging instrument and hedged items is assessed on a regular basis by measuring effectiveness.
31.12.2016 31.12.2015
€ 1,000 Nominal value Fair value Book value Nominal value Fair value Book
value
- Cash flow hedges (effective) 90,626 – 4,069 – 4,069 94,484 – 6,846 – 6,846
- Cash flow hedges
(ineffective) 1,734 – 82 – 82 1,071 – 96 – 96
- Fair value derivatives (HFT) 305,406 – 7,432 – 7,432 147,672 – 5,801 – 5,801
Interest rate swaps 397,766 – 11,583 – 11,583 243,227 – 12,743 – 12,743
Currency Nominal
value in
€ 1,000
Start End Fixed
interest rate as at
Reference
interest rate
Fair value
31.12.2016 31.12.2016
in € 1,000
Interest rate swaps
EUR - CFH 92,360 11/2007 9/2018 2.25% – 4.50% 3M-Euribor – 4,151
EUR - stand alone 305,406 9/2013 12/2024 – 0.18% – 2.28% 3M-Euribor – 7,432
Total interest swaps = variable
in fixed 397,766 – 11,583
Swaption 20,000 11/2015 11/2017 1.25% 6M-Euribor 17
Interest rate caps 44,196 3/2014 9/2019 1.50% – 2.00% 3M-Euribor 12
Total 461,962 – 11,554
Currency Nominal
value in
€ 1,000
Start End Fixed
interest rate as at
Reference
interest rate
Fair value
31.12.2015 31.12.2015
Interest rate swaps in € 1,000
EUR - CFH 95,555 11/2007 9/2018 2.25% – 4.79% 3M-Euribor – 6,942
EUR - stand alone 147,672 9/2013 12/2023 0.46% – 2.28% 3M-Euribor – 5,801
Total interest swaps = variable
in fixed 243,227 – 12,743
Swaption 139,600 6/2013 – 11/2015 6/2016 – 11/2017 1.25% – 2.50%
3M-Euribor /
6M-Euribor 189
Interest rate caps 45,277 3/2014 9/2019 1.50% – 2.00% 3M-Euribor 48
Total 428,104 – 12,506

CONSOLIDATED FINANCIAL STATEMENTS
162
Gains and losses in other comprehensive income € 1,000 2016 2015
As at 1.1. – 5,131 – 27,503
Change in valuation of cash flow hedges 2,446 1,775
Change of ineffectiveness cash flow hedges – 13 – 19
Reclassification cash flow hedges 177 25,931
Income tax cash flow hedges – 680 – 5,315
As at 31.12. – 3,201 – 5,131
thereof: attributable to the owners of the parent – 3,201 – 5,131
41. Risks from financial instruments Interest rate risk Risks arising from changes in interest rates basically result from long-term loans and interest rate derivatives and re-
late to the amount of future interest payments (for variable interest instruments) and to the fair value of the financial instrument (for fixed rate instruments). A mix of long-term fixed-rate and floating-rate loans is used to reduce the inter-est rate risk. In case of floating-rate loans, derivative financial instruments (interest rate caps and interest rate swaps) are also used to hedge the cash-flow risk of interest rate changes arising from hedged items. In addition to the general interest rate risk (interest level) there are also risks arising from a possible change in the credit rating, which would lead to an increase or a decrease of the interest margin in course of a follow-up financing.
The following sensitivity analysis outlines the impact of variable interest rates on interest expense. It shows the effect of a change in interest rate by 50 and 100 basis points on the interest expenses. The analysis assumes that all other variables, particularly foreign exchange rates, remain constant. Due to the very low interest rate levels the analysis only shows the effect of increasing interest rates.
€ 1,000 recognised in Profit/Loss Statement recognised in other comprehensive
income
at 50 bps at 100 bps at 50 bps at 100 bps
Increase Increase Increase Increase
31.12.2016
Interest on variable rate instruments – 2,026 – 4,052 0 0
Valuation result from fixed rate instruments (Swaps) 7,002 13,783 0 0
Valuation result from derivative financial instruments 55 256 587 1,168
5,032 9,986 587 1,168
31.12.2015
Interest on variable rate instruments – 3,885 – 7,770 0 0
Valuation result from fixed rate instruments (Swaps) 3,398 6,698 0 0
Valuation result from derivative financial instruments 2,282 4,485 1,115 2,213
1,795 3,413 1,115 2,213

CONSOLIDATED FINANCIAL STATEMENTS
CO
NS
OL
IDA
TE
D F
INA
NC
IAL
STA
TE
ME
NT
S
163
Variable rate instruments contain variable rate financial liabilities, loans and receivables from financing, not taking into account derivatives. In the case of derivative financial instruments, an interest rate change gives rise to a compo-nent recognized in profit or loss (interest, valuation of fair value derivatives and ineffective portions of cash flow hedge valuation) and to the change in value of cash flow hedges recognized in equity.
Currency risk Currency risks result from rental revenues and receivables denominated in BGN, CZK, HRK, HUF, PLN, RON, CHF
and RSD. This foreign currency rental income is secured by linking the rental payments to EUR and USD, so that no major risk remains.
Credit risk The book values disclosed for all financial assets, guarantees and other commitments assumed, represent the maxi-
mum default risk as no major set-off agreements exist.
Tenants provided deposits amounting to € 11,198 K (31.12.2015: € 10,371 K) as well as bank guarantees of € 39,742 K (31.12.2015: € 31,076 K) and group guarantees in the amount of € 46,580 K (31.12.2015: € 45,497 K).
The credit risk for liquid funds with banks is monitored according to internal guidelines.
Liquidity risk Liquidity risk is the risk that CA Immo Group will not be able to meet its financial obligations as they fall due. CA
Immo Group’s approach to managing liquidity is to ensure that CA Immo Group will always have sufficient liquidity to meet liabilities when due, whilst avoiding unnecessary potential losses and risks. Loans are usually agreed on a long-term basis in accordance with the long-term nature of real estate.
The CA Immo Group manages liquidity risk in several different ways: firstly, by means of distinct liquidity planning and securing to avoid possible liquidity shortages. Secondly, CA Immo Group takes safeguarding measures by entering into capital partnerships (joint ventures) for project development purposes as an alternative and extension to estab-lished sources of raising equity capital. External capital is raised by CA Immo Group from a wide variety of domestic and foreign banks. The contractually agreed (undiscounted) interest payments and repayments for primary financial liabilities and derivative financial instruments are presented in the table below.

CONSOLIDATED FINANCIAL STATEMENTS
164
31.12.2016
€ 1,000
Book value 2016 Contractually
agreed cash
flows
Cash-flow
2017
Cash-flow
2018– 2021
Cash-flow
2022 ff
Bonds 471,658 – 535,875 – 11,563 – 186,250 – 338,063
Other interest-bearing liabilities 1,093,981 – 1,185,467 – 161,358 – 571,809 – 452,300
Trade payables 15,581 – 15,581 – 13,801 – 1,779 0
Non-controlling interests held by limited
partners 2,432 – 2,432 0 0 – 2,432
Liabilities to joint ventures 14,756 – 14,756 – 14,756 0 0
Other liabilities 27,444 – 27,444 – 8,836 – 17,502 – 1,106
Primary financial liabilities 1,625,852 – 1,781,554 – 210,314 – 777,340 – 793,900
Interest rate derivatives in connection with cash
flow hedges 4,151 – 4,223 – 3,086 – 1,137 0
Interest rate derivatives not connected with
hedges 7,432 – 7,414 – 1,300 – 4,336 – 1,777
Derivative financial liabilities 11,583 – 11,637 – 4,386 – 5,474 – 1,777
1,637,435 – 1,793,191 – 214,700 – 782,814 – 795,677
31.12.2015
€ 1,000
Book value
2015
Contractually
agreed cash
flows
Cash-flow
2016
Cash-flow
2017– 2020
Cash-flow
2021 ff
Other bonds 366,506 – 404,212 – 200,337 – 19,250 – 184,625
Other interest-bearing liabilities 1,037,483 – 1,119,897 – 373,332 – 478,442 – 268,123
Trade payables 12,131 – 12,131 – 10,568 – 1,564 0
Non-controlling interests held by limited partners 2,320 – 2,320 0 0 – 2,320
Liabilities to joint ventures 14,646 – 14,646 – 14,646 0 0
Other liabilities 22,243 – 22,243 – 7,656 – 13,677 – 910
Primary financial liabilities 1,455,330 – 1,575,450 – 606,538 – 512,933 – 455,978
Interest rate derivatives in connection with cash flow
hedges 6,942 – 6,997 – 2,983 – 4,015 0
Interest rate derivatives not connected with hedges 5,801 – 5,842 – 1,289 – 2,778 – 1,774
Derivative financial liabilities 12,743 – 12,839 – 4,272 – 6,793 – 1,774
1,468,073 – 1,588,289 – 610,810 – 519,726 – 457,753
The cash flows for interest rate derivatives are based on assumed values for the underlying forward rates as at the respective balance sheet date.
The cash flows from derivatives in cash flow hedge relationships are expected to have an effect on profit and loss in the period of occurrence of the underlying transaction, i.e. allocated over the term of the financing or when redeemed prematurely at the time of redemption.
Price risk The CA Immo Group holds available-for-sale securities in its portfolio. This financial instrument is quoted in an ac-
tive market (level 1 of the fair value hierarchy), thus it can constantly be influenced by the price (price risk). If a sup-posed change, i.e. an increase/decrease of 10 % in the price of securities above the actual level occurs, this change will impact current comprehensive income of CA Immo Group by +/- € 10,155 K.

CONSOLIDATED FINANCIAL STATEMENTS
CO
NS
OL
IDA
TE
D F
INA
NC
IAL
STA
TE
ME
NT
S
165
Capital management The objective of CA Immo Group's capital management is to ensure that the Group achieves its goals and strategies,
while optimising the costs of capital effectively and in the interests of shareholders, employees and other stakeholders. In particular, it focuses on achieving of minimum return on invested capital required by the capital market and increas-ing the return on equity. Furthermore, the external rating should be supported by adequate capitalisation and by raising equity for the growth targets in the upcoming fiscal years.
The key parameters in determining the capital structure of the CA Immo Group are:
1. the general ratio of equity to debt and 2. within outside capital, the optimal ratio between the debt secured with real estate, which is recorded at the level
of individual property companies, and the unsecured debt at the level of the parent company.
Regarding the first parameter, the CA Immo Group aims to maintain an equity ratio of 45 % - 50 %. As at 31.12.2016 the ratio was 51.2%. With respect to the second parameter, the focus of debt financing in the Group is on secured prop-erty loans, which are usually taken directly by the project company in which the property is held. The advantage of secured financing is that it usually offers more favourable conditions than unsecured loans, since these are struc-turally subordinated compared to secured financing. Unsecured financing exists basically only in the form of corporate bonds placed on the capital markets. CA Immo Group issued in 2016 two corporate bonds and thus raises finance increasingly via the capital market. There are no explicit requirements by third parties in respect of the achievement of capital man-agement ratios.
Net debt and the gearing ratio are other key figures relevant to the presentation of the capital structure of CA Immo Group:
€ 1,000 31.12.2016 31.12.2015
Interest-bearing liabilities
Long-term interest-bearing liabilities 1,412,635 858,776
Short-term interest-bearing liabilities 153,004 545,214
Interest-bearing assets
Cash and cash equivalents – 395,088 – 207,112
Cash at banks with drawing restrictions – 2,894 – 5,432
Net debt 1,167,656 1,191,446
Shareholders' equity 2,204,541 2,120,450
Gearing ratio (Net debt/equity) 53.0% 56.2%
Restricted cash was included in the calculation of net debt, if it is used to secure the repayments of interest bearing liabilities.
42. Other obligations and contingent liabilities Guarantees and other commitments As at 31.12.2016 CA Immo Germany Group is subject to guarantees and other commitments amounting to € 0 K
(31.12.2015: € 120 K) resulting from urban development contracts and purchase agreements for decontamination costs and war damage costs amounting to € 566 K (31.12.2015: € 491 K). Furthermore, comfort letters and securities have been issued for one joint venture in Germany amounting to € 2,000 K (31.12.2015: € 2,000 K). As a security for the liabilities of four (31.12.2015: three) joint ventures in Germany loan guarantees, letters of comfort and declarations were issued totalling € 10,650 K (31.12.2015: € 12,150 K). Furthermore, as security for warranty risks of a german company a guarantee was issued in an amount of € 11,066 K (31.12.2015: € 6,066 K).

CONSOLIDATED FINANCIAL STATEMENTS
166
CA Immo Group has agreed to adopt a guarantee in connection with the project “Airport City St. Petersburg” in the extent of € 11,299 K (31.12.2015: € 13,483 K).
In connection with disposals, marketable guarantees exist between CA Immo Group and the buyer for coverage of possible warranty- and liability claims for which in the expected extent financial dispositions were made. The actual claims may exceed the expected extent.
Following the disposal of Tower 185, Frankfurt, as at 31.12.2013 CA Immo Group granted a guarantee for compensa-tion of rent-free periods as well as rent guarantees for which adequate provisions have been recognised in the balance sheet. The shares in CA Immo Frankfurt Tower 185 GmbH & Co KG as well as the shares in CA Immo Frankfurt 185 Betriebs GmbH were pledged as security for loans.
As at 31.12.2015 CA Immo Group issued guarantees for bank liabilities of six joint ventures in Poland in the amount of € 44,269 K.
For the purpose of recognising tax provisions, estimates have to be made. Uncertainties exist concerning the interpre-tation of complex tax regulations as well as the amount and timing of taxable income. Due to these uncertainties and the grade of complexity estimates may vary from the real tax expense also in a material amount. CA Immo Group rec-ognises appropriate provisions for known and probable charges arising from ongoing tax audits. Concerning a tax audit in Eastern Europe legal steps about the prescription of default interest were introduced. CA Immo Group estimates the possibility of actual expenses due to these default interests as low.
Mortgages, pledges of rental receivables, bank accounts and share pledges as well as similar guarantees are used as market collateral for bank liabilities.
Other financial obligations In addition, there are other financial obligations of order commitments related to building site liabilities for work car-
ried out in the course of developing real estate in Austria, in the amount of € 13,300 K (31.12.2015: € 2,103 K), in Ger-many, in the amount of € 50,400 K (31.12.2015: € 32,922 K) and in Eastern Europe in the amount of € 31,716 K (31.12.2015: € 10,381 K). In addition as at 31.12.2016 CA Immo Group is subject to other financial commitments result-ing from construction costs from urban development contracts which can be capitalised in the future in an amount of € 44,136 K (31.12.2015: € 52,943 K).
The total obligations of the payments of equity in joint ventures for which no adequate provisions have been recog-nised amount in Austria to € 6,035 K (31.12.2015: € 0 K), in Germany to € 6,471 K (31.12.2015: € 5,021 K) and in East-ern Europe to € 191 K (31.12.2015: € 450 K) as per 31.12.2016. Besides the mentioned obligations of equity-payments, no further obligations to joint ventures exist.
Borrowings, for which the financial covenants have not been met as at reporting date, thus enabling the lender in principle to prematurely terminate the loan agreement, have to be recognised in short-term financial liabilities irrespec-tive of the remaining term under the contract. This classification applies notwithstanding the status of negotiations with the banks concerning the continuation or amendment of the loan agreements. As at 31.12.2016, this applied to no loan (31.12.2015: no loan).

CONSOLIDATED FINANCIAL STATEMENTS
CO
NS
OL
IDA
TE
D F
INA
NC
IAL
STA
TE
ME
NT
S
167
43. Leases CA Immo Group as lessor All lease contracts concluded by CA Immo Group, under which CA Immo Group is the lessor, are recorded as operat-
ing leases in accordance with IFRS. These generally have the following essential contractual terms:
linkage to EUR or USD guaranteed value by linkage to international indices medium- to long-term maturities and/or termination waivers.
Future minimum rental income from existing term lease contracts or contracts with termination waivers as at the re-porting date are as follows:
€ 1,000 2016 2015
In the following year 165,746 157,482
Thereafter 4 years 381,135 349,402
More than 5 years 205,385 233,198
Total 752,266 740,081
All remaining rental agreements may be terminated at short notice and not included in the above table.
The minimum rental income includes net rent amounts to be collected until the contractually agreed expiration of the contract or the earliest possible termination option by the lessee (tenant).
CA Immo Group as lessee All rental agreements signed by CA Immo Group are classified as operating leases.
The lease contracts concluded by CA Immo Germany Group acting as lessee primarily relate to rented properties in Berlin (until 2018), Frankfurt (until 2021) and Munich (until 2022).
The remaining operating lease agreements of CA Immo Group relate to office furniture, equipment and other assets. No purchase options have been agreed. Leasing payments of € 2,397 K were recognised as expenses in 2016 (2015: € 2,052 K).
The following minimum lease payments will become due in the subsequent periods:
€ 1,000 2016 2015
In the following year 1,836 1,830
Thereafter 4 years 3,383 4,257
More than 5 years 529 101
Total 5,748 6,188

CONSOLIDATED FINANCIAL STATEMENTS
168
44. Transactions with related parties The following companies and parties are deemed related parties to the CA Immo Group:
joint ventures, in which CA Immo Group holds an interest associated companies, in which CA Immo Group holds an interest the corporate bodies of CA Immobilien Anlagen Aktiengesellschaft O1 Group Limited, Cyprus, and its affiliated O1 Group until 1.8.2016 IMMOFINANZ AG, Vienna, and its affiliated entities since 2.8.2016
Transactions with joint ventures
Joint ventures
€ 1,000 31.12.2016 31.12.2015
Investments in joint ventures 191,369 172,286
Investments in joint ventures held for sale 11,690 2,982
Loans 3,608 6,162
Receivables 6,970 39,779
Liabilities 35,145 37,637
Provisions 18,406 19,528
2016 2015
Joint ventures result 10,505 42,524
Result from sale of joint ventures 914 697
Result from joint ventures 11,420 43,221
Other income 3,030 5,382
Other expenses – 1,480 – 1,357
Interest income 468 5,363
Interest expense 0 – 696
Interest income present value financial investments 0 2,772
Apart from above mentioned transactions, in 2016, investment properties amounting to € 2,171 K (2015: € 0 K) were acquired from joint ventures.
Outstanding loans to joint ventures and the majority of the receivables from joint ventures as at the reporting date serve to finance the properties. Partly guarantees or other forms of securities exist in connection with these loans. The cumulative impairment loss on loans to joint ventures amounts to € 5,318 K (31.12.2015: € 12,114 K). Receivables from joint ventures comprise short-term loans in the amount of € 1,636 K (31.12.2015: € 34,580 K). Liabilities against joint ventures include long-term loans amounted to € 0 K (31.12.2015: € 0 K). All receivables and liabilities have interest rates in line with those prevailing on the market. The remaining receivables and liabilities are predominantly the result of services performed in Germany. No guarantees or other forms of security exist in connection with these receivables and liabilities.
No additional impairment losses or other adjustments to the book values were recognised in profit or loss.

CONSOLIDATED FINANCIAL STATEMENTS
CO
NS
OL
IDA
TE
D F
INA
NC
IAL
STA
TE
ME
NT
S
169
Transactions with associated companies Associated companies
€ 1,000 31.12.2016 31.12.2015
Loans 8,750 12,827
2016 2015
Expenses due to associated companies – 4,077 – 6,297
Result from associated companies – 4,077 – 6,297
Loans to associated companies outstanding as at the reporting date relate to a project in Russia. All loans have interest rates in line with those prevailing in the market. No guarantees or other forms of security exist in connection with these loans. The cumulative impairment loss recognised on loans to associated companies amounts to € 13,652 K (31.12.2015: € 9,575 K).
The executive bodies of CA Immobilien Anlagen Aktiengesellschaft, Vienna Management Board Frank Nickel (Chief Executive Officer since 1.1.2016) Dr. Hans Volckens (since 27.9.2016) Florian Nowotny (until 30.9.2016)
In business year 2016, total salary payments to active Management Board members stood at € 1,347 K (€ 1,485 K in 2015). Of this amount, € 126 K (2015: € 101 K) were salary-related deductions. Management Board remuneration con-tains € 203 K in short-term incentives (€ 545 K in 2015) and € 106 K from the LTI tranche for 2013-2015 (€ 175 K in 2015 for the LTI tranche for 2012-2014). Fixed salary components made up 77 % of Management Board remuneration (52 % in 2015), with variable salary components accounting for 23 % (48 % in 2015). Provisions of € 932 K (2015: € 467 K) including incidental charges were allocated at Management Board level for variable salary components paya-ble in 2017 on the basis of targets agreed in business year 2016. As at 31.12.2016 provisions totaling € 1,235 K (includ-ing incidental charges; € 1,835 K on 31.12.2015) had been formed in connection with the LTI programmes starting in 2014, 2015 and 2016; of this, the Management Board accounted for € 143 K (€ 206 K in the previous year). During busi-ness year 2016, contributions to pension funds for Management Board members (defined contribution plan) totalled € 124 K (€ 60 K in 2015). Payments to form a reserve for severance payment claims (defined benefit plan) amounted to € 84 K in the last business year (compared to € 65 K in 2015). As at 31.12.2016, severance payment provisions for the Management Board totalled € 84 K (€ 189 K on 31.12.2015). Payments have been made to former members of the Man-agement Board as follows: Following early termination of his Management Board contract, Florian Nowotny received a severance payment of € 2,441 K in 2016; appropriate provision was made on the balance sheet date for payment of an additional € 150 K on 31 March 2017. In 2016, corresponding salary-based deductions amounted to € 169 K. In 2015, Dr. Bruno Ettenauer received a severance payment of € 2,490 K; further payment of an additional € 150 K was due on 30.6.2016. Appropriate provision has been made on the balance sheet date 31.12.2015. A total of € 193 K was paid to former members from maturity of the LTI tranche 2013-2015 (€ 320 K in the previous year for LTI tranche 2012-2014). There are no further obligations. No loans or advances were granted to Management Board members.

CONSOLIDATED FINANCIAL STATEMENTS
170
PAYMENTS TO THE MANAGEMENT BOARD 1)
Frank
Nickel2)
Hans
Volckens3)
Bruno
Ettenauer4)
Florian
Nowotny5)
Total6)
€ 1,000 2016 2015 2016 2015 2016 2015 2016 2015 2016 2015
Fixed salary 400 0 88 0 0 343 230 246 718 589
Salary-based deductions 56 0 13 0 0 63 57 37 126 101
Remuneration in kind, company car, etc 45 0 1 0 0 9 4 4 51 13
Expense allowances 13 0 4 0 0 1 2 1 18 2
Total fixed salaries 514 0 106 0 0 416 294 290 913 706
Total fixed salaries as % (incl. contributions to
pension funds)
100% 0% 100% 0% 0% 50% 55% 53% 77% 52%
Short-term variable payments (objective agree-
ment bonus)
0 0 0 0 0 320 203 225 203 545
Mid-term variable payments (LTI programme) 0 0 0 0 0 126 106 49 106 175
Total variable payments 0 0 0 0 0 446 309 274 309 720
Total variable payments as % 0% 0% 0% 0% 0% 50% 45% 47% 23% 48%
Contributions to pension funds 41 0 0 0 0 35 83 25 124 60
Total salary payments 555 0 106 0 0 896 686 589 1,347 1,4851) The table contains only compensation components actually paid in 2015 or 2016. As at 31.12.2016 provisions of € 932 K were recognised for bonus
entitlements for 2016
2) Chief Executive Officer since 1.1.2016 3) Member of the management board (CFO) since 27.9.2016 4) Chief Executive Officer until 31.12.2015 5) Member of the management board (CFO) until 30.9.2016 6) Exclusive severance payment of € 2,640 K for Dr. Bruno Ettenauer and € 2,441 K for Florian Nowotny plus corresponding salary-based deductions of
€ 197 K (in 2015) and € 169 K (in 2016) following the early termiantion of the management board contracts.
Supervisory Board Elected by the General Meeting: Torsten Hollstein, Chairman (since 3.5.2016) Dr. Florian Koschat, Vice Chairman (since 3.5.2016) Richard Gregson John Nacos Michael Stanton Dmitry Mints, Vice Chairman (until 21.12.2016) Dr. Maria Doralt (until 10.11.2016) Barbara A. Knoflach (until 10.11.2016) Dr. Wolfgang Ruttenstorfer (until 10.11.2016) Franz Zwickl (until 17.2.2016)
Delegated by registered share: Dr. Oliver Schumy (since 2.8.2016) Stefan Schönauer (since 2.8.2016) Univ.-Prof. Dr. Klaus Hirschler (since 1.12.2016) Prof. Dr. Sven Bienert (since 1.12.2016) Timothy Fenwick (from 3.5.2016 until 30.11.2016) Marina Rudneva (from 3.5.2016 until 2.8.2016) Dr. Wolfgang Renner (from 3.5.2016 until 2.8.2016)

CONSOLIDATED FINANCIAL STATEMENTS
CO
NS
OL
IDA
TE
D F
INA
NC
IAL
STA
TE
ME
NT
S
171
Delegated by works council: Sebastian Obermair (since 22.3.2016) Georg Edinger (since 3.5.2016) Nicole Kubista (since 3.5.2016) Franz Reitermayer (since 3.5.2016)
In the business year 2016 payments amounting to approximately € 306 K (2015: € 198 K), representing fixed remuner-ation for 2015 (including attendance fees for members of Supervisory Board totaling € 85 K, previous year € 19 K), were made.
Additionally Supervisory Board related expenses amounted to € 242 K (2015: € 215 K). Out of this amount, cash out-lays for travel expenses amounted to € 47 K (2015: € 13 K), legal and other consultancy services for the Supervisory Board totalled € 194 K (2015: € 0 K) and other expenses were of € 1 K (2015: € 4 K). No other fees (particularly for consultancy or brokerage activities) were paid to Supervisory Board members.
For the business year 2016 a total remuneration of € 396 K is to be proposed to the Annual General Meeting based on the same criteria (annual fixed remuneration of € 25 K per member of the Supervisory Board as well as an attendance fee of € 1 K per meeting day); a provision was made for the same amount as at 31.12.2016. The increase compared to the previous year results from the expansion of the Supervisory Board.
All business transactions conducted between the company and members of the Supervisory Board which oblige such members to perform services for the CA Immo Group outside of their Supervisory Board activities in return for remu-neration of a not inconsiderable value (L Rule no. 48 and article 228 section 3 of the Austrian Commercial Code) must conform to industry standards and be approved by the Supervisory Board. The same applies to contracts with compa-nies in which a Supervisory Board member has a significant business interest. In this specific case, the conclusion of agreements with, and award of assignments to, the global law office DLA Piper and its international partner firms was particularly relevant because Maria Doralt, who was a member of the Supervisory Board of CA Immo AG is also a part-ner in DLA Piper. A letter of engagement has existed with DLA Piper UK LLP since the end of 2012 concerning advice relating to the letting of the Kontorhaus office building in Munich. On behalf of the refinancing banks DLA Piper Weiss-Tessbach Rechtsanwälte GmbH acted in an advisory capacity in connection with two refinancing operations in Hungary. The relevant fees correspond to usual hourly rates for the sector and totalled € 0 K for business year 2016 (€ 164 K in 2015). No other fees (particularly for consultancy or brokerage activities) were paid to Supervisory Board members. No loans or advances were granted.
O1 Group Limited/O1 Group From 20.2.2015 until its disposal to IMMOFINANZ AG on 2.8.2016 (closing date), O1 Group Limited directly or indi-
rectly held 25,690,163 bearer shares and four registered shares of CA Immo AG.
In connection with the voluntary public partial offer made to the shareholders of IMMOFINANZ AG in 2015, CA Immo AG and O1 Group Limited were deemed parties acting in concert under the terms of the Austrian Takeover Act. In this regard, there was a memorandum of understanding with O1 Group Limited which was terminated in 2016.
During the second quarter 2015, following a competitive process with Vesper Real Estate (Cyprus) Limited, a company under the influence of Mr. Boris Mints (owner and chairman of O1 Group), a sales contract regarding a plot in Berlin (Kunstkubus, Europacity) suitable for residential construction was signed. The agreed purchase price of € 7,000 K was confirmed by an external fairness opinion and was paid in the first quarter 2016.
IMMOFINANZ AG With share purchase agreement dated 17.4.2016, IMMOFINANZ AG acquired (i) 25,690,163 bearer shares from Terim
Limited and (ii) four registered shares from O1 Group Limited of CA Immo AG (approximately 26% of the capital stock of CA Immo AG). Closing of the transaction was on 2.8.2016.
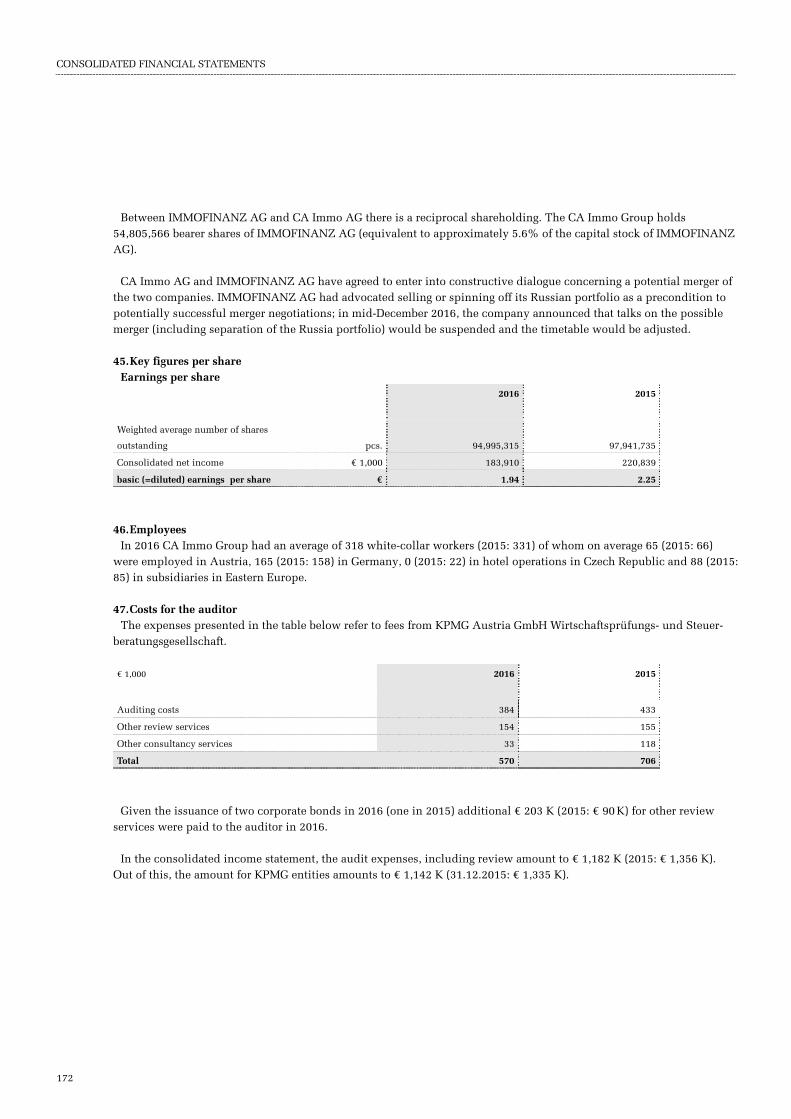
CONSOLIDATED FINANCIAL STATEMENTS
172
Between IMMOFINANZ AG and CA Immo AG there is a reciprocal shareholding. The CA Immo Group holds 54,805,566 bearer shares of IMMOFINANZ AG (equivalent to approximately 5.6% of the capital stock of IMMOFINANZ AG).
CA Immo AG and IMMOFINANZ AG have agreed to enter into constructive dialogue concerning a potential merger of the two companies. IMMOFINANZ AG had advocated selling or spinning off its Russian portfolio as a precondition to potentially successful merger negotiations; in mid-December 2016, the company announced that talks on the possible merger (including separation of the Russia portfolio) would be suspended and the timetable would be adjusted.
45. Key figures per share Earnings per share
2016 2015
Weighted average number of shares
outstanding pcs. 94,995,315 97,941,735
Consolidated net income € 1,000 183,910 220,839
basic (=diluted) earnings per share € 1.94 2.25
46. Employees In 2016 CA Immo Group had an average of 318 white-collar workers (2015: 331) of whom on average 65 (2015: 66)
were employed in Austria, 165 (2015: 158) in Germany, 0 (2015: 22) in hotel operations in Czech Republic and 88 (2015: 85) in subsidiaries in Eastern Europe.
47. Costs for the auditor The expenses presented in the table below refer to fees from KPMG Austria GmbH Wirtschaftsprüfungs- und Steuer-
beratungsgesellschaft.
€ 1,000 2016 2015
Auditing costs 384 433
Other review services 154 155
Other consultancy services 33 118
Total 570 706
Given the issuance of two corporate bonds in 2016 (one in 2015) additional € 203 K (2015: € 90 K) for other review services were paid to the auditor in 2016.
In the consolidated income statement, the audit expenses, including review amount to € 1,182 K (2015: € 1,356 K). Out of this, the amount for KPMG entities amounts to € 1,142 K (31.12.2015: € 1,335 K).

CONSOLIDATED FINANCIAL STATEMENTS
CO
NS
OL
IDA
TE
D F
INA
NC
IAL
STA
TE
ME
NT
S
173
48. Events after the close of the business year In January 2017, CA Immo AG has successfully completed negotiations with Union Investment Real Estate GmbH on
acquiring 49 % of shares each in the office buildings Danube House in Prague and Infopark in Budapest, both so far part of the open-ended property fund UniImmo: Europe. With this acquisition, CA Immo increases its share in the buildings from previously 51 % to 100 %.
In February 2017, CA Immo AG issued a corporate bond with a total volume of € 175 m and a term of seven years. The coupon rate of the fixed interest bond is 1.875 %.
CA Immo Group has received a construction permit from the City of Munich for the NEO office, hotel and residential complex, with 21,000 m² of gross floor space in the Baumkirchen Mitte quarter. CA Immo Group has also acquired the 50% stake in the development project previously held by PATRIZIA, and is now the sole owner. CA Immo Group's total investment in the building complex is € 86 m.
Until the publication of this report in March 2017, another 34,727 treasury shares have been repurchased from the share buyback programme resolved in November 2016.
These consolidated financial statements were prepared by the Management Board on the date below. The individual and consolidated financial statements for CA Immobilien Anlagen Aktiengesellschaft will be presented to the Supervi-sory Board on 21.3.2017 for approval.
Vienna, 20.03.2017
The Management Board
Frank Nickel (Chief Executive Officer)
Dr. Hans Volckens (Member of the Management Board)

CONSOLIDATED FINANCIAL STATEMENTS
174
The following companies are included in the consolidated financial statements in addition to CA Immobilien Anlagen Aktiengesellschaft:
Company Registered
office
Nominal
capital
Currency Interest
in %
Consolidation
method 1)
Foundation /
First time
consolidation
in 2016 2)
CA Immo Holding B.V. Amsterdam 51,200,000 EUR 100 FC
Europolis Holding B.V. Amsterdam 2 EUR 100 FC
CA Immo d.o.o. Belgrade 32,523,047 RSD 100 FC
CA Immo Sava City d.o.o. Belgrade 4,298,470,439 RSD 100 FC
TM Immo d.o.o. Belgrade 1,307,825,923 RSD 100 FC
BA Business Center a.s. Bratislava 7,503,200 EUR 100 FC
Europolis D61 Logistics s.r.o. Bratislava 1,590,000 EUR 100 FC
CA Holding Szolgáltató Kft Budapest 13,000,000 HUF 100 FC
CA Immo Real Estate Management Hungary K.f.t. Budapest 54,510,000 HUF 100 FC
Canada Square Kft. Budapest 12,510,000 HUF 100 FC
COM PARK Ingatlanberuházási Kft Budapest 3,030,000 HUF 100 FC
Duna Business Hotel Ingatlanfejlesztö Kft. Budapest 1,370,097 EUR 100 FC A
Duna Irodaház Kft. Budapest 838,082 EUR 100 FC A
Duna Termál Hotel Kft. Budapest 1,182,702 EUR 100 FC A
EUROPOLIS ABP Ingatlanberuházási Kft Budapest 21,410,000 HUF 51³ AEJV
EUROPOLIS City Gate Ingatlanberuházási Kft Budapest 13,000,000 HUF 100 FC
Europolis Infopark Ingatlanüzemeltető Kft Budapest 4,140,000 HUF 51³ AEJV
EUROPOLIS IPW Ingatlanberuházási Kft Budapest 54,370,000 HUF 100 FC
Europolis Park Airport Kft. Budapest 19,900,000 HUF 100 FC
Europolis Tárnok Ingatlanberuházási Kft Budapest 5,400,000 HUF 100 FC
Kapas Center Kft. Budapest 772,560,000 HUF 100 FC
Kilb Kft. Budapest 30,000,000 HUF 100 FC
Millennium Irodaház Kft. Budapest 3,017,097 EUR 100 FC A
R 70 Invest Budapest Kft. Budapest 5,270,000 HUF 100 FC
Skogs Buda Business Center II. Kft. Budapest 327,010,000 HUF 100 FC
Váci 76 Kft. Budapest 3,100,000 HUF 100 FC
CA Immo Real Estate Management Romania S.R.L. Bucharest 989,570 RON 100 FC
EUROPOLIS ORHIDEEA B.C. S.R.L. Bucharest 91,394,530 RON 100 FC
EUROPOLIS SEMA PARK S.R.L. Bucharest 107,680,000 RON 100 FC
INTERMED CONSULTING & MANAGEMENT S.R.L. Bucharest 330 RON 100 FC
Opera Center One S.R.L. Bucharest 27,326,150 RON 100 FC
Opera Center Two S.R.L. Bucharest 7,310,400 RON 100 FC
S.C. BBP Leasing S.R.L. Bucharest 14,637,711 RON 100 FC
TC Investments Arad S.R.L. Bucharest 18,421,830 RON 100 FC
VICTORIA INTERNATIONAL PROPERTY S.R.L. Bucharest 216 RON 100 FC 1) FC full consolidation, AEJV at equity consolidation joint ventures, AEA at equity consolidation associated companies 2) F foundation, A acquisition 3) Common control
ANNEX I TO THE CONSOLIDATED FINANCIAL STATEMENTS

CONSOLIDATED FINANCIAL STATEMENTS
CO
NS
OL
IDA
TE
D F
INA
NC
IAL
STA
TE
ME
NT
S
175
Company Registered
office
Nominal
capital
Currency Interest
in %
Consolidation
method 1)
Foundation /
First time
consolidation
in 2016 2)
Blitz F07-neunhundert-sechzig-acht GmbH Frankfurt 25,000 EUR 100 FC
Blitz F07-neunhundert-sechzig-neun GmbH Frankfurt 25,000 EUR 100 FC
CA Immo Deutschland GmbH Frankfurt 5,000,000 EUR 99.7 FC
CA Immo Elf GmbH Frankfurt 25,000 EUR 100 FC
CA Immo Fünfzehn Beteiligungs GmbH Frankfurt 25,000 EUR 100 FC
CA Immo Fünfzehn GmbH & Co. KG Frankfurt 25,000 EUR 100 FC
CA Immo GB Eins GmbH & Co. KG Frankfurt 25,000 EUR 94.9 FC
CA Immo GB Eins Verwaltungs GmbH Frankfurt 25,000 EUR 100 FC
CA Immo Invest GmbH Frankfurt 50,000 EUR 100 FC
CA Immo Null Verwaltungs GmbH Frankfurt 25,000 EUR 100 FC
CA Immo Sechzehn Beteiligungs GmbH Frankfurt 25,000 EUR 100 FC
CA Immo Sechzehn GmbH & Co. KG Frankfurt 25,000 EUR 100 FC
CA Immo Spreebogen Betriebs GmbH Frankfurt 25,000 EUR 100 FC
CA Immo Zehn GmbH Frankfurt 25,000 EUR 100 FC
CA Immo Zwölf Verwaltungs GmbH Frankfurt 25,000 EUR 100 FC
CM Komplementär F07– 888 GmbH & Co. KG Frankfurt 25,000 EUR 94.9 FC
DRG Deutsche Realitäten GmbH Frankfurt 500,000 EUR 49³ AEJV
Pannonia Shopping Center Kft. Györ 3,020,000 HUF 100 FC
CAINE B.V. Hoofddorp 18,151 EUR 100 FC
TzoV "Europolis Logistics Park II" Kiev 124,857,889 UAH 100 FC
TzoV "Europolis Property Holding" Kiev 207,021,770 UAH 100 FC
TzoV"Corma Development" Kiev 209,286,179 UAH 100 FC
CA Immobilien Anlagen d.o.o. Ljubljana 50,075 EUR 100 FC
ALBERIQUE LIMITED Limassol 1,100 EUR 100 FC
BEDELLAN PROPERTIES LIMITED Limassol 12,534 EUR 100 FC
EPC KAPPA LIMITED Limassol 12,097 EUR 100 FC
EPC LAMBDA LIMITED Limassol 458,280 EUR 100 FC
EPC LEDUM LIMITED Limassol 14,053 EUR 100 FC
EPC OMIKRON LIMITED Limassol 57,114 EUR 100 FC 1) FC full consolidation, AEJV at equity consolidaton joint ventures, AEA at equity consolidaton associates companies 2) F foundation, A acquisition 3) Common control
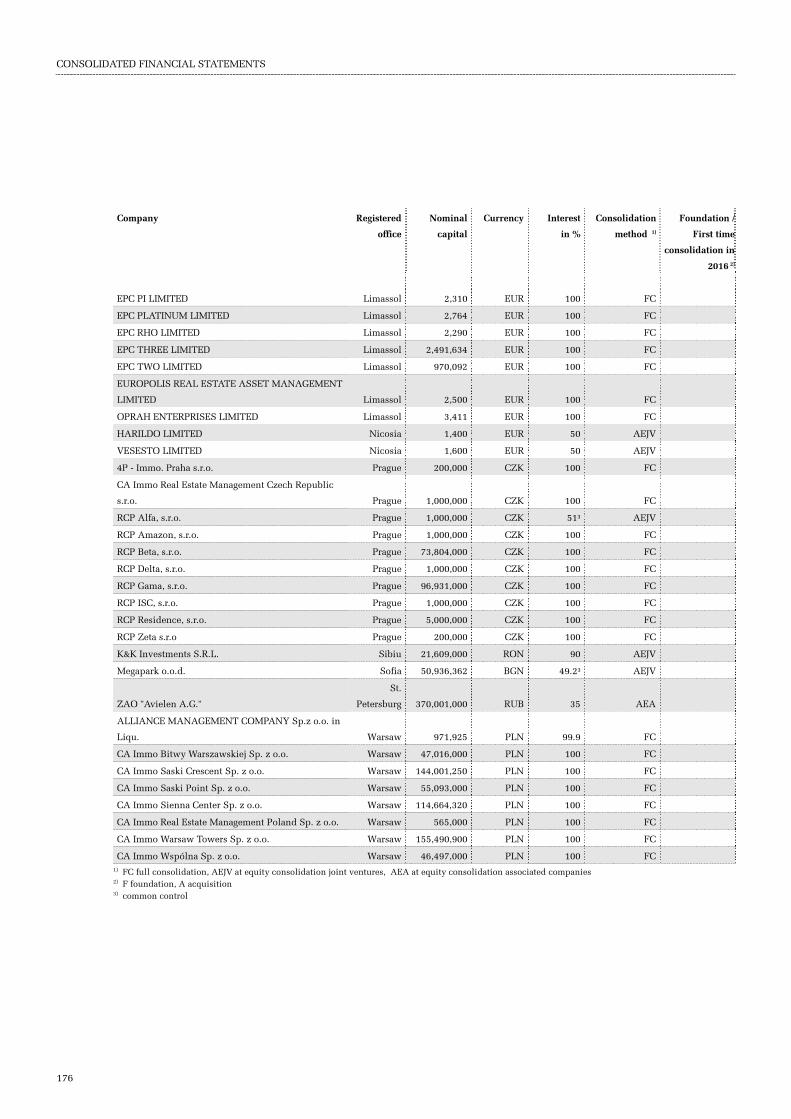
CONSOLIDATED FINANCIAL STATEMENTS
176
Company Registered
office
Nominal
capital
Currency Interest
in %
Consolidation
method 1)
Foundation /
First time
consolidation in
2016 2)
EPC PI LIMITED Limassol 2,310 EUR 100 FC
EPC PLATINUM LIMITED Limassol 2,764 EUR 100 FC
EPC RHO LIMITED Limassol 2,290 EUR 100 FC
EPC THREE LIMITED Limassol 2,491,634 EUR 100 FC
EPC TWO LIMITED Limassol 970,092 EUR 100 FC
EUROPOLIS REAL ESTATE ASSET MANAGEMENT
LIMITED Limassol 2,500 EUR 100 FC
OPRAH ENTERPRISES LIMITED Limassol 3,411 EUR 100 FC
HARILDO LIMITED Nicosia 1,400 EUR 50 AEJV
VESESTO LIMITED Nicosia 1,600 EUR 50 AEJV
4P - Immo. Praha s.r.o. Prague 200,000 CZK 100 FC
CA Immo Real Estate Management Czech Republic
s.r.o. Prague 1,000,000 CZK 100 FC
RCP Alfa, s.r.o. Prague 1,000,000 CZK 51³ AEJV
RCP Amazon, s.r.o. Prague 1,000,000 CZK 100 FC
RCP Beta, s.r.o. Prague 73,804,000 CZK 100 FC
RCP Delta, s.r.o. Prague 1,000,000 CZK 100 FC
RCP Gama, s.r.o. Prague 96,931,000 CZK 100 FC
RCP ISC, s.r.o. Prague 1,000,000 CZK 100 FC
RCP Residence, s.r.o. Prague 5,000,000 CZK 100 FC
RCP Zeta s.r.o Prague 200,000 CZK 100 FC
K&K Investments S.R.L. Sibiu 21,609,000 RON 90 AEJV
Megapark o.o.d. Sofia 50,936,362 BGN 49.2³ AEJV
ZAO "Avielen A.G."
St.
Petersburg 370,001,000 RUB 35 AEA
ALLIANCE MANAGEMENT COMPANY Sp.z o.o. in
Liqu. Warsaw 971,925 PLN 99.9 FC
CA Immo Bitwy Warszawskiej Sp. z o.o. Warsaw 47,016,000 PLN 100 FC
CA Immo Saski Crescent Sp. z o.o. Warsaw 144,001,250 PLN 100 FC
CA Immo Saski Point Sp. z o.o. Warsaw 55,093,000 PLN 100 FC
CA Immo Sienna Center Sp. z o.o. Warsaw 114,664,320 PLN 100 FC
CA Immo Real Estate Management Poland Sp. z o.o. Warsaw 565,000 PLN 100 FC
CA Immo Warsaw Towers Sp. z o.o. Warsaw 155,490,900 PLN 100 FC
CA Immo Wspólna Sp. z o.o. Warsaw 46,497,000 PLN 100 FC 1) FC full consolidation, AEJV at equity consolidation joint ventures, AEA at equity consolidation associated companies 2) F foundation, A acquisition 3) common control

CONSOLIDATED FINANCIAL STATEMENTS
CO
NS
OL
IDA
TE
D F
INA
NC
IAL
STA
TE
ME
NT
S
177
Company Registered
office
Nominal
capital
Currency Interest
in %
Consolidation
method 1)
Foundation /
First time
consolidation
in 2016 2)
Camari Investments Sp.z o.o. Warsaw 10,000 PLN 50 AEJV
Camari Investments Sp.z.o.o. WFC S.K.A. Warsaw 51,000 PLN 50 AEJV
EUROPOLIS PARK BŁONIE Sp.z o.o. in Liqu. Warsaw 1,104,334 PLN 100 FC
Poleczki Business Park Sp.z.o.o. in Liqu. Warsaw 5,000 PLN 50 AEJV
SOFTWARE PARK KRAKÓW Sp.z o.o. Warsaw 50,000 PLN 50 AEJV
Avielen Beteiligungs GmbH Vienna 35,000 EUR 100 FC
Betriebsobjekte Verwertung Gesellschaft m.b.H. &
Co. Leasing OG Vienna 4,135,427 EUR 100 FC
BIL-S Superädifikatsverwaltungs GmbH Vienna 70,000 EUR 100 FC
CA Immo BIP Liegenschaftsverwaltung GmbH Vienna 3,738,127 EUR 100 FC
CA Immo Galleria Liegenschaftsverwaltung GmbH Vienna 35,000 EUR 100 FC
CA Immo Germany Holding GmbH Vienna 35,000 EUR 100 FC
CA Immo LP GmbH Vienna 146,000 EUR 100 FC
CA Immo International Holding GmbH Vienna 35,000 EUR 100 FC
CA Immo Rennweg 16 GmbH Vienna 35,000 EUR 100 FC
CA Immo-RI-Residential Property Holding GmbH Vienna 35,000 EUR 100 FC
CA Immobilien Anlagen Beteiligungs GmbH & Co
Finanzierungs KG Vienna 154,812 EUR 100 FC
EBL Nord 2 Immobilien GmbH Vienna 35,000 EUR 50 AEJV
EBL Nord 2 Immobilien Eins GmbH & Co KG Vienna 10,000 EUR 50 AEJV
EBL Nord 2 Immobilien Zwei GmbH & Co KG Vienna 10,000 EUR 50 AEJV
Erdberger Lände 26 Projekt GmbH Vienna 35,000 EUR 100 FC
EUROPOLIS CE Alpha Holding GmbH Vienna 36,336 EUR 100 FC
EUROPOLIS CE Lambda Holding GmbH Vienna 35,000 EUR 100 FC
EUROPOLIS CE Rho Holding GmbH Vienna 35,000 EUR 100 FC
EUROPOLIS GmbH Vienna 5,000,000 EUR 100 FC
omniCon Baumanagement GmbH Vienna 100,000 EUR 100 FC
PHI Finanzbeteiligungs und Investment GmbH Vienna 35,000 EUR 100 FC
Europolis Zagrebtower d.o.o. Zagreb 15,347,000 HRK 100 FC 1) FC full consolidation, AEJV at equity consolidation joint ventures, AEA at equity consolidation associated companies 2) F foundation, A acquisition 3) common control

CONSOLIDATED FINANCIAL STATEMENTS
178
As at 31.12.2016, CA Immo Group held 99,7% of shares in CA Immo Deutschand GmbH, Frankfurt am Main (or simp-ly Frankfurt). The following subsidiaries, shares in joint ventures and associated companies of CA Immo Deutschland GmbH, Frankfurt, are therefor also included in the consolidated financial statements:
Company Registered
office
Nominal
capital
Currency Interest
in %
Consolidation
method 1)
Foundation / First
time
consolidation in
2016 2)
CA Immo 13 GmbH Frankfurt 25,000 EUR 100 FC
CA Immo 14 GmbH Frankfurt 25,000 EUR 100 FC
CA Immo Berlin Bärenquellbrauerei GmbH & Co. KG Frankfurt 5,000 EUR 100 FC F
CA Immo Berlin Bärenquellbrauereri Verwaltungs GmbH Frankfurt 25,000 EUR 100 FC F
CA Immo Berlin DGSB Projekt GmbH & Co. KG Frankfurt 5,000 EUR 100 FC
CA Immo Berlin DGSB Verwaltungs GmbH Frankfurt 25,000 EUR 100 FC
CA Immo Berlin Europaplatz 01 GmbH & Co. KG Frankfurt 5,000 EUR 100 FC
CA Immo Berlin Europaplatz 01 Verwaltungs GmbH Frankfurt 25,000 EUR 100 FC
CA Immo Berlin Europaplatz 03 GmbH & Co. KG Frankfurt 5,000 EUR 100 FC
CA Immo Berlin Europaplatz 03 Verwaltungs GmbH Frankfurt 25,000 EUR 100 FC
CA Immo Berlin Hallesches Ufer GmbH Frankfurt 25,000 EUR 100 FC
CA Immo Berlin Lehrter Stadtquartier 4 GmbH & Co. KG Frankfurt 5,000 EUR 100 FC
CA Immo Berlin Lehrter Stadtquartier 7 GmbH & Co. KG Frankfurt 5,000 EUR 100 FC
CA Immo Berlin Lehrter Stadtquartier 8 GmbH & Co. KG Frankfurt 5,000 EUR 100 FC
CA Immo Berlin Lehrter Stadtquartier 9 GmbH & Co. KG Frankfurt 5,000 EUR 100 FC
CA Immo Berlin Lehrter Stadtquartier 9 Verwaltungs GmbH Frankfurt 25,000 EUR 100 FC F
CA Immo Berlin Lehrter Stadtquartier Verwaltungs GmbH Frankfurt 25,000 EUR 100 FC
CA Immo Berlin Lietzenburger Straße GmbH & Co. KG Frankfurt 5,000 EUR 100 FC
CA Immo Berlin Lietzenburger Straße Verwaltungs GmbH Frankfurt 25,000 EUR 100 FC
CA Immo Berlin Mitte 01 GmbH & Co. KG Frankfurt 5,000 EUR 100 FC
CA Immo Berlin Mitte 01 Verwaltungs GmbH Frankfurt 25,000 EUR 100 FC
CA Immo Berlin Mitte 02 GmbH & Co. KG Frankfurt 5,000 EUR 100 FC
CA Immo Berlin Mitte 02 Verwaltungs GmbH Frankfurt 25,000 EUR 100 FC
CA Immo Berlin Schöneberger Ufer Beteiligungs GmbH Frankfurt 25,000 EUR 100 FC
CA Immo Berlin Schöneberger Ufer GmbH & Co. KG Frankfurt 25,000 EUR 100 FC
CA Immo Berlin Schöneberger Ufer Verwaltungs GmbH Frankfurt 25,000 EUR 100 FC
CA Immo Düsseldorf BelsenPark MK 2.1 Projekt GmbH & Co.
KG Frankfurt 5,000 EUR 100 FC
CA Immo Düsseldorf BelsenPark MK 3 Projekt GmbH & Co. KG Frankfurt 5,000 EUR 100 FC
CA Immo Düsseldorf BelsenPark Verwaltungs GmbH Frankfurt 25,000 EUR 100 FC 1) FC full consolidation, AEJV at equity consolidation joint ventures, AEA at equity consolidation associated companies 2) F foundation, A acquisition

CONSOLIDATED FINANCIAL STATEMENTS
CO
NS
OL
IDA
TE
D F
INA
NC
IAL
STA
TE
ME
NT
S
179
Company Registered
office
Nominal
capital
Currency Interest
in %
Consolidation
method 1)
Foundation /
First time
consolidation
in 2016 2)
CA Immo Frankfurt Bauphase I GmbH & Co. KG Frankfurt 5,000 EUR 100 FC
CA Immo Frankfurt Bauphase I Verwaltungs GmbH Frankfurt 25,000 EUR 100 FC
CA Immo Frankfurt Karlsruher Straße GmbH & Co. KG Frankfurt 5,000 EUR 100 FC
CA Immo Frankfurt Karlsruher Straße Verwaltungs GmbH Frankfurt 25,000 EUR 100 FC
CA Immo Frankfurt Nord 4 GmbH & Co. KG Frankfurt 5,000 EUR 100 FC
CA Immo Frankfurt Nord 4 Verwaltungs GmbH Frankfurt 25,000 EUR 100 FC
CA Immo Frankfurt Tower 185 Beteiligungs GmbH Frankfurt 25,000 EUR 100 FC
CA Immo Köln K 1 GmbH Frankfurt 25,000 EUR 100 FC
CA Immo München MI 1-Arnulfpark Grundstücksverwertungs GmbH Frankfurt 25,000 EUR 100 FC
CA Immo München MK 6-Arnulfpark Grundstücksverwertungs GmbH Frankfurt 25,000 EUR 100 FC
omniCon Gesellschaft für innovatives Bauen mbH Frankfurt 100,000 EUR 100 FC
Stadthafenquartier Europacity Berlin GmbH & Co. KG Frankfurt 5,000 EUR 50 AEJV
Stadthafenquartier Europacity Berlin Verwaltungs GmbH Frankfurt 25,000 EUR 50 AEJV
Tower 185 Betriebs GmbH Frankfurt 25,000 EUR 27.3³ AEJV
Tower 185 Projekt GmbH & Co. KG Frankfurt 5,000 EUR 33.3³ AEJV
Tower 185 Verwaltungs GmbH Frankfurt 25,000 EUR 33.3³ AEJV
Baumkirchen MK GmbH & Co. KG Grünwald 10,000 EUR 50 AEJV
Baumkirchen MK Verwaltungs GmbH Grünwald 25,000 EUR 50 AEJV
Baumkirchen WA 1 GmbH & Co. KG Grünwald 10,000 EUR 50 AEJV
Baumkirchen WA 2 GmbH & Co. KG Grünwald 10,000 EUR 50 AEJV
Baumkirchen WA 3 GmbH & Co. KG Grünwald 10,000 EUR 50 AEJV
Baumkirchen WA 1 Verwaltungs GmbH Grünwald 25,000 EUR 50 AEJV
Baumkirchen WA 2 Verwaltungs GmbH Grünwald 25,000 EUR 50 AEJV
Baumkirchen WA 3 Verwaltungs GmbH Grünwald 25,000 EUR 50 AEJV
CA Immo Bayern Betriebs GmbH Grünwald 25,000 EUR 100 FC
CA Immo München Ambigon Nymphenburg GmbH & Co. KG Grünwald 5,000 EUR 100 FC
CA Immo München Ambigon Nymphenburg Verwaltungs GmbH Grünwald 25,000 EUR 100 FC
CA Immo München Nymphenburg GmbH & Co. KG Grünwald 5,000 EUR 100 FC
CA Immo München Nymphenburg Verwaltungs GmbH Grünwald 25,000 EUR 100 FC
CA Immo Projektentwicklung Bayern Verwaltungs GmbH Grünwald 25,565 EUR 100 FC
CA Immo Projektentwicklung Bayern GmbH & Co. KG Grünwald 255,645 EUR 100 FC
CAMG Zollhafen HI IV V GmbH & Co. KG Grünwald 5,000 EUR 50.1³ AEJV F
CAMG Zollhafen HI IV V Verwaltungs GmbH Grünwald 25,000 EUR 50.1³ AEJV F
Eggarten Projektentwicklung GmbH & Co. KG Grünwald 63,120,000 EUR 50 AEJV F/TC4
Eggarten Projektentwicklung Verwaltung GmbH Grünwald 25,000 EUR 50 AEJV F/TC4
Isargärten Bauträger GmbH & Co. KG Grünwald 15,000 EUR 33.3³ AEJV
Isargärten Bauträger Verwaltungs GmbH Grünwald 25,000 EUR 33.3³ AEJV
Kontorhaus Arnulfpark GmbH & Co. KG Grünwald 100,000 EUR 99.9 FC
Kontorhaus Arnulfpark Verwaltungs GmbH Grünwald 25,000 EUR 100 FC
SKYGARDEN Arnulfpark GmbH & Co. KG Grünwald 100,000 EUR 100 FC
SKYGARDEN Arnulfpark Verwaltungs GmbH Grünwald 25,000 EUR 50 AEJV 1) FC full consolidation, AEJV at equity consolidation joint ventures, AEA at equity consolidation associated companies 2) F foundation, A acquisition 3) common control 4)transition consolidation

CONSOLIDATED FINANCIAL STATEMENTS
180
Company Registered
office
Nominal
capital
Currency Interest
in %
Consolidation
method 1)
Foundation / First
time consolidation
in 2016 2)
Congress Centrum Skyline Plaza Beteiligung GmbH Hamburg 25,000 EUR 50 AEJV
Congress Centrum Skyline Plaza Verwaltung GmbH Hamburg 25,000 EUR 50 AEJV
CongressCentrum Skyline Plaza GmbH & Co. KG Hamburg 25,000 EUR 50 AEJV
REC Frankfurt ObjektverwaltungsgesellaftmbH i.L. Hamburg 25,000 EUR 50 AEJV
Mainzer Hafen GmbH Mainz 25,000 EUR 50 AEJV
Zollhafen Mainz GmbH & Co. KG Mainz 1,200,000 EUR 50.1³ AEJV
CA Immo Mainz Hafenspitze GmbH Mainz 25,000 EUR 100 FC
CA Immo Mainz Rheinallee III GmbH&Co KG Mainz 5,000 EUR 100 FC
CA Immo Mainz Rheinallee III Verwaltungs GmbH Mainz 25,000 EUR 100 FC
SEG Kontorhaus Arnulfpark Beteiligungsgesellschaft mbH Munich 25,000 EUR 99 FC
Skyline Plaza Generalübernehmer GmbH & Co. KG Oststeinbek 25,000 EUR 50 AEJV
Skyline Plaza Generalübernehmer Verwaltung GmbH Oststeinbek 25,000 EUR 50 AEJV
Boulevard Süd 4 Verwaltungs-GmbH Ulm 25,000 EUR 50 AEJV
Boulevard Süd 4 GmbH & Co. KG Ulm 200,000 EUR 50 AEJV 1) FC full consolidation, AEJV at equity consolidation joint ventures, AEA at equity consolidation associated companies 2) F foundation, A acquisition 3) common control

DECLARATION OF THE MANAGEMENT BOARD
181
AU
DIT
OR
S R
EP
OR
T
DECLARATION OF THE MANAGEMENT BOARD PURSUANT TO SECTION 82 (4) OF THE AUSTRIAN STOCK EXCHANGE ACT
The management board confirms to the best of their knowledge that the consolidated financial statements of CA Immobilien Anlagen Aktiengesellschaft, which were prepared in accordance with International Financial Reporting Standards (IFRS) as adopted by the EU, give a true and fair view of the consolidated financial position of CA Immo Group and its consolidated financial performance and of its consolidated cash flows and that the group management report gives a true and fair view of the business development, the financial performance, and financial position of the Group, together with a description of the principal risks and uncertainties the CA Immo Group faces.
Vienna, 20.3.2017
The Management Board
Frank Nickel (Chief Executive Officer)
Hans Volckens (Member of the Management Board)

AUDITOR’S REPORT
182
AUDITOR'S REPORT
Report on the Consolidated Financial Statements
Audit Opinion We have audited the consolidated financial statements of
CA Immobilien Anlagen Aktiengesellschaft,
Vienna,
and its subsidiaries (the Group), which comprise the consolidated statement of financial position as at 31 December 2016, and the consolidated income statement, consolidated statement of comprehensive income, consolidated state-ment of changes in equity and consolidated statement of cash flows for the year then ended, and the notes to the con-solidated financial statements, including a summary of significant accounting policies.
In our opinion, the consolidated financial statements present fairly, in all material respects, the consolidated financial position of the Group as at 31 December 2016, and its consolidated financial performance and consolidated cash flows for the year then ended in accordance with International Financial Reporting Standards (IFRSs) as adopted by the EU, and the additional requirements pursuant to Section 245a UGB (Austrian Commercial Code).
Basis for our Opinion We conducted our audit in accordance with Austrian Standards on Auditing. These standards require the audit to be
conducted in accordance with International Standards on Auditing (ISA). Our responsibilities pursuant to these rules and standards are described in the “Auditors’ Responsibility” section of our report. We are independent of the audited entity within the meaning of Austrian commercial law and professional regulations, and have fulfilled our other re-sponsibilities under those relevant ethical requirements. We believe that the audit evidence we have obtained is suffi-cient and appropriate to provide a basis for our audit opinion.
Key Audit Matters Key audit matters are those matters that, in our professional judgment, were of most significance in our audit of the
consolidated financial statements. Our audit procedures relating to these matters were designed in the context of our audit of the consolidated financial statements as a whole. Our opinion on the consolidated financial statements is not modified with respect to any of the key audit matters described below, and we do not express an opinion on these individual matters.
Valuation of investment properties Refer to note section 5d), 5u) and 22) the consolidated financial statements / management report "Property valuation".
Risk for the Financial Statements Investment property (comprising income producing properties and properties under development) with a total book
value of 3,357 million EUR is the most significant item in the consolidated statement of financial position of the Com-pany. Investment properties are presented at fair value in the consolidated financial statements. Because the valuation of investment properties cannot be based on quoted prices in active markets, the valuation of investment properties in accordance with IAS 40 involves subjective judgments and gives rise to significant uncertainties that can be difficult to corroborate. As a result, the valuation of these investment properties is significant for our audit.

AUDITOR’S REPORT
183
AU
DIT
OR
S R
EP
OR
T
Our Response The Management Board annually engages external appraisers to support its determination of the fair value of invest-
ment properties. KPMG real estate and valuation specialists assisted us in evaluating objectivity, independence and expertise of the external appraisers, and challenging management and the external appraisers about the appropriateness of the (movements in) fair value and significant estimates used, including among other property yields, future market rent, void rates and periods as well as rent free periods. In addition we evaluated the Company’s controls over data used in the valuation of the investment property portfolio.
We selected a sample of appraisal reports focusing on the most valuable properties in the portfolio and considering other quantitative and qualitative criteria, such as asset class or geographic location or properties where the year on year fair value movement was not in line with our expectation. For the selected appraisal reports we performed the following:
We confirmed that the valuation approach for each was in accordance with the Global Valuation Standards issued by the Royal Institution of Chartered Surveyors (RICS) and suitable for use in determining the carrying value in the con-solidated statement of financial position.
We agreed the property information in the appraisal reports by tracing a sample of inputs, including among others, current rental income and rent free periods, to the underlying property records held by the Group. We also tested the data inputs underpinning the valuation for a sample of properties by agreeing them back to supporting documenta-tion.
Among others, we compared the yields used by the appraisers to an estimated range of expected yields, determined via reference to published benchmarks. We also considered the reasonableness of other assumptions that are not so readily comparable to published benchmarks, such as estimated current and future market rent, void rates and peri-ods as well as rent free periods. Where assumptions were outside the expected range or otherwise deemed unusual, and/or valuations appeared to experience unexpected movements, we undertook further investigations with manage-ment and the external appraisers.
We met with asset managers to gain a deeper understanding of the status of individual properties regarding changes in tenant structure, significant changes in fair value, or management’s general market assessment. We also challenged management on the movements in the valuations.
We also assessed the appropriateness of the disclosures relating to the estimation uncertainty and sensitivity of the valuations, as we consider these assumptions to be important to users of the consolidated financial statements.
Income tax Refer to note section 5n), 20, 27, 31 and 38 the consolidated financial statements / management report "Results".
Risk for the Financial Statements The Company has a complex legal structure and operates in various tax jurisdictions. Dependent on meeting certain
requirements, property sales transactions often can be structured, such that no income tax becomes due upon the sale of real estate property.
In addition, the structuring of property purchase and sales transactions, inherent in the real estate holding and in-vestment industry, require significant judgments amongst others relating to the recognition and classification of income tax related balances in connection with property sales transactions, which have a significant influence on the IFRS financial statements.
AUDITOR’S REPORT
184
Therefore, the calculation of and accounting for current and deferred income tax expense/benefit and the presentation in the consolidated financial statements is a complex process that involves the application and interpretation of com-plex tax and accounting rules, subjective judgments, significant uncertainties, and requires specific knowledge and competencies.
Our Response We assessed the accounting policies applied by the Company against IFRS and the recognition, measurement and
classification criteria per the Company’s accounting policies as described in the notes. We specifically challenged man-agement’s judgments in relation to the recognition or non-recognition of deferred tax assets and liabilities and the clas-sification of income tax related balances in connection with property sales transactions.
We also evaluated the assumptions used by the Company to determine the recoverability of deferred tax assets recog-nized in the consolidated statement of financial position.
In respect of material components, we obtained letters from the Company's external tax advisors, relating to the con-firmation of the tax position of the Company. We assessed these letters as part of our audit and compared these infor-mation with thy Company’s calculations.
KPMG tax specialists in relevant jurisdictions assisted us in assessing tax risks and evaluating the appropriateness of the income tax calculations and the assessment of uncertain tax positions.
Management's Responsibility and Responsibility of the Audit Committee for the Consolidated Financial Statements The Company’s management is responsible for the preparation and fair presentation of these consolidated financial
statements in accordance with International Financial Reporting Standards (IFRSs) as adopted by the EU, and the addi-tional requirements pursuant to Section 245a UGB (Austrian Commercial Code) and for such internal control as man-agement determines is necessary to enable the preparation of consolidated financial statements that are free from mate-rial misstatement, whether due to fraud or error.
Management is also responsible for assessing the Group’s ability to continue as a going concern, and, where appropri-ate, to disclose matters that are relevant to the Group’s ability to continue as a going concern and to apply the going concern assumption in its financial reporting, except in circumstances in which liquidation of the Group or closure of operations is planned or cases in which such measures appear unavoidable.
The audit committee is responsible for overseeing the Group’s financial reporting process.
Auditors’ Responsibility Our aim is to obtain reasonable assurance about whether the consolidated financial statements as a whole are free of
material misstatements, whether due to fraud or error, and to issue an audit report that includes our opinion. Reasona-ble assurance represents a high degree of assurance, but provides no guarantee that an audit conducted in accordance with Austrian Standards on Auditing, which require the audit to be performed in accordance with ISA, will always detect a material misstatement when it exists. Misstatements may result from fraud or error and are considered material if they could, individually or in the aggregate, reasonably be expected to influence the economic decisions of users taken on the basis of these consolidated financial statements.
As part of an audit in accordance with Austrian Standards on Auditing, which require the audit to be performed in accordance with ISA, we exercise professional judgment and retain professional skepticism throughout the audit.

AUDITOR’S REPORT
185
AU
DIT
OR
S R
EP
OR
T
Moreover:
We identify and assess the risks of material misstatement of the consolidated financial statements, whether due to fraud or error, we plan and perform procedures to address such risks and obtain sufficient and appropriate audit evi-dence to serve as a basis for our audit opinion. The risk that material misstatements due to fraud remain undetected is higher than that of material misstatements due to error, since fraud may include collusion, forgery, intentional omis-sions, misleading representation or override of internal control.
We obtain an understanding of internal control relevant to the audit in order to design audit procedures that are ap-propriate in the circumstances, but not for the purpose of expressing an opinion on the effectiveness of the entity's internal control.
We evaluate the appropriateness of accounting policies used and the reasonableness of accounting estimates as well as related disclosures made by management.
We conclude on the appropriateness of management’s use of the going concern assumption and, based on the audit evidence obtained, whether a material uncertainty exists related to events or conditions that may cast significant doubt on the entity’s ability to continue as a going concern. In case we conclude that there is a material uncertainty about the entity’s ability to continue as a going concern, we are required to draw attention to the respective note in the financial statements in our audit report or, in case such disclosures are not appropriate, to modify our audit opinion. We conclude based on the audit evidence obtained until the date of our audit report. Future events or conditions however may result in the Company departing from the going concern assumption.
We evaluate the overall presentation, structure and content of the consolidated financial statements, including the disclosures, and whether the consolidated financial statements represent the underlying transactions and events in a manner that achieves fair presentation.
We obtain sufficient appropriate audit evidence regarding the financial information of the entities and business activi-ties within the Group to express an opinion on the consolidated financial statements. We are responsible for the direc-tion, supervision and performance of the group audit. We remain solely responsible for our audit opinion.
We communicate with the audit committee regarding, among other matters, the planned scope and timing of our audit as well as significant findings including any significant deficiencies in internal control that we identify in the course of our audit.
We report to the audit committee that we have complied with the relevant professional requirements in respect of our independence and that we will report any relationships and other events that could reasonably affect our independ-ence and, where appropriate, related measures taken to ensure our independence.
From the matters communicated with the audit committee we determine those matters that required significant audi-tor attention in performing the audit and which are therefore key audit matters. We describe these key audit matters in our audit report except in the circumstances where laws or other legal regulations forbid publication of such matter or in very rare cases, we determine that a matter should not be included in our audit report because the negative effects of such communication are reasonably expected to outweigh its benefits for the public interest.

AUDITOR’S REPORT
186
REPORT ON OTHER LEGAL REQUIREMENTS
Group Management Report In accordance with the Austrian Commercial Code the group management report is to be audited as to whether it is
consistent with the consolidated financial statements and as to whether it has been prepared in accordance with legal requirements.
The legal representatives of the Company are responsible for the preparation of the group management report in ac-cordance with the Austrian Commercial Code.
We have conducted our audit in accordance with generally accepted standards on the audit of group management re-ports as applied in Austria.
Opinion In our opinion, the group management report has been prepared in accordance with legal requirements and is con-
sistent with the consolidated financial statements. The disclosures pursuant to Section 243a UGB (Austrian Commer-cial Code) are appropriate.
Statement Based on our knowledge gained in the course of the audit of the consolidated financial statements and the under-
standing of the Group and its environment, we did not note any material misstatements in the group management re-port.
Other Information The legal representatives of the Company are responsible for other information. Other information comprises all in-
formation provided in the annual report, with the exception of the single and consolidated financial statements, the group management report, and the auditor’s report on the consolidated financial statements.
Our opinion on the consolidated financial statements does not cover other information, and we will not provide any assurance on it.
In conjunction with our audit, it is our responsibility to read this other information and to assess whether it contains any material inconsistencies with the consolidated financial statements and our knowledge gained during our audit, or any apparent material misstatement of fact. If on the basis of our work performed, we conclude that there is a material misstatement of fact in the other information, we must report that fact. We have nothing to report with this regard.

AUDITOR’S REPORT
187
AU
DIT
OR
S R
EP
OR
T
Auditor in Charge The auditor in charge is Mag. Walter Reiffenstuhl.
Vienna, 20 March 2017
KPMG Austria GmbH Wirtschaftsprüfungs- und Steuerberatungsgesellschaft
signed by:
Mag. Walter Reiffenstuhl
Wirtschaftsprüfer
(Austrian Chartered Accountant)
This report is a translation of the original report in German, which is solely valid. The consolidated financial statements together with our auditor's opinion may only be published if the consolidated
financial statements and the group management report are identical with the audited version attached to this report. Section 281 Paragraph 2 UGB (Austrian Commercial Code) applies.
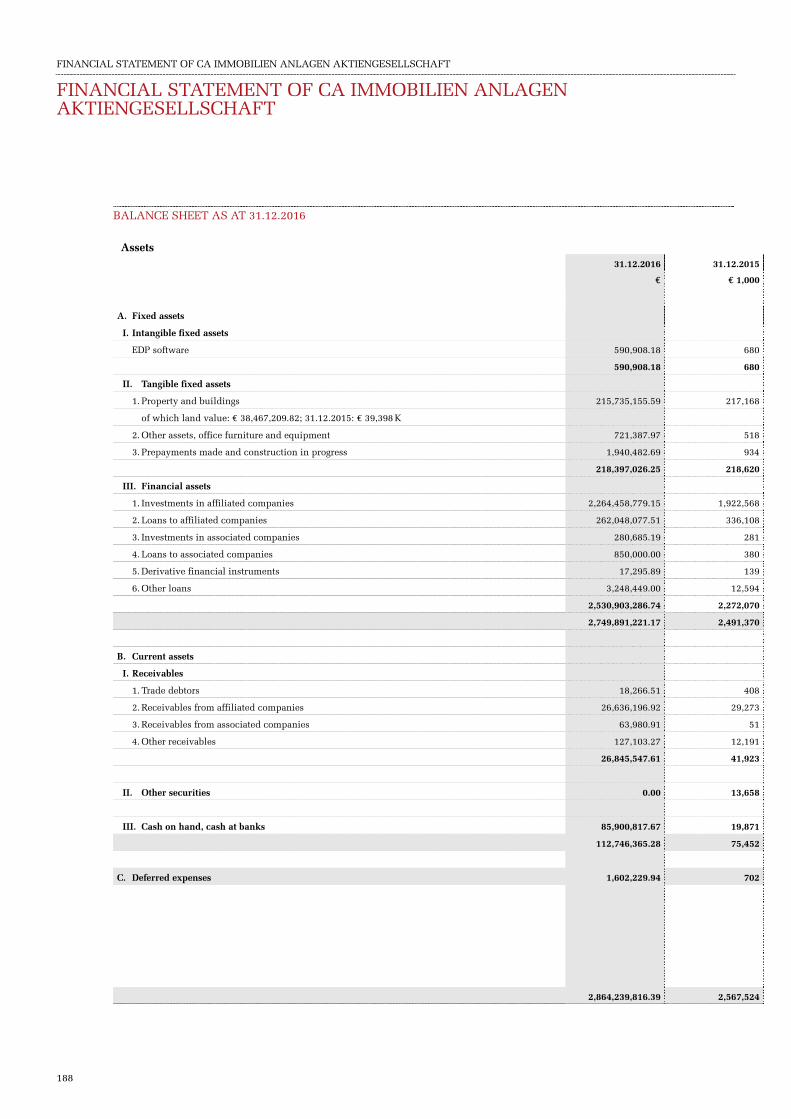
FINANCIAL STATEMENT OF CA IMMOBILIEN ANLAGEN AKTIENGESELLSCHAFT
188
BALANCE SHEET AS AT 31.12.2016
Assets 31.12.2016 31.12.2015
€ € 1,000
A. Fixed assets
I. Intangible fixed assets
EDP software 590,908.18 680
590,908.18 680
II. Tangible fixed assets
1. Property and buildings 215,735,155.59 217,168
of which land value: € 38,467,209.82; 31.12.2015: € 39,398 K
2. Other assets, office furniture and equipment 721,387.97 518
3. Prepayments made and construction in progress 1,940,482.69 934
218,397,026.25 218,620
III. Financial assets
1. Investments in affiliated companies 2,264,458,779.15 1,922,568
2. Loans to affiliated companies 262,048,077.51 336,108
3. Investments in associated companies 280,685.19 281
4. Loans to associated companies 850,000.00 380
5. Derivative financial instruments 17,295.89 139
6. Other loans 3,248,449.00 12,594
2,530,903,286.74 2,272,070
2,749,891,221.17 2,491,370
B. Current assets
I. Receivables
1. Trade debtors 18,266.51 408
2. Receivables from affiliated companies 26,636,196.92 29,273
3. Receivables from associated companies 63,980.91 51
4. Other receivables 127,103.27 12,191
26,845,547.61 41,923
II. Other securities 0.00 13,658
III. Cash on hand, cash at banks 85,900,817.67 19,871
112,746,365.28 75,452
C. Deferred expenses 1,602,229.94 702
2,864,239,816.39 2,567,524
FINANCIAL STATEMENT OF CA IMMOBILIEN ANLAGEN AKTIENGESELLSCHAFT

FINANCIAL STATEMENT OF CA IMMOBILIEN ANLAGEN AKTIENGESELLSCHAFT
189
FIN
AN
CIA
L S
TAT
EM
EN
T
Liabilities and shareholders‘ equity 31.12.2016 31.12.2015
€ € 1,000
A. Shareholders' equity
I. Demanded and paid-in share capital
Share capital drawn 718,336,602.72 718,337
Treasury shares – 39,282,129.13 – 14,540
679,054,473.59 703,797
II. Tied capital reserves 854,841,594.68 854,842
III. Tied revenue reserves for treasury shares 39,282,129.13 14,540
IV. Net profit 618,112,346.77 448,067
of which profit carried forward: € 400,163,577.46; 31.12.2015: € 191,490 K
2,191,290,544.17 2,021,246
B. Grants from public funds 326,061.61 304
C. Provisions
1. Provision for severance payment 178,997.00 274
2. Tax provisions 111,000.00 2,648
3. Provision for deferred taxes 914,441.34 0
4. Other provisions 10,837,154.53 7,775
12,041,592.87 10,697
D. Liabilities
1. Bonds 465,000,000.00 375,000
thereof with a residual term of up to one year: € 0.00; 31.12.2015: € 200,000 K
thereof with a residual term of more than one year: € 465,000,000.00; 31.12.2015: € 175,000 K
2. Liabilities to banks 90,151,380.40 113,441
thereof with a residual term of up to one year: € 44,120,704.40; 31.12.2015: € 23,099 K
thereof with a residual term of more than one year: € 46,030,676.00; 31.12.2015: € 90,342 K
3. Trade creditors 1,227,699.99 900
thereof with a residual term of up to one year: € 1,091,728.74; 31.12.2015: € 591 K
thereof with a residual term of more than one year: € 135,971.25; 31.12.2015: € 309 K
4. Payables to affiliated companies 91,143,763.35 33,309
thereof with a residual term of up to one year: € 91,143,763.35; 31.12.2015: € 33,309 K
5. Other liabilities 10,434,280.51 10,311
of which from taxes: € 203,855.76; 31.12.2015: € 1,347 K
of which connected to social security: € 119,144.25; 31.12.2015: € 109 K
thereof with a residual term of up to one year: € 10,434,280.51; 31.12.2015: € 10,311 K
657,957,124.25 532,961
thereof with a residual term of up to one year: € 146,790,477.00; 31.12.2015: € 267,310 K
thereof with a residual term of more than one year: € 511,166,647.25; 31.12.2015: € 265,651 K
E. Deferred income 2,624,493.49 2,316
2,864,239,816.39 2,567,524

FINANCIAL STATEMENT OF CA IMMOBILIEN ANLAGEN AKTIENGESELLSCHAFT
190
INCOME STATEMENT FOR THE YEAR ENDED 31.12.2016
2016 2015
€ €
€ 1,000 € 1,000
1. Gross revenues 31,087,652.11 26,598
2. Other operating income
a) Income from the sale and reversal of impairment losses of fixed assets except
of financial assets 31,482,222.04 35,629
b) Income from the reversal of provisions 150,449.57 93
c) Other income 2,993,086.17 34,625,757.78 547 36,269
3. Staff expense
a) Wages 0.00 – 13
b) Salaries – 7,822,566.20 – 6,468
c) Social expenses – 4,454,099.94 – 12,276,666.14 – 4,316 – 10,797
thereof expenses in connection with pensions: € 266,749.36; 2015: € 190 K
thereof expenses for severance payments and payments into staff welfare funds:
€ 2,454,470.88 €; 2015: € 2,446 K
thereof payments relating to statutory social security contributions as well as
payments dependent on remuneration and compulsory contributions:
€ 1,633,879.30; 2015: € 1,585 K
4. Depreciation on intangible fixed assets and tangible fixed assets – 7,071,750.82 – 7,508
5. Other operating expenses
a) Taxes – 410,909.05 – 580
b) Other expenses – 20,553,183.72 – 20,964,092.77 – 15,479 – 16,059
6. Subtotal from lines 1 to 5 (Operating result) 25,400,900.16 28,503
7. Income from investments 87,772,396.85 57,312
of which from affiliated companies: € 87,637,156.85; 2015: € 57,165 K
8. Income from loans from financial assets 14,548,062.73 13,617
of which from affiliated companies: € 13,765,126.21; 2015: € 10,618 K
9. Other interest and similar income 597,765.92 23,861
of which from affiliated companies: € 0.00; 2015: € 23,119 K
10. Income from the disposal and revaluation of financial assets 166,975,394.23 219,997
11. Expenses for financial assets and interest receivables in current
assets, thereof – 6,595,141.65 – 17,602
a) Impairment: € 3,897,765.31; 2015: € 15,310 K
b) Bad debt allowance of interest receivables 2,681,664.15 €; 2015: € 1,992 K
c) Expenses from affiliated companies: € 2,341,575.29;
2015: € 15,474 K
12. Interest and similar expenses – 20,550,884.14 – 41,808
of which relating to affiliated companies: € 521,779.60; 2015: € 887 K
13. Subtotal from lines 7 to 12 (financial result) 242,747,593.94 255,377
14. Result before taxes 268,148,494.10 283,880
15. Taxes on income 5,379,243.59 5,004
thereof deferred taxes: € – 35,763.89; 2015: € 0 K
16. Net profit for the year 273,527,737.69 288,884
17. Allocation to treasury share reserve – 55,578,968.38 – 32,306
18. Profit carried forward from the previous year 400,163,577.46 191,490
19. Net profit 618,112,346.77 448,068
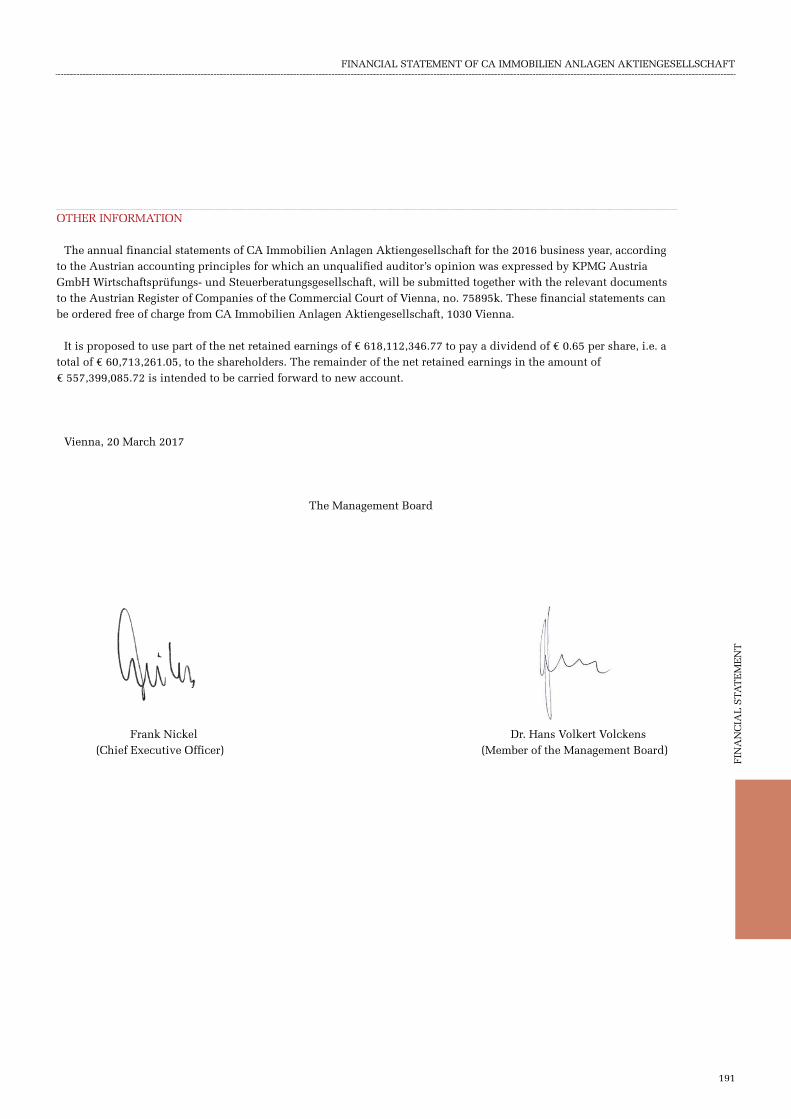
FINANCIAL STATEMENT OF CA IMMOBILIEN ANLAGEN AKTIENGESELLSCHAFT
FIN
AN
CIA
L S
TAT
EM
EN
T
191
OTHER INFORMATION
The annual financial statements of CA Immobilien Anlagen Aktiengesellschaft for the 2016 business year, according to the Austrian accounting principles for which an unqualified auditor’s opinion was expressed by KPMG Austria GmbH Wirtschaftsprüfungs- und Steuerberatungsgesellschaft, will be submitted together with the relevant documents to the Austrian Register of Companies of the Commercial Court of Vienna, no. 75895k. These financial statements can be ordered free of charge from CA Immobilien Anlagen Aktiengesellschaft, 1030 Vienna.
It is proposed to use part of the net retained earnings of € 618,112,346.77 to pay a dividend of € 0.65 per share, i.e. a total of € 60,713,261.05, to the shareholders. The remainder of the net retained earnings in the amount of € 557,399,085.72 is intended to be carried forward to new account.
Vienna, 20 March 2017
The Management Board
Frank Nickel (Chief Executive Officer)
Dr. Hans Volkert Volckens (Member of the Management Board)

TABLES AND ANALYSES
192
I. CA IMMO SHARE
1. REVIEW OF SHARE RATIO 1)
2016 2015 2014 2013 restated 2012
Key figures per share
Rental income / share 1.74 1.58 1.56 2.22 3.20
EBITDA/share 1.55 1.52 1.60 2.46 2.82
Operating cash flow / share 1.32 1.16 1.07 1.60 2.22
Earnings per share 1.94 2.25 0.76 0.86 0.64
EV/Share (31.12.) 30.98 29.48 26.24 25.17 45.38
EPRA NNNAV/share 24.56 22.69 20.36 21.24 19.88
Price (31.12.) / NNNAV per share – 1 % -28.90 -25.82 -23.86 -39.37 -47.33
Multiples
P/E ratio (KGV) 9.0 7.5 20.3 14.9 16.5
Ø EV/EBITDA 18.5 19.2 15.9 9.3 15.4
Valuation in €m
market capitalisation (As of key date 31
December) 1,725.7 1,662.9 1,531.5 1,131.6 919.9
market capitalisation (annual average) 1,620.3 1,660.0 1,338.4 933.9 740.9
Equity (inc. minorities) 2,204.5 2,120.5 1,951.7 1,794.3 1,815.7
Ø Enterprise Value (EV) 2,788.0 2,851.4 2,399.7 2,013.7 3,808.1
Net asset value (NNNAV) 2,294.4 2,196.3 2,011.6 1,866.5 1,746.4
shares
Number of shares (key date) pcs. 98,808,336 98,808,336 98,808,336 87,856,060 87,856,060
average number of shares pcs. 98,808,336 98,808,336 92,907,093 87,856,060 87,856,060
average price/share € 16.40 16.80 14.41 10.63 8.43
Highest price € 19.50 18.59 16.40 12.95 10.75
Lowest price € 14.35 14.82 11.80 8.63 7.06
Dividend paid in the business year / per share € 0.50 0.45 0.40 0.38 0.38
Dividend yield % 2.86 2.67 2.58 2.95 3.63 1) Key figures include all fully consolidated properties, i.e. all properties wholly owned by CA Immo. The figures for the period 2013 have been adapted.
The prior period 2012 has not been adapted.
TABLES AND ANALYSES

TABLES AND ANALYSES
TAB
LE
S A
ND
AN
ALY
SE
S
193
2. DEVELOPMENT OF SHARE CAPITAL
capital increase as at
year nominal pcs. Price Share capital
1987 ATS 200,000,000 100% 200,000,000
1988 ATS 100,000,000 110% 300,000,000
1989 ATS 100,000,000 113% 400,000,000
ATS 100,000,000 125% 500,000,000
ATS 100,000,000 129% 600,000,000
ATS 200,000,000 135% 800,000,000
1990 ATS 200,000,000 138% 1,000,000,000
1991 ATS 250,000,000 140% 1,250,000,000
1996 100,000,000 165% 1,350,000,000
13,500,000 98,145,000
1999 € 10,905,000 1,500,000 14.40 €/share 109,050,000
2001 € 10,905,000 1,500,000 16.20 €/share 119,955,000
€ 11,995,500 1,650,000 16.60 €/share 131,950,500
2002 € 13,195,050 1,815,000 17.10 €/share 145,145,550
€ 14,514,555 1,996,500 17.30 €/share 159,660,105
2003 € 14,514,555 1,996,500 18.20 €/share 174,174,660
€ 18,058,680 2,484,000 18.80 €/share 192,233,340
€ 21,359,260 2,938,000 18.70 €/share 213,592,600
2004 € 21,359,260 2,938,000 19.45 €/share 234,951,860
€ 23,495,186 3,231,800 19.70 €/share 258,447,046
2005 € 23,495,186 3,231,800 20.20 €/share 281,942,232
€ 35,242,779 4,847,700 20.85 €/share 317,185,011
2006 € 105,728,337 14,543,100 21.15 €/share 422,913,348
2007 € 211,456,674 29,086,200 23.25 €/share 634,370,022
2008 € 0 0 0 634,370,022
2009 € 0 0 0 634,370,022
2010 € 4,343,534 597,460 7.27 €/share 1) 638,713,556
2011 € 0 0 0 638,713,556
2012 € 0 0 0 638,713,556
2013 € 0 0 0 638,713,556
2014 € 477,297 65,653 10.66 €/share 639,190,853
2014 € 79,145,749 10,886,623 10.35 €/share 718,336,603
2015 € 0 0 0 718,336,603
2016 € 0 0 0 718,336,603
98,808,336 1) Merger with CA Immo International

TABLES AND ANALYSES
194
II. BALANCE SHEET AND INCOME ANALYSIS (5-YEAR COMPARISON)
1. CORPORATE DATA / KEY FIGURES 1)
2016 2015 2014 2013
restated
2012
income statement
Rental income € m 165.6 154.8 145.2 194.9 280.9
EBITDA € m 147.6 148.6 149.1 216.0 247.4
Operating result (EBIT) € m 293.8 402.7 142.9 243.6 232.4
Net result before taxes (EBT) € m 237.6 316.0 84.6 103.7 74.5
Consolidated net income € m 183.9 220.8 70.8 75.8 50.0
attributable to the owners of the parent € m 183.9 220.8 70.8 75.7 55.9
Operating cash flow € m 125.4 113.2 99.6 140.7 195.3
Capital expenditure € m 291.6 92.5 184.0 368.7 242.1
Balance sheet
Book value of properties € m 3,412.6 3,203.4 2,693.7 2,707.5 5,261.1
Total assets € m 4,309.1 3,984.0 3,670.9 4,040.6 5,888.4
Shareholders' equity € m 2,204.5 2,120.5 1,951.7 1,794.3 1,815.7
Long and short term interest-bearing liabilities € m 1,565.6 1,404.0 1,229.2 1,710.9 3,379.5
Net debt € m 1,167.7 1,191.4 1,061.3 1,079.8 3,067.2
PROPERTY PORTFOLIO 2)
Total usable space (excl. parking, excl. projects) 3) sqm 1,609,242 1,655,187 2,233,988 2,379,251 2,583,633
Gross yield of investment properties (in relation to
book values) 4) % 6.1 6.3 6.6 6.6 6.5
Economic vacancy rate 4) % 7.6 9.6 9.3 11.9 13.3
Other key data
staff 31.12. 363 357 355 355 375
Gearing % 53 56 54 60 169
Equity ratio % 51 53 53 44 31
Ø Enterprise Value (EV) € m 2,788.0 2,851.4 2,399.7 2,013.7 3,808.1
Ø Enterprise value/EBITDA 18 19 16 9 15
Net asset value (NNNAV) € m 2,294.4 2,196.3 2,011.6 1,866.5 1,746.4
ROE % 8.5 10.8 3.8 4.3 3.2
Gross LTV % 45.9 43.8 45.6 63.2 64.2
Net LTV % 34.2 37.2 39.4 39.9 58.3
– Key figures include all fully consolidated properties, i.e. all properties wholly owned by CA Immo. The comparative figures for the previous year have been adapted. The prior period 2012 has not been adapted.
– Includes fully consolidated real estate (wholly owned by CA Immo) and real estate in which CA Immo holds a proportionate share (at equity). – from 2013 incl. Superaedificates and rentable open landscapes – Incl. the project developments Kontorhaus, Monnet 4 and Kennedy-Haus

TABLES AND ANALYSES
TAB
LE
S A
ND
AN
ALY
SE
S
195
2. CONSOLIDATED BALANCE SHEET 1)
2016 2015 2014 2013 restated 2012
€ m % € m % € m % € m % € m %
Properties 3,363.4 78 3,130.3 79 2,596.7 71 2,572.5 64 5,154.6 87
Long-term assets 3,659.8 85 3,457.1 87 3,209.8 87 3,156.1 78 5,341.3 91
Short-term assets 649.3 15 526.9 13 461.1 13 884.5 22 547.1 9
Total assets 4,309.1 100 3,984.0 100 3,670.9 100 4,040.6 100 5,888.4 100
Shareholders' equity 2,204.5 51 2,120.5 53 1,951.7 53 1,794.3 44 1,815.7 31
Long-term interest-bearing liabilities 1,412.6 33 858.8 21 1,026.6 28 1,102.1 27 2,454.8 42
Short-term interest-bearing liabilities 153.0 3 545.2 14 202.5 6 608.8 15 924.7 16
Other liabilities 539.0 13 459.5 12 490.1 13 535.4 13 693.2 12
Total liabilities and shareholders’
equity 4,309.1 100 3,984.0 100 3,670.9 100 4,040.6 100 5,888.4 100
3. CONSOLIDATED INCOME STATEMENT 1)
€ m 2016 2015 2014 2013 restated 2012
Rental Income/Net sales 165.6 154.8 145.2 194.9 280.9
- Austria 32.2 35.5 41.8 40.4 39.6
- Germany 48.6 48.9 43.7 107.8 100.5
- Eastern Europe 84.8 70.4 59.7 46.7 140.8
result from property sales 23.3 36.5 29.8 58.6 32.3
EBITDA 147.6 148.6 149.1 216.0 247.4
Operating result (EBIT) 293.8 402.7 142.9 243.6 232.4
Result from revaluation 138.3 213.8 -4.2 6.8 -8.4
Net income before taxes/EBT 237.6 316.0 84.6 103.7 74.5
- actual tax -10.1 -36.6 -7.5 -22.8 5.0
- deferred taxes -43.6 -58.5 -6.3 -5.1 -29.5
Taxes on income -53.7 -95.2 -13.8 -27.9 -24.5
Consolidated net income 183.9 220.8 70.8 75.8 50.0 1) The comparative figures for the previous year have been adapted. The prior period 2012 has not been adapted.
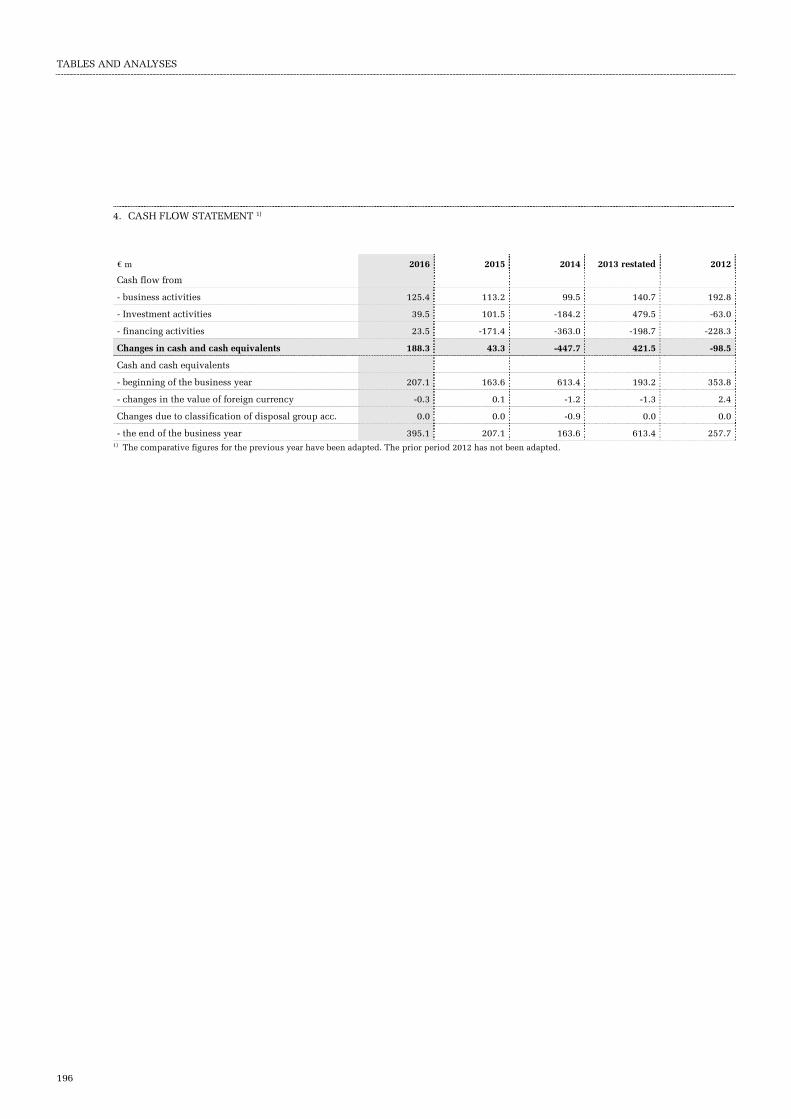
TABLES AND ANALYSES
196
4. CASH FLOW STATEMENT 1)
€ m 2016 2015 2014 2013 restated 2012
Cash flow from
- business activities 125.4 113.2 99.5 140.7 192.8
- Investment activities 39.5 101.5 -184.2 479.5 -63.0
- financing activities 23.5 -171.4 -363.0 -198.7 -228.3
Changes in cash and cash equivalents 188.3 43.3 -447.7 421.5 -98.5
Cash and cash equivalents
- beginning of the business year 207.1 163.6 613.4 193.2 353.8
- changes in the value of foreign currency -0.3 0.1 -1.2 -1.3 2.4
Changes due to classification of disposal group acc. 0.0 0.0 -0.9 0.0 0.0
- the end of the business year 395.1 207.1 163.6 613.4 257.7 1) The comparative figures for the previous year have been adapted. The prior period 2012 has not been adapted.

TABLES AND ANALYSES
TAB
LE
S A
ND
AN
ALY
SE
S
197
5. EPRA NET YIELD 1)
€ 1,000 Austria Germany Eastern Europe Total
Income producing investment properties 547,020 1,173,236 1,492,434 3,212,690
Annualised cash rental income (gross) 30,939 51,235 98,057 180,231
property operating expenses -4,378 -5,315 -9,800 -19,493
Annualised cash rental income (net) 26,561 45,920 88,258 160,739
EPRA Net Initial Yield 4.9% 3.9% 5.9% 5.0%
Lease incentives 101 2,582 -1,438 1,245
EPRA "topped-up" Net Initial Yield 4.9% 4.1% 5.8% 5.0%
1) Key figures includes fully consolidated real estate (wholly owned by CA Immo) and real estate in which CA Immo holds a proportionate share (at equity).

TABLES AND ANALYSES
198
III. GENERAL OVERVIEW OF PROPERTIES
Country City Property Share per
key date 1)
Additions
(month/year)
Plot Office-
space
Retail-
space
Hotel-
space
Industrial-
space
Income producing investment properties 2) 643.4 952.8 73.7 79.5 17.9
Investment properties Austria
1020 Vienna Handelskai 388 /DBC 100% 09/00 9.4 20.6 0.9 0.0 0.6
1020 Vienna Rembrandtstraße 21 100% 07/07 0.7 0.0 0.0 5.0 0.0
1030 Vienna Erdberger Lände, Bauteil C, F 100% 09/04 16.6 30.3 2.5 0.0 0.0
1030 Vienna Erdberger Lände, Silbermöwe 100% 09/04 4.2 17.5 0.0 0.0 0.0
1030 Vienna Erdberger Lände, Bauteil D + Tankstelle 100% 09/04 9.2 0.0 2.3 0.0 0.0
1030 Vienna Erdberger Lände, Bauteil E 100% 09/04 5.9 11.9 0.3 0.0 0.0
1030 Vienna Galleria 100% 12/05 - 05/08 0.0 11.3 14.1 0.0 0.2
1030 Vienna Rennweg 16 4) 100% 10/02 5.5 6.5 0.0 30.8 0.0
1060 Vienna Mariahilferstraße 17 100% 07/07 0.7 2.6 0.5 0.0 0.0
1120 Vienna Wolfganggasse 58-60 100% 11/00 7.3 18.3 0.0 0.0 0.4
1150 Vienna Linke Wienzeile 234/Storchengasse 1 100% 03/95 4.0 14.3 0.8 0.0 0.0
5020 Salzburg AVA Hof - Ferdinand Hanusch Platz 1 100% 01/02 3.6 3.6 2.8 0.0 0.0
5020 Salzburg Fürbergstraße 18-20 100% 12/05 0.0 0.5 2.6 3.6 0.0
Realties with properties built on third land 106.9 0.0 0.0 0.0 0.0
Properties with a fair value < 10 m € 38.4 2.8 0.8 0.0 0.0
Investment properties Austria total 212.5 140.4 27.6 39.5 1.3
Investment properties Germany
10557 Berlin Europacity, Tour Total 100% 01/08 1.7 14.1 0.0 0.0 0.0
10557 Berlin Europacity, Monnet 4 100% 01/08 2.5 7.9 0.0 0.0 0.0
10557 Berlin Europacity, InterCity Hotel 100% 01/08 3.2 0.0 0.4 20.2 0.0
10557 Berlin Europacity, John F. Kennedy Haus 100% 01/08 3.6 16.5 1.4 0.0 0.0
10557 Berlin Spreebogen 100% 10/07 6.5 29.1 0.0 0.0 0.0
10719 Berlin Joachimstaler Strasse 20 4) 100% 03/07 1.4 4.9 0.4 0.0 0.0
10963 Berlin Hallesches Ufer 100% 01/08 13.9 11.3 0.0 0.0 0.0
10963 Berlin Königliche Direktion (Schöneberger Ufer) 100% 01/08 13.1 23.3 0.0 0.0 0.0
40545 Düsseldorf BelsenPark, Belmundo 100% 01/08 2.7 7.9 1.9 0.0 0.0
40545 Düsseldorf BelsenPark, Lavista 100% 01/08 1.2 3.4 0.6 0.0 0.0
50668 Cologne Parkhaus RheinTriadem 5) 100% 01/08 3.2 0.0 0.0 0.0 0.0
50668 Cologne Johannisstraße 100% 01/08 2.2 4.7 0.0 0.0 0.6
60327 Frankfurt Europaviertel, Meiniger Hotel 100% 01/08 0.9 0.0 0.0 4.5 0.0
60327 Frankfurt Europaviertel, Tower 185 33% 01/08 5.9 32.3 0.0 0.0 0.3
80636 Munich Arnulfpark, Skygarden 100% 01/08 12.2 28.5 0.0 0.0 0.0
80636 Munich Arnulfpark, Kontorhaus 100% 01/08 7.9 25.6 0.0 0.0 0.0
80639 Munich AMBIGON, Nymphenburg 100% 01/08 6.2 10.8 3.4 0.0 0.4
81241 Munich Gleisdreieck Pasing 100% 01/08 27.6 0.0 0.0 0.0 5.0
Properties with a fair value < 10 m € 82.5 4.2 0.4 0.0 0.3
Investment properties Germany total 198.5 224.6 8.6 24.7 6.7 1) All data refer to the proportion of CA Immo; Plot size in 1,000 sqm; Values in 1,000 2) incl. own used shares 3) Calculation Yield (gross yield): Rental income annualised / fair value

TABLES AND ANALYSES
TAB
LE
S A
ND
AN
ALY
SE
S
199
Logistics
space
Others Total space Fair value as at
31.12.2016
Fair value as at
31.12.2015
Rental income
annulised
Level of commercial
rental in % 2016
Yield in %
2016 3)
25.0 193.5 1,342.4 3,219,333 2,910,586 195,466 92% 6.1%
0.0 1.0 23.1 39,900 39,500 2,371 99% 5.9%
0.0 0.0 5.0 11,400 11,400 630 100% 5.5%
0.0 6.2 39.1 52,200 52,400 3,484 93% 6.7%
0.0 0.0 17.5 59,900 59,700 3,099 100% 5.2%
0.0 0.2 2.5 13,700 13,900 783 66% 5.7%
0.0 0.7 12.8 17,200 17,200 1,101 77% 6.4%
0.0 3.6 29.4 97,200 96,400 4,894 94% 5.0%
0.0 0.5 37.8 85,609 86,787 4,538 99% 5.3%
0.0 0.4 3.5 24,600 21,100 1,130 100% 4.6%
0.0 1.8 20.5 27,400 26,300 1,942 97% 7.1%
0.0 1.5 16.7 32,500 32,800 1,983 98% 6.1%
0.0 0.3 6.7 28,100 26,800 1,258 100% 4.5%
0.0 0.3 7.0 11,800 11,700 683 88% 5.8%
0.0 106.9 106.9 37,460 40,390 2,172 100% 5.8%
0.0 1.8 5.5 12,290 11,760 635 88% 5.2%
0.0 125.3 334.1 551,259 548,137 30,703 95% 5.6%
0.0 0.1 14.2 78,500 70,000 3,754 100% 4.8%
0.0 0.2 8.2 35,700 30,000 1,507 82% 4.2%
0.0 0.0 20.6 69,000 61,000 2,644 97% 3.8%
0.0 0.2 18.1 98,000 83,000 4,091 86% 4.2%
0.0 0.6 29.8 59,201 64,400 3,875 100% 6.5%
0.0 0.2 5.6 14,844 13,013 687 95% 4.6%
0.0 0.3 11.5 22,500 19,800 1,382 99% 6.1%
0.0 1.5 24.8 49,600 44,300 2,839 99% 5.7%
0.0 0.4 10.2 41,200 36,200 2,171 92% 5.3%
0.0 0.1 4.1 18,600 14,400 1,051 94% 5.7%
0.0 0.0 0.0 16,600 13,700 1,255 99% 7.6%
0.0 0.1 5.4 19,100 18,200 936 100% 4.9%
0.0 0.0 4.5 14,400 12,800 856 100% 5.9%
0.0 1.5 34.1 195,376 181,843 10,133 90% 5.2%
0.0 4.4 32.9 190,000 173,200 8,617 100% 4.5%
0.0 4.5 30.2 150,100 122,700 6,080 87% 4.1%
0.0 0.9 15.5 64,900 56,600 3,354 97% 5.2%
0.0 18.5 23.5 12,300 17,040 881 100% 7.2%
25.0 9.4 39.3 25,720 24,150 1,810 96% 7.0%
25.0 43.0 332.6 1,175,640 1,056,346 57,924 94% 4.9% 4) The property includes own used area 5) In parking garages the area is not relevant variable, which is why a statement is not the same sense
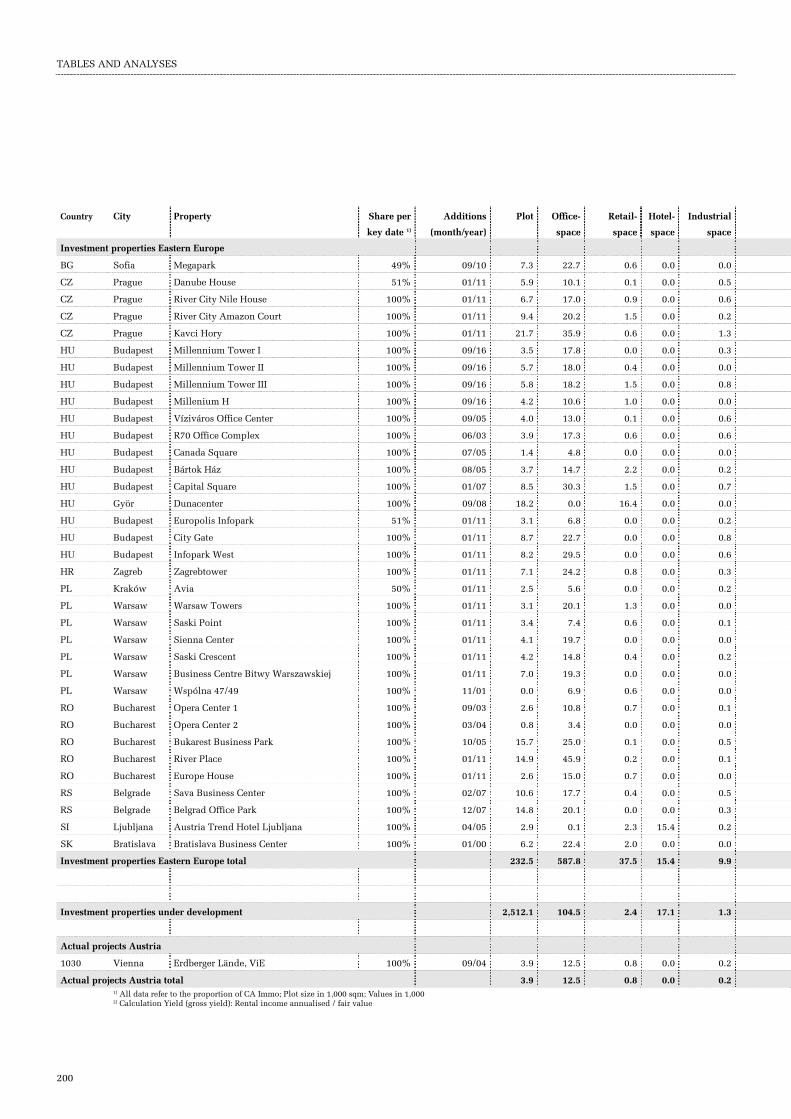
TABLES AND ANALYSES
200
Country City Property Share per
key date 1)
Additions
(month/year)
Plot Office-
space
Retail-
space
Hotel-
space
Industrial
space
Investment properties Eastern Europe
BG Sofia Megapark 49% 09/10 7.3 22.7 0.6 0.0 0.0
CZ Prague Danube House 51% 01/11 5.9 10.1 0.1 0.0 0.5
CZ Prague River City Nile House 100% 01/11 6.7 17.0 0.9 0.0 0.6
CZ Prague River City Amazon Court 100% 01/11 9.4 20.2 1.5 0.0 0.2
CZ Prague Kavci Hory 100% 01/11 21.7 35.9 0.6 0.0 1.3
HU Budapest Millennium Tower I 100% 09/16 3.5 17.8 0.0 0.0 0.3
HU Budapest Millennium Tower II 100% 09/16 5.7 18.0 0.4 0.0 0.0
HU Budapest Millennium Tower III 100% 09/16 5.8 18.2 1.5 0.0 0.8
HU Budapest Millenium H 100% 09/16 4.2 10.6 1.0 0.0 0.0
HU Budapest Víziváros Office Center 100% 09/05 4.0 13.0 0.1 0.0 0.6
HU Budapest R70 Office Complex 100% 06/03 3.9 17.3 0.6 0.0 0.6
HU Budapest Canada Square 100% 07/05 1.4 4.8 0.0 0.0 0.0
HU Budapest Bártok Ház 100% 08/05 3.7 14.7 2.2 0.0 0.2
HU Budapest Capital Square 100% 01/07 8.5 30.3 1.5 0.0 0.7
HU Györ Dunacenter 100% 09/08 18.2 0.0 16.4 0.0 0.0
HU Budapest Europolis Infopark 51% 01/11 3.1 6.8 0.0 0.0 0.2
HU Budapest City Gate 100% 01/11 8.7 22.7 0.0 0.0 0.8
HU Budapest Infopark West 100% 01/11 8.2 29.5 0.0 0.0 0.6
HR Zagreb Zagrebtower 100% 01/11 7.1 24.2 0.8 0.0 0.3
PL Kraków Avia 50% 01/11 2.5 5.6 0.0 0.0 0.2
PL Warsaw Warsaw Towers 100% 01/11 3.1 20.1 1.3 0.0 0.0
PL Warsaw Saski Point 100% 01/11 3.4 7.4 0.6 0.0 0.1
PL Warsaw Sienna Center 100% 01/11 4.1 19.7 0.0 0.0 0.0
PL Warsaw Saski Crescent 100% 01/11 4.2 14.8 0.4 0.0 0.2
PL Warsaw Business Centre Bitwy Warszawskiej 100% 01/11 7.0 19.3 0.0 0.0 0.0
PL Warsaw Wspólna 47/49 100% 11/01 0.0 6.9 0.6 0.0 0.0
RO Bucharest Opera Center 1 100% 09/03 2.6 10.8 0.7 0.0 0.1
RO Bucharest Opera Center 2 100% 03/04 0.8 3.4 0.0 0.0 0.0
RO Bucharest Bukarest Business Park 100% 10/05 15.7 25.0 0.1 0.0 0.5
RO Bucharest River Place 100% 01/11 14.9 45.9 0.2 0.0 0.1
RO Bucharest Europe House 100% 01/11 2.6 15.0 0.7 0.0 0.0
RS Belgrade Sava Business Center 100% 02/07 10.6 17.7 0.4 0.0 0.5
RS Belgrade Belgrad Office Park 100% 12/07 14.8 20.1 0.0 0.0 0.3
SI Ljubljana Austria Trend Hotel Ljubljana 100% 04/05 2.9 0.1 2.3 15.4 0.2
SK Bratislava Bratislava Business Center 100% 01/00 6.2 22.4 2.0 0.0 0.0
Investment properties Eastern Europe total 232.5 587.8 37.5 15.4 9.9
Investment properties under development 2,512.1 104.5 2.4 17.1 1.3
Actual projects Austria
1030 Vienna Erdberger Lände, ViE 100% 09/04 3.9 12.5 0.8 0.0 0.2
Actual projects Austria total 3.9 12.5 0.8 0.0 0.2 1) All data refer to the proportion of CA Immo; Plot size in 1,000 sqm; Values in 1,000 2) Calculation Yield (gross yield): Rental income annualised / fair value

TABLES AND ANALYSES
TAB
LE
S A
ND
AN
ALY
SE
S
201
Logistics-
space
Others Total space Fair value as at
31.12.2016
Fair value as at
31.12.2015
Rental income
annulised
Level of commercial
rental in % 2016
Yield in %
2016 2)
0.0 0.3 23.6 36,733 31,886 3,071 91% 8.4%
0.0 0.2 10.9 29,835 29,376 1,999 100% 6.7%
0.0 0.4 19.0 54,100 52,500 3,782 100% 7.0%
0.0 1.4 23.3 63,000 60,700 3,855 94% 6.1%
0.0 4.5 42.3 89,000 87,100 6,099 89% 6.9%
0.0 0.7 18.8 45,100 0 2,957 98% 6.6%
0.0 0.2 18.6 46,600 0 3,310 99% 7.1%
0.0 0.5 21.0 49,500 0 3,483 100% 7.0%
0.0 0.8 12.3 31,300 0 2,243 98% 7.2%
0.0 0.6 14.3 28,200 28,200 1,882 81% 6.7%
0.0 0.8 19.2 25,000 25,100 1,463 59% 5.9%
0.0 0.2 5.0 11,500 11,300 1,023 98% 8.9%
0.0 0.4 17.6 36,300 36,400 2,711 94% 7.5%
0.0 1.5 34.0 72,300 71,400 5,348 94% 7.4%
0.0 0.0 16.4 8,800 10,500 737 87% 8.4%
0.0 0.0 7.0 11,271 13,821 1,151 98% 10.2%
0.0 0.7 24.2 38,200 39,400 3,591 98% 9.4%
0.0 1.7 31.8 56,300 56,000 4,367 91% 7.8%
0.0 0.5 25.9 47,100 49,200 3,415 92% 7.2%
0.0 0.0 5.8 15,800 13,550 965 97% 6.1%
0.0 0.4 21.8 72,600 76,100 3,496 67% 4.8%
0.0 0.2 8.3 30,900 32,000 2,021 95% 6.5%
0.0 0.3 20.1 57,500 58,200 4,504 98% 7.8%
0.0 0.1 15.5 59,800 59,700 3,819 87% 6.4%
0.0 1.0 20.3 43,900 44,100 3,266 91% 7.4%
0.0 0.2 7.7 23,600 21,900 1,625 98% 6.9%
0.0 0.3 11.9 30,175 29,050 2,435 92% 8.1%
0.0 0.1 3.5 8,460 8,010 687 91% 8.1%
0.0 1.4 27.0 64,100 64,700 4,446 82% 6.9%
0.0 1.4 47.6 109,200 108,400 8,962 99% 8.2%
0.0 0.8 16.4 47,000 48,100 3,638 92% 7.7%
0.0 0.9 19.4 45,900 44,800 3,665 99% 8.0%
0.0 1.5 21.9 50,200 41,400 3,144 78% 6.3%
0.0 0.0 17.9 11,400 11,300 938 96% 8.2%
0.0 1.1 25.5 41,760 41,910 2,744 79% 6.6%
0.0 25.1 675.7 1,492,434 1,306,103 106,839 91% 7.2%
0.0 5.5 130.9 438,485 384,744
0.0 0.2 13.6 5,480 3,920
0.0 0.2 13.6 5,480 3,920

TABLES AND ANALYSES
202
Country City Property Share per
key date 1)
Additions
(month/year)
Plot Office-
space
Retail-
space
Hotel-
space
Industrial
space
Landbank Germany
10557 Berlin Europacity, Europaplatz, Baufeld Rest 100% 01/08 12.4 0.0 0.0 0.0 0.0
10557 Berlin Tiergarten, Heidestraße 100% 01/08 76.7 0.0 0.0 0.0 0.0
10557 Berlin Europacity LSQ 8 100% 01/08 1.6 0.0 0.0 0.0 0.0
10557 Berlin Hamburger Bahnhof 100% 01/08 19.3 0.0 0.0 0.0 0.0
60327 Frankfurt Europaviertel, Millenium Tower 100% 01/08 8.7 0.0 0.0 0.0 0.0
60327 Frankfurt Europaviertel, Tower 1 100% 01/08 4.8 0.0 0.0 0.0 0.0
60327 Frankfurt Parkhaus Hauptbahnhof 100% 01/08 2.9 0.0 0.0 0.0 0.0
80939 Munich AW Freimann 100% 01/08 49.0 0.0 0.0 0.0 0.0
80939 Munich Bf Freimann I 100% 01/08 27.9 0.0 0.0 0.0 0.0
40545 Düsseldorf BelsenPark Oberkassel 100% 01/08 22.3 0.0 0.0 0.0 0.0
82031 Feldkirchen Feldkirchen, ehem. Kiesgrube 100% 01/08 260.1 0.0 0.0 0.0 0.0
Properties with a fair value < 5 m € 674.8 0.0 0.0 0.0 0.0
Landbank Germany total 1,160.5 0.0 0.0 0.0 0.0
Actual projects Germany
10557 Berlin Europacity, KPMG-Gebäude 100% 01/08 3.2 11.9 0.0 0.0 0.0
10557 Berlin Europacity, Cube 100% 01/08 1.8 14.0 1.0 0.0 0.0
10557 Berlin Europacity, Rieck 1 Bauteil 2 100% 01/08 0.9 2.5 0.3 0.0 0.0
55120 Mainz Zollhafen Mainz, ZigZag 100% 01/08 3.2 4.2 0.0 0.0 0.1
60327 Frankfurt Busbahnhof 100% 01/08 2.3 0.0 0.0 0.0 0.0
60327 Frankfurt Steigenberger 100% 01/08 3.0 0.0 0.0 17.1 0.0
80639 Munich MY.O 100% 09/15 8.8 25.4 0.0 0.0 0.0
Actual projects Germany total 23.2 58.1 1.3 17.1 0.1
Landbank Eastern Europe
CZ Prague RCP Beta 100% 01/11 6.3 0.00 0.00 0.00 0.00
RO Sibiu Retail Park Sibiu 90% 12/07 170.0 0.00 0.00 0.00 0.00
Properties with a fair value < 5 m € 1,141.0 0.00 0.00 0.00 0.00
Landbank Eastern Europe total 1,317.3 0.00 0.00 0.00 0.00
Actual projects Eastern Europe
RO Bucharest Orhideea Towers 100% 01/11 7.2 34.0 0.3 0.0 1.1
Actual projects Eastern Europe 7.2 34.0 0.3 0.0 1.1
Properties held for trading 807.9 1.3 0.6 0.0 0.7
Properties held for trading Austria
1030 Vienna Erdberger Lände, Laendyard Living 1 50% 09/04 3.0 0.0 0.0 0.0 0.0
1030 Vienna Erdberger Lände, Laendyard Living 2 50% 09/04 0.8 0.0 0.0 0.0 0.0
Properties held for trading Austria total 3.8 0.0 0.0 0.0 0.0 1) All data refer to the proportion of CA Immo; Plot size in 1,000 sqm; Values in 1,000 2) Calculation Yield (gross yield): Rental income annualised / fair value
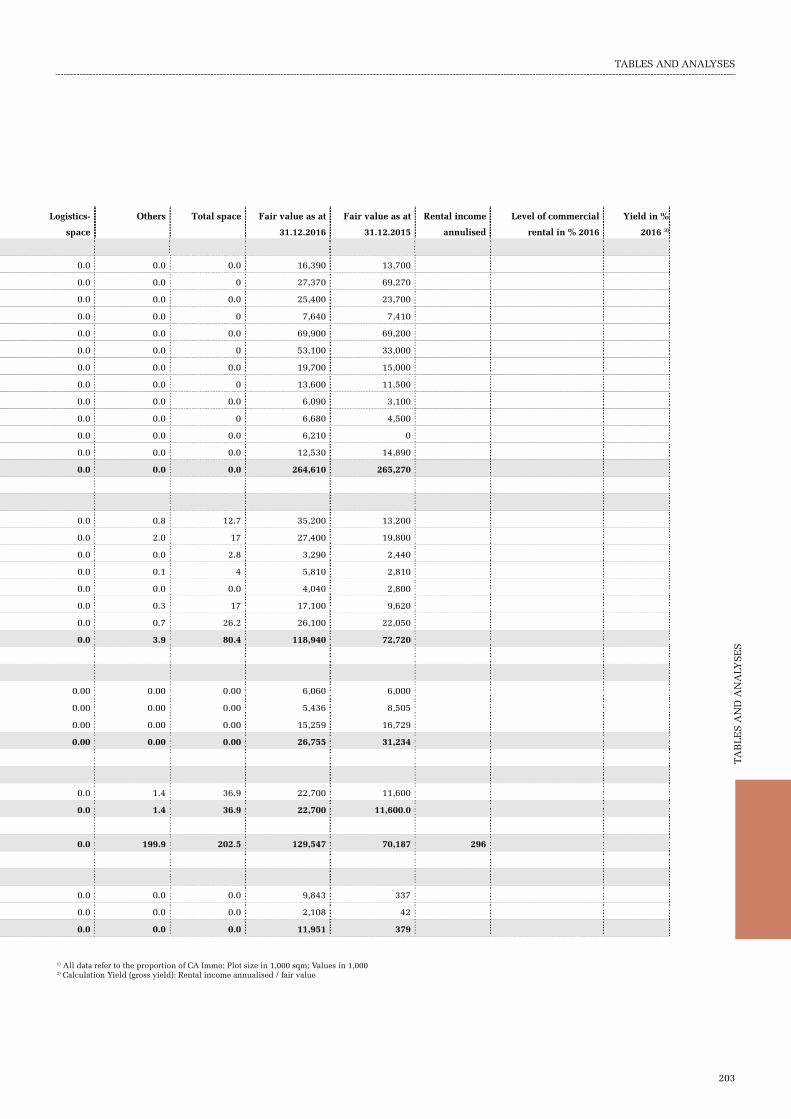
TABLES AND ANALYSES
TAB
LE
S A
ND
AN
ALY
SE
S
203
Logistics-
space
Others Total space Fair value as at
31.12.2016
Fair value as at
31.12.2015
Rental income
annulised
Level of commercial
rental in % 2016
Yield in %
2016 3)
0.0 0.0 0.0 16,390 13,700
0.0 0.0 0 27,370 69,270
0.0 0.0 0.0 25,400 23,700
0.0 0.0 0 7,640 7,410
0.0 0.0 0.0 69,900 69,200
0.0 0.0 0 53,100 33,000
0.0 0.0 0.0 19,700 15,000
0.0 0.0 0 13,600 11,500
0.0 0.0 0.0 6,090 3,100
0.0 0.0 0 6,680 4,500
0.0 0.0 0.0 6,210 0
0.0 0.0 0.0 12,530 14,890
0.0 0.0 0.0 264,610 265,270
0.0 0.8 12.7 35,200 13,200
0.0 2.0 17 27,400 19,800
0.0 0.0 2.8 3,290 2,440
0.0 0.1 4 5,810 2,810
0.0 0.0 0.0 4,040 2,800
0.0 0.3 17 17,100 9,620
0.0 0.7 26.2 26,100 22,050
0.0 3.9 80.4 118,940 72,720
0.00 0.00 0.00 6,060 6,000
0.00 0.00 0.00 5,436 8,505
0.00 0.00 0.00 15,259 16,729
0.00 0.00 0.00 26,755 31,234
0.0 1.4 36.9 22,700 11,600
0.0 1.4 36.9 22,700 11,600.0
0.0 199.9 202.5 129,547 70,187 296
0.0 0.0 0.0 9,843 337
0.0 0.0 0.0 2,108 42
0.0 0.0 0.0 11,951 379
1) All data refer to the proportion of CA Immo; Plot size in 1,000 sqm; Values in 1,000 2) Calculation Yield (gross yield): Rental income annualised / fair value

TABLES AND ANALYSES
204
Country City Property Share per
key date 1)
Additions (month/year) Plot Office-
space
Retail-
space
Hotel-
space
Industrial-
space
Properties held for trading Germany
55118 Mainz Zollhafen Mainz 50% 09/10 136.3 0.0 0.0 0.0 0.0
55120 Mainz Zollhafen Mainz, Rheinallee III 100% 01/08 8.5 0.0 0.0 0.0 0.0
81673 Munich JV Baumkirchen WA 3 50% 06/12 4.7 0.0 0.0 0.0 0.0
81673 Munich JV Baumkirchen WA 2 50% 06/12 4.2 0.0 0.0 0.0 0.0
81673 Munich JV Baumkirchen NEO 50% 06/12 2.0 0.0 0.0 0.0 0.0
80993 Munich JV Eggarten 50% 01/08 66.8 0.0 0.0 0.0 0.0
80995 Munich Ratoldstraße (Bf Feldmoching) 100% 12/12 88.5 0.0 0.0 0.0 0.0
Properties with a fair value < 5 m € 493.1 1.3 0.6 0.0 0.7
Properties intended for trading Germany 804.1 1.3 0.6 0.0 0.7
Assets held for sale 98.4 8.4 1.2 0.0 0.0
Assets held for sale Austria
1110 Vienna Simmeringer Hauptstraße 99 100% 12/05 7.5 0.2 1.2 0.0 0.0
8054 Graz Weblinger Gürtel 22 100% 04/06 15.9 0.0 0.0 0.0 0.0
8020 Graz Wetzelsdorfer Straße 34 100% 04/06 10.3 0.0 0.0 0.0 0.0
8020 Graz Alte Poststraße 234 100% 04/06 3.1 0.0 0.0 0.0 0.0
Assets held for sale Austria total 36.8 0.2 1.2 0.0 0.0
Assets held for sale Eastern and South East Europe
HU Vecsés Europolis Park Budapest Aerozone 51% 01/11 61.6 8.2 0.0 0.0 0.0
Assets held for sale Eastern and South East Europe 61.6 8.2 0.0 0.0 0.0
Properties sold in 2016 423.7 49.3 35.4 0.0 0.8
Properties sold Austria in 2016
1100 Vienna Erlachgasse 92b 100% 11/03 2.7 0.0 6.9 0.0 0.0
1030 Vienna Erdberger Lände, Bauteil B 100% 09/04 7.5 0.0 0.0 0.0 0.0
Properties with a fair value 2015 < 10 m € 50.8 2.9 0.8 0.0 0.0
Total properties sold Austria in 2016 61.0 2.9 7.6 0.0 0.0
Properties sold Germany in 2016
70174 Stuttgart BD Stuttgart 100% 01/08 13.4 13.2 0.0 0.0 0.0
10557 Berlin Stadthafenquartier Süd 50% 01/08 4.8 0.0 0.0 0.0 0.0
80993 Munich Eggartensiedlung 100% 12/12 133.6 0.0 0.0 0.0 0.0
Properties with a fair value 2015 < 10 m € 53.1 0.0 0.0 0.0 0.0
Total properties sold Germany in 2016 204.8 13.2 0.0 0.0 0.0
Properties sold Eastern Europe in 2016
CZ Prague Šestká Shopping Center 100% 01/11 43.9 0.2 26.2 0.0 0.8
CZ Warsaw Poleczki Portfolio 50% 03/07 70.4 29.2 1.5 0.0 0.0
Properties with a fair value 2015 < 10 m € 43.5 3.9 0.0 0.0 0.0
Total properties sold Eastern Europe in 2016 157.8 33.2 27.7 0.0 0.81) All data refer to the proportion of CA Immo; Plot size in 1,000 sqm; Values in 1,000 2) Calculation Yield (gross yield): Rental income annualised / fair value

TABLES AND ANALYSES
TAB
LE
S A
ND
AN
ALY
SE
S
205
Logistics-
space
Others Total space Fair value as at
31.12.2016
Fair value as at
31.12.2015Rental income
annulised
Level of commercial
rental in % 2016
Yield in %
2016 2)
0.0 0.0 0.0 15,423 7,753 0
0.0 0.0 0.0 14,555 4,300 0
0.0 0.0 0.0 8,805 6,927 0
0.0 0.0 0.0 18,834 9,575 0
0.0 0.0 0.0 8,649 6,664 0
0.0 0.0 0.0 31,526 0 0
0.0 34.6 34.6 10,460 8,563 51
0.0 165.3 167.9 9,343 26,026 245
0.0 199.9 202.5 117,595 69,808 296
24.7 30.0 64.3 32,491 34,555 2,487
0.0 2.1 3.5 8,079 6,590 253
0.0 15.9 15.9 3,435 3,250 174
0.0 9.1 9.1 2,360 2,360 127
0.0 2.8 2.8 1,190 1,190 66
0.0 30.0 31.4 15,064 13,390 620
24.7 0.0 32.9 17,427 21,165 1,867
24.7 0.0 32.9 17,427 21,165 1,867
0.0 70.3 155.8 0 255,713
0.0 0.0 6.9 0 10,900
0.0 0.0 0.0 0 12,280
0.0 40.9 44.5 0 20,715
0.0 40.9 51.4 0 43,895
0.0 0.0 13.2 0 21,700
0.0 0.0 0.0 0 14,600
0.0 0.0 0.0 0 50,100
0.0 26.8 26.8 0 2,670
0.0 26.8 40.0 0 89,070
0.0 0.2 27.3 0 27,200
0.0 2.3 33.1 0 86,818
0.0 0.2 4.0 0 8,730
0.0 2.7 64.4 0 122,748

TABLES AND ANALYSES
206
Country City Property Share per
key date 1)
Additions
(month/year)
Plot Office-
space
Retail-
space
Hotel-
space
Industrial-
space
Investment properties 2) 643.4 952.8 73.7 79.5 17.9
Investment properties Austria 212.5 140.4 27.6 39.5 1.3
Investment properties Germany 198.5 224.6 8.6 24.7 6.7
Investment properties Eastern Europe 232.5 587.8 37.5 15.4 9.9
Investment properties under development 2,512.1 104.5 2.4 17.1 1.3
Actual projects Austria 3.9 12.5 0.8 0.0 0.2
Landbank Germany 1,160.5 0.0 0.0 0.0 0.0
Actual projects Germany 23.2 58.1 1.3 17.1 0.1
Landbank Eastern Europe 1,317.3 0.0 0.0 0.0 0.0
Actual projects Eastern Europe 7.2 34.0 0.3 0.0 1.1
Properties held for trading 807.9 1.3 0.6 0.0 0.7
Properties held for trading Austria 3.8 0.0 0.0 0.0 0.0
Properties held for trading Germany 804.1 1.3 0.6 0.0 0.7
Assets held for sale 98.4 8.4 1.2 0.0 0.0
Assets held for sale Austria 36.8 0.2 1.2 0.0 0.0
Assets held for sale Germany 0.0 0.0 0.0 0.0 0.0
Assets held for sale Eastern and South East Europe 61.6 8.2 0.0 0.0 0.0
Total properties sold 2016 423.7 49.3 35.4 0.0 0.8
Total 4,061.7 1,067.0 77.9 96.6 19.9
Total (incl. sold properties) 4,485.4 1,116.3 113.2 96.6 20.7 1) All data refer to the proportion of CA Immo; Plot size in 1,000 sqm; Values in 1,000 2) The property includes own used area 3) Calculation Yield (gross yield): Rental income annualised / fair value

TABLES AND ANALYSES
TAB
LE
S A
ND
AN
ALY
SE
S
207
Logistics-
space
Others Total space Fair value as at
31.12.2016
Fair value as at
31.12.2015
Rental income
annulised
Level of commercial
rental in % 2016
Yield in %
2016 3)
25.0 193.5 1,342.4 3,219,333 2,910,586 195,466 92% 6.1%
0.0 125.3 334.1 551,259 548,137 30,703 95% 5.6%
25.0 43.0 332.6 1,175,640 1,056,346 57,924 94% 4.9%
0.0 25.1 675.7 1,492,434 1,306,103 106,839 91% 7.2%
0.0 5.5 130.9 438,485 384,744
0.0 0.2 13.6 5,480 3,920
0.0 0.0 0.0 264,610 265,270
0.0 3.9 80.4 118,940 72,720
0.0 0.0 0.0 26,755 31,234
0.0 1.4 36.9 22,700 11,600
0.0 199.9 202.5 129,547 70,187 296
0.0 0.0 0.0 11,951 379 0
0.0 199.9 202.5 117,595 69,808 296
24.7 30.0 64.3 32,491 34,555 2,487
0.0 30.0 31.4 15,064.0 13,390.0 619.8
0.0 0.0 0.0 0 0 0
24.7 0.0 32.9 17,426.7 21,165.0 1,867.2
0.0 70.3 155.8 0.0 255,713.1
49.7 429.0 1,740.1 3,819,855 3,400,072 198,249
49.7 499.3 1,895.9 3,819,855 3,655,785
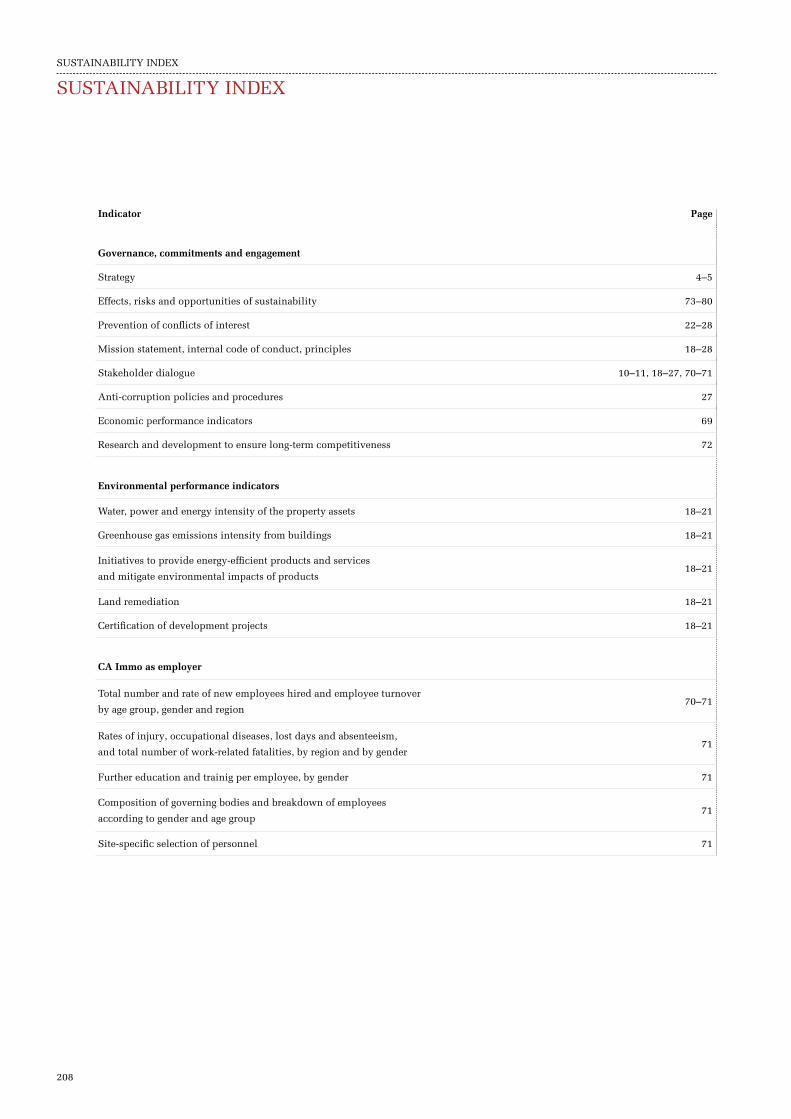
Indicator Page
Governance, commitments and engagement
Strategy 4–5
Effects, risks and opportunities of sustainability 73–80
Prevention of conflicts of interest 22–28
Mission statement, internal code of conduct, principles 18–28
Stakeholder dialogue 10–11, 18–27, 70–71
Anti-corruption policies and procedures 27
Economic performance indicators 69
Research and development to ensure long-term competitiveness 72
Environmental performance indicators
Water, power and energy intensity of the property assets 18–21
Greenhouse gas emissions intensity from buildings 18–21
Initiatives to provide energy-efficient products and services
and mitigate environmental impacts of products18–21
Land remediation 18–21
Certification of development projects 18–21
CA Immo as employer
Total number and rate of new employees hired and employee turnover
by age group, gender and region 70–71
Rates of injury, occupational diseases, lost days and absenteeism,
and total number of work-related fatalities, by region and by gender 71
Further education and trainig per employee, by gender 71
Composition of governing bodies and breakdown of employees
according to gender and age group 71
Site-specific selection of personnel 71
SUSTAINABILITY INDEX SUSTAINABILITY INDEX
208
CONTACT/DISCLAIMER/IMPRINT
CONTACT
CA Immobilien Anlagen AG Mechelgasse 1 1030 Wien Tel +43 1 532 59 07- 0 Fax +43 1 532 59 07- 510 [email protected] www.caimmo.com Investor Relations Free info hotline in Austria: 0800 01 01 50 Christoph Thurnberger Claudia Höbart Tel. +43 1 532 59 07- 0 Fax +43 1 532 59 07- 595 [email protected] Corporate Communications Susanne Steinböck Marion Naderer Tel. +43 1 532 59 07- 0 Fax +43 1 532 59 07- 595 [email protected]
DISCLAIMER
This Annual Report contains statements and forecasts which refer to the future development of CA Immobilien Anlagen AG and their companies. The forecasts represent assessments and targets which theCompany has formulated on the basis of any and all information available to the Company at present. Should the assumptions on which the forecasts have been based fail to occur, the targets not be met or the risks set out in the risk management report materialise, then the actual results may deviate from the results currently antici-pated. This Annual Report does not constitute an invitation to buy or sell the shares of CA Immobilien Anlagen AG.
IMPRINT
Published by: CA Immobilien Anlagen AG 1030 Vienna, Mechelgasse 1 Text: Susanne Steinböck, Christoph Thurnberger Claudia Höbart Layout: Marion Naderer Graphic design and setting: WIEN NORD Werbeagentur Photographs: CA Immo, Markus Diekow, Ales Jungmann Production: 08/16 This report has been produced inhouse with firesys
We ask for your understanding that gender-conscious notation in the texts of this Annual Report largely had to be abandoned for the sake ofundisturbed readability of complex economic matters. This Annual Report is printed on environmentally friendly and chlorine-free bleached paper.