Victorian Population Health Survey...
96
Victorian Population Health Survey 2006 Selected findings
Transcript of Victorian Population Health Survey...

Victorian Population Health Survey 2006Selected findings


Victorian Population Health Survey 2006Selected findings
Department of Human Services
Published by Rural and Regional Health and Aged Care Services
Victorian Government Department of Human Services, Melbourne, Victoria.
October 2007
© Copyright State of Victoria
This publication is copyright. No part may be reproduced by any process except in accordance with the provision of the Copyright Act 1968.
Authorised by the State Government of Victoria, 50 Lonsdale Street, Melbourne.
Published at www.health.vic.gov.au/healthstatus/vphs.htm
Suggested citation:‘Victorian Population Health Survey 2006, Department of Human Services, Victoria, 2006.’
Report writing and analysisAdrian Serraglio
Contact detailsLoretta VaughanChronic Disease Surveillance and EpidemiologyRural and Regional Health and Aged Care ServicesDepartment of Human Services VictoriaTelephone: +61 3 9096 5286Email: [email protected]

Victorian Population Health Survey 2006 – Selected findings iii
ForewordThe Victorian Population Health Survey is an important component of the population health surveillance capacity of the Department of Human Services. The department initiated this surveillance program in 1998 after a rigorous process of technical evaluation and review. The first survey of adult Victorians was conducted in 2001.
The Victorian Population Health Survey is based on a core set of question modules that are critical to informing decisions about public health priorities. The survey findings fill a significant void in the accessible data that are required to ensure public health programs are relevant and responsive to current and emerging health issues.
This report contains the key findings from the Victorian Population Health Survey 2006 and is the sixth in an ongoing annual series. Information is presented on health and lifestyle including asthma, diabetes, alcohol and tobacco consumption, fruit and vegetable consumption, physical activity, adult obesity, psychological distress and social networks.
The value of the Victorian Population Health Survey data is increasing over time as it becomes possible to comment on trends for selected survey estimates. This year the report presents trends in the health risk profile of the adult population for the years 2001 to 2006. Future survey reports will continue to present time series information reporting changes over time in the adult population.
The findings of this report have a direct bearing on State Government policies such as Growing Victoria Together and A Fairer Victoria which are both aimed at tackling social inequalities in health. The findings also provide important insights into the determinants of chronic disease and opportunities for improved targeting of public health interventions.
The survey series is an ongoing source of high quality information on the health of Victorians. The latest data from the 2006 survey continue to underpin our public health efforts especially in controlling chronic diseases.
DR JIM HYDEDirector, Public HealthRural and Regional Health and Aged Care ServicesDepartment of Human Services

iv Victorian Population Health Survey 2006 – Selected findings
Contentsvictorian Population Health Survey 2006 i
Foreword iii
1 Summary 1
2 Health and lifestyle 5
3 Self-reported health and selected health conditions 40
4 Obesity among adults 49
5 Asthma 57
6 Diabetes 64
7 Psychological distress 70
8 Social support, community participation and attitudes 76
Appendix A: The victorian Population Health Survey 2006 81
Appendix B: Data items for the Victorian Population Health Survey 2006 86
Victorian Population Health Survey 2006 – Selected findings 1
1 SummaryAbout the surveyThe Victorian Population Health Survey is an important component of the population health surveillance capacity of the Department of Human Services. The annual survey series is an ongoing source of high quality information on the health of Victorians. Information in the report is presented on health and lifestyle, including physical activity, smoking, alcohol consumption, intake of fruit and vegetables, selected health screening, adult obesity, asthma and diabetes prevalence, psychological distress and social networks.
The aim of this report is to provide high quality, timely indicators of population health that are intended to have direct application to evidence-based policy development and strategic planning across the department and the wider community. The Victorian Population Health Survey is based on a core set of question modules that are critical to informing decisions about public health priorities. It fills a significant void in the accessible data that are required to ensure public health programs are relevant and responsive to current and emerging health issues.
MethodsComputer-assisted telephone interviewing was undertaken between August and December 2006. A representative statewide sample of adults aged 18 years or over was randomly selected from households in each of the eight departmental health regions. Approximately 7500 interviews were completed during the fieldwork period. The department determined the content of the survey after reviewing the determinants of chronic disease states that are most likely to have an impact on Victorians. Priority has been given to areas in which a public health response is likely to be effective in improving health and, importantly, reducing inequalities in health for all Victorians.
More details on the methods is presented in Appendix A.
About this reportThis report presents information that is compared to selected data items since inception of the survey in 2001. Future survey reports will continue to present time series information, along with changes over time in the health of Victorians and the determinants of that health, such as obesity patterns among adult Victorians. In the section on health and lifestyle, the report contains information on the prevalence of major risk-taking behaviours across the Victorian population—for example, the prevalence of smoking, nutrition, alcohol consumption and levels of physical activity. Data on self-reported height and weight are now collected as core items. These data will be vital for targeting public health interventions and evaluating outcomes.
Questions on asthma and diabetes provide indicators for the selected national health priority areas, which are the subject of public health programs in Victoria and nationwide. These data complement the department’s Victorian Burden of Disease Study and Victorian Ambulatory Care Sensitive Conditions Study, and they describe aspects of clinical management and prevention that are amenable to public health interventions. A particular interest is the module of questions on the social determinants of health. A component of information presented in the report (section 8) is based on

2 Victorian Population Health Survey 2006 – Selected findings
measures of the extent and diversity of social networks in the Victorian population. Policy makers now have Victorian data that link preventable risk-taking behaviours, their ‘upstream’ determinants (such as levels of social networks) and health status.
The Victorian Population Health Survey 2006 collected a wide range of information relating to the health of the adult Victorian population and the determinants of that health. Table 1.1 presents the key results from the survey, the health and lifestyle of Victorians in 2006 at a glance.
The main lifestyle related variables include fruit and vegetable intake, alcohol consumption, smoking and physical activity.
Health status variables described include self-rated health, body mass index, asthma and diabetes status and levels of psychological distress.
Screening information collected includes blood pressure, cholesterol, bowel and blood sugar levels.
Social network and participation information includes attendance at community events, group membership, volunteering, help from friends/family/neighbours, attitudes towards multiculturalism and feeling valued by society.
Fruit intake
The proportion of adults in 2006 meeting the recommended daily intake levels of fruit (two serves) was 47.0 per cent, down from a high of 56.4 per cent in 2001, at the commencement of the Victorian Population Health Survey data collection.
vegetable intake
Less than one in ten adults in 2006 (9.9 per cent) were meeting the recommended daily intake for vegetables (five serves), down from a high of 12.2 per cent in 2002.
Alcohol intake
The proportion of males and females drinking alcohol weekly at levels for short term risk has remained relatively constant over the period 2002–06, at approximately 14 per cent for males and 6 per cent for females.
Smoking
In 2006, over one in five adults aged 18 years or over (20.5 per cent) were current smokers, down from a high of 24.5 per cent in 2001.
Physical activity
The proportion of persons undertaking adequate physical activity (measured in both sufficient time and sessions) was 64.1 per cent in 2006, an increase from 57.0 per cent in 2002.

Victorian Population Health Survey 2006 – Selected findings 3
Self reported health
The proportion of persons reporting their health as either excellent, very good or good has remained relatively constant over the period 2001–06, at between 81 and 84 per cent.
Obesity/overweight
The measures of height and weight were collected for the first time in 2002. The proportion of persons categorised as overweight or obese according to the body mass index has remained steady at between 45 and 48 per cent.
Asthma
Asthma prevalence amongst adults in 2006 was 10.7 per cent and has remained steady at this level over the past few years.
Diabetes
Diabetes prevalence amongst adults has remained steady at between 4 and 5 per cent over the period 2002–06.
Psychological distress
The proportion of persons having high levels on the Kessler 10 measure of psychological distress has ranged from 3 to 4 per cent over the period 2001–06.
Screening
Blood pressure checks amongst persons aged 50 years and over has remained constant over the period 2001–06, with 78.2 per cent of persons in this aged group undertaking the test in 2006.
Those in the 50 years plus age group having cholesterol checks has risen from 45.8 per cent in 2001 to 51.0 per cent in 2006, and for blood sugar tests the proportion rose from 44.8 per cent in 2001 to 47.8 per cent in 2006.
Social networks and participation
In 2006, over one in three persons aged 18 years and over (33.9 per cent) reported that they helped out a local group as a volunteer.
Most persons could get help from friends, family or neighbours when needed.
Three out of four persons (75.0 per cent) felt multiculturalism made life in their area better, 81.3 per cent felt valued by society and 72.8 per cent felt they had an opportunity to have a say on issues that were important to them.

4 Victorian Population Health Survey 2006 – Selected findings
Summary of results Table 1.1: At a glance: The health and lifestyle of adult* Victorians, 2001–06 Selected findings
Lifestyle related variable2001 2002 2003 2004 2005 2006
Measure% % % % % %Fruit intake 56.4 54.8 50.9 51.6 51.0 47.0 Proportion meeting recommended daily intake levelsVegetable intake .. 12.2 11.4 7.0 9.5 9.9Alcohol intake – males .. 14.3 14.6 16.4 13.3 14.7 Proportion drinking weekly at levels for short term
risk from alcohol consumptionAlcohol intake – females .. 6.0 6.2 7.2 6.4 6.1Smoking 24.5 24.2 22.5 22.3 20.4 20.5 Prevalence of current smokersSmoking in the home .. 81.0 83.9 83.8 88.4 88.4 Proportion of smoke free homes
Physical activity .. 57.0 59.5 56.8 63.8 64.1Adequate physical activity – sufficient time and sessions
Health Status
Self reported health 82.1 81.4 83.9 82.6 81.8 84.0Proportion reporting excellent/very good/good health
Obesity/overweight .. 45.5 45.8 46.8 47.9 47.8Proportion of persons obese/overweight according to Body Mass Index
Asthma 12.3 12.6 11.7 10.5 11.3 10.7** Current asthma prevalenceDiabetes 5.7 4.5 4.2 4.7 4.8 4.9 Diabetes prevalencePsychological distress 4.0 2.7 2.6 3.3 3.1 2.9 Proportion having high scores (>=30)Screening
Blood pressure check 78.8 79.3 76.6 78.5 78.9 78.2Proportion aged 50 years and over having a test in the past 2 years
Cholesterol check 45.8 47.9 48.3 49.7 50.7 51.0Blood sugar test 44.8 45.3 46.5 47.0 47.3 47.8
Social networks and participationAttended a local community event in the past six months
.. 71.1 52.7 49.7 54.2 53.3 Proportion of persons aged 18 years and over
Member of a sports group .. 28.9 28.3 29.3 27.4 27.1Member of a church group .. 18.7 17.5 18.6 18.0 16.5Member of a school group .. 15.1 14.8 15.6 15.5 12.9Member of community or action group
.. 25.0 21.7 20.9 19.7 20.1
Member of a professional group or academic society
.. 21.2 21.7 21.2 22.9 22.0
Help out a local group as a volunteer 32.0 34.0 34.4 31.0 35.1 33.9Proportion of aggregated responses ‘Yes definitely’ and ‘Sometimes’
Can get help from friends when needed
94.6 94.0 94.3 93.5 93.1 94.6
Can get help from family when needed
92.6 92.8 94.0 93.0 93.3 92.5
Can get help from neighbours when needed
78.0 71.8 71.3 67.9 71.3 71.5
Feel multiculturalism makes life in area better
85.7 87.0 86.2 85.9 79.9 75.0
Feel valued by society 78.7 83.8 85.6 79.4 82.7 81.3Feel they have an opportunity to have a say on issues that are important to them
70.3 73.4 75.2 72.6 72.7 72.8
Ability to raise $2000 within two days in an emergency
.. 78.6 80.0 82.0 83.7 86.4
*Aged 18 years and over unless otherwise specified .. Not available** Revised prevalence estimate

Victorian Population Health Survey 2006 – Selected findings 5
2 Health and lifestyleA range of lifestyle behaviours influences the health status and health risk profile of individuals. Lifestyle related risk factors contribute significantly to the burden of disease in Australia via their effect on the onset, maintenance and prognosis of a variety of diseases and health conditions and their complications. The risk factors associated with health and lifestyle behaviours are largely avoidable or modifiable. As a result, there is considerable scope for health gain through early prevention or appropriate management.
This section presents information on lifestyle related risk factors, specifically poor nutrition, alcohol consumption, tobacco smoking and physical activity, and preventative health behaviours including screening and eye checks.
Summary• Nutrition: Less than one in ten persons aged 18 years and over (9.9 per cent)
met the healthy eating guidelines for vegetable intake of 5 or more serves daily. Most persons (54.2 per cent) consumed one or two serves of vegetables daily.
• The proportion meeting the recommended vegetable intake was lowest for males in the 25–34 year age group and females in the 18–24 year age group, where 3.8 per cent and 5.6 per cent respectively had five or more serves of vegetables daily.
• Less than half of all persons aged 18 years and over (47.0 per cent) met the healthy eating guidelines for consumption of fruit at two or mores serves per day. A higher proportion of females than males (53.8 per cent and 39.8 per cent respectively) consumed two or more serves of fruit daily.
• The proportion meeting the fruit consumption guidelines was lowest in the 25–34 year age group at 31.8 per cent for males and 42.5 per cent for females.
• Almost half of all persons aged 18 years and over (48.5 per cent) did not meet the guidelines for both fruit and vegetable consumption.
• Almost one in ten females (9.9 per cent) and 5.1 per cent of males met the healthy eating guidelines for both fruit and vegetable consumption.
• Alcohol consumption: Based upon the frequency and volume of consuming alcohol, the prevalence for males consuming alcohol at least weekly at above short-term risk levels was 14.7 per cent. A further 15.9 per cent consumed alcohol at these levels at least monthly and 25.5 per cent did so at least yearly.
• Over one in five males aged 18–24 years and 25–34 years consumed alcohol at short-term risk levels at least weekly (21.7 per cent and 21.4 per cent respectively).
• Young females (aged 18–24 years) had a prevalence of 16.0 per cent for at least weekly drinking of alcohol at short-term risk levels.
• Most males and females aged 18 year and over (82.2 per cent and 73.7 per cent respectively) were categorised as having a low risk of long-tern alcohol related harm based on their frequency and volume of consuming alcohol.
6 Victorian Population Health Survey 2006 – Selected findings
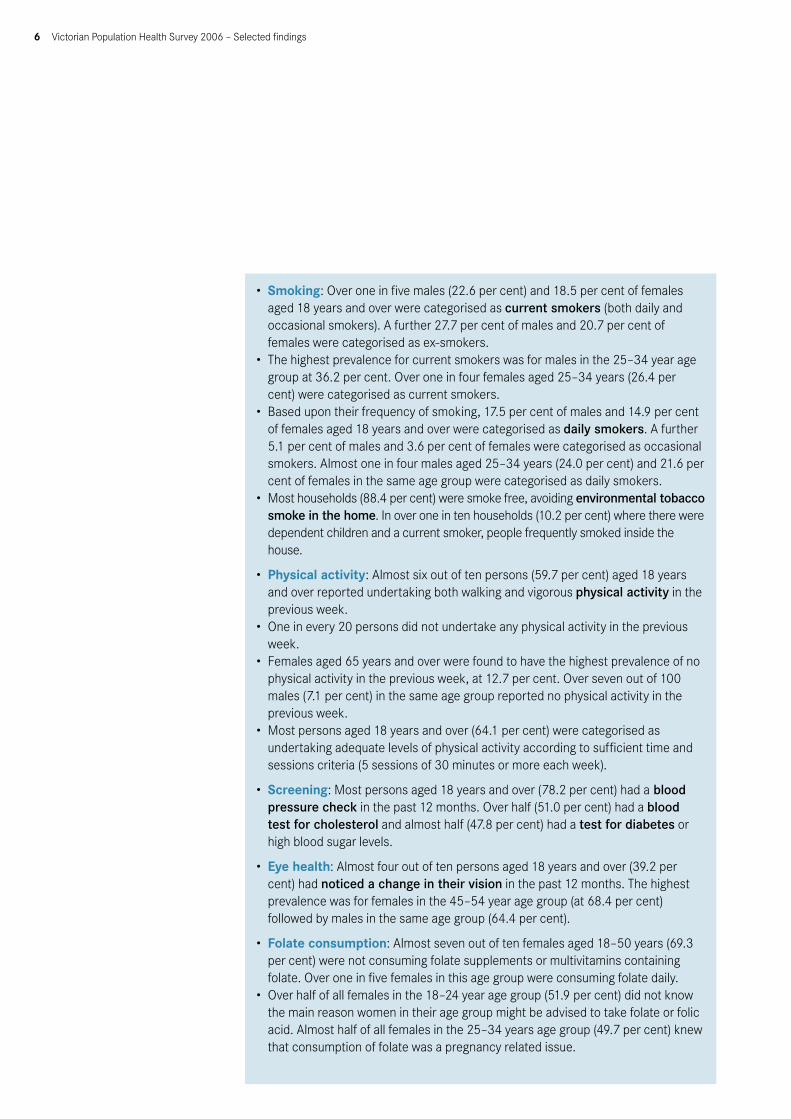
• Smoking: Over one in five males (22.6 per cent) and 18.5 per cent of females aged 18 years and over were categorised as current smokers (both daily and occasional smokers). A further 27.7 per cent of males and 20.7 per cent of females were categorised as ex-smokers.
• The highest prevalence for current smokers was for males in the 25–34 year age group at 36.2 per cent. Over one in four females aged 25–34 years (26.4 per cent) were categorised as current smokers.
• Based upon their frequency of smoking, 17.5 per cent of males and 14.9 per cent of females aged 18 years and over were categorised as daily smokers. A further 5.1 per cent of males and 3.6 per cent of females were categorised as occasional smokers. Almost one in four males aged 25–34 years (24.0 per cent) and 21.6 per cent of females in the same age group were categorised as daily smokers.
• Most households (88.4 per cent) were smoke free, avoiding environmental tobacco smoke in the home. In over one in ten households (10.2 per cent) where there were dependent children and a current smoker, people frequently smoked inside the house.
• Physical activity: Almost six out of ten persons (59.7 per cent) aged 18 years and over reported undertaking both walking and vigorous physical activity in the previous week.
• One in every 20 persons did not undertake any physical activity in the previous week.
• Females aged 65 years and over were found to have the highest prevalence of no physical activity in the previous week, at 12.7 per cent. Over seven out of 100 males (7.1 per cent) in the same age group reported no physical activity in the previous week.
• Most persons aged 18 years and over (64.1 per cent) were categorised as undertaking adequate levels of physical activity according to sufficient time and sessions criteria (5 sessions of 30 minutes or more each week).
• Screening: Most persons aged 18 years and over (78.2 per cent) had a blood pressure check in the past 12 months. Over half (51.0 per cent) had a blood test for cholesterol and almost half (47.8 per cent) had a test for diabetes or high blood sugar levels.
• Eye health: Almost four out of ten persons aged 18 years and over (39.2 per cent) had noticed a change in their vision in the past 12 months. The highest prevalence was for females in the 45–54 year age group (at 68.4 per cent) followed by males in the same age group (64.4 per cent).
• Folate consumption: Almost seven out of ten females aged 18–50 years (69.3 per cent) were not consuming folate supplements or multivitamins containing folate. Over one in five females in this age group were consuming folate daily.
• Over half of all females in the 18–24 year age group (51.9 per cent) did not know the main reason women in their age group might be advised to take folate or folic acid. Almost half of all females in the 25–34 years age group (49.7 per cent) knew that consumption of folate was a pregnancy related issue.

Victorian Population Health Survey 2006 – Selected findings 7
Fruit and vegetable intakeCurrent Australian guidelines recommend a daily vegetable intake of three serves for persons aged 12–18 years and five serves for persons aged 19 years or over, where a serve is defined as half a cup of cooked vegetables or a cup of salad vegetables. The recommended daily fruit intake is three serves for persons aged 12–18 years and two serves for persons aged 19 years or over, where a serve is defined as one medium piece or two small pieces of fruit, or one cup of diced pieces (see table 2.1).
Table 2.1: Recommended daily intake of fruit and vegetablesConsumption Age group* Recommended daily intakeFruit Persons aged 12–18 years Three serves
Persons aged 19 years or over Two servesVegetables Persons aged 12–18 years Three serves
Persons aged 19 years or over Five servesSource: Australian Department of Health and Family Services, 1998, The Australian Guide to Healthy Living, Canberra.
* Excludes pregnant or breastfeeding women
Table 2.2: Daily vegetable consumption, 2002–06
Serves*
2002 2003 2004 2005 2006
% SE(%) % SE(%) % SE(%) % SE(%) % SE(%)
None 2.4 0.2 2.4 0.2 2.7 0.3 4.2 0.3 4.5 0.4
One or two serves 52.5 0.8 54.6 0.8 60.4 0.8 54.2 0.8 54.2 0.8
Three or four serves 32.6 0.7 31.4 0.7 29.2 0.7 31.7 0.7 30.2 0.7
Five or more serves 12.2 0.5 11.4 0.5 7.0 0.4 9.5 0.4 9.9 0.5
* A serve is half a cup of cooked vegetables or a cup of salad vegetables SE = standard error. Note figures may not add to 100 per cent due to a proportion of ‘Don’t know’ or ‘refused’ responses.
Table 2.2 shows the daily vegetable consumption pattern of adults over the period 2002–06. Most persons (54.2 per cent in 2006) consumed one or two serves of vegetables and this proportion remained relatively steady over the period. A small proportion (4.5 per cent in 2006) did not consume vegetables on a daily basis (the highest figure recorded over the past five years) and the proportion having the recommended intake of five or more serves decreased from a high of 12.2 per cent in 2002 to a low of 7.0 per cent in 2004. Currently, in 2006, almost one in 10 persons (9.9 per cent) consumed 5 or more serves of vegetables on a daily basis.
Figure 2.1: Daily vegetable consumption, 2002–06

8 Victorian Population Health Survey 2006 – Selected findings
Table 2.3: Daily vegetable consumption, by sex
Serves*
Males Females Persons
% SE(%) % SE(%) % SE(%)
None 5.1 0.6 3.9 0.4 4.5 0.4
One or two serves 64.4 1.3 44.5 1.0 54.2 0.8
Three or four serves 22.5 1.0 37.5 1.0 30.2 0.7
Five or more serves 6.6 0.7 13.1 0.6 9.9 0.5
* A serve is half a cup of cooked vegetables or a cup of salad vegetables SE = standard error. Note figures may not add to 100 per cent due to a proportion of ‘Don’t know’ or ‘refused’ responses.
While most females reported consuming up to four serves of vegetables on a daily basis (table 2.3) most males reported consuming only one or two serves. Approximately twice as many females than males (13.1 per cent compared to 6.6 per cent) consumed the daily recommended five or more serves of vegetables.
Table 2.4: Daily vegetable consumption, by age – males
Age group (years)
Serves*None 1–2 3–4 5+
% SE(%) % SE(%) % SE(%) % SE(%)18–24 4.5 1.8 68.5 4.1 15.3 2.7 8.8 3.1
25–34 5.2 2.1 70.3 3.7 19.7 3.0 3.8 2.0
35–44 6.4 1.3 64.6 2.7 23.6 2.4 4.0 1.0
45–54 5.3 1.0 66.8 2.4 20.6 2.1 6.1 1.2
55–64 5.0 1.3 58.1 2.9 28.8 2.8 7.7 1.6
65+ 3.8 0.9 56.9 2.3 27.0 2.1 10.8 1.5
* A serve is half a cup of cooked vegetables or a cup of salad vegetables SE = standard error. Note figures may not add to 100 per cent due to a proportion of ‘Don’t know’ or ‘refused’ responses.
Table 2.4 shows the daily vegetable consumption by age group for males. Older males (aged 65 years and over) were found to be the highest proportion of males consuming 5 or more serves of vegetables daily. Males in the 25–34 and 35–44 year age groups were the lowest proportion of males for meeting the recommended guidelines of five or more serves (3.8 per cent and 4.0 per cent respectively). The highest proportion of males who did not have vegetables on a daily basis was in the 35–44 year age group at 6.4 per cent.
Figure 2.2: Daily vegetable consumption, by age – males

Victorian Population Health Survey 2006 – Selected findings 9
Table 2.5: Daily vegetable consumption, by age – females
Age group (years)
Serves*None 1–2 3–4 5+
% SE(%) % SE(%) % SE(%) % SE(%)18–24 4.1 1.5 55.6 3.9 32.5 3.8 5.6 1.4
25–34 5.2 1.1 51.0 2.6 32.2 2.3 10.7 1.6
35–44 3.2 0.8 48.2 2.0 36.9 1.9 10.9 1.2
45–54 2.0 0.6 42.5 2.2 38.6 2.1 16.8 1.6
55–64 2.8 0.8 35.0 2.1 44.0 2.2 17.6 1.7
65+ 5.9 1.2 36.0 2.1 40.6 2.1 16.0 1.7
* A serve is half a cup of cooked vegetables or a cup of salad vegetables SE = standard error. Note figures may not add to 100 per cent due to a proportion of ‘Don’t know’ or ‘refused’ responses.
Figure 2.3: Daily vegetable consumption, by age – females
More females in the older age groups, from the age group 45–54 years upwards, consumed five or more serves of vegetables daily. Over one in twenty females aged 65 years and over reported not having any serves of vegetables on a daily basis (table 2.5).
Table 2.6: Daily vegetable consumption, by area of Victoria
Serves*
AreaMetropolitan Non-Metropolitan
% SE(%) % SE(%)None 4.8 0.5 3.7 0.3
One or two serves 55.2 1.1 51.7 0.9
Three or four serves 29.2 0.9 32.8 0.8
Five or more serves 9.5 0.6 11.1 0.5
* A serve is half a cup of cooked vegetables or a cup of salad vegetables SE = standard error. Note figures may not add to 100 per cent due to a proportion of ‘Don’t know’ or ‘refused’ responses.
Similar patterns in the reporting of daily serves of vegetable consumption were found for persons living in metropolitan and non-metropolitan areas of Victoria (table 2.6).
10 Victorian Population Health Survey 2006 – Selected findings
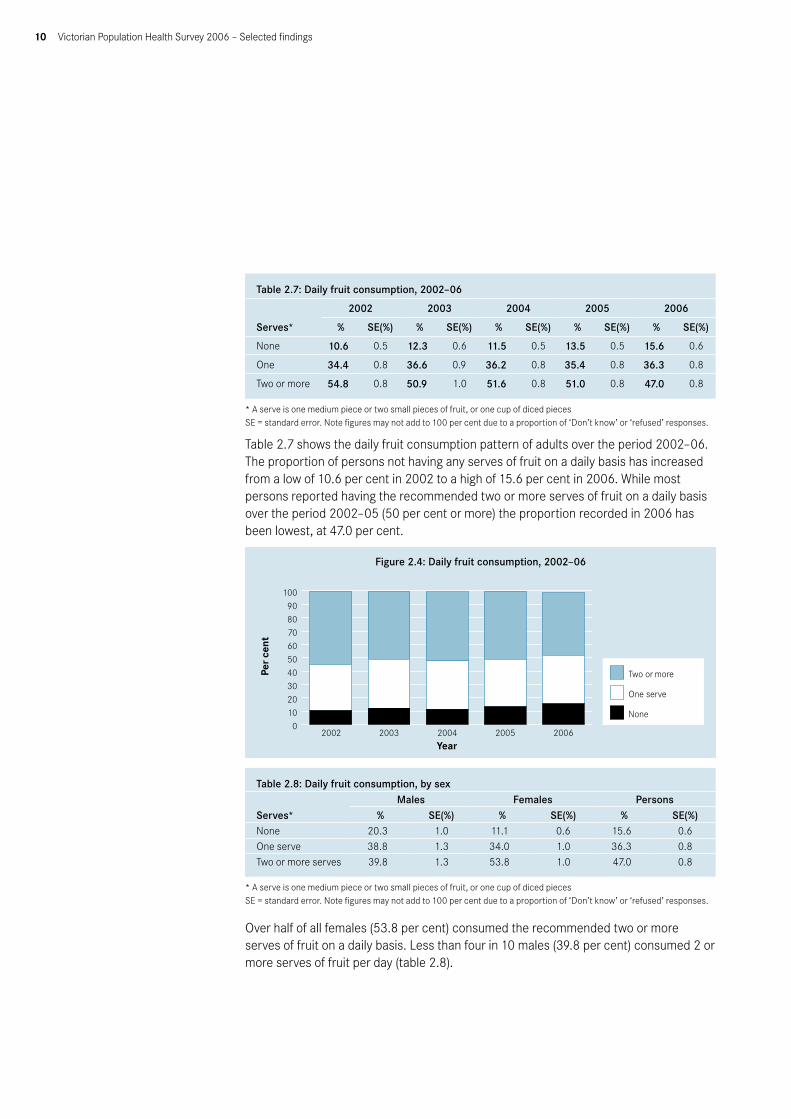
Table 2.7: Daily fruit consumption, 2002–06
Serves*
2002 2003 2004 2005 2006
% SE(%) % SE(%) % SE(%) % SE(%) % SE(%)
None 10.6 0.5 12.3 0.6 11.5 0.5 13.5 0.5 15.6 0.6
One 34.4 0.8 36.6 0.9 36.2 0.8 35.4 0.8 36.3 0.8
Two or more 54.8 0.8 50.9 1.0 51.6 0.8 51.0 0.8 47.0 0.8
* A serve is one medium piece or two small pieces of fruit, or one cup of diced pieces SE = standard error. Note figures may not add to 100 per cent due to a proportion of ‘Don’t know’ or ‘refused’ responses.
Table 2.7 shows the daily fruit consumption pattern of adults over the period 2002–06. The proportion of persons not having any serves of fruit on a daily basis has increased from a low of 10.6 per cent in 2002 to a high of 15.6 per cent in 2006. While most persons reported having the recommended two or more serves of fruit on a daily basis over the period 2002–05 (50 per cent or more) the proportion recorded in 2006 has been lowest, at 47.0 per cent.
Figure 2.4: Daily fruit consumption, 2002–06
Table 2.8: Daily fruit consumption, by sex
Serves*Males Females Persons
% SE(%) % SE(%) % SE(%)None 20.3 1.0 11.1 0.6 15.6 0.6One serve 38.8 1.3 34.0 1.0 36.3 0.8Two or more serves 39.8 1.3 53.8 1.0 47.0 0.8
* A serve is one medium piece or two small pieces of fruit, or one cup of diced pieces SE = standard error. Note figures may not add to 100 per cent due to a proportion of ‘Don’t know’ or ‘refused’ responses.
Over half of all females (53.8 per cent) consumed the recommended two or more serves of fruit on a daily basis. Less than four in 10 males (39.8 per cent) consumed 2 or more serves of fruit per day (table 2.8).

Victorian Population Health Survey 2006 – Selected findings 11
Table 2.9: Daily fruit consumption, by age–males
Age group (years)
Serves*None 1 2+
% SE(%) % SE(%) % SE(%)18–24 18.9 3.0 33.9 4.2 45.3 4.4
25–34 26.8 3.3 40.5 3.8 31.8 3.6
35–44 22.7 2.3 36.3 2.7 40.1 2.8
45–54 18.3 2.0 43.5 2.6 37.0 2.5
55–64 20.3 2.4 35.1 2.7 43.7 3.0
65+ 13.0 1.5 41.7 2.3 43.8 2.3
* A serve is one medium piece or two small pieces of fruit, or one cup of diced pieces SE = standard error. Note figures may not add to 100 per cent due to a proportion of ‘Don’t know’ or ‘refused’ responses.
Table 2.10: Daily fruit consumption, by age–females
Age group (years)
Serves*None 1 2+
% SE(%) % SE(%) % SE(%)18–24 9.9 2.3 36.9 3.8 51.7 4.0
25–34 13.2 1.7 42.7 2.6 42.5 2.5
35–44 11.9 1.3 32.3 1.9 55.5 2.0
45–54 11.4 1.3 32.1 2.1 55.7 2.1
55–64 8.6 1.2 30.7 2.1 60.0 2.2
65+ 10.5 1.4 29.4 2.0 58.4 2.2
* A serve is one medium piece or two small pieces of fruit, or one cup of diced pieces SE = standard error. Note figures may not add to 100 per cent due to a proportion of ‘Don’t know’ or ‘refused’ responses.
Table 2.9 shows the daily fruit consumption by age group for males. Males in the 25–34 year age group had the highest prevalence of non-consumption of fruit on a daily basis, at 26.8 per cent. Males in the 18–24 year age group had the highest prevalence of meeting the recommended two or more serves of fruit per day, at 45.3 per cent, followed closely by those aged 55 years and over.
Females in the older age groups (55–64 years and 65 years and over) reported the higher levels of daily fruit intake, at 60.0 per cent and 58.4 per cent respectively. Females in the 25–34 year age group had the highest prevalence of non-consumption of fruit on a daily basis, at 13.2 per cent (table 2.10).

12 Victorian Population Health Survey 2006 – Selected findings
Figure 2.5: Daily fruit consumption, by age – males
Figure 2.6: Daily fruit consumption, by age – females
Table 2.11: Daily fruit consumption, by area of Victoria
Serves*
AreaMetropolitan Non-Metropolitan
% SE(%) % SE(%)None 14.8 0.8 17.8 0.7
One 36.2 1.0 36.5 0.9
Two or more 47.8 1.1 44.7 0.9
* A serve is one medium piece or two small pieces of fruit, or one cup of diced pieces SE = standard error. Note figures may not add to 100 per cent due to a proportion of ‘Don’t know’ or ‘refused’ responses.
As per daily patterns of vegetable intake, similar patterns of daily fruit intake were reported for persons living in metropolitan and non-metropolitan areas (table 2.11).

Victorian Population Health Survey 2006 – Selected findings 13
Table 2.12: Meeting guidelines for consumption of fruit and/or vegetables
Age group (years)
Fruit and vegetables
Vegetables only, not fruit
Fruit only, not vegetables
Neither fruit nor vegetables
% SE(%) % SE(%) % SE(%) % SE(%)Males18–24 9.8 3.0 2.0 1.4 34.6 4.1 48.8 4.3
25–34 3.3 2.0 0.5 0.3 28.5 3.4 65.8 3.7
35–44 2.8 0.9 1.2 0.5 36.6 2.7 57.5 2.8
45–54 4.5 1.0 1.7 0.7 32.6 2.5 59.8 2.6
55–64 4.9 1.3 2.8 0.9 38.8 2.9 52.3 2.9
65+ 7.1 1.3 3.7 0.8 36.0 2.3 50.3 2.4
Total 5.1 0.7 1.9 0.3 34.3 1.2 56.4 1.3
Females18–24 7.6 2.0 2.3 1.0 44.1 4.0 43.2 3.9
25–34 6.3 1.2 4.1 1.0 35.9 2.4 51.3 2.6
35–44 7.7 1.0 3.2 0.7 47.4 2.0 40.7 2.0
45–54 12.3 1.5 4.5 0.9 43.4 2.1 39.0 2.1
55–64 12.9 1.5 4.4 0.8 46.7 2.2 34.6 2.1
65+ 12.7 1.5 3.1 0.8 44.9 2.2 36.5 2.1
Total 9.9 0.6 3.6 0.3 43.6 1.0 41.0 1.0
Persons18–24 8.7 1.8 2.1 0.9 39.3 2.9 46.1 2.9
25–34 4.8 1.2 2.3 0.5 32.2 2.1 58.5 2.2
35–44 5.3 0.7 2.2 0.4 42.0 1.7 49.0 1.7
45–54 8.4 0.9 3.1 0.6 38.1 1.6 49.2 1.7
55–64 8.9 1.0 3.6 0.6 42.7 1.8 43.4 1.8
65+ 10.2 1.0 3.4 0.6 41.0 1.6 42.6 1.6
Total 7.5 0.4 2.8 0.2 39.1 0.8 48.5 0.8
SE = standard error. Note figures may not add to 100 per cent due to a proportion of ‘Don’t know’ or ‘refused’ responses.
Table 2.12 shows the proportion of persons who meet the guidelines for both daily fruit and vegetable consumption. Almost one in ten females (9.9 per cent) and 5.1 per cent of males aged 18 years or over met the guidelines for both fruit and vegetable daily intake. Over half of all males (56.4 per cent) and 41.0 per cent of females did not meet the guidelines for either fruit or vegetable intake. Over six out of ten males in the 25–34 year age group (65.8 per cent) and over half of females in the same age group (51.3 per cent) did not meet the guidelines for either fruit or vegetable intake.

14 Victorian Population Health Survey 2006 – Selected findings
Figure 2.7: Usual daily consumption of fruit and vegetables relative to recommended servings, by age – males
Figure 2.8: Usual daily consumption of fruit and vegetables relative to recommended servings, by age – females

Victorian Population Health Survey 2006 – Selected findings 15
Table 2.13: Non-consumption of recommended daily intake of fruit and vegetables and selected risk factors
Area of Victoria 95% confidence interval
Odds ratio Upper level Lower level p valueUrban 1.00 — — —Rural/regional 0.97 0.78 1.19 0.762
Country of birthAustralia 1.00 — — —
Overseas 1.06 0.73 1.54 0.741Education level
Tertiary 1.00 — — —Secondary 0.91 0.65 1.29 0.604Primary 1.82 0.75 4.44 0.187
OccupationProfessional 1.00 — — —Non-professional 1.46 1.01 2.12 0.046
Employment statusEmployed 1.00 — — —Unemployed 1.52 0.73 3.18 0.258Not in the labour force 0.80 0.59 1.08 0.148
Household income per yearGreater than or equal to $60,000 1.00 — — —From $40,000 to less than $60,000 1.15 0.82 1.63 0.416From $20,000 to less than $40,000 0.97 0.65 1.44 0.866Less than $20,000 1.49 1.00 2.21 0.048
Private health insuranceYes 1.00 — — —No 1.42 1.08 1.87 0.011
Dwelling ownershipOwned 1.00 — — —Rented 1.26 0.82 1.92 0.292
Smoking statusNon-smoker 1.00 — — —Ex-smoker 1.05 0.82 1.37 0.679Smoker 1.82 1.06 3.17 0.031
Self-rated healthExcellent/very good 1.00 — — —Good 2.18 1.63 2.91 <0.001Fair/poor 2.38 1.62 3.49 <0.001
Physical activity levelsSufficient time and sessions 1.00 — — —Insufficient time and/or sessions 1.68 1.27 2.22 <0.001Sedentary 1.46 0.80 2.69 0.220
Body mass index Not overweight 1.00 — — —Overweight 0.99 0.75 1.31 0.927
Level of psychological distress<16 (none) 1.00 — — —16–21 (low) 1.03 0.74 1.44 0.85422–29 (mild) 1.38 0.86 2.20 0.18130 or over (high to severe) 2.08 0.97 4.50 0.061
High blood pressure everNo 1.00 — — —Yes 0.85 0.66 1.09 0.201
Told by a doctor that they had depression or anxietyNo 1.00 — — —Yes 0.87 0.66 1.12 0.256
– Not applicable

16 Victorian Population Health Survey 2006 – Selected findings
After adjusting for age and sex, those persons more likely to not meet the recommended guidelines for fruit and vegetable consumption were persons in non-professional occupations, persons without private health insurance, smokers, those who rated their health as good or fair/poor and those having insufficient physical activity levels (table 2.13).
Drinking water and milk consumption
Table 2.14: Drinking water consumption
Usually drink when thirstyMales Females Persons
% SE(%) % SE(%) % SE(%)Water 68.0 1.2 76.7 0.9 72.5 0.7
Milk 1.6 0.3 0.8 0.2 1.2 0.2
Tea/coffee 12.1 0.8 11.2 0.6 11.6 0.5
Soft drink 13.0 0.9 8.2 0.6 10.5 0.5
Fruit juice 3.4 0.5 2.8 0.3 3.1 0.3
Alcohol 1.6 0.3 0.0 0.0 0.7 0.1
SE = standard error. Note figures may not add to 100 per cent due to a proportion of ‘Don’t know’ or ‘refused’ responses.
Almost three out of four persons (72.5 per cent) stated that they usually drink water when thirsty. More females (76.7 per cent) than males (68.0 per cent) did so. This was followed by tea/coffee, at 11.6 per cent (table 2.14).
Table 2.15: Type of milk consumed
Type of milkMales Females Persons
% SE(%) % SE(%) % SE(%)Whole fat 42.3 1.3 31.6 1.0 36.8 0.8
Low or reduced fat 38.2 1.3 43.3 1.0 40.8 0.8
Skim 9.3 0.8 13.9 0.7 11.6 0.5
Soya 3.0 0.5 5.2 0.4 4.2 0.3
Other 2.2 0.4 1.6 0.3 1.9 0.2
Don’t drink milk* 4.2 0.5 4.2 0.4 4.2 0.3
* Includes lactose free milk SE = standard error. Note figures may not add to 100 per cent due to a proportion of ‘Don’t know’ or ‘refused’ responses.
Choosing a low fat or reduced milk or soy beverage is recommended for healthy eating. A higher proportion of males than females reported having whole fat milk (42.3 per cent compared to 31.6 per cent respectively) (table 2.15).

Victorian Population Health Survey 2006 – Selected findings 17
Figure 2.9: Type of milk consumed, by sex
Alcohol consumptionAt low or moderate levels, the consumption of alcohol yields health benefits for some people. In particular, it may help reduce the heart disease risk from middle age. Regular excessive consumption of alcohol over time, however, places people at increased risk of chronic ill health and premature death, and episodes of heavy drinking may place the drinker (and others) at risk of injury or death. The consequences of heavy, regular use of alcohol may include cirrhosis of the liver, cognitive impairment, heart and blood disorders, ulcers, cancers and damage to the pancreas.
The Australian Alcohol Guidelines: health risks and benefits emphasise patterns of drinking as opposed to levels of consumption (the average amount consumed). The concept of drinking patterns refers to aspects of drinking behaviour other than the level of drinking, including the context or circumstances of drinking (when, where and with whom the drinking behaviour occurs), the type of drinks consumed, the number of heavy drinking occasions and their characteristics, and the norms associated with drinking behaviour. Two main patterns of drinking behaviour have been identified as creating a risk to an individual’s health:
1. excessive alcohol intake on a particular occasion; and2. consistent high level intake over months and years.
The Guidelines specify the risks for various drinking levels for males and females of average or larger than average body size (60+ kilograms for males and 50+ kilograms for females) in the short-term and long-term for the whole population. Risk is categorised according to three levels:
1. low risk – a level of drinking at which the risk of harm is minimal and there are possible benefits for some of the population;
2. risky – a level of drinking at which the risk of harm outweighs any possible benefit; and
3. high risk – a level of drinking at which there is substantial risk of serious harm and above which risk increases rapidly.

18 Victorian Population Health Survey 2006 – Selected findings
Table 2.16: Australian alcohol guidelines for risk to health in the short term* Low risk Risky High risk
MalesUp to six on any one day: no
more than three days per weekSeven to 10 on any
one day11 or more on any one day
FemalesUp to four on any one day; no more than 3 days per week
Five to six on any one day
Seven or more on any one day
*Quantities in standard drinks
Table 2.17: Australian alcohol guidelines for risk to health in the long term*
MalesLow risk Risky High risk
On an average day Up to four per day Five to six per day Seven or more per dayOverall weekly level Up to 28 per week 29–42 per week 43 or more per week
Females
On an average day Up to two per day Three to four per day Five or more per dayOverall weekly level Up to 14 per week 15–28 per week 29 or more per week
*Based on a standard drink containing 10 grams or 12.5 millilitres of alcohol.
Long-term risk of poor health outcomes due to alcohol consumption is associated with regular daily patterns of drinking alcohol, defined in terms of the amount typically consumed each week. The Australian Alcohol Guidelines indicate that males are at high risk of long-term alcohol related health problems if they consume seven or more drinks on an average day or more than 43 drinks per week (table 2.17). For females, high risk of long-term problems is associated with the consumption of five or more standard drinks on an average day or more than 29 drinks per week. Alcohol consumption is considered risky in the long-term if males consume five to six drinks on an average day (29–42 per week) and if females consume more than three to four drinks daily (15–28 per week).
Table 2.18: Total abstainers from alcohol consumption*, by age and sex
Age group (years)
Males Females Persons% SE(%) % SE(%) % SE(%)
18–24 5.5 1.7 14.1 3.0 9.7 1.8
25–34 12.1 2.6 19.2 2.2 15.7 1.7
35–44 9.7 1.7 17.5 1.6 13.6 1.2
45–54 10.1 1.6 18.3 1.7 14.2 1.2
55–64 13.5 2.0 25.2 2.0 19.4 1.4
65+ 21.1 1.9 35.0 2.1 28.8 1.4
Total 12.0 0.8 21.9 0.9 17.1 0.6
*Includes those who had had a drink in the previous 12 months but who no longer drink (recent abstainers) SE = standard error.
Abstainers from alcohol were those persons who do not drink, or who had a drink in the past 12 months but no longer drink (recent abstainers). Over one in ten males (12.0 per cent) and 21.9 per cent of females were categorised as abstainers from alcohol (table 2.18).

Victorian Population Health Survey 2006 – Selected findings 19
Table 2.19 Frequency of drinking alcohol at above short-term risk level, by sex 2002–06
Males2002 2003 2004 2005 2006
% SE(%) % SE(%) % SE(%) % SE(%) % SE(%)Low risk 30.1 1.1 30.8 1.1 31.0 1.1 31.2 1.1 31.3 1.2Risky and high risk
At least yearly 25.8 1.1 24.4 1.1 24.4 1.1 24.0 1.1 25.5 1.2At least monthly 17.8 0.9 17.7 0.9 15.1 0.9 16.2 1.0 15.9 1.0At least weekly 14.3 0.9 14.6 0.8 16.4 0.9 13.3 0.9 14.7 1.0
Females Low risk 40.2 1.0 40.0 1.0 37.6 0.9 39.8 1.0 40.4 1.0Risky and high risk
At least yearly 20.7 0.8 19.6 0.8 22.5 0.8 20.3 0.8 21.4 0.9At least monthly 11.1 0.7 11.4 0.7 10.2 0.6 10.8 0.7 9.6 0.6At least weekly 6.0 0.5 6.2 0.5 7.2 0.5 6.4 0.6 6.1 0.5
SE = standard error. Note figures may not add to 100 per cent (excluding abstainers) due to a proportion of ‘Don’t know’ or ‘refused’ responses.
Table 2.19 shows the frequency of drinking alcohol at above short-term risk levels, by sex, over the period 2002–06. The proportion of males drinking alcohol on a weekly basis at above levels for short-term risk has remained constant at approximately 14 per cent over 2002–06 and at 6.0 per cent for females.
Table 2.20: Frequency of drinking alcohol at above short-term risk levels, by age and sex
Age group (years)
Risky or high riskLow risk At least yearly At least monthly At least weekly
% SE(%) % SE(%) % SE(%) % SE(%)Males
18–24 13.7 2.8 30.0 4.1 26.9 3.9 21.7 3.425–34 18.0 2.9 32.7 3.7 15.8 2.4 21.4 3.135–44 27.1 2.6 28.7 2.6 20.5 2.2 13.3 1.945–54 34.1 2.6 25.1 2.2 16.6 1.9 13.6 1.855–64 43.2 2.9 22.5 2.4 8.1 1.4 12.0 1.965+ 53.4 2.3 12.0 1.5 7.2 1.3 5.9 1.1Total 31.3 1.2 25.5 1.2 15.9 1.0 14.7 1.0
Females 18–24 16.8 2.8 32.8 3.8 19.9 3.0 16.0 2.825–34 30.8 2.4 28.6 2.3 14.0 1.8 7.2 1.235–44 39.5 2.0 25.1 1.7 11.0 1.2 6.5 1.045–54 47.4 2.2 21.5 1.8 7.7 1.0 4.9 0.955–64 52.3 2.2 15.0 1.6 3.7 0.7 3.2 0.865+ 50.9 2.2 7.8 1.2 3.2 0.8 1.7 0.6Total 40.4 1.0 21.4 0.9 9.6 0.6 6.1 0.5
Persons 18–24 15.2 2.0 31.4 2.8 23.5 2.5 18.9 2.225–34 24.5 1.9 30.7 2.2 14.9 1.5 14.3 1.735–44 33.4 1.6 26.9 1.6 15.7 1.2 9.8 1.045–54 40.9 1.7 23.3 1.4 12.1 1.1 9.2 1.055–64 47.8 1.8 18.7 1.5 5.9 0.8 7.6 1.065+ 52.0 1.6 9.7 0.9 5.0 0.7 3.6 0.6Total 36.0 0.8 23.4 0.7 12.7 0.6 10.3 0.5
Risk levels are defined in terms of the number of standard drinks per drinking occasion (subject to qualifications for specific population groups) and differ for males and females. For males, the risk categories are: low risk – less than six standard drinks per day, risky – seven to 10 standard drinks per day, and high risk – 11 or more standard drinks per day. For females the corresponding thresholds are: low risk – less than four standard drinks per day, risky – five to six standard drinks per day, and high risk – seven or more standard drinks per day.
SE = standard error. Note figures may not add to 100 per cent (excluding abstainers) due to a proportion of ‘Don’t know’ or ‘refused’ responses.
20 Victorian Population Health Survey 2006 – Selected findings
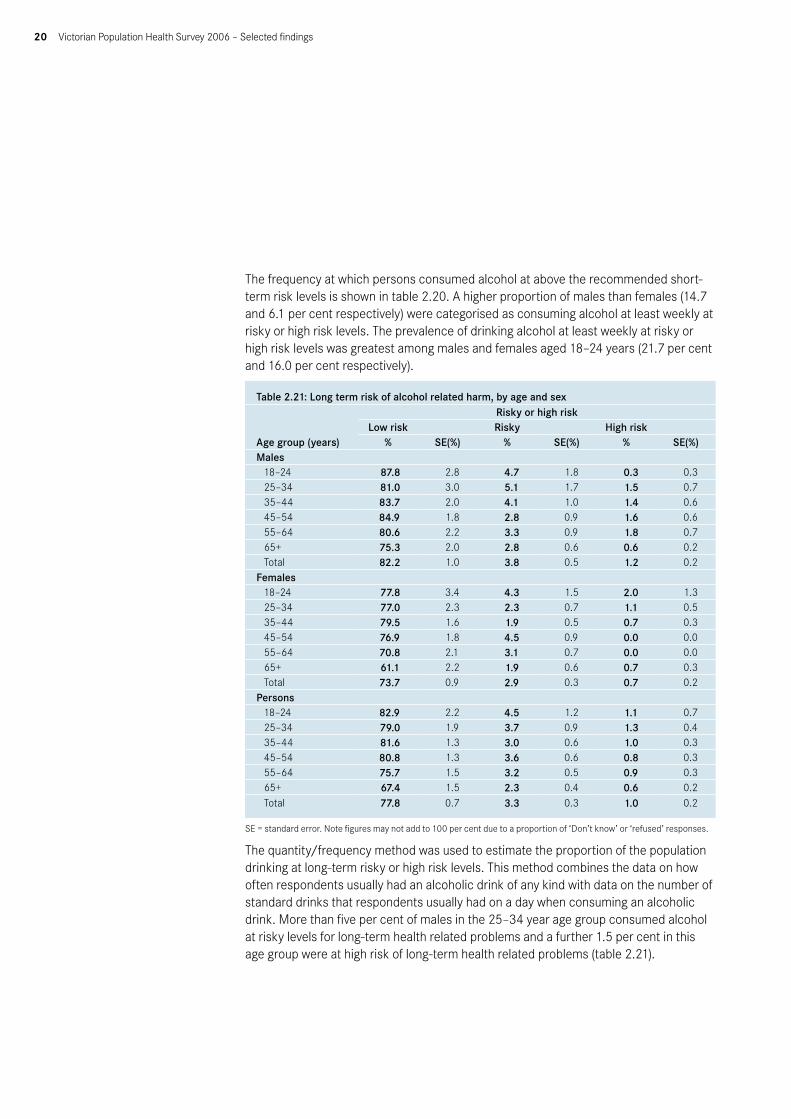
The frequency at which persons consumed alcohol at above the recommended short-term risk levels is shown in table 2.20. A higher proportion of males than females (14.7 and 6.1 per cent respectively) were categorised as consuming alcohol at least weekly at risky or high risk levels. The prevalence of drinking alcohol at least weekly at risky or high risk levels was greatest among males and females aged 18–24 years (21.7 per cent and 16.0 per cent respectively).
Table 2.21: Long term risk of alcohol related harm, by age and sex
Age group (years)
Risky or high riskLow risk Risky High risk
% SE(%) % SE(%) % SE(%)Males
18–24 87.8 2.8 4.7 1.8 0.3 0.325–34 81.0 3.0 5.1 1.7 1.5 0.735–44 83.7 2.0 4.1 1.0 1.4 0.645–54 84.9 1.8 2.8 0.9 1.6 0.655–64 80.6 2.2 3.3 0.9 1.8 0.765+ 75.3 2.0 2.8 0.6 0.6 0.2Total 82.2 1.0 3.8 0.5 1.2 0.2
Females 18–24 77.8 3.4 4.3 1.5 2.0 1.325–34 77.0 2.3 2.3 0.7 1.1 0.535–44 79.5 1.6 1.9 0.5 0.7 0.345–54 76.9 1.8 4.5 0.9 0.0 0.055–64 70.8 2.1 3.1 0.7 0.0 0.065+ 61.1 2.2 1.9 0.6 0.7 0.3Total 73.7 0.9 2.9 0.3 0.7 0.2
Persons 18–24 82.9 2.2 4.5 1.2 1.1 0.725–34 79.0 1.9 3.7 0.9 1.3 0.435–44 81.6 1.3 3.0 0.6 1.0 0.345–54 80.8 1.3 3.6 0.6 0.8 0.355–64 75.7 1.5 3.2 0.5 0.9 0.365+ 67.4 1.5 2.3 0.4 0.6 0.2Total 77.8 0.7 3.3 0.3 1.0 0.2
SE = standard error. Note figures may not add to 100 per cent due to a proportion of ‘Don’t know’ or ‘refused’ responses.
The quantity/frequency method was used to estimate the proportion of the population drinking at long-term risky or high risk levels. This method combines the data on how often respondents usually had an alcoholic drink of any kind with data on the number of standard drinks that respondents usually had on a day when consuming an alcoholic drink. More than five per cent of males in the 25–34 year age group consumed alcohol at risky levels for long-term health related problems and a further 1.5 per cent in this age group were at high risk of long-term health related problems (table 2.21).

Victorian Population Health Survey 2006 – Selected findings 21
Smoking
Table 2.22: Smoking status by sex2001 2002 2003 2004 2005 2006
% SE(%) % SE(%) % SE(%) % SE(%) % SE(%) % SE(%)Males
Current smoker* 28.3 1.1 26.4 1.1 24.8 1.1 25.0 1.1 21.9 1.1 22.6 1.2Ex-smoker 30.4 1.1 26.4 1.0 26.6 1.1 27.9 1.1 28.5 1.1 27.7 1.1Non-smoker 41.4 1.2 47.0 1.2 48.4 1.2 47.0 1.2 49.5 1.3 49.6 1.3
Females Current smoker* 20.9 0.8 22.1 0.8 20.3 0.8 19.7 0.7 18.9 0.8 18.5 0.8Ex-smoker 23.3 0.8 20.1 0.8 20.2 0.8 22.5 0.7 20.9 0.8 20.7 0.8Non-smoker 55.8 1.0 57.6 1.0 59.2 1.0 57.8 1.0 60.0 1.0 60.8 1.0
Persons Current smoker* 24.5 0.7 24.2 0.7 22.5 0.7 22.3 0.7 20.4 0.7 20.5 0.7Ex-smoker 26.8 0.7 23.2 0.6 23.3 0.7 25.1 0.7 24.6 0.7 24.1 0.7Non-smoker 48.7 0.8 52.4 0.8 54.0 0.8 52.5 0.8 54.9 0.8 55.4 0.8
* A person who smokes daily or occasionally is categorised as a current smoker. SE = standard error. Note figures may not add to 100 per cent due to a proportion of ‘Don’t know’ or ‘refused’ responses.
Current smokers are defined as those persons who smoke daily or occasionally. Table 2.22 shows the prevalence of smoking, by sex, over the period 2001–06. For males, the prevalence of current smokers has decreased from 28.3 per cent in 2001 to 22.6 per cent in 2006. For females, the prevalence of current smoking is a less marked decrease, from a high of 22.1 per cent in 2002 to 18.5 per cent in 2006.
Table 2.23: Smoking status, by age and sex
Age group (years)Current smoker* Ex-smoker Non-smoker% SE(%) % SE(%) % SE(%)
Males 18–24 23.9 3.5 8.1 2.4 68.1 3.925–34 36.2 3.8 11.6 2.1 52.2 3.835–44 25.3 2.5 27.0 2.6 47.7 2.845–54 24.0 2.3 33.8 2.5 42.2 2.655–64 15.1 1.9 38.0 2.9 46.9 2.965+ 7.0 1.2 48.5 2.3 44.5 2.4Total 22.6 1.2 27.7 1.1 49.6 1.3
Females 18–24 23.3 3.3 10.2 2.3 66.5 3.725–34 26.4 2.2 17.3 1.9 56.3 2.535–44 24.2 1.8 22.0 1.6 53.8 2.045–54 16.6 1.6 26.2 1.8 57.2 2.155–64 13.0 1.5 21.9 1.8 65.2 2.165+ 7.8 1.2 23.3 1.8 68.9 2.0Total 18.5 0.8 20.7 0.8 60.8 1.0
Persons 18–24 23.6 2.4 9.1 1.6 67.3 2.725–34 31.2 2.2 14.5 1.4 54.3 2.335–44 24.7 1.5 24.5 1.5 50.8 1.745–54 20.3 1.4 30.0 1.5 49.8 1.755–64 14.0 1.2 29.9 1.7 56.1 1.865+ 7.4 0.9 34.5 1.5 58.1 1.6Total 20.5 0.7 24.1 0.7 55.4 0.8
* A person who smokes daily or occasionally is categorised as a current smoker. SE = standard error. Note figures may not add to 100 per cent due to a proportion of ‘Don’t know’ or ‘refused’ responses.

22 Victorian Population Health Survey 2006 – Selected findings
Table 2.23 shows smoking status, by age group and sex. Males in the 25–34 year age group were found to have the highest prevalence of current smoking, at 36.2 per cent, followed by males in the 35–44 year age group, at 25.3 per cent. For females, the highest prevalence for current smoking was also in the 25–34 year age group, at 26.4 per cent, followed by females in the 35–44 year age group, at 24.2 per cent.
Table 2.24: Frequency of current* smoking behaviour
Age group (years)Daily Occasional**
% SE(%) % SE(%)Males
18–24 16.5 2.9 7.4 2.4
25–34 24.0 3.3 12.1 3.0
35–44 21.7 2.3 3.6 1.1
45–54 19.4 2.1 4.6 1.1
55–64 13.5 1.8 1.7 0.6
65+ 6.4 1.1 0.6 0.3
Total 17.5 1.0 5.1 0.8
Females
18–24 15.9 2.6 7.4 2.3
25–34 21.6 2.0 4.8 1.2
35–44 19.0 1.6 5.3 1.0
45–54 14.7 1.5 1.8 0.4
55–64 11.7 1.4 1.3 0.4
65+ 6.2 1.1 1.6 0.6
Total 14.9 0.7 3.6 0.4
Persons
18–24 16.2 2.0 7.4 1.7
25–34 22.8 1.9 8.5 1.6
35–44 20.3 1.4 4.4 0.7
45–54 17.0 1.3 3.2 0.6
55–64 12.6 1.2 1.5 0.4
65+ 6.3 0.8 1.1 0.4
Total 16.2 0.6 4.4 0.4
* A person who smokes daily or occasionally is categorised as a current smoker. **The term occasional does not refer to a specific frequency. It is defined by the respondent who chooses the response option ‘I smoke occasionally’ when asked which of a number of alternative response options (including ‘I smoke daily”) best describes their smoking status. SE = standard error. Note figures may not add to 100 per cent due to a proportion of ‘Don’t know’ or ‘refused’ responses.
Persons who smoked cigarettes were asked if they did so on a daily or occasional basis and this is shown in table 2.22. Most who were categorised as current smokers smoked daily, as opposed to occasionally. Although males in the 25–34 year age group had the highest prevalence of being current smokers, 12.1 per cent smoked occasionally rather than daily (table 2.24).

Victorian Population Health Survey 2006 – Selected findings 23
Figure 2.10: Smoking status, by age – males
Figure 2.11: Smoking status, by age – females
Table 2.25: Smoking in the home by area of State
Smoking in the homeMetropolitan Non-Metropolitan Victoria% SE(%) % SE(%) % SE(%)
My home is smoke free 88.9 0.7 87.1 0.6 88.4 0.5People occasionally smoke inside the house
5.5 0.5 6.1 0.4 5.6 0.4
People frequently smoke in the house
5.7 0.5 6.7 0.5 6.0 0.4
Table 2.25 shows the status of smoking in home, by area of state. Most homes (88.4 per cent) are smoke free. Over one in 20 households (6.0 per cent) reported people frequently smoking in the house.

24 Victorian Population Health Survey 2006 – Selected findings
Table 2.26: Smoking in the home and current smoking status by household type (presence of children)
Household type (presence of children)Current smoker Ex-smoker Non-smoker
% SE(%) % SE(%) % SE(%)Households with dependent children My home is smoke free 79.1 2.2 96.4 0.8 94.4 0.9
People occasionally smoke inside the house 10.7 1.5 2.6 0.7 3.0 0.7
People frequently smoke in the house 10.2 1.7 1.0 0.4 2.6 0.6
Households without dependent children
My home is smoke free 58.7 2.5 90.3 1.2 94.0 0.8
People occasionally smoke inside the house 12.9 1.5 6.8 1.0 3.6 0.5
People frequently smoke in the house 28.4 2.3 2.9 0.6 2.4 0.6
All households
My home is smoke free 68.2 1.7 92.3 0.8 94.2 0.6
People occasionally smoke inside the house 12.1 1.1 5.5 0.7 3.3 0.4
People frequently smoke in the house 19.7 1.4 2.3 0.4 2.5 0.4
SE = standard error. Note figures may not add to 100 per cent due to a proportion of ‘Don’t know’ or ‘refused’ responses.
Almost one in five households (19.7 per cent) where there was at least one smoker were described as places where people frequently smoke in the house. This proportion reduced to just over one in ten (10.2 per cent) where dependent children were present, compared to 28.4 per cent where there were no dependent children present (table 2.26).
Physical activityPhysical activity is a major modifiable risk factor for a range of diseases and conditions, including cardiovascular disease, diabetes, some cancers, obesity and falls among the elderly. Together with evidence that more health benefits accrue with more physical activity and that the protective effect of physical activity occurs even if adopted in middle and later life, this suggests physical activity is an obvious target for health promotion. Monitoring physical activity at the population level is relevant for investigating the outcomes of such health promotion efforts.
Victorian Population Health Survey 2006 – Selected findings 25
Table 2.27: Types of physical activity undertaken during the previous week, by age group and sex
Age group (years)
Sedentary Walking only Vigorous activity only
Walking and vigorous activity
% SE(%) % SE(%) % SE(%) % SE(%)Males
18–24 3.9 1.6 10.1 2.6 8.5 2.6 73.9 3.9
25–34 2.1 0.8 21.3 3.3 5.7 1.6 64.7 3.7
35–44 3.7 1.1 28.1 2.6 5.2 1.1 60.4 2.8
45–54 6.1 1.3 28.6 2.4 5.5 1.2 56.4 2.6
55–64 5.3 1.6 37.3 2.9 4.9 1.3 50.0 2.9
65+ 7.1 1.1 41.0 2.3 4.9 1.1 43.0 2.3
Total 4.6 0.5 27.8 1.2 5.7 0.6 58.1 1.3
Females
18–24 2.5 1.0 18.3 3.1 2.7 1.3 73.9 3.4
25–34 3.7 0.9 16.3 2.0 6.0 1.2 72.8 2.4
35–44 3.8 0.8 17.7 1.6 6.1 1.0 69.5 1.9
45–54 3.8 0.8 26.5 1.9 3.2 0.7 64.1 2.1
55–64 4.8 0.9 33.1 2.2 4.7 0.9 55.4 2.2
65+ 12.7 1.6 41.5 2.2 5.7 1.0 35.4 2.1
Total 5.4 0.5 25.7 0.9 4.9 0.4 61.3 1.0
Persons
18–24 3.2 0.9 14.1 2.0 5.6 1.5 73.9 2.6
25–34 2.9 0.6 18.8 1.9 5.8 1.0 68.8 2.2
35–44 3.7 0.7 22.9 1.5 5.6 0.7 65.0 1.7
45–54 4.9 0.8 27.5 1.5 4.3 0.7 60.3 1.7
55–64 5.0 0.9 35.2 1.8 4.8 0.8 52.7 1.8
65+ 10.2 1.0 41.3 1.6 5.4 0.7 38.8 1.6
Total 5.0 0.3 26.7 0.7 5.3 0.4 59.7 0.8
SE = standard error. Note figures may not add to 100 per cent due to a proportion of ‘Don’t know’ or ‘refused’ responses.
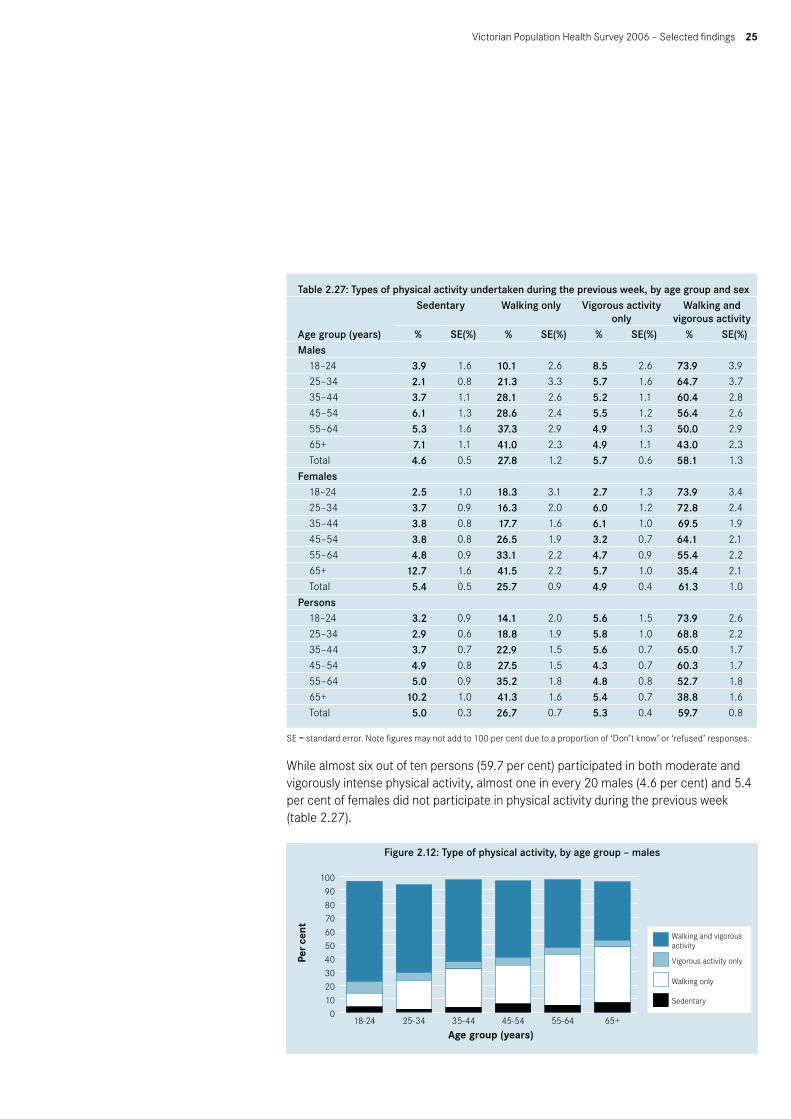
While almost six out of ten persons (59.7 per cent) participated in both moderate and vigorously intense physical activity, almost one in every 20 males (4.6 per cent) and 5.4 per cent of females did not participate in physical activity during the previous week (table 2.27).
Figure 2.12: Type of physical activity, by age group – males

26 Victorian Population Health Survey 2006 – Selected findings
Figure 2.13: Types of physical activity, by age group – females
Table 2.28: Adequacy of physical activity, by sex 2002–06Adequacy of physical activity undertaken during the previous week
2002 2003 2004 2005 2006
% SE(%) % SE(%) % SE(%) % SE(%) % SE(%)
Males Sedentary 9.0 0.7 8.4 0.7 6.2 0.6 6.4 0.6 4.6 0.5
Insufficient time and/or sessions
29.9 1.1 28.7 1.1 30.2 1.1 27.5 1.1 27.1 1.1
Sufficient time and sessions 59.8 1.2 61.4 1.2 58.6 1.2 64.3 1.2 64.5 1.2
Females
Sedentary 8.1 0.5 7.6 0.5 7.7 0.6 5.3 0.4 5.4 0.5
Insufficient time and/or sessions
36.4 1.0 31.8 0.9 31.9 0.9 29.1 0.9 28.1 0.9
Sufficient time and sessions 54.3 1.0 57.6 1.0 55.1 1.0 63.3 1.0 63.7 1.0
Persons
Sedentary 8.5 0.4 8.0 0.4 7.0 0.4 5.8 0.4 5.0 0.3
Insufficient time and/or sessions
33.2 0.7 30.3 0.7 31.1 0.7 28.3 0.7 27.6 0.7
Sufficient time and sessions 57.0 0.8 59.5 0.8 56.8 0.8 63.8 0.8 64.1 0.8
SE = standard error. Note figures may not add to 100 per cent due to a proportion of ‘Don’t know’ or ‘refused’ responses.
The proportion of persons undertaking sufficient time and sessions in relation to physical activity has risen from 57.0 per cent in 2002 to 64.1 per cent in 2006. The proportion categorised as sedentary has decreased from 8.5 per cent in 2002 to 5.0 per cent in 2006 (table 2.28).

Victorian Population Health Survey 2006 – Selected findings 27
Table 2.29: Types of physical activity undertaken during the previous week, by age group and sex
Age group (years)Sedentary
Insufficient time and/or sessions
Sufficient time and sessions
% SE(%) % SE(%) % SE(%)Males
18–24 3.9 1.6 20.2 3.5 72.3 3.9
25–34 2.1 0.8 24.8 3.2 66.9 3.5
35–44 3.7 1.1 28.7 2.6 64.9 2.7
45–54 6.1 1.3 24.7 2.2 65.7 2.5
55–64 5.3 1.6 31.6 2.8 60.5 3.0
65+ 7.1 1.1 32.2 2.2 56.7 2.3
Total 4.6 0.5 27.1 1.1 64.5 1.2
Females
18–24 2.5 1.0 23.9 3.4 71.0 3.5
25–34 3.7 0.9 22.4 2.1 72.7 2.3
35–44 3.8 0.8 25.2 1.8 68.1 1.9
45–54 3.8 0.8 27.3 1.9 66.4 2.0
55–64 4.8 1.0 31.7 2.1 61.5 2.2
65+ 12.7 1.6 37.6 2.1 45.0 2.2
Total 5.4 0.5 28.1 0.9 63.7 1.0
Persons
18–24 3.2 0.9 22.0 2.5 71.7 2.6
25–34 2.9 0.6 23.6 1.9 69.8 2.1
35–44 3.7 0.7 26.9 1.6 66.5 1.6
45–54 4.9 0.8 26.0 1.5 66.1 1.6
55–64 5.0 0.9 31.7 1.8 61.0 1.8
65+ 10.2 1.0 35.2 1.5 50.2 1.6
Total 5.0 0.3 27.6 0.7 64.1 0.8
SE = standard error. Note figures may not add to 100 per cent due to a proportion of ‘Don’t know’ or ‘refused’ responses.
Over one in four persons (27.6 per cent) were categorised as having insufficient time/and or sessions in relation to physical activity, and a further 5.0 per cent were categorised as sedentary. The highest proportion of both males and females reporting sufficient time and sessions was in the 18–24 year and 25–34 year age group and the lowest was for those in the 65 year and over age group. Over one in ten persons aged 65 years and over (10.2 per cent) were categorised as sedentary, with 12.7 per cent of females and 7.1 per cent of males categorised as such (table 2.29).

28 Victorian Population Health Survey 2006 – Selected findings
Figure 2.14: Level of physical activity, by age group – males
Figure 2.15: Level of physical activity, by age group – females
Table 2.30: Activity level by self-reported health status
Activity levelExcellent Very good Good Fair Poor% SE(%) % SE(%) % SE(%) % SE(%) % SE(%)
Sedentary 3.3 0.8 3.5 0.5 5.7 0.6 6.1 1.0 16.6 3.3
Insufficient time and/or sessions
18.5 1.6 24.1 1.2 30.8 1.3 35.7 2.2 33.4 4.0
Sufficient time and sessions 74.9 1.9 69.4 1.3 60.4 1.3 55.2 2.2 43.3 4.3
SE = standard error. Note figures may not add to 100 per cent due to a proportion of ‘Don’t know’ or ‘refused’ responses.

Victorian Population Health Survey 2006 – Selected findings 29
Approximately three quarters (74.9 per cent) of persons who rated their health as excellent undertook sufficient levels of physical activity, compared with 43.3 per cent of those who rated their health as poor. Correspondingly, whereas only 3.3 per cent of those who rated their health as excellent were categorised as sedentary, 16.6 per cent of those who rated themselves as being in poor health did not engage in any physical activity in the week before the survey (table 2.30).
Figure 2.16: Level of physical activity, by self-rated health
30 Victorian Population Health Survey 2006 – Selected findings
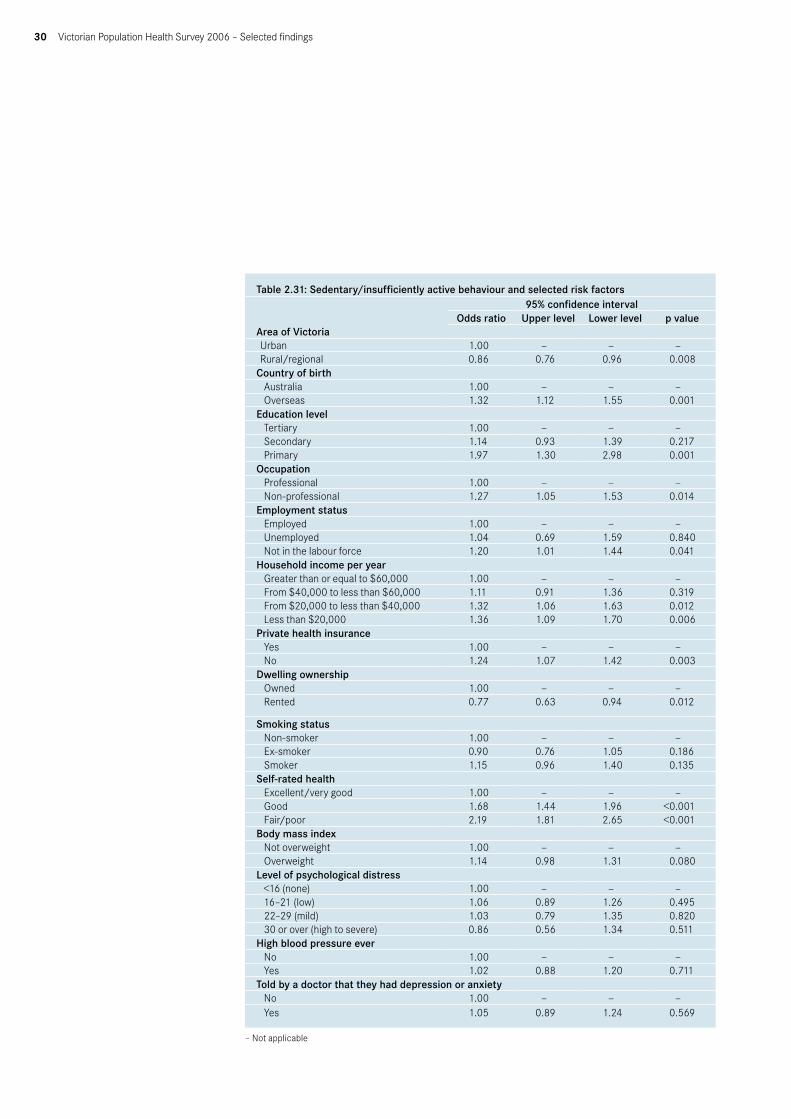
Table 2.31: Sedentary/insufficiently active behaviour and selected risk factors
Area of Victoria
95% confidence intervalOdds ratio Upper level Lower level p value
Urban 1.00 — — —Rural/regional 0.86 0.76 0.96 0.008
Country of birth Australia 1.00 — — —Overseas 1.32 1.12 1.55 0.001
Education level Tertiary 1.00 — — —Secondary 1.14 0.93 1.39 0.217Primary 1.97 1.30 2.98 0.001
Occupation Professional 1.00 — — —Non-professional 1.27 1.05 1.53 0.014
Employment status Employed 1.00 — — —Unemployed 1.04 0.69 1.59 0.840Not in the labour force 1.20 1.01 1.44 0.041
Household income per year Greater than or equal to $60,000 1.00 — — —From $40,000 to less than $60,000 1.11 0.91 1.36 0.319From $20,000 to less than $40,000 1.32 1.06 1.63 0.012Less than $20,000 1.36 1.09 1.70 0.006
Private health insurance Yes 1.00 — — —No 1.24 1.07 1.42 0.003
Dwelling ownership Owned 1.00 — — —Rented 0.77 0.63 0.94 0.012
Smoking status Non-smoker 1.00 — — —Ex-smoker 0.90 0.76 1.05 0.186Smoker 1.15 0.96 1.40 0.135
Self-rated health Excellent/very good 1.00 — — —Good 1.68 1.44 1.96 <0.001Fair/poor 2.19 1.81 2.65 <0.001
Body mass index Not overweight 1.00 — — —Overweight 1.14 0.98 1.31 0.080
Level of psychological distress <16 (none) 1.00 — — —16–21 (low) 1.06 0.89 1.26 0.49522–29 (mild) 1.03 0.79 1.35 0.82030 or over (high to severe) 0.86 0.56 1.34 0.511
High blood pressure ever No 1.00 — — —Yes 1.02 0.88 1.20 0.711
Told by a doctor that they had depression or anxietyNo 1.00 — — —Yes 1.05 0.89 1.24 0.569
– Not applicable
Victorian Population Health Survey 2006 – Selected findings 31
After adjusting for age and sex, those persons more likely to be categorised as having sedentary behaviour or being insufficiently active were those born overseas, those in non-professional occupations or not in the labour force, those on lower household incomes, those without private health insurance, and those who rated their health as good or fair/poor (table 2.31).
Selected health and screening checksThe survey collected information on routine checks or screening tests that may be performed to detect the presence of risk factors for the development of a disease before its symptoms are manifest. Specifically, the survey collected information on a blood pressure check, a blood test for cholesterol, a test for diabetes or high blood sugar levels and a bowel examination of any type.
Table 2.32: Health checks
Type of screeningMales Females Persons
% SE(%) % SE(%) % SE(%)A blood pressure check 72.5 1.2 83.6 0.8 78.2 0.7
A blood test for cholesterol 51.1 1.3 50.9 1.0 51.0 0.8
A test for diabetes or high blood sugar levels 45.4 1.3 50.1 1.0 47.8 0.8
A bowel examination to detect bowel cancer 14.6 0.8 13.8 0.7 14.2 0.5
Colonoscopy 9.5 0.7 11.2 0.6 10.4 0.4
Faecal Occult Blood test (FOBT) 3.4 0.4 2.7 0.3 3.1 0.3
SE = standard error. Note figures may not add to 100 per cent due to a proportion of ‘Don’t know’ or ‘refused’ responses.
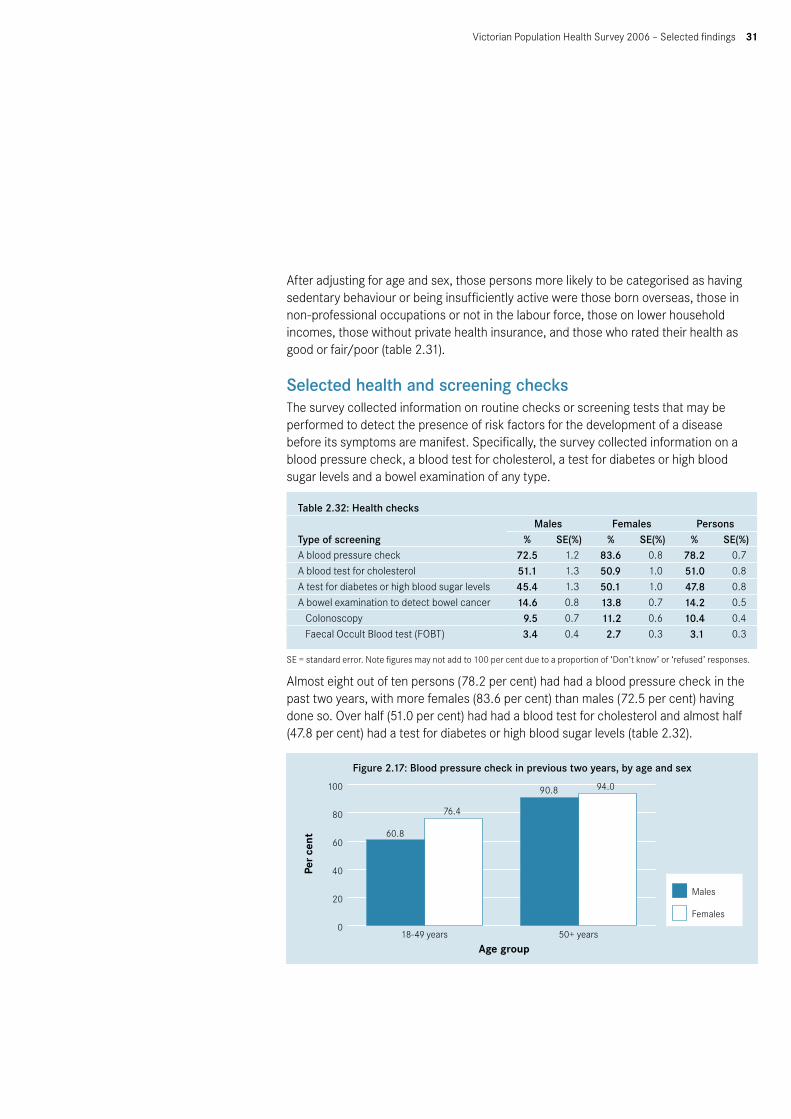
Almost eight out of ten persons (78.2 per cent) had had a blood pressure check in the past two years, with more females (83.6 per cent) than males (72.5 per cent) having done so. Over half (51.0 per cent) had had a blood test for cholesterol and almost half (47.8 per cent) had a test for diabetes or high blood sugar levels (table 2.32).
Figure 2.17: Blood pressure check in previous two years, by age and sex

32 Victorian Population Health Survey 2006 – Selected findings
Figure 2.18: Cholesterol check in previous two years, by age and sex
Figure 2.19: Blood Glucose check in previous two years, by age and sex
Table 2.33: Health checks, by age group and area of State
Type of screening
Metropolitan Non-metropolitan18–49 years 50+ years 18–49 years 50+ years% SE(%) % SE(%) % SE(%) % SE(%)
A blood pressure check 68.9 1.4 92.9 0.8 68.1 1.3 91.6 0.6
A blood test for cholesterol 34.8 1.4 78.2 1.2 30.3 1.2 74.0 1.0A test for diabetes or high blood sugar levels
35.9 1.4 66.4 1.4 35.3 1.2 64.8 1.1
A bowel examination to detect bowel cancer
6.2 0.6 25.9 1.3 6.3 0.6 26.8 1.0
SE = standard error. Note figures may not add to 100 per cent due to a proportion of ‘Don’t know’ or ‘refused’ responses.
Similar proportions of persons in high risk age groups (50 plus years) across metropolitan and non-metropolitan regions had screening tests in the past two years (table 2.33)

Victorian Population Health Survey 2006 – Selected findings 33
Eye healthVision 2020 Australia is the National body working in partnership to prevent avoidable blindness and improve vision care. It leads advocacy efforts, raises community awareness about eye health and vision care and provides a platform for collaboration for more than 50 member organisations.
The Vision Initiative – a public eye health program in Victoria (managed by Vision 2020 Australia) recommends that if people experience any changes to their vision they should have an eye examination right away. If people are over the age of 40 or have a family history of eye disease, having regular eye examinations will help detect any problems early and allow for the best treatment. People with diabetes, people who are 75 years and older, people with a family history of glaucoma and/or Aboriginal and Torres Strait Islander People should have an eye examination every two years. For more information people should visit their optometrist or ophthalmologist or speak to their General Practitioner.
The survey collected information on whether respondents had ever seen an eye specialist, the recency of their last visit and whether they usually wear a hat or sunglasses when they are out in the sun.
Table 2.34: Noticed change in vision in past 12 months
Age group (years)Males Females Persons
% SE(%) % SE(%) % SE(%)18–24 17.6 3.5 31.3 3.8 24.3 2.6
25–34 16.7 2.6 23.1 2.1 19.9 1.7
35–44 26.8 2.5 35.2 1.9 31.1 1.6
45–54 64.4 2.5 68.4 2.0 66.4 1.6
55–64 47.0 2.9 46.8 2.2 46.9 1.8
65+ 42.2 2.3 49.2 2.2 46.1 1.6
Total 35.7 1.2 42.5 1.0 39.2 0.8
SE = standard error. Note figures may not add to 100 per cent due to a proportion of ‘Don’t know’ or ‘refused’ responses.
More than six out of ten males aged 45–54 years and almost seven out of ten females in the same age group (68.4 per cent) noticed a change in their vision in the past 12 months, the highest proportion for any of the age group categories (table 2.34).
Table 2.35: Consultation with an eye care specialist or attendance at an eye clinic
Age group (years)Males Females Persons
% SE(%) % SE(%) % SE(%)18–24 47.3 4.3 66.7 3.7 56.8 2.9
25–34 58.5 3.7 66.7 2.5 62.6 2.2
35–44 55.8 2.8 71.7 1.8 63.8 1.7
45–54 72.6 2.4 88.0 1.4 80.4 1.4
55–64 92.7 1.5 95.0 0.9 93.8 0.9
65+ 92.1 1.4 95.9 0.9 94.3 0.8
Total 69.2 1.3 80.8 0.8 75.1 0.8
SE = standard error. Note figures may not add to 100 per cent due to a proportion of ‘Don’t know’ or ‘refused’ responses.

34 Victorian Population Health Survey 2006 – Selected findings
Table 2.35 shows that a higher proportion of females than males had consulted an eye specialist or attended an eye clinic (80.8 per cent compared to 69.2 per cent respectively).
Table 2.36: Recency of last visit to eye specialist
Age group (years)Males Females Persons
% SE(%) % SE(%) % SE(%)Less than 6 months ago 25.0 1.3 27.7 1.0 26.5 0.8
Between 6 months and 1 year 26.5 1.3 26.2 1.0 26.4 0.8
More than 1 year but less than 2 years 19.5 1.1 21.3 0.9 20.5 0.7
More than 2 years but less than 5 years 17.2 1.2 15.6 0.8 16.3 0.7
5 years or more 11.3 1.0 9.0 0.7 10.0 0.6
SE = standard error. Note figures may not add to 100 per cent due to a proportion of ‘Don’t know’ or ‘refused’ responses.
Most persons who had visited an eye specialist had done so in the past two years, with over one in four females (27.7 per cent) and one in four males (25.0 per cent) having done so in the past 6 months. One in ten persons (10.0 per cent) who had visited an eye specialist had done so 5 or more years ago.
Table 2.37: Eye health related behaviour, by age and sex
Age group (years)Usually wear a hat Usually wear sunglasses
% SE(%) % SE(%)Males
18–24 45.4 4.3 55.7 4.3
25–34 54.5 3.8 69.2 3.7
35–44 63.3 2.8 68.7 2.8
45–54 65.7 2.5 72.4 2.4
55–64 72.9 2.6 69.0 2.6
65+ 76.5 2.1 59.3 2.3
Total 63.1 1.3 66.3 1.3
Females
18–24 18.4 3.1 78.3 3.1
25–34 38.1 2.5 79.5 2.2
35–44 46.2 2.0 83.8 1.5
45–54 47.7 2.1 84.3 1.5
55–64 52.9 2.3 75.9 2.0
65+ 55.3 2.2 74.4 1.9
Total 44.2 1.0 79.6 0.8
Persons
18–24 32.1 2.8 66.8 2.7
25–34 46.3 2.3 74.4 2.1
35–44 54.6 1.7 76.3 1.6
45–54 56.6 1.7 78.4 1.4
55–64 62.8 1.8 72.5 1.6
65+ 64.7 1.6 67.7 1.5
Total 53.4 0.8 73.1 0.7
SE = standard error. Note figures may not add to 100 per cent due to a proportion of ‘Don’t know’ or ‘refused’ responses.

Victorian Population Health Survey 2006 – Selected findings 35
A higher proportion of males than females across all age groups reported they usually wear a hat when they go out in the sun. Overall 63.1 per cent of males and 44.2 per cent of females indicated they usually wear a hat when they go out in the sun (table 2.37).
Most adults (73.1 per cent) usually wear sunglasses when going out in the sun. The highest proportion was in the 45–54 year age group for both females and males, at 84.3 per cent and 72.4 per cent respectively.
Figure 2.20: Eye-related sun protection – males
Figure 2.21: Eye-related sun protection – females

36 Victorian Population Health Survey 2006 – Selected findings
Folate consumptionA set of questions relating to the knowledge and consumption of folate is included in the survey. Females aged 18–50 years inclusive were asked about current consumption of folate supplements or multivitamins containing folate, the main reason why women in their age group may be advised to take folate or folic acid, the main reason for consuming folate and the main source of information about folate or folic acid.
Table 2.38: Consumption of folate by age group, females
Currently taking a folate supplement or a multivitamin containing folate
18–24 years 25–34 years 35–50 yearsAll (18–50
years)% SE(%) % SE(%) % SE(%) % SE(%)
No 73.1 3.6 66.3 2.4 69.6 1.5 69.3 1.3
Yes, daily 15.9 2.8 28.0 2.3 22.8 1.4 23.0 1.1
Yes, 1–3 times per week 3.3 1.5 2.1 0.8 2.6 0.5 2.6 0.5
Yes, 4–6 times per week 1.3 0.9 0.6 0.5 0.6 0.2 0.8 0.3
Yes, less often 2.9 1.7 0.1 0.1 0.8 0.3 1.0 0.4
Don’t know 3.5 1.6 2.8 0.9 3.6 0.6 3.4 0.5
SE = standard error. Note figures may not add to 100 per cent due to a proportion of ‘Don’t know’ or ‘refused’ responses.
Almost seven out of 10 females aged 18–50 years (69.3 per cent) were not consuming folate supplements or any multivitamins containing folate. Over one in five females in this age group were taking folate daily (23.0 per cent) (table 2.38).
Table 2.39: Knowledge of reasons for taking folate/folic acid
Know main reason that women in age group might be advised to take folate or folic acid
18–24 years 25–34 years 35–50 yearsAll (18–50
years)% SE(%) % SE(%) % SE(%) % SE(%)
No 51.9 4.0 25.5 2.2 32.6 1.5 34.3 1.3
Yes, to help prevent birth defects 6.7 1.9 11.5 1.6 7.3 0.8 8.4 0.8
Yes, to improve general health 5.8 2.2 1.9 0.7 7.0 0.9 5.2 0.7
Yes, to balance the diet 1.2 0.7 1.5 0.5 3.4 0.6 2.4 0.4
Yes, pregnancy related issue 27.4 3.6 49.7 2.6 27.0 1.4 33.9 1.3
Yes, menopause/other ageing related issue
0.0 0.0 0.4 0.4 2.7 0.6 1.5 0.3
Yes, anaemia/iron deficiency/other blood related issues
3.6 1.7 3.7 1.1 10.7 1.0 7.1 0.7
Yes, osteoporosis/arthritis/other bone related issues
0.0 0.0 2.7 0.9 5.7 0.7 3.6 0.5
Other 0.0 0.0 1.2 0.7 0.9 0.3 0.8 0.3
Don’t know 3.4 1.7 1.9 0.7 2.6 0.5 2.6 0.5
SE = standard error. Note figures may not add to 100 per cent due to a proportion of ‘Don’t know’ or ‘refused’ responses.
Over half of all females in the 18–24 year age group (51.9 per cent) did not know the main reason women in their age group might be advised to take folate or folic acid. Almost half of all females in the 25–34 years age group (49.7 per cent) knew that consumption of folate was a pregnancy related issue (table 2.39).

Victorian Population Health Survey 2006 – Selected findings 37
Table 2.40: Main reason for taking folate (for those females currently taking a folate supplement or a multivitamin containing folic acid)
Main reason for taking folate18–24 years 25–34 years 35–50 years
All (18–50 years)
% SE(%) % SE(%) % SE(%) % SE(%)Because I could become pregnant 0.0 0.0 6.2 2.0 2.9 1.1 3.5 0.9Because I am trying to become pregnant
2.1 2.1 12.4 3.0 7.4 1.6 8.2 1.3
Because I am pregnant 4.5 2.5 18.5 3.6 5.7 1.4 9.8 1.5
For my general health 40.4 8.4 28.4 4.1 46.5 3.1 39.3 2.6
It’s part of a multivitamin 20.7 6.5 18.4 3.7 18.6 2.4 18.9 2.0
Other 26.6 7.7 15.0 3.3 18.1 2.4 18.5 2.1
Don’t know 4.7 3.7 1.1 0.9 0.8 0.3 1.6 0.7
SE = standard error. Note figures may not add to 100 per cent due to a proportion of ‘Don’t know’ or ‘refused’ responses.
The most common reason for taking folate for women across all age groups was for their general health. Almost one in five females age 25–34 years (18.5 per cent) were taking folate because they were pregnant, with a further 12.4 per cent taking folate because they were trying to become pregnant (table 2.40).
Table 2.41: Reasons for females not taking folate
Reason for not taking folate18–24 years 25–34 years 35–50 years
All (18–50 years)
% SE(%) % SE(%) % SE(%) % SE(%)No reason/do not know anything about folate
72.3 4.2 44.6 3.2 47.5 2.0 51.9 1.6
Because I’m health/don’t think I need it
6.1 2.0 12.0 2.3 16.9 1.4 13.2 1.1
Because I’m not planning to become pregnant
8.1 2.5 20.3 2.5 13.5 1.3 14.3 1.1
Because I’m not pregnant 5.0 2.3 10.8 1.8 5.4 0.8 6.9 0.8
Because it’s too expensive 0.0 0.0 1.9 0.9 1.3 0.4 1.2 0.3
Because it’s too much trouble 1.4 1.2 1.8 0.8 1.2 0.4 1.4 0.4Because I obtain enough from food
4.2 2.3 5.1 1.3 8.4 1.0 6.6 0.8
Because I’m on other medication
0.0 0.0 0.3 0.2 1.3 0.5 0.7 0.2
Other 1.1 0.9 1.5 0.6 2.9 0.7 2.1 0.4
Don’t know 1.4 0.7 1.7 1.0 1.5 0.5 1.5 0.4
SE = standard error. Note figures may not add to 100 per cent due to a proportion of ‘Don’t know’ or ‘refused’ responses.
The most common reason for women across all age groups for not taking folate was no reason/do not know anything about folate. Over one in five females aged 25–34 years who were not taking folate (20.3 per cent) stated the reason that they did not take folate was because they were not planning to become pregnant (table 2.41).

38 Victorian Population Health Survey 2006 – Selected findings
Table 2.42: Main source of information about folate or folic acid
Main source of information18–24 years 25–34 years 35–50 years
All (18–50 years)
% SE(%) % SE(%) % SE(%) % SE(%)Radio 0.0 0.0 0.1 0.1 0.8 0.4 0.4 0.2
Television 6.7 3.2 10.6 2.1 7.8 1.1 8.6 1.0
Magazines and newspapers 7.3 2.7 7.6 1.7 13.5 1.3 10.6 1.0
Internet 1.4 1.4 2.4 0.9 3.5 0.8 2.8 0.6
Brochure 0.5 0.5 1.3 0.5 4.0 0.8 2.6 0.5
Family and friends 8.5 4.1 6.4 1.5 5.4 1.0 6.2 0.9
General practitioner/doctor 15.1 4.4 37.5 3.0 27.5 1.8 29.1 1.5
Other health professional 13.7 5.1 9.2 1.7 12.0 1.2 11.3 1.2
Other 32.1 5.6 14.5 2.4 10.1 1.1 14.8 1.3
Don’t know 14.2 3.8 10.4 2.1 15.1 1.4 13.4 1.2
SE = standard error. Note figures may not add to 100 per cent due to a proportion of ‘Don’t know’ or ‘refused’ responses.
General Practitioners were reported as the main source of information about folate or folic acid by almost three out of ten females (29.1 per cent) aged 18–50 years (table 2.42).
Food securityRespondents were asked if on any occasion in the past 12 months, there were times when they ran out of food and could not afford to buy any more. The results are shown in table 2.43.
Table 2.43: Food securityRan out of food in the past 12 months, and could not afford to buy more
Males Females Persons
% SE(%) % SE(%) % SE(%)18–24 9.3 2.3 6.4 1.8 7.9 1.5
25–34 7.0 1.8 9.8 1.5 8.4 1.2
35–44 5.4 1.2 6.2 0.8 5.7 0.7
45–54 3.0 0.7 5.3 1.0 4.2 0.6
55–64 1.4 0.6 2.5 0.6 2.0 0.4
65+ 0.5 0.2 1.0 0.3 0.8 0.2
Total 4.5 0.5 5.2 0.4 4.9 0.3
SE = standard error. Note figures may not add to 100 per cent due to a proportion of ‘Don’t know’ or ‘refused’ responses.
Approximately one in twenty persons (4.9 per cent) reported running out of food on at least one occasion in the past 12 months and being unable to afford to buy more, with almost one in ten females aged 25–34 years and 9.3 per cent of males aged 18–24 years doing so.

Victorian Population Health Survey 2006 – Selected findings 39
Figure 2.22: Running out of food and unable to afford more in the past 12 months
Persons in the survey were also asked if there were any reasons why they don’t always have the quality or variety of food they want, by responding to the statement in table 2.44 below.
Table 2.44: Reasons people don’t have the quality or variety of food they want% SE
Some foods are too expensive, in particular fresh fruit and vegetables 30.7 0.8
I can’t get food of the right quality 23.6 0.7
I can’t get a variety of food, for example, a mixture of meat, vegetables, fruit, dairy, bread and pasta
9.3 0.5
Culturally appropriate foods are not available 5.5 0.4
Inadequate and unreliable public transport makes it difficult for me to get to the shops
8.0 0.4
Over three out of 10 persons (30.7 per cent) aged 18 years and over agreed that some foods were too expensive, in particular fresh fruit and vegetables. Almost one in four (23.6 per cent) agreed that they could not get food of the right quality.

40 Victorian Population Health Survey 2006 – Selected findings
3 Self-reported health and selected health conditions
Respondents to the Victorian Population Health Survey were asked to summarise their perceptions of their health status by indicating whether, in general, they would say their health was excellent, very good, good, fair or poor. This measure of health status is simple and global. It has been increasingly used in studies that seek to understand the factors that contribute to the level of health achieved and health inequalities, including differences that occur by gender, race or ethnicity, education or income, disability and geographic location.1–3
Self-rated health assessments have been found to be a powerful predictor of future health care use and mortality, independent of other medical, behavioural or psychosocial risk factors.4,5 The survey also collected information on arthritis, heart disease, stroke, cancer, osteoporosis and anxiety/depression.
Summary• Self-reported health: Most respondents reported their health as either
excellent, very good or good, a pattern consistent over the years 2001–06.• Over one in five persons aged 65 years and over (20.8 per cent) reported their
health as either fair or poor. Females aged 65 years and over reported the highest prevalence of poor health (6.4 per cent). For males, almost one in 20 (4.9 per cent) in the 55–64 years age group reported poor health.
• Risk factors for poor health: After adjusting for age and sex, those persons most likely to report fair/poor health were those with lower education levels, in non-professional occupations, unemployed or not in the labour force, living in rented dwellings, on lower household incomes, smokers, those overweight or obese, and those not having sufficient levels of physical activity.
• Selected health conditions: Over six out of 10 females (63.6 per cent) aged 65 years and over reported that they had been told by a doctor that they had arthritis. Over four in 10 males (42.3 per cent) aged 65 years and over had been diagnosed with arthritis by a doctor.
• Over one in five females (21.8 per cent) aged 65 years or over reported they had been told by a doctor that they had osteoporosis.
• More than one in four males (28.8 per cent) aged 65 years or over reported they had been told by a doctor they had been diagnosed with heart disease. A lower proportion of females (18.3 per cent) in the same age group had also been diagnosed with heart disease.
• The prevalence of stroke amongst those aged 65 years or over was 6.3 per cent and 3.6 per cent for those aged 55–64 years.
• Almost one in five males (18.9 per cent) aged 65 years and over and 16.0 per cent of females in the same age group had been told by a doctor that they had some form of cancer.

Victorian Population Health Survey 2006 – Selected findings 41
• A higher proportion of females (22.4 per cent) than males (13.7 per cent) had been diagnosed with depression or anxiety. Amongst those aged 65 years and over, 16.2 per cent of females and 11.5 per cent of males had been diagnosed with depression or anxiety.
• Those persons with primary levels of education only were 1.48 times, or 48 per cent more likely to have fair/poor self-rated health status compared to those persons with tertiary levels of education.
• Those persons in non-professional occupations were 1.4 times, or 40 per cent more likely to report fair/poor self rated-health compared to persons in professional occupations.
• Those persons unemployed or not in the labour force were 2.58 and 2.08 times respectively more likely to self report fair/poor health compared to persons who were employed.
• Current smokers were 2.26 time more likely to self report fair/poor health than non-smokers.
• Persons with high levels of psychological distress were over eight times more likely to report fair/poor health than those with no levels of psychological distress.
Self-reported healthTable 3.1 shows the self-reported health by sex for the period 2001–06. Most respondents reported their health as either excellent, very good or good, a pattern consistent over the years 2001–06. A small proportion of approximately 3 per cent reported their health as poor over the period.
Patterns of self-reported health were also similar for males and females over this time period.
Table 3.1: Self-reported health 2001 2002 2003 2004 2005 2006Males % SE(%) % SE(%) % SE(%) % SE(%) % SE(%) % SE(%)
Excellent 14.2 0.9 13.4 0.9 11.2 0.8 12.4 0.8 11.5 0.8 12.6 0.8Very good 32.8 1.1 31.6 1.1 31.9 1.1 30.9 1.1 33.3 1.2 34.9 1.3Good 35.1 1.2 36.4 1.2 40.8 1.2 39.3 1.2 37.0 1.2 36.5 1.3Fair 15.0 0.9 15.2 0.8 13.4 0.8 14.6 0.9 14.6 0.9 13.1 0.8Poor 2.8 0.4 3.5 0.4 2.6 0.4 2.7 0.4 3.5 0.4 2.9 0.4
Females Excellent 14.5 0.7 13.5 0.7 13.2 0.7 13.5 0.7 11.5 0.6 12.8 0.7Very good 35.0 1.0 35.7 1.0 35.4 1.0 33.6 0.9 34.3 1.0 34.7 1.0Good 32.6 1.0 34.7 1.0 36.8 1.0 36.5 0.9 37.0 1.0 37.6 1.0Fair 14.1 0.7 13.5 0.7 12.1 0.7 12.7 0.7 13.7 0.7 10.9 0.6Poor 3.8 0.4 2.7 0.3 2.5 0.3 3.7 0.4 3.3 0.4 3.8 0.4
Persons Excellent 14.4 0.5 13.4 0.6 12.3 0.5 13.0 0.5 11.5 0.5 12.7 0.5Very good 33.9 0.7 33.7 0.7 33.7 0.7 32.3 0.7 33.8 0.8 34.7 0.8Good 33.8 0.8 35.5 0.8 38.7 0.8 37.9 0.8 37.0 0.8 37.1 0.8Fair 14.6 0.5 14.3 0.5 12.7 0.5 13.6 0.5 14.1 0.6 12.0 0.5Poor 3.3 0.3 3.1 0.3 2.6 0.2 3.2 0.3 3.4 0.3 3.3 0.3
SE = standard error. Note figures may not add to 100 per cent due to a proportion of ‘Don’t know’ or ‘refused’ responses.

42 Victorian Population Health Survey 2006 – Selected findings
The pie chart in figure 3.1 shows that in 2006 most persons aged 18 years and over report their health as either excellent (13%) very good (35%) or good (37%). Only a small proportion (3%) rate their health as poor.
Figure 3.1: Self-reported health, 2006
Figure 3.2: Self-reported health – persons
Figure 3.3: Self-reported health, by age-group – males

Victorian Population Health Survey 2006 – Selected findings 43
Figure 3.4: Self-reported health, by age-group – females
Table 3.2: Self-reported health, by age group and sex
Age group (years)Excellent Very good Good Fair Poor% SE(%) % SE(%) % SE(%) % SE(%) % SE(%)
Males18–24 10.6 2.6 41.5 4.3 35.6 4.2 10.9 2.7 1.3 0.8
25–34 9.0 2.1 39.2 3.8 38.6 3.8 11.2 2.0 2.0 1.0
35–44 10.8 1.8 34.4 2.7 41.5 2.8 11.3 1.7 2.1 0.8
45–54 15.2 2.0 32.2 2.5 34.9 2.5 14.9 1.8 2.6 0.8
55–64 17.1 2.2 30.9 2.8 31.9 2.6 15.2 2.2 4.9 1.2
65+ 13.6 1.6 31.3 2.2 34.1 2.2 15.8 1.7 4.5 1.0
Total 12.6 0.8 34.9 1.3 36.5 1.3 13.1 0.8 2.9 0.4
Females18–24 9.5 2.6 35.2 3.8 39.2 3.9 11.6 2.3 4.5 1.9
25–34 9.8 1.4 34.1 2.4 42.8 2.6 10.7 1.6 2.6 0.8
35–44 12.5 1.3 37.9 1.9 37.5 2.0 9.6 1.1 2.4 0.5
45–54 14.3 1.5 35.6 2.0 37.5 2.1 9.5 1.2 3.1 0.7
55–64 18.4 1.7 37.4 2.2 31.3 2.1 8.8 1.2 3.7 0.8
65+ 12.7 1.4 29.0 2.0 36.3 2.1 14.6 1.6 6.4 1.3
Total 12.8 0.7 34.7 1.0 37.6 1.0 10.9 0.6 3.8 0.4
Persons18–24 10.1 1.8 38.4 2.9 37.4 2.8 11.3 1.8 2.9 1.0
25–34 9.4 1.2 36.6 2.3 40.7 2.3 10.9 1.3 2.3 0.7
35–44 11.6 1.1 36.2 1.7 39.5 1.7 10.4 1.0 2.3 0.5
45–54 14.7 1.2 33.9 1.6 36.2 1.6 12.2 1.1 2.9 0.5
55–64 17.8 1.4 34.2 1.8 31.6 1.7 12.0 1.2 4.3 0.7
65+ 13.1 1.1 30.0 1.5 35.3 1.5 15.2 1.2 5.6 0.9
Total 12.7 0.5 34.8 0.8 37.1 0.8 12.0 0.5 3.3 0.3
SE = standard error. Note figures may not add to 100 per cent due to a proportion of ‘Don’t know’ or ‘refused’ responses.
Similar proportions of males and females across all age groups report their health as excellent (table 3.2). Almost one in 20 females aged 18–24 years (4.5 per cent) rated their health as poor, compared to 1.3 per cent of males in this same age group. This was second only to females in the 65 years and over age group, where 6.4 per cent rated their health as poor. For males, those in the 55–64 year age group had the highest proportion reporting poor health, at 4.9 per cent, followed by males in the 65 years and over age group, at 4.5 per cent.

44 Victorian Population Health Survey 2006 – Selected findings
Selected health conditions
Table 3.3: Prevalence of selected health conditions, by sex
Males2001 2002 2003 2004 2005 2006
% SE(%) % SE(%) % SE(%) % SE(%) % SE(%) % SE(%)Heart disease 7.5 0.6 6.7 0.5 7.2 0.6 6.7 0.5 8.1 0.6 8.1 0.6Stroke 2.3 0.3 1.8 0.3 1.5 0.2 2.7 0.4 2.3 0.3 2.1 0.3Cancer 6.3 0.5 5.9 0.5 5.6 0.5 5.0 0.5 6.2 0.5 5.2 0.5Osetoporosis – – – – 1.2 0.2 1.8 0.3 1.8 0.3 1.6 0.2Depression or anxiety
12.7 0.8 12.7 0.8 10.9 0.7 13.7 0.8 13.1 0.9 13.7 0.9
Arthritis 18.5 0.9 20.0 0.9 15.7 0.8 16.2 0.8 15.0 0.7 15.0 0.8
Females Heart disease 5.5 0.5 5.2 0.4 4.7 0.4 4.0 0.4 6.0 0.5 5.6 0.4Stroke 1.8 0.3 1.8 0.2 1.8 0.2 2.2 0.3 2.3 0.3 1.8 0.2Cancer 7.5 0.5 6.5 0.4 6.4 0.5 6.5 0.5 6.9 0.4 7.2 0.5Osetoporosis 5.8 0.5 6.1 0.5 6.3 0.5 6.9 0.5 7.0 0.4 7.1 0.5Depression or anxiety
20.6 0.8 19.4 0.8 18.7 0.8 23.5 0.8 22.3 0.8 22.4 0.8
Arthritis 26.1 0.9 25.9 0.9 23.5 0.8 23.4 0.8 24.3 0.8 24.7 0.8
Persons Heart disease 6.5 0.4 5.9 0.3 5.9 0.3 5.3 0.3 7.0 0.4 6.8 0.4Stroke 2.0 0.2 1.8 0.2 1.6 0.2 2.4 0.2 2.0 0.2 1.9 0.2Cancer 6.9 0.4 6.2 0.3 6.0 0.3 5.7 0.3 6.6 0.3 6.3 0.3Osetoporosis – – – – 3.8 0.3 4.4 0.3 4.5 0.3 4.4 0.3Depression or anxiety
16.7 0.6 16.1 0.5 14.9 0.5 18.7 0.6 17.9 0.6 18.1 0.6
Arthritis 22.4 0.6 23.0 0.6 19.7 0.6 19.9 0.6 19.8 0.6 20.0 0.6
SE = standard error. Note figures may not add to 100 per cent due to a proportion of ‘Don’t know’ or ‘refused’ responses.
– Not available
Table 3.3 shows the prevalence of selected health conditions by sex, for the period 2001–06. The prevalence of heart disease, stroke, cancer. Osteoporosis, depression or anxiety and arthritis have remained steady over the period 2001–06.
In 2006, the prevalence of heart disease was approximately 7 per cent, stroke 2 per cent, cancer approximately 6 per cent, depression or anxiety 18 per cent and arthritis 20 per cent
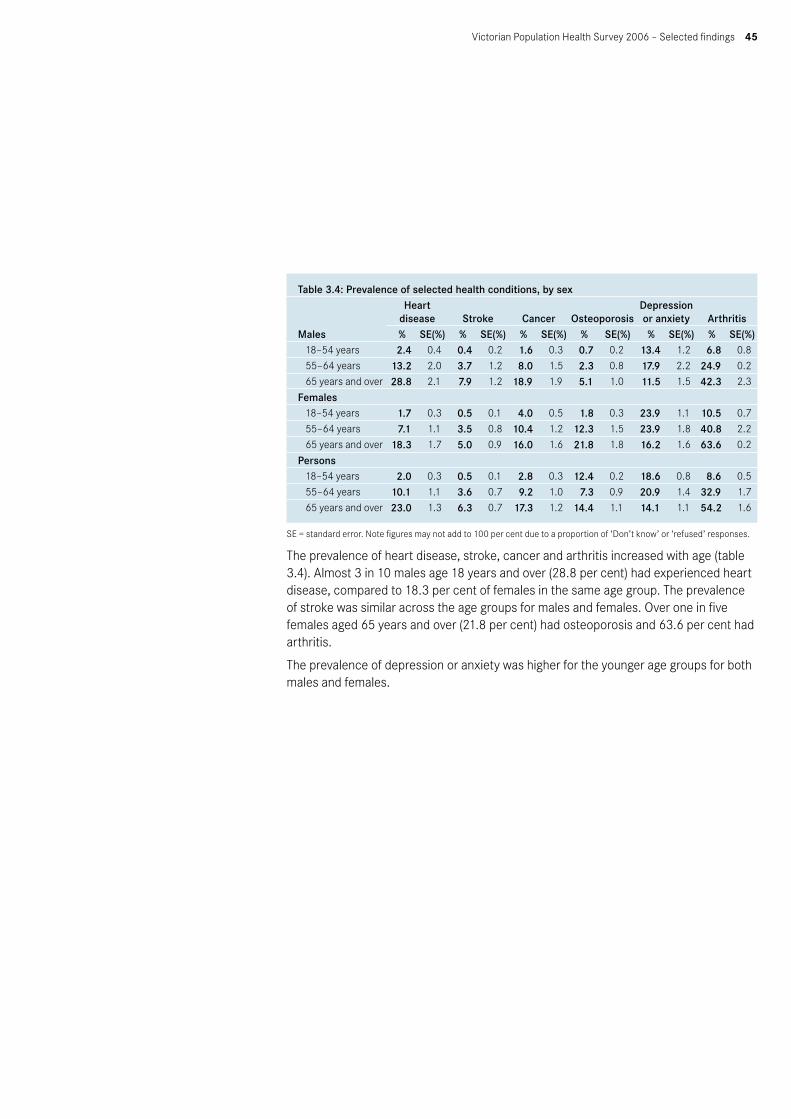
Victorian Population Health Survey 2006 – Selected findings 45
Table 3.4: Prevalence of selected health conditions, by sex
Males
Heart disease Stroke Cancer Osteoporosis
Depression or anxiety Arthritis
% SE(%) % SE(%) % SE(%) % SE(%) % SE(%) % SE(%)18–54 years 2.4 0.4 0.4 0.2 1.6 0.3 0.7 0.2 13.4 1.2 6.8 0.8
55–64 years 13.2 2.0 3.7 1.2 8.0 1.5 2.3 0.8 17.9 2.2 24.9 0.2
65 years and over 28.8 2.1 7.9 1.2 18.9 1.9 5.1 1.0 11.5 1.5 42.3 2.3
Females18–54 years 1.7 0.3 0.5 0.1 4.0 0.5 1.8 0.3 23.9 1.1 10.5 0.7
55–64 years 7.1 1.1 3.5 0.8 10.4 1.2 12.3 1.5 23.9 1.8 40.8 2.2
65 years and over 18.3 1.7 5.0 0.9 16.0 1.6 21.8 1.8 16.2 1.6 63.6 0.2
Persons 18–54 years 2.0 0.3 0.5 0.1 2.8 0.3 12.4 0.2 18.6 0.8 8.6 0.5
55–64 years 10.1 1.1 3.6 0.7 9.2 1.0 7.3 0.9 20.9 1.4 32.9 1.7
65 years and over 23.0 1.3 6.3 0.7 17.3 1.2 14.4 1.1 14.1 1.1 54.2 1.6
SE = standard error. Note figures may not add to 100 per cent due to a proportion of ‘Don’t know’ or ‘refused’ responses.
The prevalence of heart disease, stroke, cancer and arthritis increased with age (table 3.4). Almost 3 in 10 males age 18 years and over (28.8 per cent) had experienced heart disease, compared to 18.3 per cent of females in the same age group. The prevalence of stroke was similar across the age groups for males and females. Over one in five females aged 65 years and over (21.8 per cent) had osteoporosis and 63.6 per cent had arthritis.
The prevalence of depression or anxiety was higher for the younger age groups for both males and females.

46 Victorian Population Health Survey 2006 – Selected findings
Figure 3.5: Reported health conditions, by age group – males
Figure 3.6: Reported health conditions, by age group – females

Victorian Population Health Survey 2006 – Selected findings 47
Table 3.5: Fair/poor self-rated health and selected risk factors
Area of Victoria
95% confidence intervalOdds ratio Upper level Lower level p value
Urban 1.00 — — —Rural/regional 1.03 0.90 1.19 0.644
Country of birth Australia 1.00 — — —Overseas 0.92 0.75 1.12 0.417
Education level Tertiary 1.00 — — —Secondary 1.35 1.06 1.72 0.016Primary 2.71 1.75 4.19 <0.001
Occupation Professional 1.00 — — —Non-professional 1.40 1.08 1.82 0.011
Employment status Employed 1.00 — — —Unemployed 2.58 1.60 4.16 <0.001Not in the labour force 2.08 1.67 2.59 <0.001
Household income per year Greater than or equal to $60,000 1.00 — — —From $40,000 to less than $60,000 1.10 0.82 1.47 0.514From $20,000 to less than $40,000 1.90 1.44 2.49 <0.001Less than $20,000 2.65 2.03 3.45 <0.001
Private health insurance Yes 1.00 — — —No 1.51 1.26 1.80 <0.001
Dwelling ownership Owned 1.00 — — —Rented 1.40 1.11 1.76 0.004
Smoking status Non-smoker 1.00 — — —Ex-smoker 1.26 1.02 1.55 0.029Smoker 2.26 1.81 2.82 <0.001
Physical activity levels Sufficient time and sessions 1.00 — — —Insufficient time and/or sessions 1.63 1.35 1.97 <0.001Sedentary 2.19 1.58 3.02 <0.001
Body mass index Not overweight 1.00 — — —Overweight 1.76 1.45 2.13 <0.001
Level of psychological distress <16 (none) 1.00 — — —16–21 (low) 3.22 2.59 4.01 <0.00122–29 (mild) 5.67 4.31 7.46 <0.00130 or over (high to severe) 8.66 5.66 13.24 <0.001
High blood pressure ever No 1.00 — — —Yes 2.42 2.00 2.92 <0.001
Told by a doctor that they had depression or anxietyNo 1.00 — — —Yes 3.13 2.59 3.78 <0.001
– Not applicable

48 Victorian Population Health Survey 2006 – Selected findings
After adjusting for age and sex, those persons more likely to report fair/poor health were those with lower levels of education, those persons in non-professional occupations, those unemployed or not in the labour force, those on lower household incomes, those without private health insurance, smokers and ex-smokers, those categorised as sedentary or having insufficient physical activity, those categorised as overweight, having higher levels of psychological distress, having previously had high blood pressure or told by a doctor that they have had depression or anxiety (table 3.5).
References1. Hennessy C, Moriarty DG, Zack M, Scherr P & Brackbill R 1994, ‘Measuring health-
related quality of life for public health surveillance’, Public Health Reports, vol. 109, pp. 665–72.
2. Kawachi I, Kennedy B, Glass R 1999, ‘Social capital and self-rated health: a contextual analysis’, American Journal of Public Health, vol. 89, no. 8, pp. 1187–93.
3. Andersen E, Catlin T & Wyrwwich K 2001, ‘Retest reliability and validity of a surveillance measure of health related quality of life’, Quality of Life Research, vol. 10, no. 3, p. 199.
4. Idler E & Benyamini Y 1997, ‘Selfrated health and mortality: a review of twenty-seven community studies’, Journal of Health and Social Behaviour, vol. 38, pp. 21–37.
5. Miilunpalo S,Vuori I & Oja P 1997, ‘Self-rated health as a health measure: the predictive value of self-reported health status on the use of physician services and on mortality in the working age population’, Journal of Clinical Epidemiology, vol. 50, no. 5, pp. 517–28.
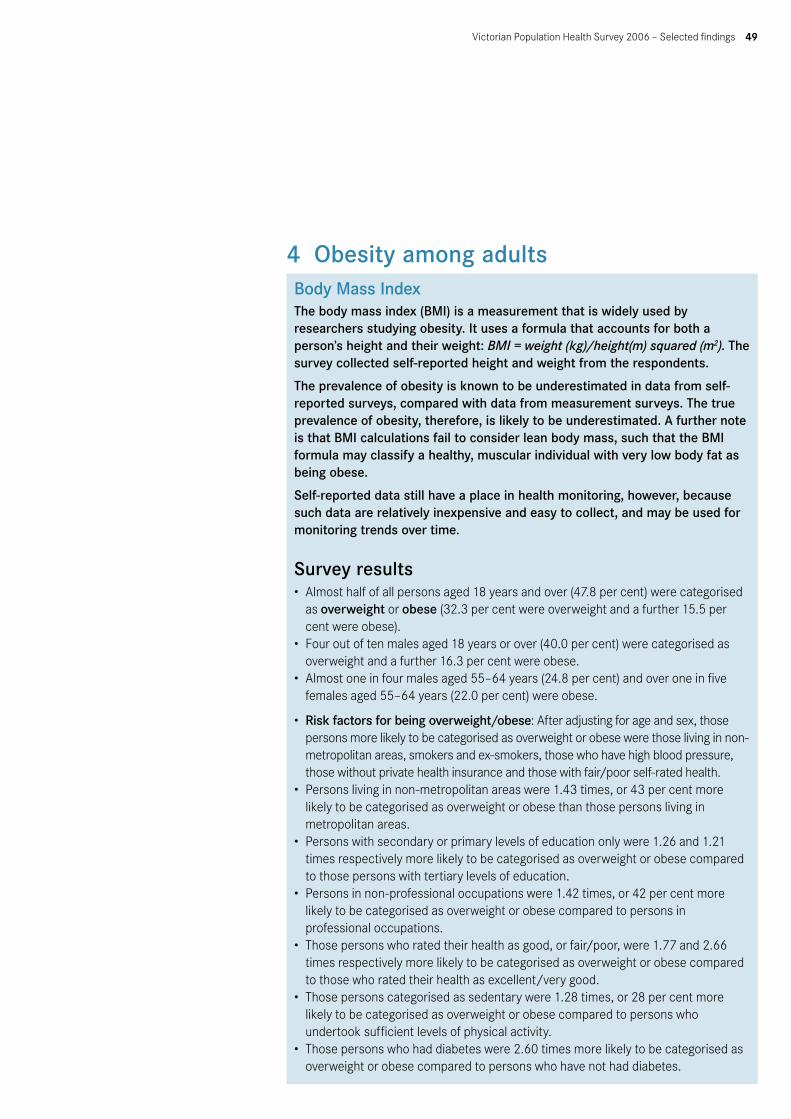
Victorian Population Health Survey 2006 – Selected findings 49
4 Obesity among adultsBody Mass IndexThe body mass index (BMI) is a measurement that is widely used by researchers studying obesity. It uses a formula that accounts for both a person’s height and their weight: BMI = weight (kg)/height(m) squared (m2). The survey collected self-reported height and weight from the respondents.
The prevalence of obesity is known to be underestimated in data from self-reported surveys, compared with data from measurement surveys. The true prevalence of obesity, therefore, is likely to be underestimated. A further note is that BMI calculations fail to consider lean body mass, such that the BMI formula may classify a healthy, muscular individual with very low body fat as being obese.
Self-reported data still have a place in health monitoring, however, because such data are relatively inexpensive and easy to collect, and may be used for monitoring trends over time.
Survey results• Almost half of all persons aged 18 years and over (47.8 per cent) were categorised
as overweight or obese (32.3 per cent were overweight and a further 15.5 per cent were obese).
• Four out of ten males aged 18 years or over (40.0 per cent) were categorised as overweight and a further 16.3 per cent were obese.
• Almost one in four males aged 55–64 years (24.8 per cent) and over one in five females aged 55–64 years (22.0 per cent) were obese.
• Risk factors for being overweight/obese: After adjusting for age and sex, those persons more likely to be categorised as overweight or obese were those living in non-metropolitan areas, smokers and ex-smokers, those who have high blood pressure, those without private health insurance and those with fair/poor self-rated health.
• Persons living in non-metropolitan areas were 1.43 times, or 43 per cent more likely to be categorised as overweight or obese than those persons living in metropolitan areas.
• Persons with secondary or primary levels of education only were 1.26 and 1.21 times respectively more likely to be categorised as overweight or obese compared to those persons with tertiary levels of education.
• Persons in non-professional occupations were 1.42 times, or 42 per cent more likely to be categorised as overweight or obese compared to persons in professional occupations.
• Those persons who rated their health as good, or fair/poor, were 1.77 and 2.66 times respectively more likely to be categorised as overweight or obese compared to those who rated their health as excellent/very good.
• Those persons categorised as sedentary were 1.28 times, or 28 per cent more likely to be categorised as overweight or obese compared to persons who undertook sufficient levels of physical activity.
• Those persons who had diabetes were 2.60 times more likely to be categorised as overweight or obese compared to persons who have not had diabetes.

50 Victorian Population Health Survey 2006 – Selected findings
Table 4.1 shows the body mass index categories for persons aged 18 years and over, for the period 2002–06. The prevalence of overweight and obese persons has remained relatively steady over this period.
Table 4.1: Body mass index, 2002–06
BMI category2002 2003 2004 2005 2006
% SE(%) % SE(%) % SE(%) % SE(%) % SE(%)Underweight 3.4 0.3 3.3 0.3 3.5 0.3 2.5 0.3 1.9 0.2
Normal 48.2 0.8 46.9 0.8 44.4 0.8 45.0 0.8 44.9 0.8
Overweight 30.9 0.7 31.7 0.7 32.3 0.7 32.3 0.7 32.3 0.8
Obese 14.6 0.6 14.1 0.5 14.5 0.5 15.6 0.6 15.5 0.6
SE = standard error. Note figures may not add to 100 per cent due to a proportion of ‘Don’t know’ or ‘refused’ responses.
Figure 4.1: Overweight/obese males
Figure 4.2: Overweight/obese females

Victorian Population Health Survey 2006 – Selected findings 51
Figure 4.3: Overweight/obese persons
The prevalence of both males and females categorised as either overweight or obese rose steadily with age until age group 55–64 years (table 4.2). The highest prevalence of being overweight/obese for both males and females was in the 55–64 years age group, with over 68 per cent of males and 53.6 per cent of females respectively in these age groups being either overweight or obese.
Table 4.2: Overweight/obese adults, by age and sex
Age group (years)
BMI category
Underweight Normal weight Overweight Obese
Total – Overweight or
obese% SE(%) % SE(%) % SE(%) % SE(%) % SE(%)
Males18–24 1.6 0.1 64.6 0.4 22.2 3.7 6.0 1.6 28.2 3.925–34 0.6 0.5 48.0 3.8 32.3 3.5 14.3 2.4 46.7 3.835–44 0.3 0.2 32.7 2.7 48.6 2.8 16.6 1.9 65.2 2.745–54 0.0 0.0 31.8 2.5 45.5 2.6 19.8 2.1 65.3 2.655–64 0.8 0.6 28.4 2.6 44.0 2.9 24.8 2.7 68.8 2.665+ 0.9 0.4 36.9 2.3 43.7 2.3 15.3 1.6 60.0 2.3Total 0.7 0.2 39.8 1.3 40.0 1.3 16.3 0.9 56.3 1.3
Females18–24 7.0 1.7 68.8 3.4 12.4 2.4 5.2 1.5 17.5 2.725–34 3.0 0.8 55.1 2.5 21.4 2.1 12.5 1.6 33.9 2.435–44 3.0 0.6 52.2 2.0 24.0 1.7 14.1 1.4 38.1 2.045–54 1.3 0.4 45.9 2.1 25.6 1.9 18.2 1.6 43.8 2.155–64 1.8 0.6 38.2 2.2 31.6 2.1 22.0 1.9 53.6 2.265+ 2.9 0.8 41.3 2.2 32.0 2.1 15.4 1.6 47.3 2.2Total 3.0 0.3 49.7 1.0 24.9 0.8 14.7 0.7 39.7 1.0
Persons 18–24 4.3 1.0 66.7 2.7 17.4 2.2 5.6 1.1 22.9 2.425–34 1.8 0.5 51.6 2.3 26.8 2.0 13.4 1.4 40.2 2.235–44 1.7 0.3 42.5 1.7 36.1 1.7 15.4 1.2 51.5 1.745–54 0.6 0.2 39.0 1.7 35.4 1.6 19.0 1.3 54.4 1.755–64 1.3 0.4 33.3 1.7 37.8 1.8 23.4 1.7 61.2 1.865+ 2.0 0.5 39.4 1.6 37.2 1.5 15.3 1.2 52.5 1.6Total 1.9 0.2 44.9 0.8 32.3 0.8 15.5 0.6 47.8 0.8
SE = standard error. Note figures may not add to 100 per cent due to a proportion of ‘Don’t know’ or ‘refused’ responses.

52 Victorian Population Health Survey 2006 – Selected findings
Almost one in four males aged 55–64 years (24.8 per cent) were categorised as obese. A further one in five aged 45–54 years (19.8 per cent) were also categorised as obese. Over one in five females aged 55–64 years (22.0 per cent) were categorised as obese. Seven per cent of females aged 18–24 years were categorised as underweight.
Figure 4.4: Overweight or obese persons by age group and sex

Victorian Population Health Survey 2006 – Selected findings 53
Table 4.3: Overweight/obese adults by selected demographics
Selected demographicsOverweight Obese
Total – Overweight or obese
% SE % SE % SEArea of Victoria
Urban 31.1 1.0 14.3 0.7 45.4 1.1
Rural/regional 35.3 0.9 18.8 0.7 54.2 0.9
Country of birth
Australia 31.7 0.8 16.4 0.6 48.1 0.9
Overseas 34.0 1.6 13.0 1.1 47.0 1.7
Education level
Tertiary 31.6 1.4 10.9 0.8 42.6 1.5
Secondary 34.9 2.1 17.4 1.6 52.3 2.2
Primary 31.8 1.0 18.0 0.8 49.8 1.1
Occupation
Professional 33.1 1.4 16.8 1.1 46.8 1.6
Non-professional 30.6 1.1 16.2 0.9 50.0 1.5
Employment status
Employed 33.5 1.0 15.0 0.7 48.5 1.1
Unemployed 29.3 4.6 18.6 0.4 47.9 4.8
Not in the labour force 30.3 1.1 16.1 0.9 46.4 1.3
Household income per year
Greater than or equal to $60,000 34.6 1.3 13.8 0.9 48.4 1.4
From $40,000 to less than $60,000 31.5 1.7 17.6 1.4 49.1 1.9
From $20,000 to less than $40,000 33.3 1.9 16.5 1.4 49.8 2.0
Less than $20,000 30.3 1.8 20.4 1.5 50.7 2.0
Smoking status
Non-smoker 28.4 1.8 15.7 1.3 46.1 1.1
Ex-smoker 36.5 1.4 18.2 1.1 54.7 1.5
Smoker 31.9 1.0 14.2 1.0 44.1 1.9
Self-rated health
Excellent/very good 31.8 2.1 7.1 1.1 41.4 1.2
Good 34.9 1.3 17.3 1.0 52.2 1.4
Fair/poor 28.8 1.8 28.1 1.7 56.9 2.0
Physical activity levels
Sufficient time and sessions 32.8 1.0 14.2 0.6 47.0 1.1
Insufficient time and/or sessions 31.8 1.4 18.0 1.1 49.8 1.5
Sedentary 30.4 3.1 20.4 2.9 50.9 3.4
Level of psychological distress
<16 (none) 34.0 1.0 14.1 0.6 48.1 1.0
16–21 (low) 30.2 1.6 17.3 1.3 47.5 1.8
22–29 (mild) 27.7 2.5 20.6 2.3 48.3 2.9
30 or over (high to severe) 25.0 4.8 20.0 3.2 45.0 5.2
High blood pressure ever
Yes 34.0 1.3 26.2 1.3 60.2 1.4
No 31.8 0.9 12.0 0.6 43.8 1.0

54 Victorian Population Health Survey 2006 – Selected findings
Table 4.4: Overweight or obese persons, by Region
Overweight ObeseTotal – overweight or
obeseRegion % SE(%) % SE(%) % SE(%)Barwon South West 37.0 1.8 14.5 1.3 51.5 1.9
Grampians 34.3 2.0 22.0 1.7 56.3 2.0
Loddon Mallee 37.7 1.8 18.1 1.4 55.7 1.8
Hume 35.0 2.0 19.7 1.7 54.8 2.0
Gippsland 31.6 1.9 22.1 1.8 53.6 2.0
North & West Metro 28.9 1.6 16.0 1.3 44.9 1.8
Eastern 33.7 1.8 12.1 1.1 45.8 1.9
Southern Metro 31.8 1.7 13.9 1.1 45.8 1.8
SE = standard error. Note figures may not add to 100 per cent due to a proportion of ‘Don’t know’ or ‘refused’ responses.
Overweight/obesity prevalence ranged from a high of 56.3 per cent in the Grampians region to a low of 44.9 per cent in the North and West Metropolitan region.
Figure 4.5: Overweight and obesity by Region

Victorian Population Health Survey 2006 – Selected findings 55
Table 4.5: Overweight/obesity and selected risk factors95% confidence interval
Odds ratio Upper level Lower level p valueArea of Victoria
Urban 1.00 — — —Rural/regional 1.43 1.27 1.60 <0.001
Country of birth Australia 1.00 — — —Overseas 0.85 0.73 1.01 0.058
Education level Tertiary 1.00 — — —Secondary 1.23 1.01 1.50 0.040Primary 2.41 1.51 3.84 <0.001
Occupation Professional 1.00 — — —Non-professional 1.42 1.19 1.71 <0.001
Employment status Employed 1.00 — — —Unemployed 1.22 0.78 1.92 0.379Not in the labour force 1.00 0.84 1.19 0.976
Household income per year Greater than or equal to $60,000 1.00 — — —From $40,000 to less than $60,000 1.02 0.84 1.24 0.861From $20,000 to less than $40,000 1.11 0.90 1.36 0.327Less than $20,000 1.20 0.95 1.52 0.120
Private health insurance Yes 1.00 — — —No 1.22 1.06 1.40 0.006
Dwelling ownership Owned 1.00 — — —Rented 0.95 0.77 1.16 0.586
Smoking status Non-smoker 1.00 — — —Ex-smoker 1.11 0.94 1.30 0.214Smoker 0.93 0.77 1.13 0.456
Self-rated health Excellent/very good 1.00 — — —Good 1.77 1.52 2.05 <0.001Fair/poor 2.26 1.84 2.77 <0.001
Physical activity levels Sufficient time and sessions 1.00 — — —Insufficient time and/or sessions 1.12 0.96 1.30 0.145Sedentary 1.28 0.95 1.73 0.109
Diabetes status None 1.00 — — —Has diabetes 2.60 1.84 3.67 <0.001
Level of psychological distress <16 (none) 1.00 — — —16–21 (low) 1.19 1.00 1.41 0.05422–29 (mild) 1.32 1.02 1.71 0.03230 or over (high to severe) 1.16 0.73 1.83 0.531
High blood pressure ever No 1.00 — — —Yes 1.88 1.60 2.21 <0.001
Told by a doctor that they had depression or anxietyNo 1.00 — — —Yes 1.14 0.95 1.35 0.16030 or over (high to severe)
– Not applicable
56 Victorian Population Health Survey 2006 – Selected findings
After adjusting for age and sex, those persons more likely to be categorised as overweight or obese were those living in non-metropolitan areas, those with lower levels of education, those in non-professional occupations, those without private health insurance, those with good or fair/poor self-rated health, those who have diabetes, higher levels of psychological distress and those who have had high blood pressure in the past.

Victorian Population Health Survey 2006 – Selected findings 57
5 Asthma*
Asthma is a common, chronic disorder affecting the airways of the lungs. Narrowing of these air passages (caused by the inflammation and swelling of the airway lining, and the overproduction of mucus) results in airway obstruction and difficulty with breathing, which may be reversed either spontaneously or with medical treatment. The disease affects all age groups, but particularly young persons, and ranges in severity from intermittent mild symptoms to a severe, incapacitating and life threatening disorder.
Asthma was designated as a national health priority in 1999, in recognition that it is one of Australia’s most serious chronic health problems.
Prevalence may be measured in terms of different definitions of the condition. Self-reported measures, such as those collected by the survey, typically report prevalence in Australia at around 27 per cent in children and 17–29 per cent in adults.1 These proportions are quite different from those found via objective measures of lung function, which typically observe the prevalence of current or persistent asthma (wheezing episodes with abnormal airway function between episodes) at 9–11 per cent in children and 5–6 per cent in adults.1
Survey results• Asthma prevalence: Over one in five persons aged 18 years and over (21.2 per
cent) had asthma ever and 10.7 per cent reported having current asthma. Females in the 18–24 year age group had the highest prevalence of current asthma (18.3 per cent). The highest prevalence in males was in the 25–34 year age group at 14.1 per cent.
• Risk factors for asthma ever: After adjusting for age and sex, those persons most likely to have been diagnosed with asthma ever were those born in Australia, those living in non-metropolitan areas, those not in the labour force and those categorised as overweigh/obese.
• Asthma action plans: Most persons with asthma (53.7 per cent) had been given asthma action plans by their doctor. Of those who used the plans, 92.1 per cent responded that it was helpful with day to day management, 89.8 per cent responded that it was helpful for knowing when to seek advice and 73.5 per cent responded that it was useful in managing an acute attack.
• After adjusting for age and sex, those persons more likely to have asthma were those persons living in non-metropolitan areas, those with good or fair/poor self-rated health, and those with low-mild levels of psychological distress.
Respondents were asked whether a doctor had ever told them that they had asthma and, if so, whether they had had asthma symptoms (wheezing, coughing, shortness of breath, chest tightness) in the 12 months before the survey. Those persons who responded yes to the first question are referred to as the population with asthma. Those persons who responded yes to the question about still getting asthma are referred to as the population with current asthma.
* Estimates relating to the current prevalence of asthma and asthma action plans revised on 01/10/2008.

58 Victorian Population Health Survey 2006 – Selected findings
Table 5.1: Asthma prevalence*
Asthma ever2001 2002 2003 2004 2005 2006
% SE(%) % SE(%) % SE(%) % SE(%) % SE(%) % SE(%)Males 20.2 1.0 20.1 1.0 18.5 0.9 18.6 1.0 19.9 1.0 20.0 1.1
Females 23.7 0.9 23.7 0.8 22.1 0.8 21.8 0.8 22.2 0.8 22.4 0.9
Persons 22.0 0.6 21.9 0.7 20.4 0.6 20.2 0.6 21.1 0.7 21.2 0.7
Current asthmaMales 10.0 0.7 9.7 0.8 9.5 0.7 8.7 0.7 9.5 0.8 9.4 0.8
Females 14.5 0.7 15.3 0.7 13.8 0.7 12.2 0.6 13.0 0.7 12.0 0.7
Persons 12.3 0.5 12.6 0.5 11.7 0.5 10.5 0.5 11.3 0.5 10.7 0.5
Estimates for 2006 relating to the current prevalence of asthma were revised on 01/10/2008. SE = standard error.
Table 5.1 shows asthma prevalence, both current and ever, for the period 2001–06.
For both males and females, current asthma and asthma ever prevalence have remained steady over the period 2001–06. Asthma ever prevalence was approximately at levels of 20–22 per cent, and current asthma levels were at approximately 10–12 per cent.
Figure 5.1: Asthma prevalence – males
Figure 5.2: Asthma prevalence – females

Victorian Population Health Survey 2006 – Selected findings 59
Figure 5.3: Asthma prevalence – persons
Table 5.2: Prevalence of asthma ever, by age and sex
Age group (years)Males Females Persons
% SE(%) % SE(%) % SE(%)18–24 32.5 4.0 31.0 3.6 31.8 2.7
25–34 27.8 3.4 29.8 2.4 28.8 2.1
35–44 16.0 2.0 19.7 1.5 17.9 1.3
45–54 19.3 2.0 19.4 1.7 19.3 1.3
55–64 13.6 2.0 17.3 1.6 15.5 1.3
65+ 11.8 1.5 18.8 1.7 15.7 1.2
Total 20.0 1.1 22.4 0.9 21.2 0.7
SE = standard error.
The prevalence of asthma ever generally decreased with age for both males and females (table 5.2). Persons in the younger age groups were more likely to have been diagnosed with asthma ever, with males in the 18–24 year age group having the highest prevalence, at 32.5 per cent followed closely by females in the same age group, at 31.0 per cent.
Figure 5.4: Asthma prevalence by age group – males

60 Victorian Population Health Survey 2006 – Selected findings
Figure 5.5: Asthma prevalence by age group – females
Table 5.3: Prevalence of current asthma*, by age and sex Males Females PersonsAge group (years) % SE(%) % SE(%) % SE(%)18–24 10.8 2.7 18.3 3.1 14.5 2.1
25–34 14.1 2.8 12.5 1.6 13.3 1.6
35–44 6.9 1.4 11.4 1.2 9.2 0.9
45–54 10.5 1.6 9.0 1.2 9.8 1.0
55–64 7.4 1.7 9.7 1.2 8.6 1.0
65+ 6.1 1.0 12.4 1.5 9.6 0.9
Total 9.4 0.8 12.0 0.7 10.7 0.5
Estimates for 2006 relating to the prevalence of current asthma were revised on 01/10/2008. SE = standard error.
Table 5.3 shows that, as for asthma ever, current asthma prevalence generally decreased with age for both males and females. Females in the 18-24 age group had the highest prevalence of current asthma, at 18.3 per cent, followed by males in the 25-34 year age group, at 14.1 per cent.
Asthma action plansTable 5.4 shows that most persons (53.7 per cent) had been given asthma action plans by their doctor, with a higher proportion of males than females receiving asthma action plans (57.6 and 50.7 per cent respectively.)
Table 5.4: Asthma action plansGiven asthma action plans by doctor % SE(%)Males 57.6 4.7
Females 50.7 3.0
Persons 53.7 2.6
SE = standard error.
Almost 3 out of 10 persons (29.9 per cent) who had current asthma, frequently used the asthma action plans given to them by their doctor (table 5.5). While most used them rarely or sometimes, 14.2 per cent never used them.

Victorian Population Health Survey 2006 – Selected findings 61
Table 5.5: Frequency of using asthma action plans*
% SE(%)Never 14.2 2.2
Rarely 30.9 3.0
Sometimes 24.1 2.8
Frequently 29.9 3.0
Estimates for 2006 relating to the use of asthma action plans were revised on 01/10/2008. SE = standard error.
Table 5.6 shows that of those who used the plans, 92.1 per cent responded that it was helpful with day to day management, 89.8 per cent responded that it was helpful for knowing when to seek advice and 73.5 per cent responded that it was useful in managing an acute attack.
Table 5.6: Uses of asthma action plans* % SE(%)Helpful for managing an acute attack 73.5 3.3
Helpful for knowing when to seek medical advice 89.8 2.3
Helpful with day to day management 92.1 1.9
Estimates for 2006 relating to the use of asthma action plans were revised on 01/10/2008. SE = standard error.
Table 5.7: Current asthma prevalence* by RegionRegion % SE(%)Barwon South West 10.4 1.2
Grampians 14.0 1.5
Loddon Mallee 11.4 1.1
Hume 11.9 1.3
Gippsland 12.4 1.4
North & West Metro 9.8 1.1
Eastern 9.0 1.0
Southern Metro 11.9 1.4
Estimates for 2006 relating to the prevalence of current asthma were revised on 01/10/2008. SE = standard error.
Current asthma prevalence ranged from a high of 14.0 per cent in the Grampians to a low of 9.0 per cent in the Eastern Region.
Figure 5.6: Current asthma prevalence by Region
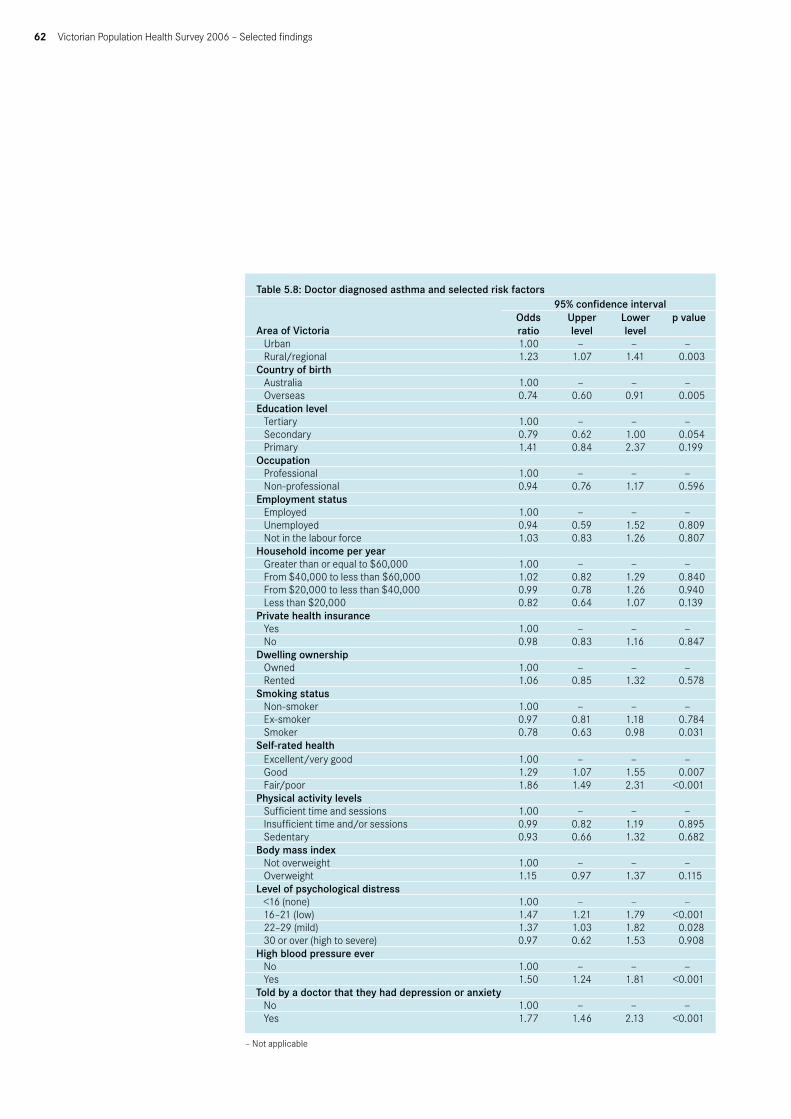
62 Victorian Population Health Survey 2006 – Selected findings
Table 5.8: Doctor diagnosed asthma and selected risk factors
Area of Victoria
95% confidence intervalOdds ratio
Upper level
Lower level
p value
Urban 1.00 — — —Rural/regional 1.23 1.07 1.41 0.003
Country of birth Australia 1.00 — — —Overseas 0.74 0.60 0.91 0.005
Education level Tertiary 1.00 — — —Secondary 0.79 0.62 1.00 0.054Primary 1.41 0.84 2.37 0.199
Occupation Professional 1.00 — — —Non-professional 0.94 0.76 1.17 0.596
Employment status Employed 1.00 — — —Unemployed 0.94 0.59 1.52 0.809Not in the labour force 1.03 0.83 1.26 0.807
Household income per year Greater than or equal to $60,000 1.00 — — —From $40,000 to less than $60,000 1.02 0.82 1.29 0.840From $20,000 to less than $40,000 0.99 0.78 1.26 0.940Less than $20,000 0.82 0.64 1.07 0.139
Private health insurance Yes 1.00 — — —No 0.98 0.83 1.16 0.847
Dwelling ownership Owned 1.00 — — —Rented 1.06 0.85 1.32 0.578
Smoking status Non-smoker 1.00 — — —Ex-smoker 0.97 0.81 1.18 0.784Smoker 0.78 0.63 0.98 0.031
Self-rated health Excellent/very good 1.00 — — —Good 1.29 1.07 1.55 0.007Fair/poor 1.86 1.49 2.31 <0.001
Physical activity levels Sufficient time and sessions 1.00 — — —Insufficient time and/or sessions 0.99 0.82 1.19 0.895Sedentary 0.93 0.66 1.32 0.682
Body mass index Not overweight 1.00 — — —Overweight 1.15 0.97 1.37 0.115
Level of psychological distress <16 (none) 1.00 — — —16–21 (low) 1.47 1.21 1.79 <0.00122–29 (mild) 1.37 1.03 1.82 0.02830 or over (high to severe) 0.97 0.62 1.53 0.908
High blood pressure ever No 1.00 — — —Yes 1.50 1.24 1.81 <0.001
Told by a doctor that they had depression or anxiety No 1.00 — — —Yes 1.77 1.46 2.13 <0.001
– Not applicable
Victorian Population Health Survey 2006 – Selected findings 63
After adjusting for age and sex, those persons more likely to have asthma were those persons living in non-metropolitan areas, those with good or fair/poor self rated health, and those with low-mild levels of psychological distress.
References1. Woolcock B, Marks GB & Keena VA 2001, ‘The burden of asthma in Australia’,
Electronic Medical Journal of Australia, www.mja.com.au/public/issues/175_03_060801/woolcock/woolcock.html

64 Victorian Population Health Survey 2006 – Selected findings
Diabetes mellitus is a common, chronic condition characterised by high blood glucose (sugar) levels. The two main types of diabetes are type 1 (insulin dependent) diabetes and type 2 (non-insulin dependent) diabetes. A third form is gestational diabetes, a condition that affects women during pregnancy. Type 1 diabetes develops when the pancreas fails to effectively produce the hormone insulin, which stimulates the body’s cells to use glucose as energy.
Persons having type 1 diabetes mellitus require insulin injections to regulate their blood sugar levels. This type of the disease occurs most frequently in those aged less than 30 years and may be referred to as juvenile-onset diabetes. Type 2 diabetes usually occurs in adults who are overweight or have a family history of the condition. Accounting for around 85 per cent of all cases of diabetes, it is caused by the body becoming resistant to high glucose levels in the blood. Appropriate diet and exercise can control type 2 diabetes in most cases. Left untreated, diabetes can cause kidney, eye and nerve damage, heart disease, stroke and impotence.
Survey results• Prevalence: Almost one in twenty persons aged 18 years and over (4.9 per cent)
had been diagnosed by a doctor with diabetes (excludes females diagnosed with diabetes during pregnancy).
• The prevalence of diabetes increased with age, with 15.6 per cent of males and 12.8 per cent of females aged 65 years and over having the condition.
• Doctor visits: Most persons with diabetes (90.0 per cent) had visited their General Practitioner/doctor in relation to their condition in the past 12 months. Over half (56.4 per cent) had visited and Optometrist or Ophthalmologist and over four in ten (40.4 per cent) had visited a Podiatrist or Chiropodist.
• Diabetes screening: Overall, 47.8 per cent of persons aged 18 years and over (50.1 per cent of females and 45.4 per cent of males) reported having had a test for diabetes in the previous two years.
• Risk factors: After adjusting for differences in age and sex, those persons more likely to have been diagnosed with diabetes or high blood sugar levels were those with lower levels of education, those not having private health insurance, those with doctor diagnosed high blood pressure and those categorised as overweight/obese.
6 Diabetes

Victorian Population Health Survey 2006 – Selected findings 65
Table 6.1 shows the prevalence of doctor diagnosed diabetes has remained relatively steady over the period 2001–06 for both males and females. In 2006, almost one in 20 persons (4.9 per cent) aged 18 years and over had diabetes.
Table 6.1: Prevalence of doctor diagnosed diabetes 2001–06 2001* 2002 2003 2004 2005 2006
% SE(%) % SE(%) % SE(%) % SE(%) % SE(%) % SE(%)Males 6.6 0.6 4.7 0.5 4.5 0.5 5.3 0.5 5.1 0.5 5.5 0.5
Females 4.8 0.4 4.3 0.4 3.8 0.3 4.1 0.4 4.6 0.4 4.4 0.4
Persons 5.7 0.3 4.5 0.3 4.2 0.3 4.7 0.3 4.8 0.3 4.9 0.3
SE = standard error Excludes females diagnosed with gestational diabetes during pregnancy only *Includes being diagnosed with high blood sugar levels, so prevalence levels will be higher than subsequent years.
Figure 6.1: Diabetes prevalence – males
Figure 6.2: Diabetes prevalence – females

66 Victorian Population Health Survey 2006 – Selected findings
Figure 6.3: Diabetes prevalence – persons
Table 6.2: Prevalence of doctor diagnosed diabetes Males Females PersonsAge group (years) % SE(%) % SE(%) % SE(%)18–24 0.6 0.6 0.3 0.3 0.5 0.3
25–34 0.7 0.7 0.6 0.5 0.6 0.4
35–44 2.3 0.8 1.3 0.5 1.8 0.5
45–54 5.0 1.2 3.3 0.7 4.1 0.7
55–64 10.6 2.0 6.8 1.1 8.7 1.1
65+ 15.6 1.7 12.8 1.5 14.0 1.1
SE = standard error.
Table 6.2 shows the prevalence of doctor diagnosed diabetes by age group and sex. The prevalence increased with age for both males and females. Over one in seven males aged 65 years and over (15.6 per cent) had diabetes.
Use of health professionals
Table 6.3: Visiting health professionals for diabetes in the previous 12 months Males Females PersonsType of health professional % SE(%) % SE(%) % SE(%)General practitioner/doctor 89.4 2.6 90.7 2.4 90.0 1.8
Podiatrist or chiropodist 38.5 4.6 42.8 4.3 40.4 3.2
Diabetes educator or nurse 38.0 4.7 40.2 4.2 39.0 3.2
Optometrist or ophthalmologist 53.5 4.7 59.9 4.4 56.4 3.3
Nutritionist or dietician 30.3 4.6 28.3 3.6 29.4 3.0
Specialist 25.8 3.9 20.0 3.6 23.2 2.7
None of the above 6.5 2.2 5.1 1.7 5.8 1.4
SE = standard error.

Victorian Population Health Survey 2006 – Selected findings 67
Table 6.3 shows the use of health professionals visited by persons for advice on their diabetes management, in the past 12 months. Most persons had visited their general practitioner or doctor (90.0 per cent) and over half (56.4 per cent) had visited an Optometrist or Ophthalmologist.
Table 6.4: Persons with diabetes: frequency of caring for own feet
Frequency of caring for own feetMales Females Persons
% SE(%) % SE(%) % SE(%)Once a week or more 56.0 4.7 55.2 4.4 55.6 3.2
Once every two weeks 5.6 2.1 5.4 1.7 5.5 1.4
Once a month 8.3 2.5 7.8 2.3 8.1 1.7
Less than once a month 9.8 2.5 18.1 3.5 13.5 2.1
SE = standard error
It is important for persons with diabetes to have their feet checked because they are prone to infection, delayed healing and nerve damage. Persons with diabetes who had visited a health professional in the past 12 months were asked how often their feet were checked for any sores or irritations (table 6.4). Over half of all persons with diabetes cared for their feet once a week or more, with almost one if five females (18.1 per cent) and almost one in 10 males (9.8 per cent) doing so less than once a month.
Diabetes screening
Table 6.5: Diabetes screening
Age group (years)Males Females Persons
% SE(%) % SE(%) % SE(%)18–24 15.5 2.9 21.8 3.3 18.6 2.2
25–34 20.0 3.0 45.4 2.6 32.8 2.1
35–44 41.9 2.8 45.6 2.0 43.8 1.7
45–54 56.0 2.6 50.3 2.2 53.1 1.7
55–64 64.9 2.7 62.7 2.2 63.8 1.7
65+ 75.9 2.0 68.1 2.0 71.6 1.4
Total 45.4 1.3 50.1 1.0 47.8 0.8
SE = standard error
Less than half of all persons aged 18 years and over (47.8 per cent) reported having a test for diabetes or high blood sugar levels in the past two years. This proportion increased steadily with age group, with over three quarters of males aged 65 years and over (75.9 per cent) and 68.1 per cent of females in the same age group having the test in the past two years.

68 Victorian Population Health Survey 2006 – Selected findings
Table 6.6: Doctor diagnosed diabetes and selected risk factors
Area of Victoria95% confidence interval
Odds ratio Upper level Lower level p valueUrban 1.00 — — —Rural/regional 1.00 0.80 1.26 0.974
Country of birth Australia 1.00 — — —Overseas 1.24 0.92 1.66 0.162
Education level Tertiary 1.00 — — —Secondary 1.58 0.99 2.53 0.057Primary 2.11 1.15 3.86 0.016
Occupation Professional 1.00 — — —Non-professional 1.19 0.69 2.04 0.536Employment status
Employed 1.00 — — —Unemployed 1.17 0.46 3.01 0.734Not in the labour force 2.25 1.57 3.21 <0.001
Household income per year Greater than or equal to $60,000 1.00 — — —From $40,000 to less than $60,000 1.28 0.77 2.16 0.342From $20,000 to less than $40,000 1.72 1.07 2.75 0.026Less than $20,000 2.79 1.80 4.33 <0.001
Private health insurance Yes 1.00 — — —No 1.79 1.36 2.37 <0.001
Dwelling ownership Owned 1.00 — — —Rented 2.14 1.43 3.21 <0.001
Smoking status Non-smoker 1.00 — — —Ex-smoker 1.35 1.02 1.79 0.038Smoker 1.13 0.72 1.78 0.592
Self-rated health Excellent/very good 1.00 — — —Good 1.69 1.21 2.37 0.002Fair/poor 3.44 2.42 4.87 <0.001
Physical activity levels Sufficient time and sessions 1.00 — — —Insufficient time and/or sessions 0.97 0.72 1.32 0.865Sedentary 2.10 1.29 3.42 0.003
Body mass index Not overweight 1.00 — — —Overweight 2.63 1.87 3.70 <0.001
Level of psychological distress <16 (none) 1.00 — — —16–21 (low) 1.36 0.96 1.92 0.08622–29 (mild) 1.76 1.08 2.86 0.02330 or over (high to severe) 2.32 1.28 4.18 0.005
High blood pressure ever No 1.00 — — —Yes 3.33 2.46 4.52 <0.001
Told by a doctor that they had depression or anxiety No 1.00 — — —Yes 1.37 1.00 1.89 0.051
– Not applicable
Victorian Population Health Survey 2006 – Selected findings 69
After adjusting for age and sex, those persons more likely to have been diagnosed with diabetes were those with lower levels of education, those not in the labour force, those having lower household incomes, those without private health insurance, ex-smokers, those with good or fair/poor self-rated health, those categorised as sedentary, those who were categorised as overweight, those with higher levels of psychological distress and those who have previously had high blood pressure levels.

70 Victorian Population Health Survey 2006 – Selected findings
Given the significance of mental health issues and their relationship to poor health, a measure of psychological distress, the Kessler 10 (K10) has been included in the survey. The K10 is a set of 10 questions designed to categorise the level of psychological distress over a four week period. It cannot be used to determine major illnesses but has been validated as a simple measure of anxiety, depression and worry (psychological distress).
The K10 covers the dimensions of depression and anxiety, such as nervousness, hopelessness, restlessness, sadness and worthlessness. It consists of 10 questions that have the same response categories: all of the time, most of the time, some of the time, a little of the time and none of the item (that are scored 5 through to 1). The ten items are summed to yield scores ranging from 10 to 50. Subject to qualifications about the use of K10 as a screening tool, the maximum score of 50 indicates severe distress and the minimum score of 10 indicates no stress. In general, the higher the K10 score, the greater the likelihood that a person may be affected by psychological distress.
Survey results• Prevalence: Almost 3 per cent of all persons aged 18 years and over had scores
>= 30 using the K10 measure and were categorized as likely to be at high risk of psychological distress. This prevalence has remained stable over the years 2002–06.
• The prevalence of higher K10 scores (>= 22) was highest for the younger females in the age group 18–24 years (at 18.8 per cent) (see table 7.2).
• For all age groups categories with the exception of those persons aged 55–64 years, females had higher prevalence of higher K10 scores (>=22) (see table 7.2).
• Seeking help for mental health related problems: Almost 12 per cent of females and over 7 per cent of males aged 18 years and over had sought help at some time in their lives for a mental health related problem (see table 7.3). Most of these persons had sought help from a General Practitioner (54.3 per cent) followed by a private counseling service/psychiatrist (24.0 per cent) (see table 7.4).
• Risk factors: After adjusting for age and sex differences, those persons more likely to have been categorised as having high levels of psychological distress were those with lower levels of education, those unemployed or not in the labour force, those living in households with lower incomes, smokers, those who had good or fair/poor self rated-health (compared to excellent or very good) and those who had been told in the past that they had depression or anxiety.
7 Psychological distress

Victorian Population Health Survey 2006 – Selected findings 71
Table 7.1: K10 scores, 2001–06
K10 score2001 2002 2003 2004 2005 2006
% SE(%) % SE(%) % SE(%) % SE(%) % SE(%) % SE(%)< 16 56.1 0.7 67.5 0.7 66.4 0.7 65.1 0.8 61.2 0.8 63.5 0.8
16–21 28.2 0.7 21.2 0.6 20.8 0.6 20.5 0.6 24.4 0.6 23.3 0.7
22–29 11.7 0.5 8.6 0.4 8.5 0.4 8.8 0.5 8.7 0.5 7.8 0.4
>= 30 4.0 0.3 2.7 0.2 2.6 0.2 3.3 0.3 3.1 0.3 2.9 0.3
SE = standard error. Note figures may not add to 100 per cent due to a proportion of ‘Don’t know’ or ‘refused’ responses.
Approximately 3 per cent of persons aged 18 years or over had scores of 30 or greater on the K10 and were categorised as likely to be at high risk of psychological distress.
Figure 7.1: Distribution of K10 scores, 2001–06
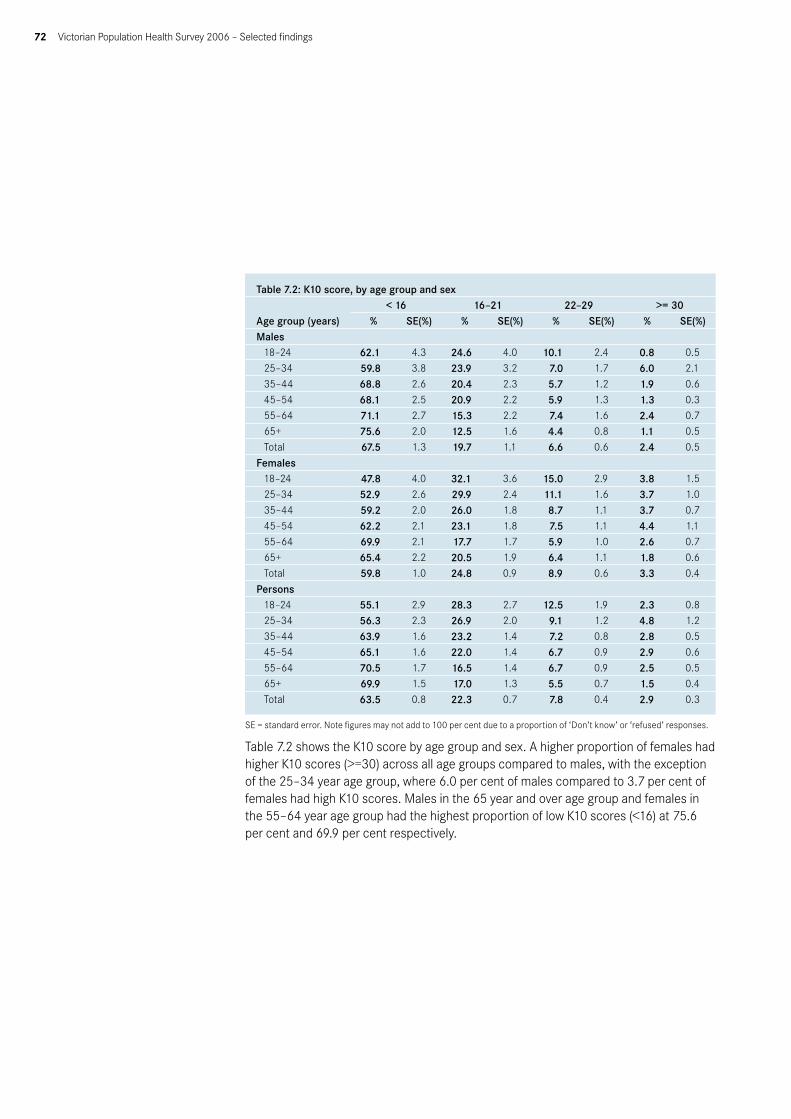
72 Victorian Population Health Survey 2006 – Selected findings
Table 7.2: K10 score, by age group and sex
Age group (years)< 16 16–21 22–29 >= 30
% SE(%) % SE(%) % SE(%) % SE(%)Males
18–24 62.1 4.3 24.6 4.0 10.1 2.4 0.8 0.5
25–34 59.8 3.8 23.9 3.2 7.0 1.7 6.0 2.1
35–44 68.8 2.6 20.4 2.3 5.7 1.2 1.9 0.6
45–54 68.1 2.5 20.9 2.2 5.9 1.3 1.3 0.3
55–64 71.1 2.7 15.3 2.2 7.4 1.6 2.4 0.7
65+ 75.6 2.0 12.5 1.6 4.4 0.8 1.1 0.5
Total 67.5 1.3 19.7 1.1 6.6 0.6 2.4 0.5
Females
18–24 47.8 4.0 32.1 3.6 15.0 2.9 3.8 1.5
25–34 52.9 2.6 29.9 2.4 11.1 1.6 3.7 1.0
35–44 59.2 2.0 26.0 1.8 8.7 1.1 3.7 0.7
45–54 62.2 2.1 23.1 1.8 7.5 1.1 4.4 1.1
55–64 69.9 2.1 17.7 1.7 5.9 1.0 2.6 0.7
65+ 65.4 2.2 20.5 1.9 6.4 1.1 1.8 0.6
Total 59.8 1.0 24.8 0.9 8.9 0.6 3.3 0.4
Persons
18–24 55.1 2.9 28.3 2.7 12.5 1.9 2.3 0.8
25–34 56.3 2.3 26.9 2.0 9.1 1.2 4.8 1.2
35–44 63.9 1.6 23.2 1.4 7.2 0.8 2.8 0.5
45–54 65.1 1.6 22.0 1.4 6.7 0.9 2.9 0.6
55–64 70.5 1.7 16.5 1.4 6.7 0.9 2.5 0.5
65+ 69.9 1.5 17.0 1.3 5.5 0.7 1.5 0.4
Total 63.5 0.8 22.3 0.7 7.8 0.4 2.9 0.3
SE = standard error. Note figures may not add to 100 per cent due to a proportion of ‘Don’t know’ or ‘refused’ responses.
Table 7.2 shows the K10 score by age group and sex. A higher proportion of females had higher K10 scores (>=30) across all age groups compared to males, with the exception of the 25–34 year age group, where 6.0 per cent of males compared to 3.7 per cent of females had high K10 scores. Males in the 65 year and over age group and females in the 55–64 year age group had the highest proportion of low K10 scores (<16) at 75.6 per cent and 69.9 per cent respectively.

Victorian Population Health Survey 2006 – Selected findings 73
Figure 7.2: High and very high K10 scores (>=22) by age group and sex
Use of mental health services
Table 7.3: Seeking help for a mental health related problem % SE(%)Males 7.2 0.7
Females 11.5 0.6
Persons 9.4 0.5
SE = standard error
Table 7.3 shows that almost one in 10 persons aged 18 years and over (9.4 per cent) had sought help for a mental health related problem in the past 12 months. A higher proportion of females (11.5 per cent) than males (7.2 per cent) had done so.
Seeking help for mental health problems
Table 7.4: Sources of help for a mental health related problem % SE(%)General practitioner 54.3 2.6Private counselling service/psychologist 24.0 2.1Private psychiatrist 18.6 1.9Community health service 5.6 1.0
SE = standard error
Persons who had sought help for a mental health related problem in the past 12 months were asked who they sought help from. Most (54.3 per cent) had sought help from a General Practitioner and a further 24.0 per cent had sought help from a private counselling service/psychologist.

74 Victorian Population Health Survey 2006 – Selected findings
Table 7.5: Psychological distress and selected risk factors
Area of Victoria95% confidence interva
Odds ratio Upper level Lower level p valueUrban 1.00 — — —Rural/regional 1.00 0.84 1.20 0.988
Country of birth Australia 1.00 — — —Overseas 0.91 0.70 1.17 0.452
Education level Tertiary 1.00 — — —Secondary 0.86 0.59 1.27 0.452Primary 1.97 1.51 2.57 <0.001
Occupation Professional 1.00 — — —Non-professional 1.30 0.95 1.78 0.106
Employment status Employed 1.00 — — —Unemployed 2.82 1.70 4.66 <0.001Not in the labour force 1.82 1.40 2.36 <0.001
Household income per year Greater than or equal to $60,000 1.00 — — —From $40,000 to less than $60,000 1.12 0.79 1.60 0.524From $20,000 to less than $40,000 2.44 1.76 3.39 <0.001Less than $20,000 4.41 3.16 6.16 <0.001
Private health insurance Yes 1.00 — — —No 1.81 1.46 2.25 <0.001
Dwelling ownership Owned 1.00 — — —Rented 1.44 1.09 1.90 0.010
Smoking status Non-smoker 1.00 — — —Ex-smoker 1.17 0.91 1.51 0.226Smoker 1.92 1.48 2.48 <0.001
Self-rated health Excellent/very good 1.00 — — —Good 1.91 1.46 2.52 <0.001Fair/poor 5.77 4.39 7.59 <0.001
Physical activity levels Sufficient time and sessions 1.00 — — —Insufficient time and/or sessions 0.92 0.71 1.18 0.486Sedentary 1.35 0.90 2.02 0.151
Body mass index Not overweight 1.00 — — —Overweight 1.21 0.97 1.52 0.091
High blood pressure ever No 1.00 — — —Yes 1.90 1.47 2.44 <0.001
Told by a doctor that they had depression or anxietyNo 1.00 — — —Yes 8.00 6.35 10.07 <0.001
– Not applicable

Victorian Population Health Survey 2006 – Selected findings 75
After adjusting for age and sex, those persons more likely to have been categorised as having high levels of psychological distress were those with lower levels of education, those unemployed or not in the labour force, those living in households with lower incomes, smokers, those who had good or fair/poor self-rated health and those that had been told in the past by a doctor that they had depression or anxiety.
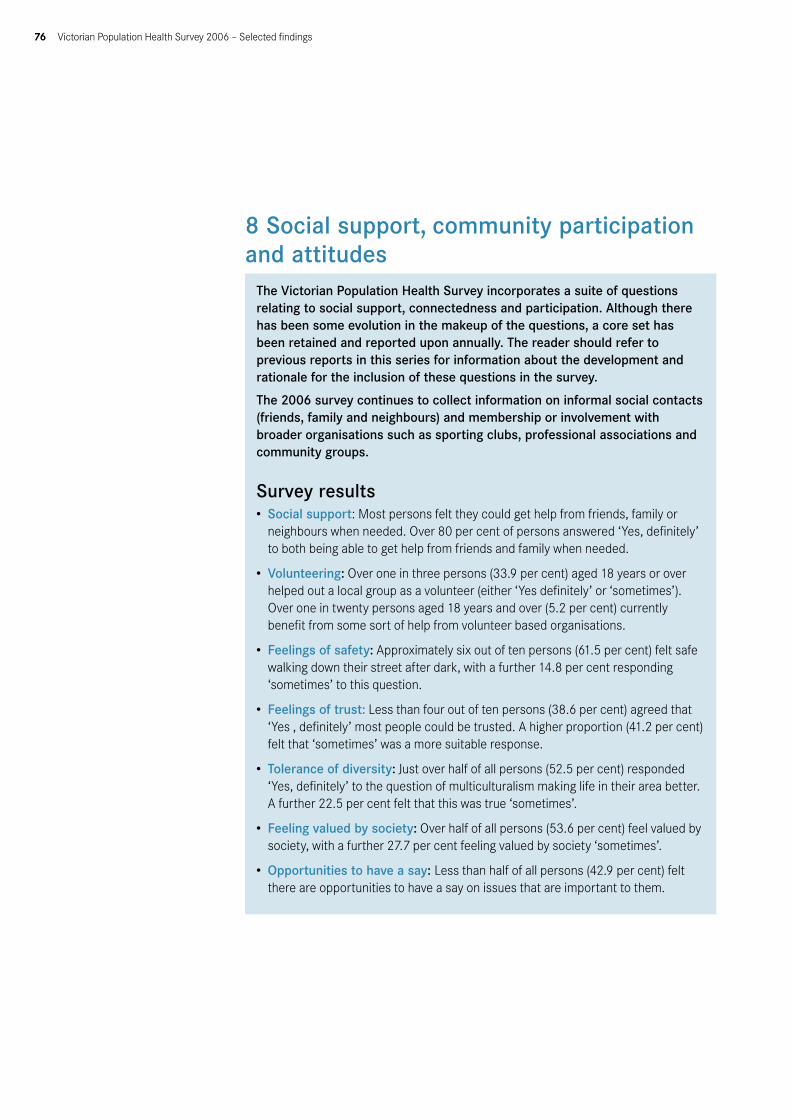
76 Victorian Population Health Survey 2006 – Selected findings
The Victorian Population Health Survey incorporates a suite of questions relating to social support, connectedness and participation. Although there has been some evolution in the makeup of the questions, a core set has been retained and reported upon annually. The reader should refer to previous reports in this series for information about the development and rationale for the inclusion of these questions in the survey.
The 2006 survey continues to collect information on informal social contacts (friends, family and neighbours) and membership or involvement with broader organisations such as sporting clubs, professional associations and community groups.
Survey results• Social support: Most persons felt they could get help from friends, family or
neighbours when needed. Over 80 per cent of persons answered ‘Yes, definitely’ to both being able to get help from friends and family when needed.
• Volunteering: Over one in three persons (33.9 per cent) aged 18 years or over helped out a local group as a volunteer (either ‘Yes definitely’ or ‘sometimes’). Over one in twenty persons aged 18 years and over (5.2 per cent) currently benefit from some sort of help from volunteer based organisations.
• Feelings of safety: Approximately six out of ten persons (61.5 per cent) felt safe walking down their street after dark, with a further 14.8 per cent responding ‘sometimes’ to this question.
• Feelings of trust: Less than four out of ten persons (38.6 per cent) agreed that ‘Yes , definitely’ most people could be trusted. A higher proportion (41.2 per cent) felt that ‘sometimes’ was a more suitable response.
• Tolerance of diversity: Just over half of all persons (52.5 per cent) responded ‘Yes, definitely’ to the question of multiculturalism making life in their area better. A further 22.5 per cent felt that this was true ‘sometimes’.
• Feeling valued by society: Over half of all persons (53.6 per cent) feel valued by society, with a further 27.7 per cent feeling valued by society ‘sometimes’.
• Opportunities to have a say: Less than half of all persons (42.9 per cent) felt there are opportunities to have a say on issues that are important to them.
8 Social support, community participation and attitudes

Victorian Population Health Survey 2006 – Selected findings 77
Table 8.1: Persons spoken to on previous day2001 2002 2003 2004 2005 2006
% SE(%) % SE(%) % SE(%) % SE(%) % SE(%) % SE(%)How many people did you speak to yesterday?None at all .. .. 0.9 0.1 1.1 0.2 0.5 0.1 2.1 0.3 2.3 0.3
Less than 5 .. .. 16.9 0.6 17.0 0.6 17.7 0.6 18.2 0.6 18.4 0.6
5 to 9 .. .. 26.5 0.7 37.2 0.7 22.5 0.6 28.4 0.7 27.4 0.7
10 or more .. .. 55.6 0.8 54.6 0.8 59.1 0.8 51.1 0.8 51.7 0.8
SE = standard error. Note figures may not add to 100 per cent due to a proportion of ‘Don’t know’ or ‘refused’ responses. .. Not available
Table 8.2: Ability to get help when needed 2001 2002 2003 2004 2005 2006
% SE(%) % SE(%) % SE(%) % SE(%) % SE(%) % SE(%)Can you get help from friends when you need it?Yes, definitely 79.7 0.6 79.9 0.6 80.2 0.6 80.8 0.6 78.8 0.7 82.3 0.6
Sometimes 14.9 0.6 14.1 0.6 14.1 0.5 12.7 0.5 14.3 0.6 12.3 0.5
Not often 2.5 0.2 3.0 0.3 2.5 0.2 2.5 0.2 3.1 0.3 2.2 0.2
Not at all 2.9 0.3 2.9 0.3 3.1 0.3 3.7 0.3 2.9 0.2 2.7 0.2
Can you get help from family members when you need it?Yes, definitely 81.8 0.6 82.8 0.6 83.5 0.6 83.9 0.5 81.9 0.6 80.6 0.6
Sometimes 10.8 0.5 10.0 0.5 10.5 0.5 9.1 0.4 11.4 0.5 11.9 0.5
Not often 3.1 0.3 2.9 0.3 2.2 0.2 2.5 0.2 2.7 0.3 3.3 0.3
Not at all 4.3 0.3 4.2 0.3 3.8 0.3 4.3 0.3 3.8 0.3 3.9 0.3
Can you get help from neighbours when you need it?Yes, definitely 50.7 0.8 51.7 0.8 51.5 0.8 49.4 0.7 50.0 0.8 51.3 0.8
Sometimes 27.3 0.7 20.1 0.6 19.8 0.6 18.5 0.6 21.3 0.7 20.2 0.7
Not often 9.1 0.5 9.4 0.5 7.9 0.4 8.7 0.5 8.8 0.5 7.5 0.5
Not at all 12.9 0.5 18.8 0.7 20.7 0.7 21.9 0.7 15.9 0.6 16.6 0.6
SE = standard error. Note figures may not add to 100 per cent due to a proportion of ‘Don’t know’ or ‘refused’ responses.
Table 8.3: Ability to raise $2000 within two days in an emergency 2001 2002 2003 2004 2005 2006
% SE(%) % SE(%) % SE(%) % SE(%) % SE(%) % SE(%)Can you raise $2000 within two days in an emergencyYes .. .. 78.6 0.7 80.0 0.6 82.0 0.6 83.7 0.6 86.4 0.6
No .. .. 16.6 0.6 15.9 0.6 14.8 0.6 12.9 0.5 10.6 0.5
Don’t know .. .. 3.9 0.3 3.5 0.3 2.4 0.3 2.2 0.3 1.7 0.2
SE = standard error. Note figures may not add to 100 per cent due to a proportion of ‘Don’t know’ or ‘refused’ responses. .. Not available

78 Victorian Population Health Survey 2006 – Selected findings
Table 8.4: Volunteering 2001 2002 2003 2004 2005 2006
% SE(%) % SE(%) % SE(%) % SE(%) % SE(%) % SE(%)Do you help out a local group as a volunteer?Yes, definitely 21.2 0.6 24.4 0.6 24.1 0.6 23.0 0.6 23.6 0.6 22.7 0.6
Sometimes 10.8 0.5 9.6 0.5 10.3 0.5 8.0 0.4 11.5 0.4 11.2 0.5
Not often 4.5 0.3 3.3 0.3 6.3 0.4 6.0 0.4 5.4 0.4 5.1 0.4
Not al all 64.0 0.7 63.0 0.7 59.0 0.8 63.0 0.7 59.3 0.7 60.9 0.8
SE = standard error. Note figures may not add to 100 per cent due to a proportion of ‘Don’t know’ or ‘refused’ responses.
Table 8.5: Volunteering2001 2002 2003 2004 2005 2006
% SE(%) % SE(%) % SE(%) % SE(%) % SE(%) % SE(%)Do you yourself currently get any help from any volunteer based organisations?Yes .. .. 7.5 0.4 7.4 0.4 6.7 0.4 4.4 0.3 5.2 0.4
No .. .. 92.0 0.4 92.3 0.4 92.1 0.4 95.2 0.3 94.5 0.4
SE = standard error. Note figures may not add to 100 per cent due to a proportion of ‘Don’t know’ or ‘refused’ responses. .. Not available
Table 8.6: Feelings of safety2001 2002 2003 2004 2005 2006
% SE(%) % SE(%) % SE(%) % SE(%) % SE(%) % SE(%)Do you feel safe walking alone down your street after dark?Yes, definitely
55.2 0.8 56.0 0.8 59.0 0..8 60.8 0.4 60.4 0.8 61.5 0.8
Sometimes 17.5 0.6 16.1 0.6 15.6 0.6 13.5 0.5 14.5 0.6 14.8 0.6
Not often 5.9 0.4 5.0 0.3 5.1 0.3 5.1 0.3 5.7 0.4 5.4 0.4
Not at all 21.4 0.6 22.6 0.7 16.9 0.6 17.3 0.6 16.6 0.6 15.1 0.5
SE = standard error. Note figures may not add to 100 per cent due to a proportion of ‘Don’t know’ or ‘refused’ responses.
Table 8.7: Feelings of trust2001 2002 2003 2004 2005 2006
% SE(%) % SE(%) % SE(%) % SE(%) % SE(%) % SE(%)Do you agree that most people can be trusted?Yes, definitely
28.0 0.7 31.7 0.7 35.7 0.5 36.6 0.7 36.4 0.8 38.6 0.8
Sometimes 43.5 0.8 43.3 0.8 43.6 0.8 39.5 0.8 44.4 0.8 41.2 0.8Not often 12.0 0.5 8.5 0.4 9.1 0.5 11.5 0.5 8.8 0.5 9.5 0.5
Not at all 16.5 0.6 16.4 0.6 11.6 0.5 11.9 0.5 9.2 0.5 9.6 0.5
SE = standard error. Note figures may not add to 100 per cent due to a proportion of ‘Don’t know’ or ‘refused’ responses.

Victorian Population Health Survey 2006 – Selected findings 79
Table 8.8: Tolerance of diversity2001 2002 2003 2004 2005 2006
% SE(%) % SE(%) % SE(%) % SE(%) % SE(%) % SE(%)Do you think that multiculturalism makes life in your area better?Yes, definitely
57.0 0.8 59.4 0.8 64.2 0.7 66.4 0.7 57.1 0.8 52.5 0.8
Sometimes 28.7 0.7 27.6 0.7 22.0 0.6 19.5 0.6 22.8 0.7 22.5 0.7Not often 5.6 0.4 4.5 0.3 2.6 0.2 2.9 0.2 3.3 0.3 3.5 0.3Not at all 8.7 0.4 7.7 0.4 5.3 0.3 5.2 0.3 5.5 0.3 6.5 0.4Not applicable
.. .. .. .. .. .. .. .. 8.4 0.3 10.1 0.4
SE = standard error. Note figures may not add to 100 per cent due to a proportion of ‘Don’t know’ or ‘refused’ responses. .. Not available
Table 8.9: Feeling valued by society2001 2002 2003 2004 2005 2006
% SE(%) % SE(%) % SE(%) % SE(%) % SE(%) % SE(%)Do you feel valued by society?Yes, definitely 42.1 0.8 51.6 0.8 55.4 0.8 52.7 0.8 51.2 0.8 53.6 0.8Sometimes 36.6 0.8 32.2 0.7 30.2 0.7 26.7 0.7 31.5 0.8 27.7 0.7Not often 9.0 0.5 6.6 0.4 5.4 0.3 6.1 0.4 5.4 0.4 5.5 0.4Not at all 12.4 0.5 8.6 0.4 9 0.4 8.5 0.5 7.0 0.4 7.5 0.4
SE = standard error. Note figures may not add to 100 per cent due to a proportion of ‘Don’t know’ or ‘refused’ responses.
Table 8.10: Opportunities to have a say2001 2002 2003 2004 2005 2006
% SE(%) % SE(%) % SE(%) % SE(%) % SE(%) % SE(%)Do you feel there are opportunities to have a say on issues that are important to you?Yes, definitely 36.1 0.7 39.3 0.8 42.2 0.7 45.9 0.8 39.1 0.8 42.9 0.8
Sometimes 34.2 0.7 34.1 0.8 33.0 0.7 26.7 0.7 33.6 0.8 29.9 0.8
Not often 14.9 0.6 12.7 0.5 10.6 0.5 11.4 0.5 12.4 0.6 11.7 0.5
Not at all 14.7 0.6 13.6 0.5 14.3 0.5 13.7 0.6 12.7 0.5 13.4 0.5
SE = standard error. Note figures may not add to 100 per cent due to a proportion of ‘Don’t know’ or ‘refused’ responses.
Table 8.11: Help in emergencies2001 2002 2003 2004 2005 2006
% SE(%) % SE(%) % SE(%) % SE(%) % SE(%) % SE(%)Could one of your relatives or friends care for you (or your children) in an emergency?Yes .. .. 94.8 0.3 92.6 0.4 92.9 0.4 90.6 0.5 92.6 0.4
No .. .. 5.2 0.3 4.8 0.3 5.4 0.3 7.6 0.4 5.5 0.3
SE = standard error. Note figures may not add to 100 per cent due to a proportion of ‘Don’t know’ or ‘refused’ responses. .. Not available

80 Victorian Population Health Survey 2006 – Selected findings
Table 8.12:2001 2002 2003 2004 2005 2006
% SE(%) % SE(%) % SE(%) % SE(%) % SE(%) % SE(%)If you needed to find a job, could you get one through a relative or friend?Yes .. .. .. .. 43.3 0.8 43.3 0.8 55.5 0.9 54.3 0.9
No .. .. .. .. 30.7 0.7 31.4 0.7 35.2 0.9 35.8 0.9
SE = standard error. Note figures may not add to 100 per cent due to a proportion of ‘Don’t know’ or ‘refused’ responses. .. Not available
Table 8.13: 2001 2002 2003 2004 2005 2006
% SE(%) % SE(%) % SE(%) % SE(%) % SE(%) % SE(%)Have you attended a local community event in the past 6 months (like a church fete, school concert, craft exhibition)?Yes .. .. .. .. 52.7 0.8 49.7 0.8 54.2 0.8 53.3 0.8
No .. .. .. .. 46.9 0.8 49.9 0.8 45.5 0.8 46.4 0.8
SE = standard error. Note figures may not add to 100 per cent due to a proportion of ‘Don’t know’ or ‘refused’ responses. .. Not available
Table 8.14: Group membership
Group type2001 2002 2003 2004 2005 2006
% SE(%) % SE(%) % SE(%) % SE(%) % SE(%) % SE(%)Sports group .. .. 28.9 0.7 28.3 0.7 29.3 0.7 27.4 0.7 27.1 0.8Church group
.. .. 18.7 0.6 17.5 0.6 18.6 0.6 18.0 0.6 16.5 0.6
School group
.. .. 15.1 0.5 14.8 0.5 15.6 0.6 15.5 0.6 12.9 0.6
Professional group or academic society
.. .. 21.2 0.7 21.7 0.7 21.2 0.6 22.9 0.7 22.0 0.7
Other community or action group
.. .. 25.0 0.7 21.7 0.6 20.9 0.6 19.7 0.6 20.1 0.6
SE = standard error. Note figures may not add to 100 per cent due to a proportion of ‘Don’t know’ or ‘refused’ responses. .. Not available
Table 8.15: 2001 2002 2003 2004 2005 2006
% SE(%) % SE(%) % SE(%) % SE(%) % SE(%) % SE(%)Have you been to any support group meetings over the last 2 years?Yes .. .. 11.9 0.5 10.1 0.4 9.7 0.4 9.5 0.4 10.6 0.5
No .. .. 88.0 0.5 89.8 0.4 90.2 0.4 90.4 0.4 89.3 0.5
SE = standard error. Note figures may not add to 100 per cent due to a proportion of ‘Don’t know’ or ‘refused’ responses. .. Not available

Victorian Population Health Survey 2006 – Selected findings 81
1.1 BackgroundPopulation health surveys based on computer-assisted telephone interviews (CATI) are used to collect key population health surveillance data because they provide time series data, use collection procedures that are acceptable to respondents, use an adequate sample size, use current technology and provide high quality data (especially through greater supervision of interviewers, computer data entry and question sequencing). Further, they allow for data collection that is timely, cost-effective (especially in rural and urban areas) and adaptable to changing and emerging information needs. CATI surveys also fill strategic information gaps—that is, they can be used to gather information not available from other sources—and provide data for further analysis and interpretation.
1.2 MethodThe Victorian Population Health Survey 2006 followed a method developed over several years to collect relevant, timely and valid health information for policy, planning and decision making. The survey team administered CATI on a representative sample of persons aged 18 years or over who resided in private dwellings in Victoria. The Department of Human Services Human Research Ethics Committee approved the survey method and questionnaire content.
The department outsourced the fieldwork data collection to a market research organisation, which department staff supervised. All data were self-reported and stored directly in the CATI system.
1.2.1 Survey design
Random digit dialling was used to generate a sample of telephone numbers that formed the household sample for CATI. All residential households with land-line telephone connections were considered in-scope for the survey. A telephonic mode of survey delivery excludes various population groups, such as people who are homeless or itinerant, people in hospitals or institutions, the frail and aged, and people with disabilities who cannot participate in an interview.
1.3 StratificationFive rural and three metropolitan Department of Human Services regions cover Victoria. The survey sample included a total of 7500 households and was stratified by departmental region. The rural regions were over sampled because inequalities in health between urban and rural Victoria are a major interest.
Appendix A: The Victorian Population Health Survey 2006

82 Victorian Population Health Survey 2006 – Selected findings
1.4 Sampling frameThe department generated an electronic listing of Victorian six-digit telephone exchange prefixes and localities to form the basis of the sampling frame. It mapped exchange localities to one of the eight departmental regions, then divided the sampling frame into two groups: (i) telephone numbers belonging to a block of 100 numbers without a prefix match in an electronic directory of Victorian household telephone numbers (referred to as ‘empty blocks’) and (ii) telephone numbers belonging to blocks with one or more prefix matches in the directory.
1.4.1 Sample generation
The ‘no empty blocks’ approach excluded from the sampling frame those blocks of 100 consecutive telephone numbers known to be less likely than other blocks of 100 consecutive telephone numbers to result in private dwelling contact. This approach maximised fieldwork efficiency and minimised costs. That is, blocks that were likely to be less productive than others were excluded, so as to prevent the costs of pure random digit dialling from being prohibitive.
The department appended randomly generated suffixes to current eligible six-digit telephone number prefixes. It ‘washed’ these numbers against current electronic business listings to remove known business numbers. Matching the randomly generated telephone numbers to an electronic directory produced a file of matched telephone numbers, names and addresses. The department used that file to produce the primary approach letters.
1.4.2 Primary approach letter
Primary approach letters were mailed to all households where the randomly selected telephone number matched a listing in an electronic directory of Victorian household telephone numbers. Approximately 13,200 primary approach letters were mailed. The letter informed the households that the department was conducting the Victorian Population Health Survey to collect information about health, lifestyle and wellbeing in the community, and outlined the importance of the survey. It also introduced the market research company The Social Research Centre as the agency appointed to conduct the survey. After contacting a household, an interviewer would select for interview the person (usually a resident) aged 18 years or over with the most recent birthday.
1.5 Data collectionThe interviewers achieved over two-thirds of completed interviews within the first three calls. This proportion is consistent with national experience on similar projects. More experienced interviewers were chosen to work on refusal conversions, to increase the participation of selected respondents in the survey. This effort ensured respondents were a more representative sample of the population.

Victorian Population Health Survey 2006 – Selected findings 83
1.6 Call routineThe interviewers made up to six call attempts to establish contact with a household and up to another nine call attempts to complete an interview where required. Further attempts were made only when there was a clear opportunity for interview at the end of the 15th call. Over two-thirds of interviews were achieved within the first three calls. Call attempts were spread over different times of the day and different days of the week, and were controlled by a customised call algorithm in the survey management system. Except for engaged numbers at the first call attempt, a non-contact in any specific time block was automatically scheduled for call back in a different time block as per the call back routine. A scripted message was left at the first and second calls to an answering machine, encouraging respondents to contact the 1800 number. After establishing contact, interviewers could make calls, by appointment, outside the time block hours.
1.7 Interviewing in languages other than EnglishThe interviewing used six community languages. An external agency translated questionnaires into Mandarin, Cantonese, Vietnamese, Italian, Greek and Macedonian. CATI interviewers were recruited to undertake the interviews in these other languages as required. Respondents who received a primary approach letter, which was also translated into these languages, could nominate to be interviewed in their preferred language.
1.8 Fieldwork periodThe main interviewing occurred during August–November 2006 over 11 weeks. This followed two pilot tests of the questionnaire during June–July 2006, a debriefing of interviewers and the modification of the questionnaire as required.
1.9 ParticipationThe participation rate, defined as the proportion of households where contact was made and an interview was then completed, was 62 per cent.
1.10 WeightingThe survey data was weighted to reflect (i) the probability of selection of the respondent within the household and (ii) the age/sex/geographic distribution of the population. Although a single respondent was randomly selected from within a household, the size of any household can vary upwards from one person. To account for this variation, the project team treated each respondent as representing the whole household, so his or her weight factor included a multiplier of the number of persons in the household. Further, a household may have more than one telephone line (that is, land lines used primarily for contact with the household), which would increase that household’s probability of selection over those households with only one telephone line. To ensure the probability of contacting any household was the same, the project team divided the weight factor by the number of telephone lines connected to the household. The formula for this component is nah/npl, where: nah = the number of adults aged 18 years or over in the household npl = the number of telephone lines in the household.

84 Victorian Population Health Survey 2006 – Selected findings
1.10.1 Population benchmark components
Further to the selection weight component, the project team applied a population benchmark component to ensure the adjusted sample distribution matched the population distribution for the combined cross cells of age group and gender by region (for example, males aged 18–24 years in Barwon South West). The categories used for each of the variables were: • age groups: 18–24 years, 25–34 years, 35–44 years, 45–54 years, 55–64 years and
65 years or over• sex: male, female• region: Barwon South West, Grampians, Loddon–Mallee, Hume, Gippsland, Eastern,
North West Metropolitan and Southern Metropolitan.
The population benchmark component is calculated by dividing the population of each cross-cell by the sum of the selection weight components for all the respondents in the sample within that cross-cell. For each cross-cell, the formula for this component is:
pbmarki = Ni/Σswijwhere:i = the ith cross-cellj = the jth person in the cross cellNi = the population of the ith cross-cellΣswij = the sum of selection weightsfor all respondents (1 to j) in the ith cross-cell.
Calculating the person weight to be applied
The project team assigned respondent records a weight factor (pwt) by multiplying the selection weight (sw) value by the population benchmark value (pbmark):
pwtij = swij * pbmarkwhere:i = the ith cross-cellj = the jth person in the cross-cell.
1.11 Profile of survey respondentsKnown population benchmarks for selected data items may be used to assess the representativeness of the sample. Table A.1 shows the benchmark data and weighted and unweighted estimates obtained from the survey. A comparison between benchmark and survey data indicates the following: • Females were more likely than males to participate in the survey.• Persons younger than 65 years were less likely to participate than persons aged 65
years or over.• Persons born in Australia were more likely to participate than those born overseas,
perhaps as a result of those who do not speak English or any of the six languages offered for interview.
• The survey included a lower proportion of employed persons.
A small proportion of respondents (0.9 per cent) identified themselves as being Aboriginal or Torres Strait Islander.

Victorian Population Health Survey 2006 – Selected findings 85
Table A.1: Profile of respondents in the Victorian Population Health Survey 2006
Selected characteristics
Benchmark data (%)
Survey outcome
(%)
Survey estimate using probability
selection of weights
95% confidence interval
Lower limit
Upper limit
Sexi
Male 48.8 37.9 48.8 47.2 50.4Female 51.2 62.1 51.2 49.6 52.8
Age group (years)I18–24 12.8 6.1 12.8 11.4 14.125–34 19.1 12.3 18.7 17.3 20.235–44 19.6 19.5 19.5 18.3 20.745–54 17.7 20.8 17.7 16.6 18.855–64 13.4 18.9 13.8 12.8 14.765+ 17.4 22.3 17.6 16.5 18.6
Marital statusii
Married 50.0 56.8 57.9 56.3 59.5Widowed 6.0 8.6 4.7 4.2 5.2Separated/divorced 10.5 12.5 7.8 7.0 8.6Never married 33.4 14.3 20.4 18.9 21.9
Country of birthiii
Australia 76.2 79.9 73.7 72.2 75.2
Employment statusiv
Employed 61.6 55.8 61.0 60.8 61.2Unemployed 2.9 3.2 3.2 3.1 3.3Not in the labour force 35.2 40.8 35.5 35.4 35.6
Private health insurancev
Yes 42.2 50.0 51.8 50.2 53.4
SE = standard error
Notes to table 1.1i Persons aged 18 years or over. Australian Bureau of Statistics 2001 census, Canberra.ii Australian Bureau of Statistics 2006 census, Canberra. (The ‘never married’ category
is not directly comparable between the census and the Victorian Population Health Survey 2006 because the survey collected an extra category—‘living with a partner’.)
iii Australian Bureau of Statistics 2006 census, Canberra.iv Persons aged 15 years or over. Australian Bureau of Statistics 2001, Labour force,
Victoria, cat. no. 6202.2, Canberra.v Private Health Insurance Administration Council, www.phiac.gov.au. (Vic estimate 30
Sep 2006)na Not available.* Survey estimate was significantly lower than benchmark estimate (p<0.05).** Survey estimate was significantly higher than benchmark estimate (p<0.05).
Notes: 95 per cent confidence intervals are provided for benchmark data where available. The survey sample was allocated a 60 per cent/40 per cent rural/urban split respectively, and selected benchmark characteristics are for the whole of Victoria.

86 Victorian Population Health Survey 2006 – Selected findings
DemographicsAgeSexMarital statusCountry of birthMain language spoken at homeCountry of birth of motherCountry of birth of fatherHighest level of educationEmployment statusMain field of occupationHousehold incomeHousing tenureWhether has private health insuranceIndigenous statusArea of state (Department of Human Services region)Silent telephone number statusNumber of adults aged 18 years or over in household
Health care useWhether had blood pressure check in previous two yearsWhether had cholesterol check in previous two yearsWhether had a test for diabetes or high blood sugar levels in previous two yearsUse of and level of satisfaction with:• public hospital• community health centre• kindergarten• maternal and child health centre
Self-reported height and weight
NutritionNumber of serves of vegetables eaten each dayNumber of serves of fruit eaten each dayType of milk consumedConsumption of pasta/rice/noodles/other cooked cerealsConsumption of folate
Appendix B: Data items for the Victorian Population Health Survey 2006

Victorian Population Health Survey 2006 – Selected findings 87
AlcoholWhether had an alcoholic drink of any kind in previous 12 monthsFrequency of having an alcoholic drink of any kindAmount of standard drinks consumed when drinkingLevel of frequency of high risk drinking
SmokingSmoking statusFrequency of smoking
AsthmaAsthma statusAsthma action plans
Blood pressureHigh blood pressure statusManagement of high blood pressure
DiabetesDiabetes statusType of diabetes
Social capital measuresSocial networks and support structuresSocial and community participationCivic involvement and empowermentTrust in people and social institutionsTolerance of diversity
Physical activityWhether walked continuously for at least 10 minutes in previous weekAmount of time spent walking continuously in previous weekWhether did any vigorous physical activity in previous weekAmount of time spent doing vigorous activity
Self-reported health status
Kessler 10 measure of psychological distress

88 Victorian Population Health Survey 2006 – Selected findings
Health conditionsArthritisHeart diseaseStrokeCancerOsteoporosisDepression or anxiety
Eye careVisits to eye specialistsEye problems