Vibrationdata 1 Unit 15 SDOF Response to Base Input in the Frequency Domain.
20
Vibrationdata Vibrationdata 1 Unit 15 SDOF Response to Base Input in the Frequency Domain
-
Upload
sara-jones -
Category
Documents
-
view
217 -
download
0
Transcript of Vibrationdata 1 Unit 15 SDOF Response to Base Input in the Frequency Domain.

VibrationdataVibrationdata
1
Unit 15
SDOF Response to Base Input in the Frequency Domain
VibrationdataVibrationdata
2
Introduction
Steady-state response of an SDOF System
Base Inputs:Pure SinePSD – stationary with normal distribution

VibrationdataVibrationdata
3
SDOF System, Base Excitation
1 kfn
2 m
The natural frequency fn is
The amplification factor Q is
The damping coefficient C is
mk2C
)2/(1Q
VibrationdataVibrationdata
4
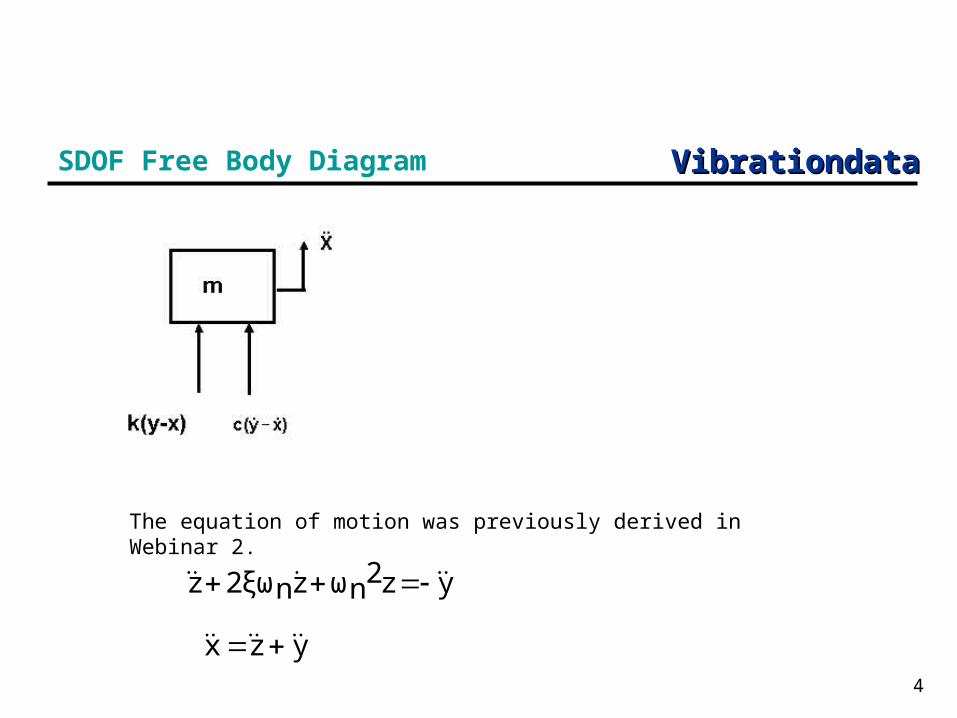
SDOF Free Body Diagram
The equation of motion was previously derived in Webinar 2.
yz2nωznω2ξz
yzx

VibrationdataVibrationdata
5
Sine Transmissibility Function
Either Laplace or Fourier transforms may be used to derive the steady state transmissibility function for the absolute response.
After many steps, the resulting magnitude function is
nf/fwhere
where f is the base excitation frequency and fn is the natural frequency.
222
2
21
)2(1
y
x

VibrationdataVibrationdata
6
0.1
1
10
20
0.1 1 10
Q = 10Q = 2Q = 1
Frequency Ratio ( f / fn )
Tra
nsm
issi
bilit
y (G
out
/ G
in )
TRANSMISSIBILITY MAGNITUDESDOF SYSTEM SUBJECTED TO BASE EXCITATION
The base excitation frequency is f. The natural frequency is fn.
Frequency Ratio (f / fn)

VibrationdataVibrationdataTransmissibility Curve Characteristics
7
The transmissibility curves have several important features:
1. The response amplitude is independent of Q for f << fn.
2. The response is approximately equal to the input for f << fn.
3. Resonance occurs when f fn.
4. The peak transmissibility is approximately equal to Q for f = fn and Q > 2.
5. The transmissibility ratio is 1.0 for f = 2 fn regardless of Q.
6. Isolation is achieved for f >> fn.

VibrationdataVibrationdataExercises
8
vibrationdata > Miscellaneous Functions >
SDOF Response: Steady-State Sine Force or Acceleration Input
Practice some sample calculations for the sine acceleration base input using your own parameters.
Try resonant excitation and then +/- one octave separation between the excitation and natural frequencies.
How does the response vary with Q for fn=100 Hz & f =141.4 Hz ?

VibrationdataVibrationdata “Better than Miles Equation”
9
Determine the response of a single-degree-of-freedom system subjected to base excitation, where the excitation is in the form of a power spectral density
The “Better than Miles Equation” is a.k.a. the “General Method”
VibrationdataVibrationdataMiles Equation & General Method
10
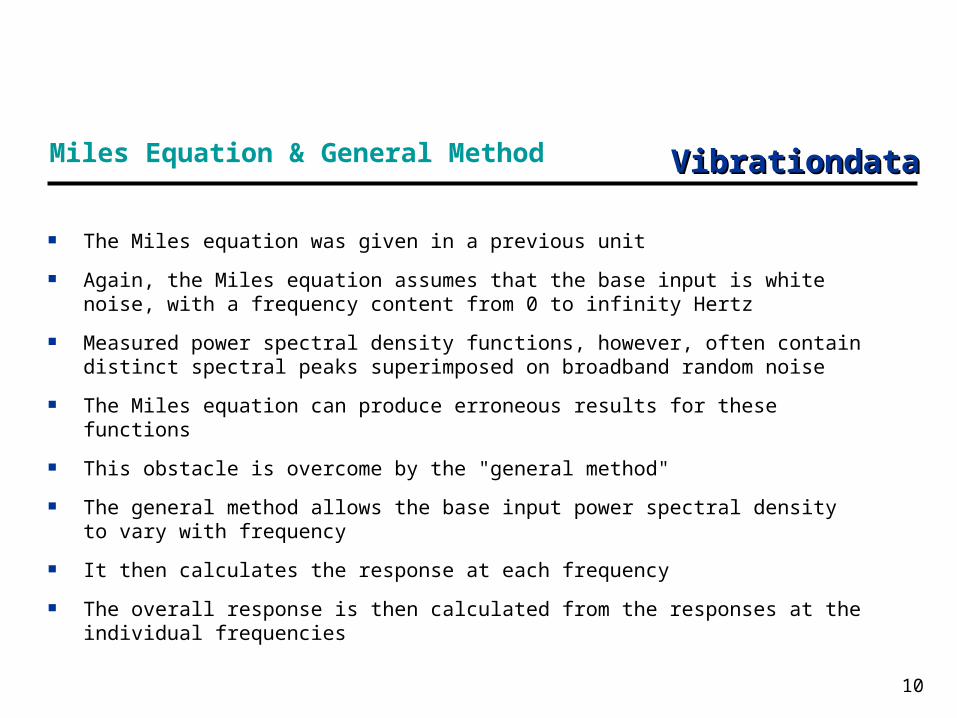
The Miles equation was given in a previous unit
Again, the Miles equation assumes that the base input is white noise, with a frequency content from 0 to infinity Hertz
Measured power spectral density functions, however, often contain distinct spectral peaks superimposed on broadband random noise
The Miles equation can produce erroneous results for these functions
This obstacle is overcome by the "general method"
The general method allows the base input power spectral density to vary with frequency
It then calculates the response at each frequency
The overall response is then calculated from the responses at the individual frequencies

VibrationdataVibrationdataGeneral Method
11
nii
N
1iiiPSDA
21
)2(1nGRMS
f/f
,f)f(Y,fx2
i22
i
2i
The general method thus gives a more accurate response value than the Miles equation.
The base excitation frequency is f i and the natural frequency is f n
The base input PSD is
)f(Y iPSDA

VibrationdataVibrationdataNavmat P-9492 Base Input
12
0.001
0.01
0.1
100 100020 2000
FREQUENCY (Hz)
AC
CE
L (
G2/H
z)
PSD OVERALL LEVEL = 6.06 GRMSPSD Overall Level = 6.06 GRMS
Frequency (Hz)
Accel (G^2/Hz) Frequency
(Hz) Accel
(G^2/Hz)
20 0.01
80 0.04
350 0.04
2000 0.007

VibrationdataVibrationdata
13
Apply Navmat P-9492 as Base Input
fn = 200 Hz, Q=10,
duration = 60 sec
Use:
vibrationdata > power spectral density > SDOF Response to Base Input

VibrationdataVibrationdata
14
SDOF Acceleration Response
= 11.2 GRMS = 33.5 G 3-sigma = 49.9 G 4.47-sigma
SDOF Pseudo Velocity Response
= 3.42 inch/sec RMS = 10.2 inch/sec 3-sigma = 15.3 inch/sec 4.47-sigma
SDOF Relative Displacement Response
= 0.00272 inch RMS = 0.00816 inch 3-sigma = 0.0121 inch 4.47-sigma
4.47-sigma is maximum expected peak from Rayleigh distribution
Miles equation also gives 11.2 GRMS for the response
Relative displacement is the key metric for circuit board fatigue per D. Steinberg (future webinar)

VibrationdataVibrationdataPseudo Velocity
The "pseudo velocity" is an approximation of the relative velocity
The peak pseudo velocity PV is equal to the peak relative displacement Z multiplied by the angular natural frequency
Pseudo velocity is more important in shock analysis than for random vibration
Pseudo velocity is proportional to stress per H. Gaberson (future webinar topic)
MIL-STD-810E states that military-quality equipment does not tend to exhibit shock failures below a shock response spectrum velocity of 100 inches/sec (254 cm/sec)
Previous example had peak velocity of 15.3 inch/sec (4.47-sigma) for random vibration
15
ZPV n

VibrationdataVibrationdata
16
Peak is ~ 100 x Input at 200 Hz Q^2 =100 Only works for SDOF system responseHalf-power bandwidth method is more reliable for determine Q.

VibrationdataVibrationdata
17
Peak Design Levels for Equivalent Static Load
Author Design or TestEquation Qualifying Statements
Himelblau, et al 3However, the response may be non-linear and non-Gaussian
Fackler 33 is the usual assumption for the equivalent peak sinusoidal level
Luhrs 3Theoretically, any large acceleration may occur
NASA
3 forSTS Payloads
2 forELV Payloads
Minimum Probability Level Requirements
McDonnellDouglas 4
Equivalent Static Load
Scharton & Pankow 5See Appendix C
DiMaggio, Sako, Rubin nSee Appendices B and D for the equation to calculate n via the Rayleigh distribution
Ahlin Cn See Appendix E for equation to calculate Cn

VibrationdataVibrationdata
18
Rayleigh Peak Response Formula
Tfnln2nc
nc
5772.0ncnC
nnC Maximum Peak
fn is the natural frequencyT is the durationln is the natural logarithm function
is the standard deviation of the oscillator responsen
Consider a single-degree-of-freedom system with the index n. The maximum response can be estimated by the following equations.
a.k.a. crest factor

VibrationdataVibrationdataConclusions
19
The General Method is better than the Miles equation because it allows the base input to vary with frequency
For SDOF System (fn=200 Hz, Q=10) subjected to NAVMAT base input…
We obtained the same response results in the time domain in Webinar 14 using synthesized time history!
Response peaks may be higher than 3-sigma
High response peaks need to be accounted for in fatigue analyses (future webinar topic)

VibrationdataVibrationdataHomework
20
Repeat the exercises in the previous slides
Read
T. Irvine, Equivalent Static Loads for Random Vibration, Rev N, Vibrationdata 2012
T. Irvine, The Steady-state Response of Single-degree-of-freedom System to a Harmonic Base Excitation, Vibrationdata, 2004
T. Irvine, The Steady-state Relative Displacement Response to Base Excitation, Vibrationdata, 2004