Vibrational spectra, conformational equilibrium and ab initio calculations of 1,2-diphenylethane
18
Vibrational spectra, conformational equilibrium and ab initio calculations of 1,2-diphenylethane Anne Horn a , Peter Klaeboe a, * , Bojidar Jordanov b , Claus J. Nielsen a , Valdemaras Aleksa a,1 a Department of Chemistry, University of Oslo, P.O. Box 1033, Blindern, Oslo 0315, Norway b Institute of Organic Chemistry, Bulgarian Academy of Sciences, BG-1113 Sofia, Bulgaria Received 16 September 2003; accepted 4 November 2003 Dedicated to Professor Manfred Winnewisser and Dr Brenda Winnewisser for their outstanding contributions to Molecular Spectroscopy Abstract The infrared spectra of 1,2-diphenylethane were recorded as a melt and crystalline solid in capillary films and as a pellet in KBr and polyethylene in the 4000 – 50 cm 21 range. Moreover, the sample was isolated in an argon matrix at ca. 5 K, and the spectra recorded in the range 3100 – 450 cm 21 , before and after annealing. Raman spectra of the melt were recorded between 295 (supercooled) and 357 K, and spectra of the crystalline solid were obtained at ambient temperature. A number of infrared and Raman bands in the melt vanish in spectra of the crystal, and the compound undoubtedly exists as a mixture of two conformers in the melt, probably anti and gauche. Various non-coincidences between the infrared and Raman bands of the crystals agree with C 2h symmetry of the anti conformer. The intensity variations with temperature of two band pairs in the liquid phase Raman spectra were used for van’t Hoff plots, giving a value of 2.4 ^ 0.5 kJ mol 21 for DH (gauche – anti). The anti conformer had the lower energy and was also present in the crystal. Very small intensity changes were detected when the matrix spectra were annealed to 36 K (argon) revealing that the conformational barrier was too high to allow significant conversion from gauche to the anti conformer even at the highest annealing temperature of 36 K. Ab initio calculations were carried out with the GAUSSIAN 98 program at the RHF/6-311G* level and the vibrational frequencies for the anti and gauche conformers including infrared and Raman intensities were calculated. After appropriate scaling, a reasonably good agreement was obtained between the experimental and calculated wavenumbers for both conformers. Nearly all of the 78 fundamentals of the anti and 24 of the gauche conformers were tentatively assigned. However, strong overlap between the anti and gauche conformer bands was observed in most of the spectral region, and additional accidental degeneracy in the spectra prevented reliable assignments for all the vibrational bands. q 2003 Elsevier B.V. All rights reserved. Keywords: 1,2-Diphenylethane; Conformational stability; Infrared and Raman spectra; Ab initio calculations 1. Introduction 1,2-Diphenylethane (dibenzyl), later to be abbreviated DPE, is an example of a 1,2-disubstituted ethane, and this group of molecules has been a classical field for conformational investigations. In their pioneering studies of 1,2-dihaloethanes by means of infrared and Raman spectroscopy, Mizushima [1] and co-workers laid the foundation for these investigations more than 50 years ago. Unlike, the simple 1,2-dihaloethanes with 18 funda- mental modes of each conformer, DPE has complex infrared and Raman spectra with 78 vibrational modes due to the bulky benzene substituents. Because of the complexity of this molecule, only few spectroscopic investigations have been published for DPE. A number of X-ray studies of DPE have been reported [2–6] revealing the anti conformer to be present in the crystal. The central C – C bond was found to be considerably shorter than usual [4–6]. This result was tentatively interpreted [4] as an average of a 1:1 mixture of two conformers in the crystal, which were interconverted by the torsional vibration of the benzene rings as previously 0022-2860/$ - see front matter q 2003 Elsevier B.V. All rights reserved. doi:10.1016/j.molstruc.2003.11.042 Journal of Molecular Structure 695–696 (2004) 77–94 www.elsevier.com/locate/molstruc 1 Permanent address: Department of General Physics and Spectroscopy, Vilnius University, 2734 Vilnius, Lithuania. * Corresponding author. Tel.: þ 47-22-85-5678; fax: þ47-22-85-5441. E-mail address: [email protected] (P. Klaeboe).
Transcript of Vibrational spectra, conformational equilibrium and ab initio calculations of 1,2-diphenylethane
Vibrational spectra, conformational equilibrium and ab initio
calculations of 1,2-diphenylethane
Anne Horna, Peter Klaeboea,*, Bojidar Jordanovb, Claus J. Nielsena, Valdemaras Aleksaa,1
aDepartment of Chemistry, University of Oslo, P.O. Box 1033, Blindern, Oslo 0315, NorwaybInstitute of Organic Chemistry, Bulgarian Academy of Sciences, BG-1113 Sofia, Bulgaria
Received 16 September 2003; accepted 4 November 2003
Dedicated to Professor Manfred Winnewisser and Dr Brenda Winnewisser for their outstanding contributions to Molecular Spectroscopy
Abstract
The infrared spectra of 1,2-diphenylethane were recorded as a melt and crystalline solid in capillary films and as a pellet in KBr and
polyethylene in the 4000–50 cm21 range. Moreover, the sample was isolated in an argon matrix at ca. 5 K, and the spectra recorded in the
range 3100–450 cm21, before and after annealing. Raman spectra of the melt were recorded between 295 (supercooled) and 357 K, and
spectra of the crystalline solid were obtained at ambient temperature.
A number of infrared and Raman bands in the melt vanish in spectra of the crystal, and the compound undoubtedly exists as a mixture of
two conformers in the melt, probably anti and gauche. Various non-coincidences between the infrared and Raman bands of the crystals agree
with C2h symmetry of the anti conformer. The intensity variations with temperature of two band pairs in the liquid phase Raman spectra were
used for van’t Hoff plots, giving a value of 2.4 ^ 0.5 kJ mol21 for DH (gauche–anti). The anti conformer had the lower energy and was also
present in the crystal. Very small intensity changes were detected when the matrix spectra were annealed to 36 K (argon) revealing that the
conformational barrier was too high to allow significant conversion from gauche to the anti conformer even at the highest annealing
temperature of 36 K.
Ab initio calculations were carried out with the GAUSSIAN 98 program at the RHF/6-311G* level and the vibrational frequencies for the
anti and gauche conformers including infrared and Raman intensities were calculated. After appropriate scaling, a reasonably good
agreement was obtained between the experimental and calculated wavenumbers for both conformers. Nearly all of the 78 fundamentals of the
anti and 24 of the gauche conformers were tentatively assigned. However, strong overlap between the anti and gauche conformer bands was
observed in most of the spectral region, and additional accidental degeneracy in the spectra prevented reliable assignments for all the
vibrational bands.
q 2003 Elsevier B.V. All rights reserved.
Keywords: 1,2-Diphenylethane; Conformational stability; Infrared and Raman spectra; Ab initio calculations
1. Introduction
1,2-Diphenylethane (dibenzyl), later to be abbreviated
DPE, is an example of a 1,2-disubstituted ethane, and this
group of molecules has been a classical field for
conformational investigations. In their pioneering studies
of 1,2-dihaloethanes by means of infrared and Raman
spectroscopy, Mizushima [1] and co-workers laid the
foundation for these investigations more than 50 years
ago. Unlike, the simple 1,2-dihaloethanes with 18 funda-
mental modes of each conformer, DPE has complex infrared
and Raman spectra with 78 vibrational modes due to the
bulky benzene substituents. Because of the complexity of
this molecule, only few spectroscopic investigations have
been published for DPE.
A number of X-ray studies of DPE have been reported
[2–6] revealing the anti conformer to be present in the
crystal. The central C–C bond was found to be considerably
shorter than usual [4–6]. This result was tentatively
interpreted [4] as an average of a 1:1 mixture of two
conformers in the crystal, which were interconverted by the
torsional vibration of the benzene rings as previously
0022-2860/$ - see front matter q 2003 Elsevier B.V. All rights reserved.
doi:10.1016/j.molstruc.2003.11.042
Journal of Molecular Structure 695–696 (2004) 77–94
www.elsevier.com/locate/molstruc
1 Permanent address: Department of General Physics and Spectroscopy,
Vilnius University, 2734 Vilnius, Lithuania.
* Corresponding author. Tel.: þ47-22-85-5678; fax: þ47-22-85-5441.
E-mail address: [email protected] (P. Klaeboe).
assumed for stilbene [7]. However, the C–C distance
increases in DPE at lower temperatures [5] and the short
distance was interpreted as an artifact [6] caused by the
torsional vibrations of the C–Ph bonds in the crystal [5].
The IR and Raman spectra of crystalline DPE [8] were
studied more than 30 years ago, and although nearly all
the IR bands coincided with those observed in Raman, the
spectra were interpreted in terms of an anti conformer. The
vibrational spectra of DPE and some related molecules in
the neat solids and saturated solutions (CCl4) by Chiu et al.
[9] revealed additional bands in solution of some of the
derivatives, suggesting additional conformers. In their
spectroscopic investigation of DPE and some derivatives,
North et al. [10] also suggested an additional conformer in
CCl4 and C6H12 solution, but no additional bands were
observed, except for the band at 217 cm21 (see below).
When heated above the melting point, the spectra became
slightly richer [10] and these non-identified bands were
attributed to a probable gauche conformer, in addition to the
anti conformer in the solid.
Lately, DPE has been investigated by means of gaseous
electron diffraction technique at 373 K [11], and a
predominance of the anti conformer was reported. Various
theoretical calculations on DPE with different basis sets
[12–15] have been reported, but the enthalpy difference
[16] between the anti and gauche conformers gave
inconclusive results [16,17].
Since the infrared and Raman spectra of DPE were
reported approximately 30 years ago and these results were
quite incomplete after present day standards, we decided to
carry out a comprehensive study of this molecule. We
discovered that DPE was easy to work with and gave
favourable results. The sample, which melts at 325 K forms
easily a supercooled melt, which is metastable for weeks in
an ampoule at room temperature. The sample can be studied
as a capillary melt between KBr (MIR) or polyethylene
plates (FIR) and the IR spectra recorded. Another
alternative is to prepare pellets of DPE in KBr or
polyethylene matrices. These pellets can be investigated at
room temperature, giving spectra of the solid, and may be
heated above 325 K, resulting in melt spectra. Also, the
Raman spectra of a melt above 325 K, of a supercooled melt
at room temperature and of a crystalline solid were all easily
recorded. The Raman spectra showed no fluorescence even
at a higher temperature of approximately 360 K, and the
signal to noise ratio was quite high. It was found highly
advantageous to study the IR and Raman spectra of DPE as
a melt rather than in saturated solution. Finally, a number of
IR and Raman bands present in the melt spectra vanished in
those of the crystal, interpreted as a conversion to the more
stable conformer.
In the present investigation we have assumed that the anti
conformer has parallel benzene rings, situated at right angle
to the plane defined by the central CCCC bonds. This was
reported from X-ray studies of the crystal [5], and gives rise
to point group C2h with mutual exclusion between the IR
and Raman modes. The gauche conformer has been
interpreted in terms of C2 symmetry, although no definite
structural results are available to verify this assumption.
2. Experimental
2.1. Sample preparation
The sample of DPE was a commercial product from
E. Merck, Darmstadt, with the quality for synthesis (zur
Synthese). The sample was additionally purified by
sublimation for the purpose of spectral measurements. The
melting point was found to be the same as the literature
value, 325 K.
2.2. Infrared spectral measurements
The infrared spectra were recorded on various Fourier
transform spectrometers; Bruker models IFS-88 and IFS-66
(4000–400 cm21) and a Perkin–Elmer model 2000 (4000–
400 cm21) were employed in the middle infrared region
(MIR). Two different vacuum benches of Bruker IFS-113v
(600–50 cm21) were used in the far infrared region (FIR).
All the spectrometers had DTGS detectors. Beam splitters
of Ge/KBr were employed in MIR, Mylar beam splitters of
thickness 6 and 12 mm and a metal mesh beam splitter were
used in FIR. No vapour spectra could be investigated,
because of the low vapour pressure of DPE (less than
0.1 Torr at ambient temperature).
The melt and the crystalline solid were recorded by
various techniques. The powdered solid was deposited
between two KBr (MIR) or two polyethylene plates (FIR)
and heated to temperatures around 330 K. The sample
formed a capillary melt, which was immediately placed in the
spectrometers. Because of the tendency of DPE to supercool,
the capillary layer could be investigated for an extended time,
although the temperature fell below 300 K. The next day the
recordings were repeated, and now the sample formed a
crystalline layer, and the IR spectra revealed that various
bands in the melt had vanished. When the capillaries were
kept in a refrigerator at ca. 280 K, the spectra were identical
to those of the crystal obtained previously.
The sample was ground with KBr (MIR) or with
polyethylene (FIR) and pellets were pressed. The samples
of the crystal were very similar to those of the solid
capillary. When heated to ca. 330 K the pellets became quite
transparent because of melting. However, the sample
crystallized shortly after the temperature reached 300 K,
indicating only low supercooling in the pellets. Apparently,
the KBr or polyethylene matrix initiated crystallization of
DPE just below the melting point. Successful MIR spectra
were recorded within 15 min from melting the sample, but
in FIR some samples turned partly crystalline during the
recording, since longer time in the vacuum spectrometer
was required to record the spectra. Independently, pellets of
A. Horn et al. / Journal of Molecular Structure 695–696 (2004) 77–9478

Table 1
Infrared and Raman spectral data for 1,2-diphenylethane (DPE)
Infrared Raman Interpretation
Ar-matrix Melt Solid Melt Solid Anti Gauchea
Pellet Capillary Capillary Pellet36 Kb, 5 Kc 330 Kc 330 Kc 295 Kc 295 Kc 330 Kc 295 Kc
3211 w 3211 vw, P 3219 w3164 vw 3162 vvw 3162 vvw 3173 w, P 3173 w
3114 w 3104 w 3104 w 3104 w 3102 w 3104 vvw3090 s 3085 s 3085 s 3083 s 3082 m
3072 m, P 3071 vs Ag n1
3070 s 3063 s 3061 s 3058 s 3057 s 3063 s, P 3067 vs Bg n23
3059 w, sh 3054 vs, P 3052 s Ag n2
3045 vw, sh 3043 m, br 3043 m3034 vs 3027 vs 3027 vs 3027 vs 3026 vs 3030 w, br, D 3030 w, sh Au n40 Bu n58
3009 m 3003 w 3002 m 3002 m 3003 w, P 3003 w Au n41 Bu n59
2990 w 2987 w Ag n3
2980 w 2978 w Bg n24
2951 m Bu n60
2939 vw 2939 s 2944 vs 2943 s 2939 w, sh 2937 m Au n42
2932 m 2930 m 2924 m, sh2916 vw, sh 2925 s 2924 s 2919 m 2918 s 2917 w2896 vw, br 2896 m 2896 m, br Bg n25
2866 s 2858 s 2856 s 2856 m 2855 s 2864 m 2859 m Ag n4 Bu n61
2630 w 2630 w2604 w 2603 w 2603 w 2612 vw2582 w 2582 w 2589 w
1962 vw 1960 w, sh 1958 w, sh 1964 w1946 vw 1943 m 1943 m 1947 m1885 vw 1882 w, sh 1883 w, sh 1889 w1871 vw 1868 m 1868 m 1875 m1810 vw 1802 m 1802 m 1808 m
1745 w 1746 w 1751 m1636 vw 1635 vw
1625 m1619 m 1620 w 1619 w Bg n26
1604 s 1602 s 1602 s 1600 s 1599 s 1604 s 1604 s Ag n5 Bu n62
1593 w " 1585 m 1584 m 1583 m 1583 m 1582 m 1583 m Au n43
1576 m1539 w 1543 w 1555 w,br 1538 vw
1527 vw 1528 w 1528 w 1529 vw1496 vs 1495 vs 1495 vs 1493 vs 1490 vs 1496 vw 1495 vw Ag n6 Bu n63
1455 vs 1453 vs 1453 vs 1451 s 1450 vs 1452 w, D? 1454 w? Ag n7 Au n44 Bu n64
1449 w # 1443 m, sh p p B n52
1441 m, D 1435 m Bg n27
1394 vw 1396 w, P 1402 vw?1380 w, br 1384 w 1385 w 1383 m 1383 w 1384 w 1389 vw
1344 s, P 1347 m Ag n8
1345 m " 1343 m 1343 m p p A n13
1333 w 1332 w 1332 w, sh 1332 vw 1331 vw 1334 vw 1334 m Bg n28 Au n45
1319 vw 1319 vw 1320 vw, br 1312 w, sh, P 1320 w, sh A n14
1300 vw 1300 w Bg n29
1293 vw p 1291 w1271 vw? 1268 vw 1268 vw 1262 vw 1266 vw? 1268 w Bu n65
1246 vw 1243 vw 1246 vw 1245 vw 1246 vw 1245 vw A n15
1221 vw 1225 vw, br 1230 vw? Au n46
1216 w 1216 w 1216 w p p B n55
1194 w 1198 vw 1198 w 1201 w 1201 w 1200 s, P 1204 s Bg n30 A n16
1193 w, sh 1196 vw, sh Ag n9
1182 w " 1181 m 1180 m 1180 w 1179 m 1183 w, D 1180 m Bu n66
1173 vw1157 w " 1155 m 1155 m 1145 m 1145 s 1159 m, D? 1156 m Ag n10
1140 w " 1146 m 1145 w 1141 w, sh 1142 m Au n47 Bu n67
1107 vw, br 1107 w 1108 w p p 1110 vvw Bg n31 A n19
1083 s 1080 m, sh 1079 m p p 1084 vw, P? 1078 vw B n59
1073 vw Bg n32
1068 s 1068 s 1068 s 1063 s 1063 s Au n48
1049 w "1031 s 1030 s 1030 s 1027 s 1028 s 1028 s, P 1028 s Au n49
(continued on next page)
A. Horn et al. / Journal of Molecular Structure 695–696 (2004) 77–94 79

DPE in polyethylene were prepared by soaking polyethy-
lene powder in a saturated solution of DPE in chloroform.
After the solvent was evaporated, the pellet was pressed.
These spectra revealed that DPE probably formed a
crystalline powder in the pellet.
The vapour pressure of DPE was too low to allow the
conventional mixing of the vapour with that of the inert gas
(argon) before being deposited on the cold window. Instead
the sample was placed in a quartz capillary which could be
heated electrically, ca. 7 cm from the cold CsI window.
Table 1 (continued)
Infrared Raman Interpretation
Ar-matrix Melt Solid Melt Solid Anti Gauchea
Pellet Capillary Capillary Pellet36 Kb, 5 Kc 330 Kc 330 Kc 295 Kc 295 Kc 330 Kc 295 Kc
1015 s Ag n11
1003 vs, P 1003 vs Ag n12
1004 vw 1003 vw 1003 vw 1004 vw 1003 vw Bu n68
983 w, br " 982 w 983 w 985 w 983 w 986 vw 992 vw, sh Au n50 Bu n69
983 vw, sh Ag n13
965 vw 964 w 964 w 969 m 966 m 972 w 968 vw Ag n14 Bg n33 Bu n70
966 w 956 vw 954 vvw Bg n34
941 m 938 m 938 m p p 940 m, P p B n65
904 m, P 906 w Ag n15
908 m " 906 m 906 m 906 w 909 m Bu n71
890 vw 888 vw p ? 890 vw 890 vw p B n66
853 w 853 vvw 853 vvw Au n51
842 m 842 m 841 w 842 w 846 vs,P 849 vs Ag n16 Bg n35
805 vw, P 809 vw Ag n17
771 m 790 w, sh 788 w, sh 791 vw 790 vw 786 w, D p768 m 765 s, sh 765 s, sh 767 s 763 s Bu n72
760 s, P p A n29
757 vs 753 vs 753 vs 752 vs 752 vs Au n52 Bu n73
742 w 738 s p p B n69
740 s, P 737 m Ag n17
718 vw 721 m p A n30
700 vs 697 vs 698 vs, br 700 vs 698 vs 699 vw, P 696 vw Ag n18 Bu n74
695 s, sh 695 w, sh A n31
678 m, sh 678 w B n70
622 vw 621 vw 622 w 622 w 621 w 619 s, D 621 m Bg n36 Au n53
613 vw 612 vw 611 w p p 612 w, D? 612 w, sh Ag n19 B n71
582 m 580 s 580 m p 580 w 576 w p B n72
578 w538 w537 w 537 m 534 w, sh 527 m 527 m 532 w, P p Bu n75 A n33
526 vs 519 vs 520 vs, br 517 vs 517 m 520 w, sh Bu n76
523 s504 s 503 s 503 s p p 503 w, D? p B n73
502 m 483 w 482 w 480 w473 w 471 vw p p 478 w p Ag n20
472 w 468 w 468 w p 468 vw 469 m, D 464 m A n34
426 w 428 vw p B n74
412 vvw 409 vvw 405 vw 405 vw, P? 404 vw Bg n37 Au n54
402 w 403 vvw 403 vvw 401 vw Au n55
380 m 380 m 379 w 371 w p B n75
364 w p B n76
325 vw 325 vw 327 vw p Bg n38
290 w, sh 287 s 291 m 309 vw Bu n77
284 m242 vw, br 234 s, P 243 s Ag n21
157 w 152 vw 152 vw B n77
131 m, br, D? 142 s Ag n22
105 w, sh93 w 91 m, sh Bu n78
75 vs Bg n39
35 s
pSpectral bands disappearing in the crystal, # " denote diminishing and increasing intensities after annealing, respectively. The anti conformer with C2h
symmetry has the symmetry species: Ag, Bg, Au, Bu, the gauche conformer with C2 symmetry has the species A and B; for numbering of fundamental modes,
see Table 4.a Gauche modes not listed, presumably coincide with anti fundamentals.b Annealing temperature.c Recording temperature.
A. Horn et al. / Journal of Molecular Structure 695–696 (2004) 77–9480

The sample evaporated in a stream of pure argon gas and
the mixture was deposited on the window of a Displex
cryostat from APD (model HS-4) with a three stage cooling
system at 5 K. Independent experiments were carried out, in
which the sample was heated to 300 K or left unheated (ca.
285 K) in an argon stream for 1–2 h.
IR spectra of the matrix isolated sample were recorded
between 3500 and 400 cm21, subsequently the matrix was
heated to 20 K in order to remove site effects. Then, the
matrix was annealed in steps of 3–5 K in periods of
15 min to a maximum of 36 K. At still higher tempera-
tures the inert gases have a pressure higher than 1023
Torr, which is not feasible in the cryostat. After each
annealing the window was recooled to 5 K and the spectra
were recorded.
2.3. Raman spectral measurements
The Raman spectra were obtained using a Dilor RTI-30
spectrometer (triple monochromator) and recorded digitally.
An argon ion laser from Spectra Physics (model 2000) was
employed using the 514.5 nm line for excitation. The melt
was studied between 298 and 357 K in a capillary tube of
2 mm inner diameter. It was heated with hot air and the
temperature controlled with a calibrated iron-constantan
thermocouple. Semiquantitative polarization measurements
were carried out. The variable temperature spectra were
employed for calculating the enthalpy difference DconfH
between the conformers in the liquid. The melt in a glass
tube might be kept at room temperature for months before
crystallization, or it could happen after a few hours. In a
refrigerator the sample crystallized readily at 278 K. The
crystal spectra were recorded at room temperature, employ-
ing both 90 and 1808 excitation.
3. Results
3.1. Infrared spectral results
MIR spectra of DPE as a capillary between two KBr
plates were recorded both as a melt above 325 K and as a
supercooled melt at room temperature. Corresponding
spectra were recorded of the crystalline solid, and these
data are listed in Table 1. Independent IR spectra were
recorded of the heated and unheated KBr pellets, and both
spectra were quite similar to those of the melt and the solid
in the capillary films. The pellet spectra are shown in Figs. 1
and 2 (1250–800 cm21 and 860–400 cm21, respectively),
in which the spectra of the heated pellet are represented by a
dashed curve, the spectra of the solid state are drawn with a
solid curve. It can be seen from the curves that several bands
of the melt vanished in the spectra of the crystal; 1443,
1343, 1293, 1216, 1108, 1079, 938, 738, 721, 611, 580, 503,
471, 468 and 364 cm21. These disappearing bands are
marked with asterisks in Table 1.
FIR spectra were recorded of DPE as a melted and
solidified capillary between two polyethylene plates as
demonstrated in Fig. 3 (650–200 cm21). An additional
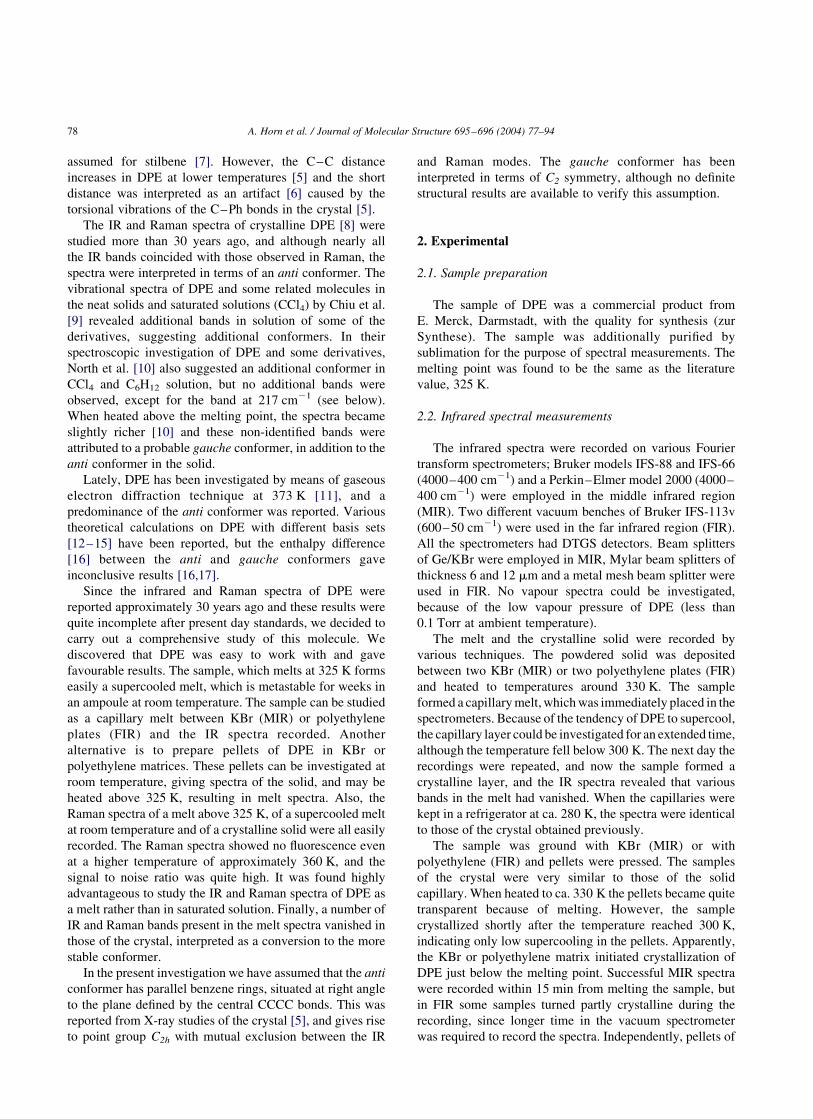
spectrum of DPE in a polyethylene pellet at high
concentration is presented in Fig. 4 (450–80 cm21). The
IR spectra agreed reasonably well with the results of the
older studies [9,10], which were restricted to pellets, but
most of our weak bands had not been reported earlier. Bands
at 1340, 580 and 503 cm21 reported in a KBr pellet [9] were
not detected in our spectra of the solid, but were present in
the melt spectra. In the earlier investigations employing
dispersive spectrometers [9,10], the higher temperature in
the sample compartment compared to modern FT spec-
trometers, probably favoured a partly melting of the samples.
Infrared spectra of DPE in argon matrices, deposited at
5 K were recorded. The mixing ratio between the sample
and the inert gas is not known, due to the experimental
technique employed (see above). Apart from a small
amount of water giving rise to a broad band at
Fig. 1. Middle infrared (MIR) spectra of 1,2-diphenylethane (DPE) as a
KBr pellet in the range 1250–800 cm1; solid line, solid state spectrum;
dashed line, melt spectrum.
Fig. 2. MIR spectra of DPE as a KBr pellet in the range 860–400 cm21;
solid line, solid state spectrum; dashed line, melt spectrum.
A. Horn et al. / Journal of Molecular Structure 695–696 (2004) 77–94 81
3400 cm21, the matrix spectra had good quality and a
number of sharp bands were observed in the MIR region.
Spectra were recorded of the unannealed matrix and after
heating the matrix to 20, 23, 26, 29, 32, 34 and 36 K with
cooling to 5 K before each recording. Only small spectral
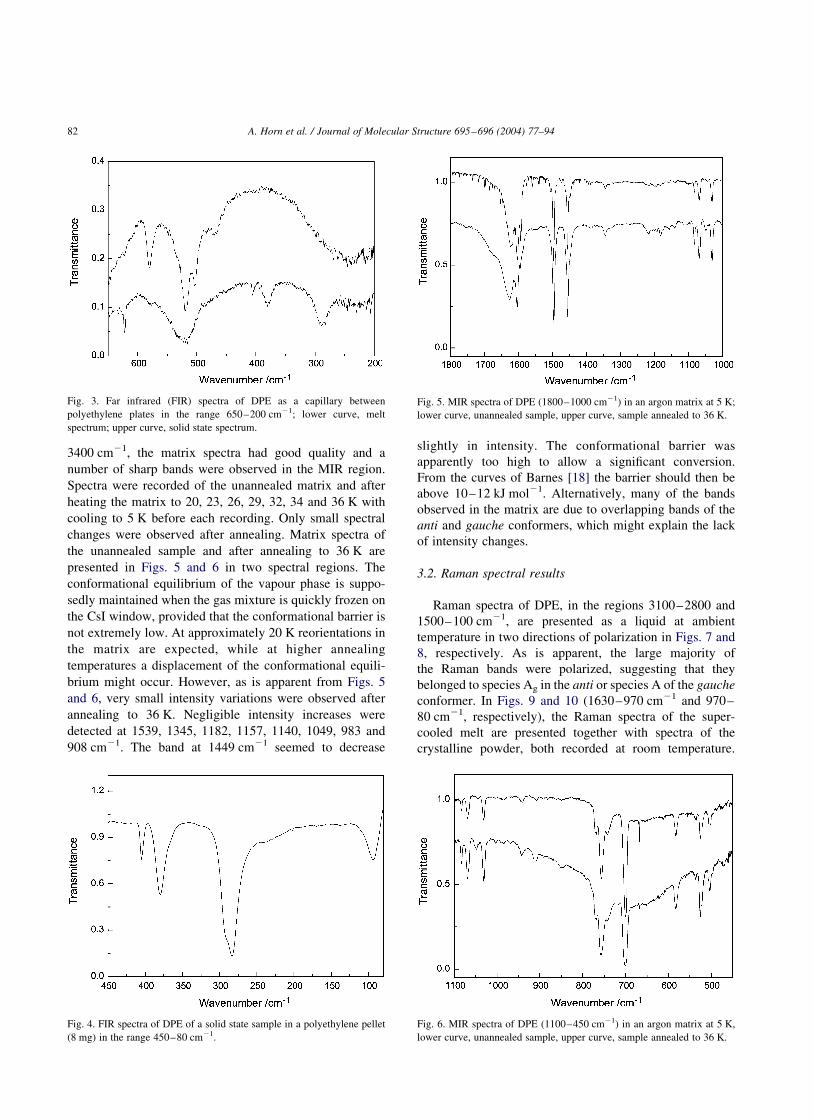
changes were observed after annealing. Matrix spectra of
the unannealed sample and after annealing to 36 K are
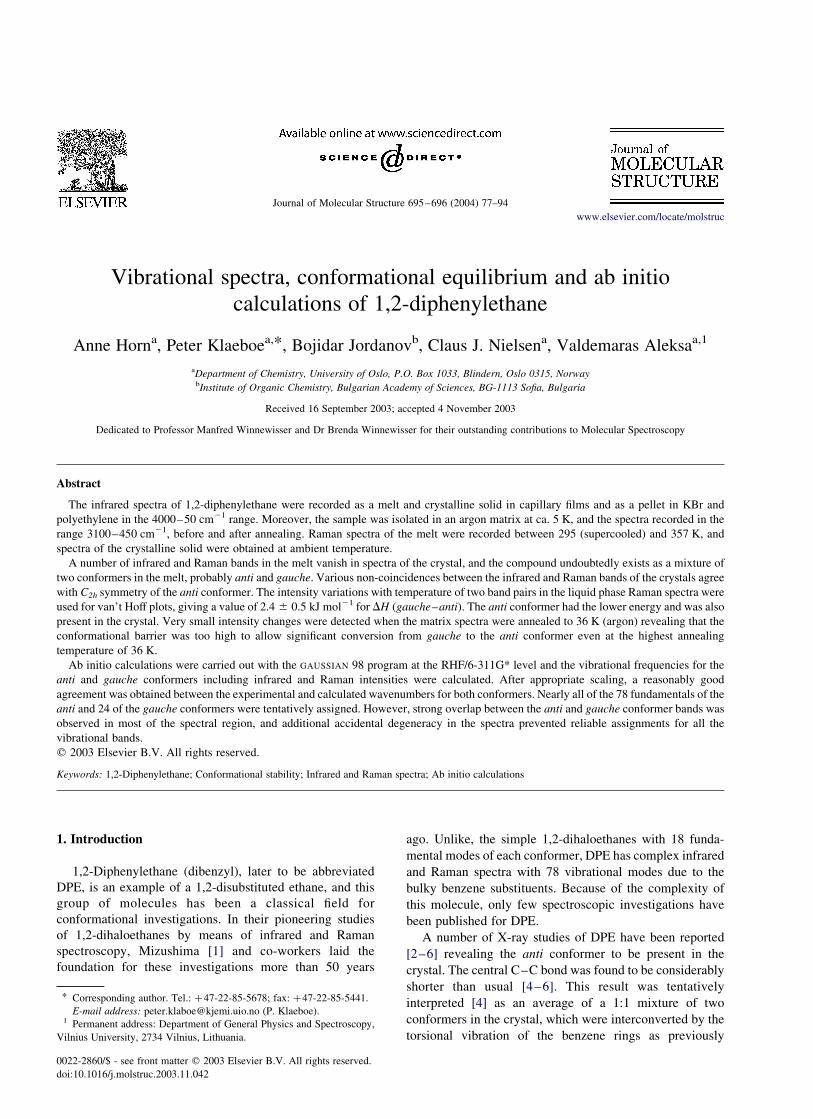
presented in Figs. 5 and 6 in two spectral regions. The
conformational equilibrium of the vapour phase is suppo-
sedly maintained when the gas mixture is quickly frozen on
the CsI window, provided that the conformational barrier is
not extremely low. At approximately 20 K reorientations in
the matrix are expected, while at higher annealing
temperatures a displacement of the conformational equili-
brium might occur. However, as is apparent from Figs. 5
and 6, very small intensity variations were observed after
annealing to 36 K. Negligible intensity increases were
detected at 1539, 1345, 1182, 1157, 1140, 1049, 983 and
908 cm21. The band at 1449 cm21 seemed to decrease
slightly in intensity. The conformational barrier was
apparently too high to allow a significant conversion.
From the curves of Barnes [18] the barrier should then be
above 10–12 kJ mol21. Alternatively, many of the bands
observed in the matrix are due to overlapping bands of the
anti and gauche conformers, which might explain the lack
of intensity changes.
3.2. Raman spectral results
Raman spectra of DPE, in the regions 3100–2800 and
1500–100 cm21, are presented as a liquid at ambient
temperature in two directions of polarization in Figs. 7 and
8, respectively. As is apparent, the large majority of
the Raman bands were polarized, suggesting that they
belonged to species Ag in the anti or species A of the gauche
conformer. In Figs. 9 and 10 (1630–970 cm21 and 970–
80 cm21, respectively), the Raman spectra of the super-
cooled melt are presented together with spectra of the
crystalline powder, both recorded at room temperature.
Fig. 6. MIR spectra of DPE (1100–450 cm21) in an argon matrix at 5 K,
lower curve, unannealed sample, upper curve, sample annealed to 36 K.
Fig. 5. MIR spectra of DPE (1800–1000 cm21) in an argon matrix at 5 K;
lower curve, unannealed sample, upper curve, sample annealed to 36 K.
Fig. 4. FIR spectra of DPE of a solid state sample in a polyethylene pellet
(8 mg) in the range 450–80 cm21.
Fig. 3. Far infrared (FIR) spectra of DPE as a capillary between
polyethylene plates in the range 650–200 cm21; lower curve, melt
spectrum; upper curve, solid state spectrum.
A. Horn et al. / Journal of Molecular Structure 695–696 (2004) 77–9482

The most intense Raman bands were observed at 3063, 1028
and 1003 cm21, all being strongly polarized. As clearly
shown in the spectra, several bands, which were present in
the melt vanished in the spectra of the crystal in agreement
with the findings in the IR spectra.
Many of the weaker Raman bands of the solid, listed in
Table 1, were not reported in the earlier studies, and many of
the melt bands were not detected earlier in solution, in
which the spectra were recorded with He–Ne lasers or Hg
excitation [8–10]. The bands previously observed in CCl4or in C6H12 solution were all present [10] in their spectra of
the solid, with the exception of a band at 217 cm21 in
C6H12. However, this band was observed neither in the
Raman nor the IR spectra of the solid or the melt (Table 1)
and may be an artifact. Therefore from these spectra, only
uncertain conclusions could be drawn regarding a second
conformer present in solution. Since the solubility of DPE in
these solvents is limited, spectra of the melt are much better
suited to detect low concentrations of a second conformer,
which is absent in the solid state.
Raman spectra of the liquid were recorded at 9
temperatures between 298 and 357 K. The intensity
variations observed with temperature of certain bands
relative to neighbouring bands, were interpreted as a
displacement of the conformational equilibrium. Particu-
larly, the attention was focused upon the Raman bands,
which vanished upon crystallization. These bands were
found to increase in intensities at higher temperatures and
belonged to the high energy conformer. They were paired
with other bands (often neighbours), which remained in the
crystal. However, it is always uncertain if the correspond-
ing bands of the liquid are characteristic of only one
conformer, or if they belong to overlapping bands of both
conformers.
The intensities of each band pair were fitted to the van’t
Hoff equation: ln{IgaucheðTÞ=IantiðTÞ} ¼ 2DconfH=RT þ
constant; where Igauch=Ianti is the ratio in peak heights or
integrated areas and it is assumed that DconfH is constant
with temperature. Calculations of DconfH were carried
out from the band pairs: 760/740 and 940/904 cm21.
Fig. 10. Raman spectra of DPE in the range 970–80 cm21 at 295 K; solid
line, solid state spectrum; dotted line, supercooled melt.
Fig. 9. Raman spectra of DPE in the range 1630–970 cm21 at 295 K; solid
line, solid state spectrum; dotted line, supercooled melt.
Fig. 8. Raman spectra of DPE in the range 1500–100 cm21 at 298 K in two
directions of polarization.
Fig. 7. Raman spectra of DPE in the range 3100–2800 cm21 at 298 K in
two directions of polarization.
A. Horn et al. / Journal of Molecular Structure 695–696 (2004) 77–94 83
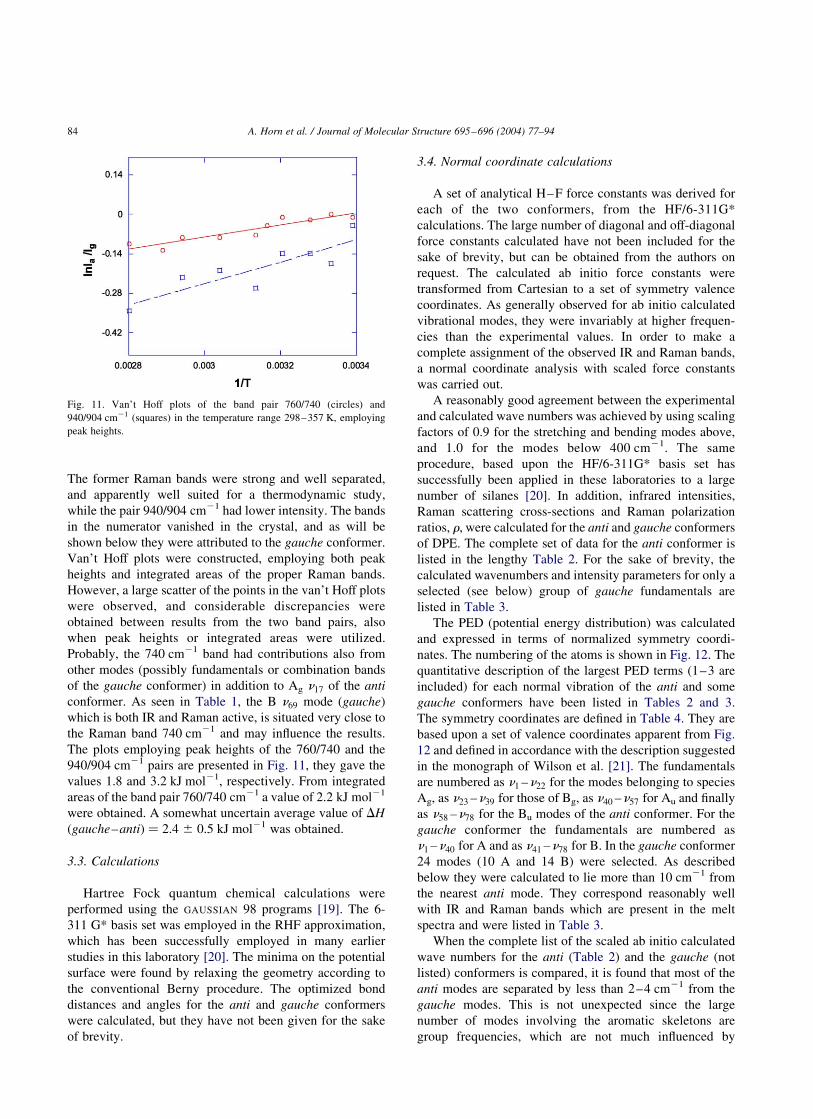
The former Raman bands were strong and well separated,
and apparently well suited for a thermodynamic study,
while the pair 940/904 cm21 had lower intensity. The bands
in the numerator vanished in the crystal, and as will be
shown below they were attributed to the gauche conformer.
Van’t Hoff plots were constructed, employing both peak
heights and integrated areas of the proper Raman bands.
However, a large scatter of the points in the van’t Hoff plots
were observed, and considerable discrepancies were
obtained between results from the two band pairs, also
when peak heights or integrated areas were utilized.
Probably, the 740 cm21 band had contributions also from
other modes (possibly fundamentals or combination bands
of the gauche conformer) in addition to Ag n17 of the anti
conformer. As seen in Table 1, the B n69 mode (gauche)
which is both IR and Raman active, is situated very close to
the Raman band 740 cm21 and may influence the results.
The plots employing peak heights of the 760/740 and the
940/904 cm21 pairs are presented in Fig. 11, they gave the
values 1.8 and 3.2 kJ mol21, respectively. From integrated
areas of the band pair 760/740 cm21 a value of 2.2 kJ mol21
were obtained. A somewhat uncertain average value of DH
(gauche–anti) ¼ 2.4 ^ 0.5 kJ mol21 was obtained.
3.3. Calculations
Hartree Fock quantum chemical calculations were
performed using the GAUSSIAN 98 programs [19]. The 6-
311 G* basis set was employed in the RHF approximation,
which has been successfully employed in many earlier
studies in this laboratory [20]. The minima on the potential
surface were found by relaxing the geometry according to
the conventional Berny procedure. The optimized bond
distances and angles for the anti and gauche conformers
were calculated, but they have not been given for the sake
of brevity.
3.4. Normal coordinate calculations
A set of analytical H–F force constants was derived for
each of the two conformers, from the HF/6-311G*
calculations. The large number of diagonal and off-diagonal
force constants calculated have not been included for the
sake of brevity, but can be obtained from the authors on
request. The calculated ab initio force constants were
transformed from Cartesian to a set of symmetry valence
coordinates. As generally observed for ab initio calculated
vibrational modes, they were invariably at higher frequen-
cies than the experimental values. In order to make a
complete assignment of the observed IR and Raman bands,
a normal coordinate analysis with scaled force constants
was carried out.
A reasonably good agreement between the experimental
and calculated wave numbers was achieved by using scaling
factors of 0.9 for the stretching and bending modes above,
and 1.0 for the modes below 400 cm21. The same
procedure, based upon the HF/6-311G* basis set has
successfully been applied in these laboratories to a large
number of silanes [20]. In addition, infrared intensities,
Raman scattering cross-sections and Raman polarization
ratios, r; were calculated for the anti and gauche conformers
of DPE. The complete set of data for the anti conformer is
listed in the lengthy Table 2. For the sake of brevity, the
calculated wavenumbers and intensity parameters for only a
selected (see below) group of gauche fundamentals are
listed in Table 3.
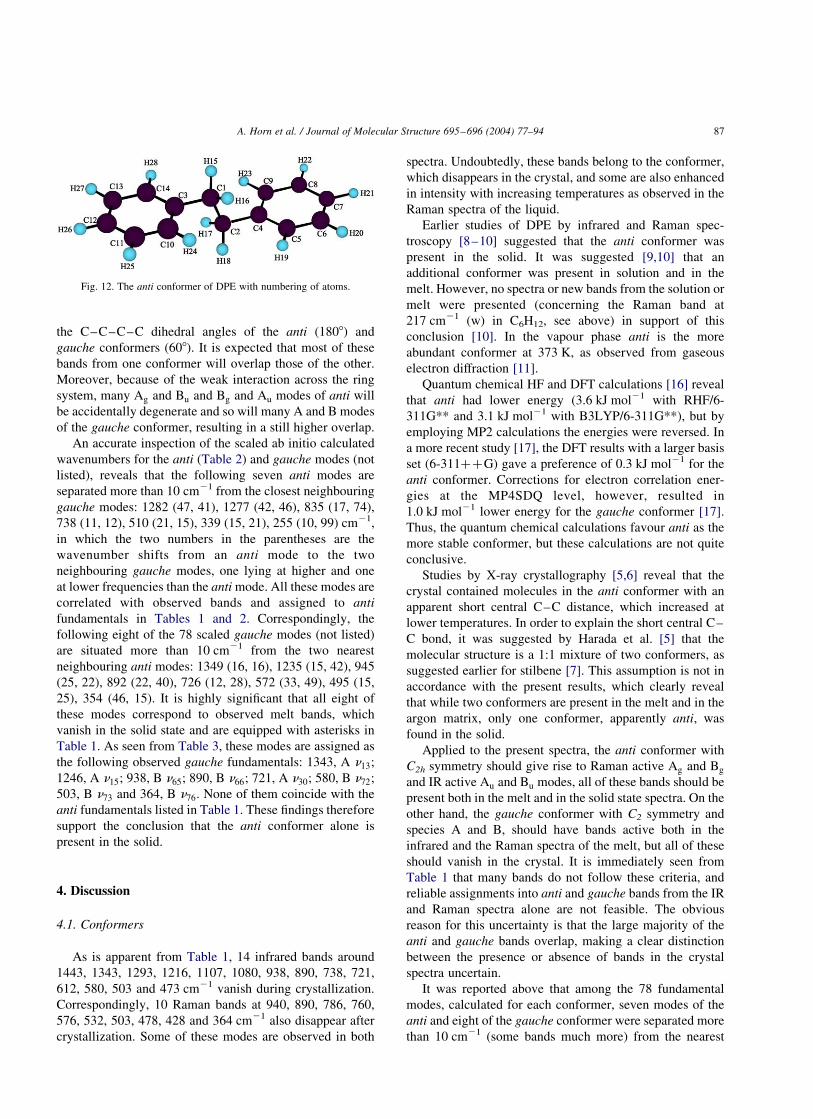
The PED (potential energy distribution) was calculated
and expressed in terms of normalized symmetry coordi-
nates. The numbering of the atoms is shown in Fig. 12. The
quantitative description of the largest PED terms (1–3 are
included) for each normal vibration of the anti and some
gauche conformers have been listed in Tables 2 and 3.
The symmetry coordinates are defined in Table 4. They are
based upon a set of valence coordinates apparent from Fig.
12 and defined in accordance with the description suggested
in the monograph of Wilson et al. [21]. The fundamentals
are numbered as n1 –n22 for the modes belonging to species
Ag, as n23 –n39 for those of Bg, as n40 –n57 for Au and finally
as n58 –n78 for the Bu modes of the anti conformer. For the
gauche conformer the fundamentals are numbered as
n1 –n40 for A and as n41 –n78 for B. In the gauche conformer
24 modes (10 A and 14 B) were selected. As described
below they were calculated to lie more than 10 cm21 from
the nearest anti mode. They correspond reasonably well
with IR and Raman bands which are present in the melt
spectra and were listed in Table 3.
When the complete list of the scaled ab initio calculated
wave numbers for the anti (Table 2) and the gauche (not
listed) conformers is compared, it is found that most of the
anti modes are separated by less than 2–4 cm21 from the
gauche modes. This is not unexpected since the large
number of modes involving the aromatic skeletons are
group frequencies, which are not much influenced by
Fig. 11. Van’t Hoff plots of the band pair 760/740 (circles) and
940/904 cm21 (squares) in the temperature range 298–357 K, employing
peak heights.
A. Horn et al. / Journal of Molecular Structure 695–696 (2004) 77–9484

Table 2
Observed and calculated fundamental modes of the anti conformer in 1,2-diphenylethane (DPE)
No. Observeda IIR IR r Calculatedb Scaledc IIR IR r PEDd Description
Ag n1 3072 m P 3363 3027 0 592 0.14 99S7 (y)C–H stretch
n2 3003 w P 3338 3004 0 215 0.57 86S8 þ 11s8 (y)C–H stretch
n3 2990 w P 3322 2990 0 18 0.25 91S9 (y)C–H stretch
n4 2864 m P 3193 2874 0 119 0.07 99S3 sCH2 sym. stretch
n5 1604 s P 1800 1620 0 74 0.57 64S5 þ 22S20 þ 10S17 CyC stretch
n6 1496 vw 1660 1494 0 1 0.74 60S19 þ 34S6 CyC–H bend
n7 1452 w,sh 1623 1461 0 25 0.62 93S14 sCH2 scissor
n8 1344 s P 1516 1365 0 35 0.36 77S15 þ 10S2 sCH2 deformation
n9 1193 w D? 1313 1182 0 21 0.11 35S2 þ 15S4 (y)C–C stretch
n10 1159 m D? 1293 1164 0 5 0.72 71S20 þ 25S5 CyC–H bend
n11 1015e s 1123 1011 0 20 0.08 49S6 þ 19S19 þ 15S4 þ 14S18 CyC stretch
n12 1003 vs P 1108 998 0 13 0.38 59S12 þ 13S1 þ 12S21 (y)C–H out-of-plane bend
n13 983e vw,sh 1101 991 0 12 0.30 34S11 þ 32S12 þ 19S1 (y)C–H out-of-plane bend
n14 972 w 1085 977 0 0 0.10 58S18 þ 41S4 Ring bend
n15 904 m P 1016 914 0 3 0.54 56S11 þ 14S12 þ 11S1 (y)C–H out-of-plane bend
n16 805 vw P 928 835 0 19 0.10 20S13 þ 18S4 þ 14S2 C6H5–C–C bend
n17 740 s P 821 738 0 12 0.06 47S10 þ 20S21 (y)C–H out-of-plane bend
n18 699 vw P 775 697 0 1 0.31 60S21 þ 14S10 Ring torsion
n19 612 w D? 672 605 0 4 0.70 43S17 þ 19S21 þ 13S13 Ring bend
n20 478 w 522 470 0 5 0.34 49S22 þ 26S16 Ring torsion
n21 234 s P 255 255 0 7 0.52 43S22 þ 11S13 þ 11S2 þ 10S11 Ring torsion
n22 131 m D? 131 131 0 8 0.71 38S16 þ 27S13 þ 12S22 yC–C out-of-plane bend
Bg n23 3063 s P 3349 3014 0 79 0.75 89S27 þ 11S28 (y)C–H stretch
n24 2980 w P? 3324 2992 0 176 0.75 88S28 þ 11S27 (y)C–H stretch
n25 2896 m P 3218 2896 0 75 0.75 99S23 sCH2 antisym. stretch
n26 1620 w 1772 1595 0 14 0.75 68S25 þ 10S35 CyC stretch
n27 1441 m D 1609 1448 0 1 0.75 29S24 þ 27S35 þ 27S37 Mixed
n28 1334 vw 1483 1335 0 0 0.75 65S35 þ 21S32 CyC–H bend
n29 1300 vw 1425 1282 0 8 0.75 62S32 þ 11S33 sCH2 wag
n30 1200 s P 1331 1198 0 1 0.75 34S37 þ 21S26 þ 19S35 CyC–H bend
n31 1110e vvw 1220 1098 0 10 0.75 27S24 þ 22S35 þ 18S26 þ 13S32 Mixed
n32 1073 vw 1169 1052 0 1 0.75 64S26 þ 27S37 CyC stretch
n33 972 w 1086 977 0 0 0.75 92S30 (y)C–H out-of-plane bend
n34 956 vw 1074 967 0 0 0.75 50S31 þ 28S24 sCH2 twist
n35 846 vs P 946 852 0 0 0.75 99S29 (y)C–H out-of-plane bend
n36 619 s D 680 612 0 10 0.75 87S33 Ring bend
n37 405 vw P? 454 408 0 0 0.75 82S39 þ 18S30 Ring torsion
n38 327 vw 339 339 0 0 0.75 78S34 C6H5–C–C bend
n39 75e vs 59 59 0 3 0.75 87S38 C6H5–CH2 torsion
Au n40 3027 vs 3349 3014 126 0 89S44 þ 10S45 (y)C–H stretch
n41 3003 w 3325 2993 12 0 89S45 þ 10S44 (y)C–H stretch
n42 2939 s 3244 2920 38 0 99S40 sCH2 antisym. stretch
n43 1585 m 1772 1595 5 0 68S43 þ 10S53 CyC stretch
n44 1453 vs 1609 1448 15 0 29S42 þ 27S53 þ 27S55 CyC stretch
n45 1332 w 1478 1330 0 0 73S54 þ 10S53 CyC–H bend
n46 1221f vw 1355 1220 0 0 35S55 þ 24S41 þ 20S49 þ 12S53 Mixed
n47 1146 m 1269 1142 1 0 36S49 þ 27S53 þ 16S43 þ 14S54 sCH2 twist
n48 1068 s 1170 1053 6 0 78S41 þ 17S55 CyC stretch
n49 1030 s 1167 1050 3 0 57S42 þ 16S49 þ 10S53 CyC stretch
n50 983 w 1085 977 0 0 92S47 (y)C–H out-of-plane bend
n51 853 vvw 946 852 0 0 100S46 (y)C–H out-of-plane bend
n52 753 vs 826 743 0 0 83S48 þ 11S49 sCH2 wag
n53 621 vw 681 613 0 0 86S51 Ring bend
n54 412 vvw 454 408 0 0 82S57 þ 18S47 Ring torsion
n55 402 w 400 400 0 0 74S52 þ 10S50 C6H5–C–C bend
n56 40 40 0 0 77S50 þ 13S52 (–)CH2–CH2 torsion
n57 23 23 0 0 89S56 C6H5–CH2 torsion
Bu n58 3027 vs 3363 3027 67 0 99S63 (y)C–H stretch
n59 3003 w 3338 3004 29 0 86S64 þ 11S63 (y)C–H stretch
(continued on next page)
A. Horn et al. / Journal of Molecular Structure 695–696 (2004) 77–94 85

Table 2 (continued)
No. Observeda IIR IR r Calculatedb Scaledc IIR IR r PEDd Description
n60 2951f m 3322 2990 28 0 91S65 (y)C–H stretch
n61 2858 s 3200 2880 72 0 100S59 sCH2 sym. stretch
n62 1602 s 1799 1619 22 0 64S61 þ 22S76 þ 10S73 CyC stretch
n63 1495 vs 1660 1494 35 0 59S57 þ 34S62 Ring torsion
n64 1453 vs 1641 1476 6 0 97S70 sCH2 scissor
n65 1271f vw 1419 1277 1 0 81S71 þ 10S58 sCH2 rock
n66 1181 m 1314 1182 0 0 35S58 þ 15S60 þ 14S74 þ 14S75 Mixed
n67 1146 m 1293 1163 0 0 72S76 þ 24S61 CyC–H bend
n68 1003 vw 1122 1010 6 0 49S62 þ 19S75 þ 16S74 þ 15S60 CyC stretch
n69 983 w 1105 995 0 0 67S68 þ 23S67 (y)C–H out-of-plane bend
n70 964 w 1085 977 0 0 57S74 þ 42S60 Ring bend
n71 906 m 1022 920 4 0 64S67 þ 15S68 (y)C–H out-of-plane bend
n72 765 s,sh 853 768 0 0 31S58 þ 22S73 þ 21S60 þ 11S74 Mixed
n73 753 vs 845 761 86 0 43S66 þ 30S78 þ 14S72 (y)C–H out-of-plane bend
n74 697 vs 775 698 82 0 60S78 þ 17S66 Ring torsion
n75 537 m 582 523 34 0 34S77 þ 25S72 þ 13S68 þ 11S78 Mixed
n76 519 vs 567 510 4 0 71S73 þ 14S58 Ring bend
n77 287 s 319 319 2 0 59S77 þ 19S69 þ 13S66 Ring torsion
n78 67 67 0 0 49S69 þ 36S72 C6H5–C–C bend
a Raman and IR frequencies from melt spectra, except when noted.b Calculated from RHF/6-311G**.c Scaled with 0.9 above 400 cm21 and 1.0 below 400 cm21.d Meaning of symmetry coordinates, see Table 4, only four terms or less are included in PED.e Raman spectra from solid.f Infrared spectra from argon matrix.
Table 3
Observed and calculated fundamentals of select modes of the gauche conformer in 1,2-diphenylethane (DPE)
No. Observeda IIR IR r Calculatedb Scaledc IIR IR r PEDd Description
A n13 1343 m s P 1499 1349 2 12 0.37 37S1522S5421S49 sCH2 deform
n14 1319 vw w P 1470 1323 0 8 0.28 44S5426S15 CyC–H bend
n15 1246 vw vw 1372 1235 1 3 0.61 41S4919S1516S55 sCH2 twist
n16 1198 w w P 1322 1190 1 7 0.34 18S5514S212S53 Mixed
n19 1107 w vw 1215 1093 2 8 0.45 29S4219S5318S41 CyC stretch
n29 760 s P 846 761 10 2 0.03 36S1027S2113S16 (y)C–H out-of-plane
n30 721 m 807 726 3 18 0.01 23S1719S1016S2 Ring torsion
n31 695 s 775 697 11 0 0.59 61S2114S10 Ring torsion
n33 537 m w P 590 531 4 2 0.34 22S2219S1715S16 Mixed
n34 468 w m D? 520 468 0 4 0.13 37S2220S1716S16 Ring torsion
B n52 1443 m m D 1609 1448 14 0 0.75 29S2428S3727S35 Mixed
n55 1216 w 1355 1220 0 1 0.75 35S3722S2621S32 CyC–H bend
n59 1080 m vw P 1176 1058 2 0 0.75 45S2419S2614S32 CyC stretch
n65 938 m m P 1050 945 7 1 0.75 39S6711S31 (y)C–H out-of-plane
n66 890 vw vw 991 892 0 0 0.75 40S6730S31 (y)C–H out-of-plane
n69 738 s 832 749 3 18 0.03 23S1719S1016S2 Ring bend
n70 678 m 774 696 73 0 0.75 59S7816S66 Ring torsion
n71 612 vw w D? 680 612 0 8 0.75 86S33 Ring bend
n72 580 s w 635 572 18 1 0.75 18S7817S6913S68 Mixed
n73 503 s w D 549 495 13 4 0.75 36S7321S7716S72 Ring bend
n74 426 w vw 454 408 0 0 0.75 82S5718S30 Ring torsion
n75 380 m 394 394 0 0 0.75 50S7717S69 Ring torsion
n76 364 w 354 354 1 0 0.75 68S3411S77 C6H5–C–C bend
n77 157 w 134 134 1 4 0.75 38S7725S69 Ring torsion
Gauche fundamentals not listed, presumably overlap with anti fundamentals in Tables 1 and 2.a IR data from melt spectra, except when noted.b Calculated from RHF/6-311G**.c Scaled with 0.9 above 400 cm21 and 1.0 below 400 cm21.d Meaning of symmetry coordinates, see Table 4, only four terms or less are included in PED.
A. Horn et al. / Journal of Molecular Structure 695–696 (2004) 77–9486
the C–C–C–C dihedral angles of the anti (1808) and
gauche conformers (608). It is expected that most of these
bands from one conformer will overlap those of the other.
Moreover, because of the weak interaction across the ring
system, many Ag and Bu and Bg and Au modes of anti will
be accidentally degenerate and so will many A and B modes
of the gauche conformer, resulting in a still higher overlap.
An accurate inspection of the scaled ab initio calculated
wavenumbers for the anti (Table 2) and gauche modes (not
listed), reveals that the following seven anti modes are
separated more than 10 cm21 from the closest neighbouring
gauche modes: 1282 (47, 41), 1277 (42, 46), 835 (17, 74),
738 (11, 12), 510 (21, 15), 339 (15, 21), 255 (10, 99) cm21,
in which the two numbers in the parentheses are the
wavenumber shifts from an anti mode to the two
neighbouring gauche modes, one lying at higher and one
at lower frequencies than the anti mode. All these modes are
correlated with observed bands and assigned to anti
fundamentals in Tables 1 and 2. Correspondingly, the
following eight of the 78 scaled gauche modes (not listed)
are situated more than 10 cm21 from the two nearest
neighbouring anti modes: 1349 (16, 16), 1235 (15, 42), 945
(25, 22), 892 (22, 40), 726 (12, 28), 572 (33, 49), 495 (15,
25), 354 (46, 15). It is highly significant that all eight of
these modes correspond to observed melt bands, which
vanish in the solid state and are equipped with asterisks in
Table 1. As seen from Table 3, these modes are assigned as
the following observed gauche fundamentals: 1343, A n13;
1246, A n15; 938, B n65; 890, B n66; 721, A n30; 580, B n72;
503, B n73 and 364, B n76: None of them coincide with the
anti fundamentals listed in Table 1. These findings therefore
support the conclusion that the anti conformer alone is
present in the solid.
4. Discussion
4.1. Conformers
As is apparent from Table 1, 14 infrared bands around
1443, 1343, 1293, 1216, 1107, 1080, 938, 890, 738, 721,
612, 580, 503 and 473 cm21 vanish during crystallization.
Correspondingly, 10 Raman bands at 940, 890, 786, 760,
576, 532, 503, 478, 428 and 364 cm21 also disappear after
crystallization. Some of these modes are observed in both
spectra. Undoubtedly, these bands belong to the conformer,
which disappears in the crystal, and some are also enhanced
in intensity with increasing temperatures as observed in the
Raman spectra of the liquid.
Earlier studies of DPE by infrared and Raman spec-
troscopy [8–10] suggested that the anti conformer was
present in the solid. It was suggested [9,10] that an
additional conformer was present in solution and in the
melt. However, no spectra or new bands from the solution or
melt were presented (concerning the Raman band at
217 cm21 (w) in C6H12, see above) in support of this
conclusion [10]. In the vapour phase anti is the more
abundant conformer at 373 K, as observed from gaseous
electron diffraction [11].
Quantum chemical HF and DFT calculations [16] reveal
that anti had lower energy (3.6 kJ mol21 with RHF/6-
311G** and 3.1 kJ mol21 with B3LYP/6-311G**), but by
employing MP2 calculations the energies were reversed. In
a more recent study [17], the DFT results with a larger basis
set (6-311þþG) gave a preference of 0.3 kJ mol21 for the
anti conformer. Corrections for electron correlation ener-
gies at the MP4SDQ level, however, resulted in
1.0 kJ mol21 lower energy for the gauche conformer [17].
Thus, the quantum chemical calculations favour anti as the
more stable conformer, but these calculations are not quite
conclusive.
Studies by X-ray crystallography [5,6] reveal that the
crystal contained molecules in the anti conformer with an
apparent short central C–C distance, which increased at
lower temperatures. In order to explain the short central C–
C bond, it was suggested by Harada et al. [5] that the
molecular structure is a 1:1 mixture of two conformers, as
suggested earlier for stilbene [7]. This assumption is not in
accordance with the present results, which clearly reveal
that while two conformers are present in the melt and in the
argon matrix, only one conformer, apparently anti, was
found in the solid.
Applied to the present spectra, the anti conformer with
C2h symmetry should give rise to Raman active Ag and Bg
and IR active Au and Bu modes, all of these bands should be
present both in the melt and in the solid state spectra. On the
other hand, the gauche conformer with C2 symmetry and
species A and B, should have bands active both in the
infrared and the Raman spectra of the melt, but all of these
should vanish in the crystal. It is immediately seen from
Table 1 that many bands do not follow these criteria, and
reliable assignments into anti and gauche bands from the IR
and Raman spectra alone are not feasible. The obvious
reason for this uncertainty is that the large majority of the
anti and gauche bands overlap, making a clear distinction
between the presence or absence of bands in the crystal
spectra uncertain.
It was reported above that among the 78 fundamental
modes, calculated for each conformer, seven modes of the
anti and eight of the gauche conformer were separated more
than 10 cm21 (some bands much more) from the nearest
Fig. 12. The anti conformer of DPE with numbering of atoms.
A. Horn et al. / Journal of Molecular Structure 695–696 (2004) 77–94 87
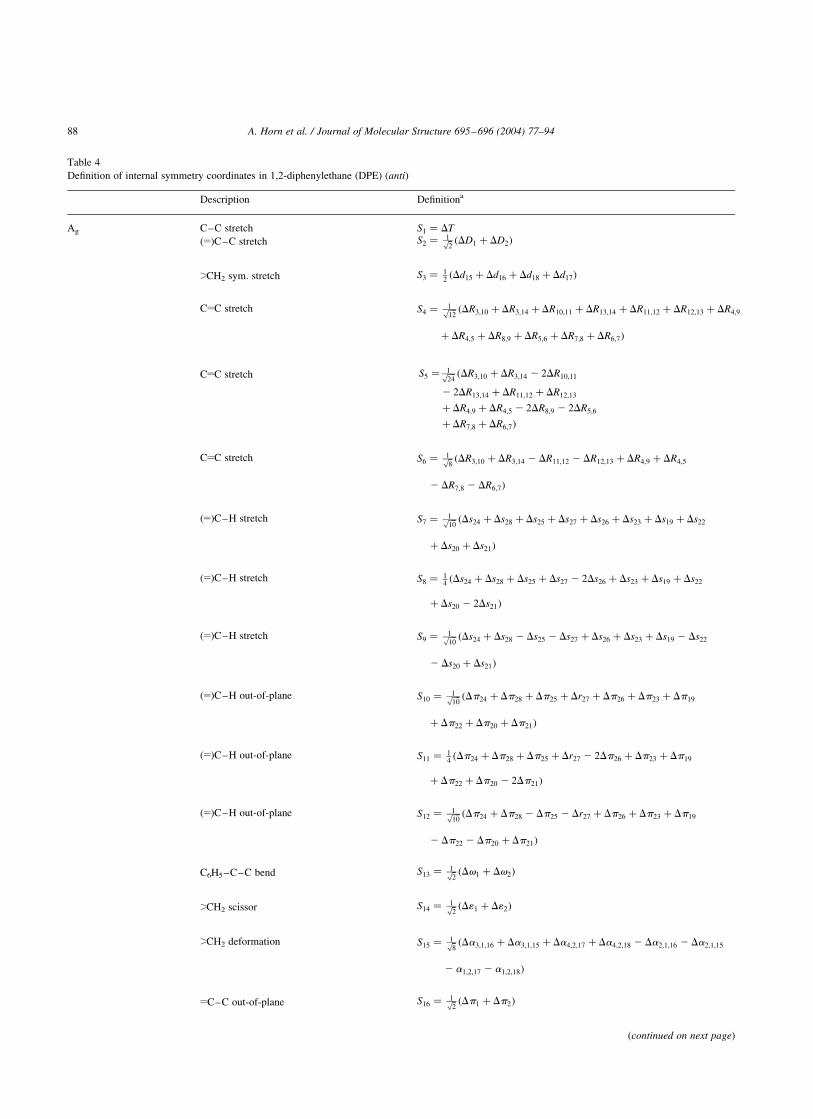
Table 4
Definition of internal symmetry coordinates in 1,2-diphenylethane (DPE) (anti)
Description Definitiona
Ag C–C stretch S1 ¼ DT
(y)C–C stretch S2 ¼ 1ffiffi
2p ðDD1 þ DD2Þ
sCH2 sym. stretch S3 ¼ 12ðDd15 þ Dd16 þ Dd18 þ Dd17Þ
CyC stretch S4 ¼ 1ffiffiffi
12p ðDR3;10 þ DR3;14 þ DR10;11 þ DR13;14 þ DR11;12 þ DR12;13 þ DR4;9
þ DR4;5 þ DR8;9 þ DR5;6 þ DR7;8 þ DR6;7Þ
CyC stretch S5 ¼ 1ffiffiffi
24p ðDR3;10 þ DR3;14 2 2DR10;11
2 2DR13;14 þ DR11;12 þ DR12;13
þ DR4;9 þ DR4;5 2 2DR8;9 2 2DR5;6
þ DR7;8 þ DR6;7Þ
CyC stretch S6 ¼ 1ffiffi
8p ðDR3;10 þ DR3;14 2 DR11;12 2 DR12;13 þ DR4;9 þ DR4;5
2 DR7;8 2 DR6;7Þ
(y)C–H stretch S7 ¼ 1ffiffiffi
10p ðDs24 þ Ds28 þ Ds25 þ Ds27 þ Ds26 þ Ds23 þ Ds19 þ Ds22
þ Ds20 þ Ds21Þ
(y)C–H stretch S8 ¼ 14ðDs24 þ Ds28 þ Ds25 þ Ds27 2 2Ds26 þ Ds23 þ Ds19 þ Ds22
þ Ds20 2 2Ds21Þ
(y)C–H stretch S9 ¼ 1ffiffiffi
10p ðDs24 þ Ds28 2 Ds25 2 Ds27 þ Ds26 þ Ds23 þ Ds19 2 Ds22
2 Ds20 þ Ds21Þ
(y)C–H out-of-plane S10 ¼ 1ffiffiffi
10p ðDp24 þ Dp28 þ Dp25 þ Dr27 þ Dp26 þ Dp23 þ Dp19
þ Dp22 þ Dp20 þ Dp21Þ
(y)C–H out-of-plane S11 ¼ 14ðDp24 þ Dp28 þ Dp25 þ Dr27 2 2Dp26 þ Dp23 þ Dp19
þ Dp22 þ Dp20 2 2Dp21Þ
(y)C–H out-of-plane S12 ¼ 1ffiffiffi
10p ðDp24 þ Dp28 2 Dp25 2 Dr27 þ Dp26 þ Dp23 þ Dp19
2 Dp22 2 Dp20 þ Dp21Þ
C6H5–C–C bend S13 ¼ 1ffiffi
2p ðDv1 þ Dv2Þ
sCH2 scissor S14 ¼ 1ffiffi
2p ðD11 þ D12Þ
sCH2 deformation S15 ¼ 1ffiffi
8p ðDa3;1;16 þ Da3;1;15 þ Da4;2;17 þ Da4;2;18 2 Da2;1;16 2 Da2;1;15
2 a1;2;17 2 a1;2;18Þ
yC–C out-of-plane S16 ¼ 1ffiffi
2p ðDp1 þ Dp2Þ
(continued on next page)
A. Horn et al. / Journal of Molecular Structure 695–696 (2004) 77–9488
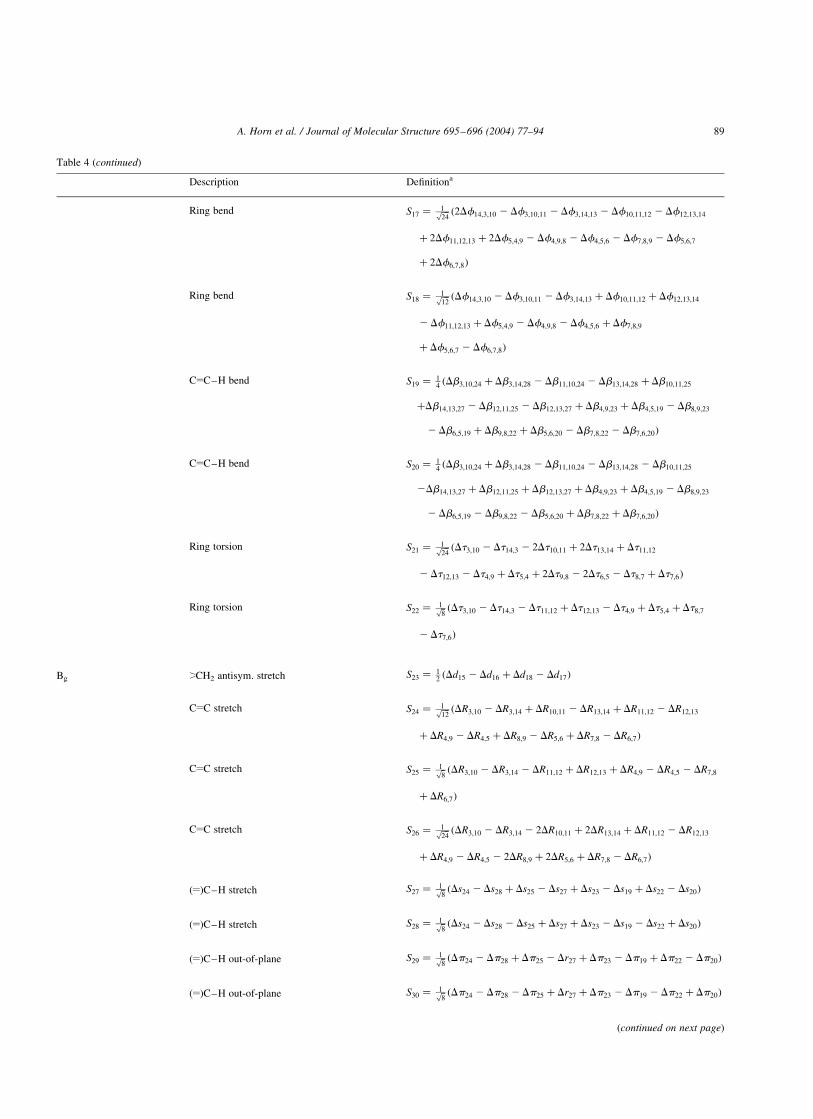
Table 4 (continued)
Description Definitiona
Ring bend S17 ¼ 1ffiffiffi
24p ð2Df14;3;10 2 Df3;10;11 2 Df3;14;13 2 Df10;11;12 2 Df12;13;14
þ 2Df11;12;13 þ 2Df5;4;9 2 Df4;9;8 2 Df4;5;6 2 Df7;8;9 2 Df5;6;7
þ 2Df6;7;8Þ
Ring bend S18 ¼ 1ffiffiffi
12p ðDf14;3;10 2 Df3;10;11 2 Df3;14;13 þ Df10;11;12 þ Df12;13;14
2 Df11;12;13 þ Df5;4;9 2 Df4;9;8 2 Df4;5;6 þ Df7;8;9
þ Df5;6;7 2 Df6;7;8Þ
CyC–H bend S19 ¼ 14ðDb3;10;24 þ Db3;14;28 2 Db11;10;24 2 Db13;14;28 þ Db10;11;25
þDb14;13;27 2 Db12;11;25 2 Db12;13;27 þ Db4;9;23 þ Db4;5;19 2 Db8;9;23
2 Db6;5;19 þ Db9;8;22 þ Db5;6;20 2 Db7;8;22 2 Db7;6;20Þ
CyC–H bend S20 ¼ 14ðDb3;10;24 þ Db3;14;28 2 Db11;10;24 2 Db13;14;28 2 Db10;11;25
2Db14;13;27 þ Db12;11;25 þ Db12;13;27 þ Db4;9;23 þ Db4;5;19 2 Db8;9;23
2 Db6;5;19 2 Db9;8;22 2 Db5;6;20 þ Db7;8;22 þ Db7;6;20Þ
Ring torsion S21 ¼ 1ffiffiffi
24p ðDt3;10 2 Dt14;3 2 2Dt10;11 þ 2Dt13;14 þ Dt11;12
2 Dt12;13 2 Dt4;9 þ Dt5;4 þ 2Dt9;8 2 2Dt6;5 2 Dt8;7 þ Dt7;6Þ
Ring torsion S22 ¼ 1ffiffi
8p ðDt3;10 2 Dt14;3 2 Dt11;12 þ Dt12;13 2 Dt4;9 þ Dt5;4 þ Dt8;7
2 Dt7;6Þ
Bg sCH2 antisym. stretch S23 ¼ 12ðDd15 2 Dd16 þ Dd18 2 Dd17Þ
CyC stretch S24 ¼ 1ffiffiffi
12p ðDR3;10 2 DR3;14 þ DR10;11 2 DR13;14 þ DR11;12 2 DR12;13
þ DR4;9 2 DR4;5 þ DR8;9 2 DR5;6 þ DR7;8 2 DR6;7Þ
CyC stretch S25 ¼ 1ffiffi
8p ðDR3;10 2 DR3;14 2 DR11;12 þ DR12;13 þ DR4;9 2 DR4;5 2 DR7;8
þ DR6;7Þ
CyC stretch S26 ¼ 1ffiffiffi
24p ðDR3;10 2 DR3;14 2 2DR10;11 þ 2DR13;14 þ DR11;12 2 DR12;13
þ DR4;9 2 DR4;5 2 2DR8;9 þ 2DR5;6 þ DR7;8 2 DR6;7Þ
(y)C–H stretch S27 ¼ 1ffiffi
8p ðDs24 2 Ds28 þ Ds25 2 Ds27 þ Ds23 2 Ds19 þ Ds22 2 Ds20Þ
(y)C–H stretch S28 ¼ 1ffiffi
8p ðDs24 2 Ds28 2 Ds25 þ Ds27 þ Ds23 2 Ds19 2 Ds22 þ Ds20Þ
(y)C–H out-of-plane S29 ¼ 1ffiffi
8p ðDp24 2 Dp28 þ Dp25 2 Dr27 þ Dp23 2 Dp19 þ Dp22 2 Dp20Þ
(y)C–H out-of-plane S30 ¼ 1ffiffi
8p ðDp24 2 Dp28 2 Dp25 þ Dr27 þ Dp23 2 Dp19 2 Dp22 þ Dp20Þ
(continued on next page)
A. Horn et al. / Journal of Molecular Structure 695–696 (2004) 77–94 89
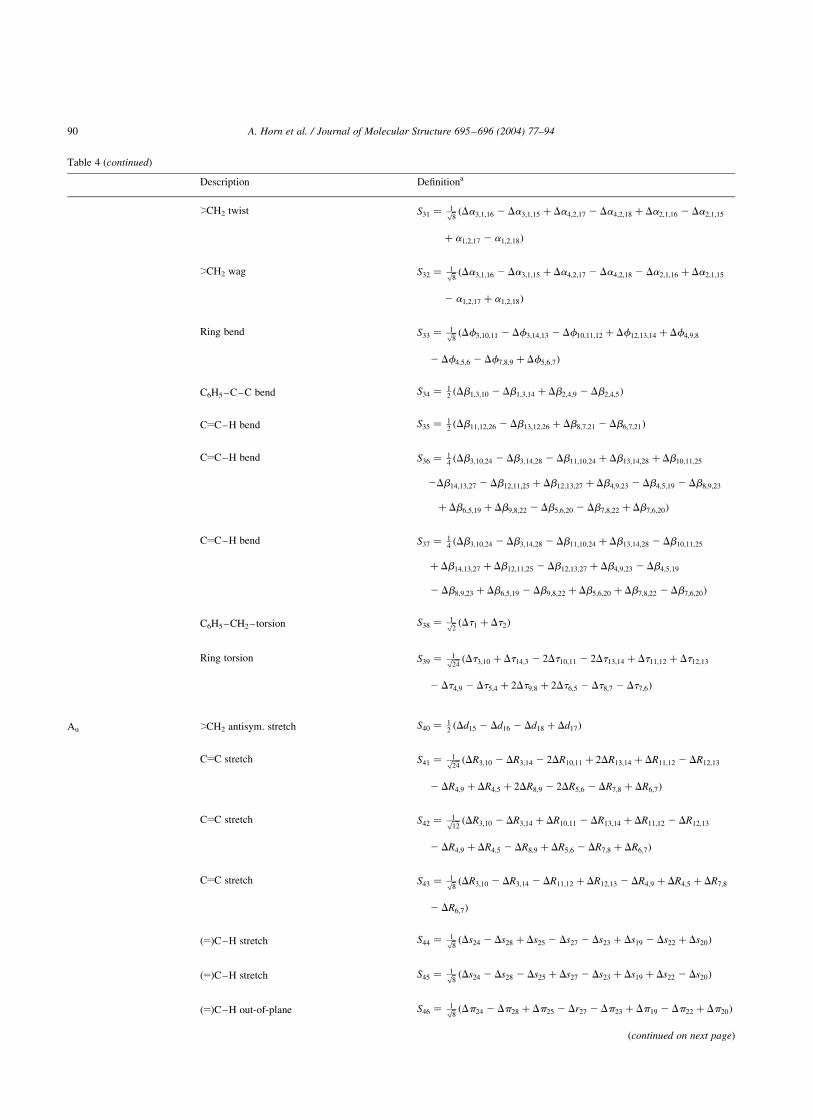
Table 4 (continued)
Description Definitiona
sCH2 twist S31 ¼ 1ffiffi
8p ðDa3;1;16 2 Da3;1;15 þ Da4;2;17 2 Da4;2;18 þ Da2;1;16 2 Da2;1;15
þ a1;2;17 2 a1;2;18Þ
sCH2 wag S32 ¼ 1ffiffi
8p ðDa3;1;16 2 Da3;1;15 þ Da4;2;17 2 Da4;2;18 2 Da2;1;16 þ Da2;1;15
2 a1;2;17 þ a1;2;18Þ
Ring bend S33 ¼ 1ffiffi
8p ðDf3;10;11 2 Df3;14;13 2 Df10;11;12 þ Df12;13;14 þ Df4;9;8
2 Df4;5;6 2 Df7;8;9 þ Df5;6;7Þ
C6H5–C–C bend S34 ¼ 12ðDb1;3;10 2 Db1;3;14 þ Db2;4;9 2 Db2;4;5Þ
CyC–H bend S35 ¼ 12ðDb11;12;26 2 Db13;12;26 þ Db8;7;21 2 Db6;7;21Þ
CyC–H bend S36 ¼ 14ðDb3;10;24 2 Db3;14;28 2 Db11;10;24 þ Db13;14;28 þ Db10;11;25
2Db14;13;27 2 Db12;11;25 þ Db12;13;27 þ Db4;9;23 2 Db4;5;19 2 Db8;9;23
þ Db6;5;19 þ Db9;8;22 2 Db5;6;20 2 Db7;8;22 þ Db7;6;20Þ
CyC–H bend S37 ¼ 14ðDb3;10;24 2 Db3;14;28 2 Db11;10;24 þ Db13;14;28 2 Db10;11;25
þ Db14;13;27 þ Db12;11;25 2 Db12;13;27 þ Db4;9;23 2 Db4;5;19
2 Db8;9;23 þ Db6;5;19 2 Db9;8;22 þ Db5;6;20 þ Db7;8;22 2 Db7;6;20Þ
C6H5–CH2–torsion S38 ¼ 1ffiffi
2p ðDt1 þ Dt2Þ
Ring torsion S39 ¼ 1ffiffiffi
24p ðDt3;10 þ Dt14;3 2 2Dt10;11 2 2Dt13;14 þ Dt11;12 þ Dt12;13
2 Dt4;9 2 Dt5;4 þ 2Dt9;8 þ 2Dt6;5 2 Dt8;7 2 Dt7;6Þ
Au sCH2 antisym. stretch S40 ¼ 12ðDd15 2 Dd16 2 Dd18 þ Dd17Þ
CyC stretch S41 ¼ 1ffiffiffi
24p ðDR3;10 2 DR3;14 2 2DR10;11 þ 2DR13;14 þ DR11;12 2 DR12;13
2 DR4;9 þ DR4;5 þ 2DR8;9 2 2DR5;6 2 DR7;8 þ DR6;7Þ
CyC stretch S42 ¼ 1ffiffiffi
12p ðDR3;10 2 DR3;14 þ DR10;11 2 DR13;14 þ DR11;12 2 DR12;13
2 DR4;9 þ DR4;5 2 DR8;9 þ DR5;6 2 DR7;8 þ DR6;7Þ
CyC stretch S43 ¼ 1ffiffi
8p ðDR3;10 2 DR3;14 2 DR11;12 þ DR12;13 2 DR4;9 þ DR4;5 þ DR7;8
2 DR6;7Þ
(y)C–H stretch S44 ¼ 1ffiffi
8p ðDs24 2 Ds28 þ Ds25 2 Ds27 2 Ds23 þ Ds19 2 Ds22 þ Ds20Þ
(y)C–H stretch S45 ¼ 1ffiffi
8p ðDs24 2 Ds28 2 Ds25 þ Ds27 2 Ds23 þ Ds19 þ Ds22 2 Ds20Þ
(y)C–H out-of-plane S46 ¼ 1ffiffi
8p ðDp24 2 Dp28 þ Dp25 2 Dr27 2 Dp23 þ Dp19 2 Dp22 þ Dp20Þ
(continued on next page)
A. Horn et al. / Journal of Molecular Structure 695–696 (2004) 77–9490
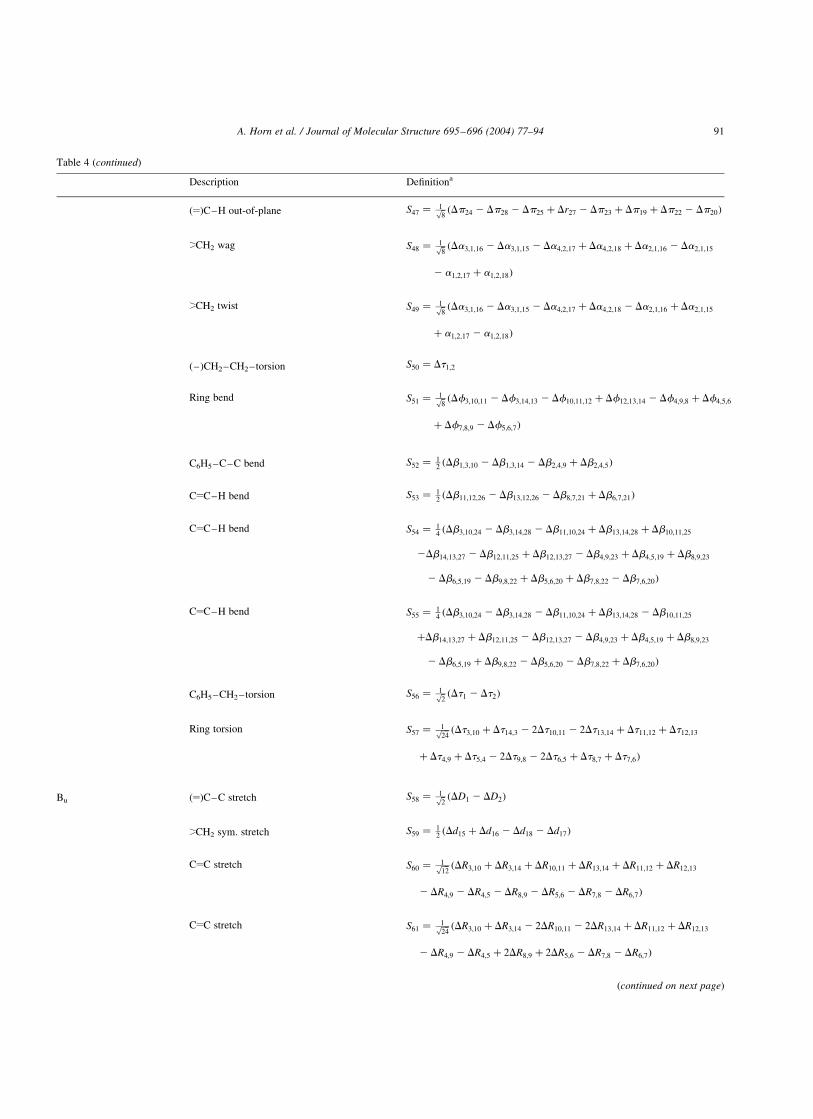
Table 4 (continued)
Description Definitiona
(y)C–H out-of-plane S47 ¼ 1ffiffi
8p ðDp24 2 Dp28 2 Dp25 þ Dr27 2 Dp23 þ Dp19 þ Dp22 2 Dp20Þ
sCH2 wag S48 ¼ 1ffiffi
8p ðDa3;1;16 2 Da3;1;15 2 Da4;2;17 þ Da4;2;18 þ Da2;1;16 2 Da2;1;15
2 a1;2;17 þ a1;2;18Þ
sCH2 twist S49 ¼ 1ffiffi
8p ðDa3;1;16 2 Da3;1;15 2 Da4;2;17 þ Da4;2;18 2 Da2;1;16 þ Da2;1;15
þ a1;2;17 2 a1;2;18Þ
(–)CH2–CH2–torsion S50 ¼ Dt1;2
Ring bend S51 ¼ 1ffiffi
8p ðDf3;10;11 2 Df3;14;13 2 Df10;11;12 þ Df12;13;14 2 Df4;9;8 þ Df4;5;6
þ Df7;8;9 2 Df5;6;7Þ
C6H5–C–C bend S52 ¼ 12ðDb1;3;10 2 Db1;3;14 2 Db2;4;9 þ Db2;4;5Þ
CyC–H bend S53 ¼ 12ðDb11;12;26 2 Db13;12;26 2 Db8;7;21 þ Db6;7;21Þ
CyC–H bend S54 ¼ 14ðDb3;10;24 2 Db3;14;28 2 Db11;10;24 þ Db13;14;28 þ Db10;11;25
2Db14;13;27 2 Db12;11;25 þ Db12;13;27 2 Db4;9;23 þ Db4;5;19 þ Db8;9;23
2 Db6;5;19 2 Db9;8;22 þ Db5;6;20 þ Db7;8;22 2 Db7;6;20Þ
CyC–H bend S55 ¼ 14ðDb3;10;24 2 Db3;14;28 2 Db11;10;24 þ Db13;14;28 2 Db10;11;25
þDb14;13;27 þ Db12;11;25 2 Db12;13;27 2 Db4;9;23 þ Db4;5;19 þ Db8;9;23
2 Db6;5;19 þ Db9;8;22 2 Db5;6;20 2 Db7;8;22 þ Db7;6;20Þ
C6H5–CH2–torsion S56 ¼ 1ffiffi
2p ðDt1 2 Dt2Þ
Ring torsion S57 ¼ 1ffiffiffi
24p ðDt3;10 þ Dt14;3 2 2Dt10;11 2 2Dt13;14 þ Dt11;12 þ Dt12;13
þ Dt4;9 þ Dt5;4 2 2Dt9;8 2 2Dt6;5 þ Dt8;7 þ Dt7;6Þ
Bu (y)C–C stretch S58 ¼ 1ffiffi
2p ðDD1 2 DD2Þ
sCH2 sym. stretch S59 ¼ 12ðDd15 þ Dd16 2 Dd18 2 Dd17Þ
CyC stretch S60 ¼ 1ffiffiffi
12p ðDR3;10 þ DR3;14 þ DR10;11 þ DR13;14 þ DR11;12 þ DR12;13
2 DR4;9 2 DR4;5 2 DR8;9 2 DR5;6 2 DR7;8 2 DR6;7Þ
CyC stretch S61 ¼ 1ffiffiffi
24p ðDR3;10 þ DR3;14 2 2DR10;11 2 2DR13;14 þ DR11;12 þ DR12;13
2 DR4;9 2 DR4;5 þ 2DR8;9 þ 2DR5;6 2 DR7;8 2 DR6;7Þ
(continued on next page)
A. Horn et al. / Journal of Molecular Structure 695–696 (2004) 77–94 91

Table 4 (continued)
Description Definitiona
CyC stretch S62 ¼ 1ffiffi
8p ðDR3;10 þ DR3;14 2 DR11;12 2 DR12;13 2 DR4;9 2 DR4;5 þ DR7;8
þ DR6;7Þ
(y)C–H stretch S63 ¼ 1ffiffiffi
10p ðDs24 þ Ds28 þ Ds25 þ Ds27 þ Ds26 2 Ds23 2 Ds19 2 Ds22 2 Ds20
2 Ds21Þ
(y)C–H stretch S64 ¼ 14ðDs24 þ Ds28 þ Ds25 þ Ds27 2 2Ds26 2 Ds23 2 Ds19 2 Ds22 2 Ds20
þ 2Ds21Þ
(y)C–H stretch S65 ¼ 1ffiffiffi
10p ðDs24 þ Ds28 2 Ds25 2 Ds27 þ Ds26 2 Ds23 2 Ds19 þ Ds22 þ Ds20
2 Ds21Þ
(y)C–H out-of-plane S66 ¼ 1ffiffiffi
10p ðDp24 þ Dp28 þ Dp25 þ Dr27 þ Dp26 2 Dp23 2 Dp19 2 Dp22
2 Dp20 2 Dp21Þ
(y)C–H out-of-plane S67 ¼ 14ðDp24 þ Dp28 þ Dp25 þ Dr27 2 2Dp26 2 Dp23 2 Dp19 2 Dp22
2 Dp20 þ 2Dp21Þ
(y)C–H out-of-plane S68 ¼ 1ffiffiffi
10p ðDp24 þ Dp28 2 Dp25 2 Dr27 þ Dp26 2 Dp23 2 Dp19 þ Dp22
þ Dp20 2 Dp21Þ
C6H5–C–C bend S69 ¼ 1ffiffi
2p ðDv1 2 Dv2Þ
sCH2 scissor S70 ¼ 1ffiffi
2p ðD11 2 D12Þ
sCH2 rock S71 ¼ 1ffiffi
8p ðDa3;1;16 þ Da3;1;15 2 Da4;2;17 2 Da4;2;18 2 Da2;1;16 2 Da2;1;15
þ a1;2;17 þ a1;2;18Þ
C6H5–CH2–torsion S72 ¼ 1ffiffi
2p ðDp1 2 Dp2Þ
Ring bend S73 ¼ 1ffiffiffi
24p ð2Df14;3;10 2 Df3;10;11 2 Df3;14;13 2 Df10;11;12 2 Df12;13;14
þ 2Df11;12;13 2 2Df5;4;9 þ Df4;9;8 þ Df4;5;6 þ Df7;8;9 þ Df5;6;7
2 2Df6;7;8Þ
Ring bend S74 ¼ 1ffiffiffi
12p ðDf14;3;10 2 Df3;10;11 2 Df3;14;13 þ Df10;11;12 þ Df12;13;14
2 Df11;12;13 2 Df5;4;9 þ Df4;9;8 þ Df4;5;6 2 Df7;8;9
2 Df5;6;7 þ Df6;7;8Þ
(continued on next page)
A. Horn et al. / Journal of Molecular Structure 695–696 (2004) 77–9492

mode of the opposite conformer. It is significant that all the
eight gauche modes which were predicted from the
calculations to be far from the corresponding anti modes
were observed in the IR and/or Raman spectra of the melt
and vanished in those of the solid. They are marked with
asterisks in Table 1 and were assigned to gauche
fundamentals in Table 3. These features strongly support
the anti conformer being present in the solid while the
gauche conformer exists in the melt in a mixture with anti.
4.2. Spectral assignments
The observed enthalpy difference of the gauche and anti
conformers of 2.4 kJ mol21 leads to an estimated ratio of
anti/gauche ¼ 1.27 at the melting point of 325 K since
gauche has a statistical weight 2. This ratio agrees
reasonably well with the IR and Raman intensities of the
melt spectra. In many cases the IR and Raman bands of the
melt, remaining in the crystal spectra and attributed to anti,
had approximately the same intensity as the bands vanishing
in the crystal spectra and assigned to the gauche conformer.
Examples are the two Raman pairs 760/740 and
940/904 cm21. However, in other cases the bands belonging
to gauche were weaker than those ascribed to anti, and it has
been suggested that [9] the ratio in solutions is 1:2 at room
temperature.
The wavenumbers of the observed infrared and Raman
bands of DPE (Table 1) are tentatively assigned to a nearly
complete set of 78 fundamentals of the anti conformer. They
are numbered in the conventional order of the symmetry
species, Ag;Bg;Au and Bu and compared with the scaled ab
initio calculated wave numbers in Table 2. Obviously, no
detailed discussion of the assignments in these lengthy
tables can be presented, but a few guidelines mentioned: (1)
the assigned fundamentals relied heavily upon the calcu-
lated wave numbers (scaled) and the shifts between the
observed and calculated values were moderate. (2) The Ag
and Bg modes were preferably attributed to separate Raman
bands and the Au and Bu modes to separate IR bands. (3)
The calculated IR intensities, Raman cross-sections and
polarization ratios played a minor role. (4) Most anti and
gauche bands overlapped, particularly in the regions 1600–
1400 and 1200–950 cm21 as indicated by the calculations.
A number of observed bands were attributed to
overlapping anti bands. Particularly, the Ag –Bu and the
Bg –Au modes frequently coincided, since they represent in-
phase and out-of-phase vibrations relative to the symmetry
center. As seen in Table 1, the weak interaction across the
DPE molecule is demonstrated by the small (or non-
existent) wavenumber difference between many of these
modes, leading to accidental degeneracy.
As is apparent from Table 1, 24 fundamentals belonging
to the gauche conformer were tentatively assigned. They are
also listed in Table 3, spanning the symmetry species A and
B, which should all be active both in the IR and Raman
spectra. These fundamentals should in principle be present
both in the IR and in Raman spectra and they should vanish
in the spectra of the solid. The gauche modes, calculated
more than 10 cm21 from neighbouring anti modes (see
above), are obvious candidates, and IR and Raman bands
Table 4 (continued)
Description Definitiona
CyC–H bend S75 ¼ 14ðDb3;10;24 þ Db3;14;28 2 Db11;10;24 2 Db13;14;28 þ Db10;11;25 þ
Db14;13;27 2 Db12;11;25 2 Db12;13;27 2 Db4;9;23 2 Db4;5;19 þ Db8;9;23 þ
Db6;5;19 2 Db9;8;22 2 Db5;6;20 þ Db7;8;22 þ Db7;6;20Þ
CyC–H bend S76 ¼ 14ðDb3;10;24 þ Db3;14;28 2 Db11;10;24 2 Db13;14;28 2 Db10;11;25
2Db14;13;27 þ Db12;11;25 þ Db12;13;27 2 Db4;9;23 2 Db4;5;19 þ Db8;9;23
þ Db6;5;19 þ Db9;8;22 þ Db5;6;20 2 Db7;8;22 2 Db7;6;20Þ
Ring torsion S77 ¼ 1ffiffi
8p ðDt3;10 2 Dt14;3 2 Dt11;12 þ Dt12;13 þ Dt4;9 2 Dt5;4 2 Dt8;7
þ Dt7;6Þ
Ring torsion S78 ¼ 1ffiffiffi
24p ðDt3;10 2 Dt14;3 2 2Dt10;11 þ 2Dt13;14 þ Dt11;12 2 Dt12;13 þ Dt4;9
2 Dt5;4 2 2Dt9;8 þ 2Dt6;5 þ Dt8;7 2 Dt7;6Þ
a See Fig. 12 for numbering of atoms. The internal coordinates for stretching (DT ; DD; DR; Dd; Ds), bending (Da; Db; D1; Dv), torsion (Dt), and out-of-
plane deformations (Dp) are defined as in Ref. [21].
A. Horn et al. / Journal of Molecular Structure 695–696 (2004) 77–94 93

which did not meet the criteria to originate from the anti
conformer were frequently chosen as gauche. However, in
some cases gauche fundamentals were attributed to bands,
which did not completely vanish in the crystal.
Various weak infrared and a few Raman bands have been
left unassigned in Table 1. Many of them are undoubtedly
combination bands or overtones from the large number of
fundamentals in DPE. It is interesting to note that in all the
four Raman bands of the pairs 760/740 and 940/904 cm21,
employed in the van’t Hoff plots (Fig. 11) (two anti and two
gauche), the largest contribution to PED comes from (y)C–
H out-of-plane bend.
In an infrared spectroscopic study combined with
molecular mechanics calculations of the closely related
molecule 1,2-di( p-bromophenyl)ethane, Stolov et al. [22]
report results more complicated than those assumed for
DPE. Thus, they found a mixture of anti and three uncertain
additional conformers in solutions. These conformers were
supposedly due to restricted rotation around the CPh –Caliph
in addition to the Caliph –Caliph; which gives rise to the anti
and gauche conformers. In the solid state they found two
crystalline modifications, one being anti. One of the crystals
was metastable (possibly containing a gauche conformer)
and converted to the stable crystal (anti) in 15–30 min at
300 K [22].
Acknowledgements
V.A. was supported by a fellowship from the Research
Council of Norway to Northwest Russia and the Baltic
Countries.
References
[1] S.I. Mizushima, Internal Rotation and Molecular Structure, Academic
Press, New York, 1954.
[2] G.A. Geffrey, Proc. R. Soc. Lond. A 188 (1945) 222.
[3] D.W.J. Cruickshank, Acta Cryst. 2 (1949) 65.
[4] W. Winter, T. Butters, A. Rieker, Y. Butsugan, Z. Naturforsch. 37b
(1982) 855.
[5] J. Harada, K. Ogawa, S. Tomoda, J. Am. Chem. Soc. 117 (1995) 4476.
[6] B. Kahr, C.A. Mitchell, J.M. Chance, R. VernonClark, P. Ganzel,
K.K. Baldridge, J.S. Siegel, J. Am. Chem. Soc. 117 (1995) 4479.
[7] K. Ogawa, T. Sano, S. Yoshimura, Y. Takeuchi, K. Toriumi, J. Am.
Chem. Soc. 114 (1992) 1041.
[8] M.S. Marthur, N.A. Weir, J. Mol. Struct. 14 (1972) 303.
[9] K.K. Chiu, H.H. Huang, L.H. Chia, J. Chem. Soc. Perkin II (1971)
286.
[10] A.M. North, R.A. Pethrick, A.D. Wilson, Spectrochim. Acta 30, Part
A (1974) 1317.
[11] Q. Shen, J. Mol. Struct. 471 (1998) 57.
[12] P.M. Ivanov, I.G. Pojarlieff, N.N. Tyutyulkov, Tetrahedron Lett. 10
(1976) 775.
[13] I.G. Pojarlieff, P.M. Ivanov, N.D. Berova, J. Mol. Struct. 91 (1983)
283.
[14] W.D. Hounshell, D.A. Dougherty, J.P. Hummel, K. Mislow, J. Am.
Chem. Soc. 99 (1977) 1916.
[15] D.A. Dougherty, K. Mislow, J. Am. Chem. Soc. 101 (1979) 1401.
[16] P.M. Ivanov, J. Mol. Struct. 415 (1997) 179.
[17] N. Kurita, P.M. Ivanov, J. Mol. Struct. 554 (2000) 183.
[18] A.J. Barnes, J. Mol. Struct. 113 (1984) 161.
[19] M.J. Frisch, G.W. Trucks, H.B. Schlegel, G.E. Scuseria, M.A. Robb,
J.R. Cheeseman, V.G. Zakrzewski, J.A. Montgomery Jr., R.E.
Stratmann, J.C. Burant, S. Dapprich, J.M. Millam, A.D. Daniels,
K.N. Kudin, M.C. Strain, O. Frakas, J. Tomasi, V. Barone, M. Cossi,
R. Cammi, B. Mennucci, C. Pomelli, C. Adamo, S. Clifford, J.
Ochterski, G.A. Petersson, P.Y. Ayala, Q. Cui, K. Morokuma, D.K.
Malick, A.D. Rabuck, K. Raghavachari, J.B. Foresman, J. Cioslowski,
J.V. Ortiz, A.G. Baboul, B.B. Stefanov, G. Liu, A. Liashenko, P.
Piskorz, I. Komaromi, R. Gomperts, R.L. Martin, D.J. Fox, T. Keith,
M.A. Al-Laham, C.Y. Peng, A. Nanayakkara, C. Gonzalez, M.
Challacombe, P.M.W. Gill, B. Johnson, W. Chen, M.W. Wong, J.L.
Andres, C. Gonzalez, M. Head-Gordon, E.S. Replogle, J.A. Pople,
GAUSSIAN 98, Gaussian, Inc, Pittsburgh, PA, 1998.
[20] A. Gruodis, V. Aleksa, D.L. Powell, P. Klaeboe, C.J. Nielsen, G.A.
Guirgis, J.R. Durig, J. Raman Spectrosc. 34 (2003) 711 and earlier
papers.
[21] E.B. Wilson, J.C. Decius, P.C. Cross, Molecular Vibrations, McGraw-
Hill, New York, 1955.
[22] A.A. Stolov, S.A. Katsyuba, D.I. Kamalova, A.B. Remizov, Spectro-
chim. Acta, Part A 53 (1997) 553.
A. Horn et al. / Journal of Molecular Structure 695–696 (2004) 77–9494