
Vibrational Dynamics and Heat Capacity of Syndiotactic ... · 13-17, atactic. 13. and isotactic....
10
International Journal of Scientific & Engineering Research, Volume 8, Issue 1, January-2017 652 ISSN 2229-5518 IJSER © 2017 http://www.ijser.org Vibrational Dynamics and Heat Capacity of Syndiotactic Poly(Ethyl Methacrylate) Moiz Ahmad 1 , Seema Srivastava 1 , Nafis Ahmad 2 Abstract — The normal modes of vibration and their dispersion in syndiotactic poly (ethyl methacrylate) are obtained using Urey Bradley force field and Wilson’s GF matrix method as modified by Higgs. It pr ovides a detai led explanation of F TIR and Ram an spectra .Characteristic features of dispersion curves such as regions of high density-of-states, repulsion and character of mixing of dispersive modes are discussed. Predictive values of the heat capacity as a function of temperature are calculated from dispersion curves via density-of-states between 40 to 400 ˚K. Keywords- poly (ethyl methacrylate), dispersion curves, heat capacity, density-of states 1 Introduction Poly (ethyl methacrylate) (PEMA) is an important polymer with wide applications in industrial 1-7 and medical fields 5-7 . PEMA polymers have improved mechanical properties, adhesion capability, chemical stability, characteristics of brilliance optical clarity and high transparency 5,8 . Because of lack of optical color, makes PEMA highly useful in all applications where light transmission is important. Optical band gap and refractive index of PEMA films decreases with increasing the dose of gamma radiation 9 . PEMA degrade to lower molecular weight compounds or to the monomers on heating 10-11 . TGA studies revealed that the improvement in thermal stability of PEMA films after thermal exposure 9 . X-ray diffraction studies suggest that PEMA is normally amorphous or semi-crystalline in nature 1,3,9,12 . The amorphous nature is due to lack of stereoregularity and bulky side groups. But synthesized PEMA exist in syndiotactic 13-17 , atactic 13 and isotactic 13,16,17 forms and these are regular and crystalline. In our earlier work, we reported the vibrational dynamics of polymeric systems having different conformations 18-21 . In the present paper, we report on vibration dynamics and heat capacity of syndiotactic poly (ethyl methacrylate) (sPEMA). Infrared and Raman spectroscopy, in combination with normal mode calculations, provide a powerful tool for probing conformation and conformationally sensitive modes of a polymer. In general, the infrared absorption, Raman spectra, and inelastic neutron scattering from polymeric systems are very complex and cannot be unraveled without the full knowledge of dispersion curves. ———————————————— 1 Department of Physics, Integral University, Lucknow, India 2 Department of Physics, College of Science, UAE University, PO Box 15551 Al-Ain, United Arab Emirates The assignment of normal mode frequencies are made on the basis of potential energy distribution (PED), which together with line intensity, line shape, and presence/ absence of the modes in the molecule having atoms placed in same atmosphere. Furthermore, the dispersion curves provide knowledge of the degree of coupling and the dependence of the frequency of a given mode on the sequence length of ordered conformation. These curves also facilitate a correlation of the microscopic properties, such as specific heat, enthalpy and free energy. The infrared and Raman spectra of crystalline sPEMA have been studied by many authors 14,16 . However, to the best of our knowledge, the dispersive behavior of normal modes, density-of-states and heat capacity have not been reported so far in the literature for sPEMA. The assignments of the normal modes of sPEMA are based on Urey-Bradley force field in addition to the valence force field. The normal mode frequencies obtained from this calculation were found to be in good agreement with the observed infrared bands. Heat capacity obtained via the density-of-states derived from the dispersion curves. 2 THEORY 2.1 Calculation Of Normal Mode Frequencies The calculation of normal mode frequencies has been carried out according to the well known Wilson G-F 22 matrix method, as modified by Higgs 23 . The vibrational secular equation which gives normal mode frequencies and their dispersion as a function of phase angle has the form: | G (δ) F (δ) - λ (δ) I | = 0, 0 ≤ δ ≤ π (1) where G and F are inverse kinetic energy and potential energy matrices in terms of internal coordinates. For an infinite isolated helical polymer, there are an infinite number of internal coordinate that lead to G and F matrices of infinite order. Because of the screw symmetry of the polymer, a transformation similar to that given by Born and IJSER
Transcript of Vibrational Dynamics and Heat Capacity of Syndiotactic ... · 13-17, atactic. 13. and isotactic....

International Journal of Scientific & Engineering Research, Volume 8, Issue 1, January-2017 652 ISSN 2229-5518
IJSER © 2017 http://www.ijser.org
Vibrational Dynamics and Heat Capacity of Syndiotactic Poly(Ethyl Methacrylate)
Moiz Ahmad1, Seema Srivastava1, Nafis Ahmad2
Abstract — The normal modes of vibration and their dispersion in syndiotactic poly (ethyl methacrylate) are obtained using Urey Bradley force field and Wilson’s GF matrix method as modified by Higgs. It pr ovides a detai led explanation of F TIR and Ram an spectra .Characteristic features of dispersion curves such as regions of high density-of-states, repulsion and character of mixing of dispersive modes are discussed. Predictive values of the heat capacity as a function of temperature are calculated from dispersion curves via density-of-states between 40 to 400 ˚K.
Keywords- poly (ethyl methacrylate), dispersion curves, heat capacity, density-of states
1 Introduction Poly (ethyl methacrylate) (PEMA) is an important polymer with wide applications in industrial1-7 and medical fields5-7. PEMA polymers have improved mechanical properties, adhesion capability, chemical stability, characteristics of brilliance optical clarity and high transparency5,8. Because of lack of optical color, makes PEMA highly useful in all applications where light transmission is important. Optical band gap and refractive index of PEMA films decreases with increasing the dose of gamma radiation9. PEMA degrade to lower molecular weight compounds or to the monomers on heating10-11. TGA studies revealed that the improvement in thermal stability of PEMA films after thermal exposure9. X-ray diffraction studies suggest that PEMA is normally amorphous or semi-crystalline in nature1,3,9,12 . The amorphous nature is due to lack of stereoregularity and bulky side groups. But synthesized PEMA exist in syndiotactic13-17, atactic13 and isotactic13,16,17 forms and these are regular and crystalline. In our earlier work, we reported the vibrational dynamics of polymeric systems having different conformations18-21. In the present paper, we report on vibration dynamics and heat capacity of syndiotactic poly (ethyl methacrylate) (sPEMA). Infrared and Raman spectroscopy, in combination with normal mode calculations, provide a powerful tool for probing conformation and conformationally sensitive modes of a polymer. In general, the infrared absorption, Raman spectra, and inelastic neutron scattering from polymeric systems are very complex and cannot be unraveled without the full knowledge of dispersion curves.
———————————————— 1Department of Physics, Integral University, Lucknow, India 2Department of Physics, College of Science, UAE University, PO Box 15551 Al-Ain, United Arab Emirates
The assignment of normal mode frequencies are made on the basis of potential energy distribution (PED), which together with line intensity, line shape, and presence/ absence of the modes in the molecule having atoms placed in same atmosphere. Furthermore, the dispersion curves provide knowledge of the degree of coupling and the dependence of the frequency of a given mode on the sequence length of ordered conformation. These curves also facilitate a correlation of the microscopic properties, such as specific heat, enthalpy and free energy. The infrared and Raman spectra of crystalline sPEMA have been studied by many authors14,16. However, to the best of our knowledge, the dispersive behavior of normal modes, density-of-states and heat capacity have not been reported so far in the literature for sPEMA. The assignments of the normal modes of sPEMA are based on Urey-Bradley force field in addition to the valence force field. The normal mode frequencies obtained from this calculation were found to be in good agreement with the observed infrared bands. Heat capacity obtained via the density-of-states derived from the dispersion curves. 2 THEORY 2.1 Calculation Of Normal Mode Frequencies The calculation of normal mode frequencies has been carried out according to the well known Wilson G-F22 matrix method, as modified by Higgs23. The vibrational secular equation which gives normal mode frequencies and their dispersion as a function of phase angle has the form: | G (δ) F (δ) - λ (δ) I | = 0, 0 ≤ δ ≤ π (1) where G and F are inverse kinetic energy and potential energy matrices in terms of internal coordinates. For an infinite isolated helical polymer, there are an infinite number of internal coordinate that lead to G and F matrices of infinite order. Because of the screw symmetry of the polymer, a transformation similar to that given by Born and
IJSER

International Journal of Scientific & Engineering Research, Volume 8, Issue 1, January-2017 653 ISSN 2229-5518
IJSER © 2017 http://www.ijser.org
Von Karman can be perform that reduces to the infinite problem to finite dimension24. The vibrational frequencies ν (in cm-1) are related to the eigen values λ (δ) by the following relation:
λ (δ ) = 4π2c2 ν2(δ) (2)
where c is the velocity of light. A plot of ν i versus δ gives the dispersion curve for the ith mode. 2.2 Calculation Of Specific Heat Dispersion curves can be used to calculate the specific heat of a polymeric system. For a one- dimensional system the density-of-states function or the frequency distribution function expresses the way energy is distributed among the various branches of normal modes in the crystal, is calculated from the relation: g (ν) = ∑ (∂ν j/∂δ)-1 |νj(δ)-νj (3) with ∫ g(ν j)dν j = 1
The sum is over all the branches j. Considering a solid as an assembly of harmonic oscillators, the frequency distribution g (ν) is equivalent to a partition function. The constant volume heat capacity can be calculated using Debye’s relation Cv = ∑g(ν j)kNA(hν j/kT)2[exp(hν j/kT)/{exp(hν j/kT) -1)}2] (4) where, g(ν j) is density-of-states; k is the Boltzmann constant; NA is Avagadro number; T is absolute temperature; and h is Planck’s constant. The constant volume heat capacity Cv, given by above equation, can be converted into constant-pressure heat capacity Cp using the Nernst-Lindemann approximation25-26; Cp – Cv = 3RA0 (Cp2T/ CvTm
) (5) where A0 is a constant often of a universal value [3.9×10⁻⁹(K mol)/J] and Tm
is the equilibrium melting temperature.
TABLE 1
INTERNAL COORDINATES AND FORCE CONSTANTS (mdyn/Å)
Internal Force Internal Force Coordinates Constants Coordinates Constants
ν(Cδ‒H) 4.20 ϕ(Cα‒Cβ‒H) 0.410 (0.320) ν(Cβ‒H) 4.15 ϕ(H‒Cβ‒H) 0.430 (0.270) ν(C‒H) 4.42 ϕ(O=C*‒Cα) 0.190 (0.565) ν(Cα‒Cδ) 3.16 ϕ(Cα‒C*‒O) 1.850 (0.495) ν(Cα‒Cβ) 2.60 ϕ(O‒C*=O) 0.770 (0.805) ν(C‒C) 3.18 ϕ(C‒O‒C*) 1.900 (0.460) ν(C*=O) 8.80 ϕ(O‒C‒H) 0.480 (0.285) ν(O‒C*) 4.50 ϕ(H‒C‒H) 0.378 (0.320) ν(Cα‒C*) 3.24 ϕ(O‒C‒C) 0.326 (0.250)
ϕ(Cα‒Cδ‒H) 0.422 (0.254) ω(C*=O) 0.595 ϕ(H‒Cδ‒H) 0.426 (0.360) τ(O‒C*) 0.052 ϕ(Cα‒Cδ‒Cα) 0.116 (0.495) τ(O‒C) 0.044 ϕ(Cδ‒Cα‒Cβ) 0.845 (0.180) τ(Cα‒Cβ) 0.001 ϕ(Cδ‒Cα‒C*) 0.560 (0.290) τ(Cα‒C*) 0.029 ϕ(Cδ‒Cα‒Cδ) 1.650 (0.180) τ(Cδ‒Cα) 0.006 ϕ(C*‒Cα‒Cβ ) 1.115 (0.320) τ(Cα‒Cδ) 0.005 ϕ(Cα‒Cβ‒H) 0.410 (0.320)
ν, ϕ,ω and τ represent stretch, angle bend, wag, and torsion respectively. Nonbonded force constants are given in parentheses.
IJSER

International Journal of Scientific & Engineering Research, Volume 8, Issue 1, January-2017 654 ISSN 2229-5518
IJSER © 2017 http://www.ijser.org
Fig.1 Chemical repeat unit of PEMA 3 RESULTS AND DISCUSSION The structural repeat unit of sPEMA (Fig. 1) has 18 atoms in a repeat unit that gives rise to 54 dispersion curves. The Urey Bradley force constants were initially taken from our previously reported work on poly(γ-ethyl)-L-glutamate . The force constants were then modified in order to obtain the “best fit” with the FTIR spectra. The final set of force constant (bonded and nonbonded) for poly (ethyl methacrylate) are given in table 1. The vibrational frequencies were calculated for values of δ varying from 0 to π in steps of 0.05 π. Assuming that Ѱ is the angle of rotation about the axis of helix that separates the adjacent units, the modes corresponding to δ = 0 (A species) and Ѱ (E species) are IR active. The modes corresponding to δ = 0; Ѱ, 2Ѱ (E species) are Raman active. The four zero frequencies correspond to acoustic modes in which three representing translation along the three axes, and one is rotation around the chain axis. The assignments have been made on the basis of PED, band position, band shape, band intensity, derivative of spectra, and absorption / scattering in similar molecules having groups placed in same environments. Expect for a few of frequencies, most of the frequencies are fitted within less than 1%. As mentioned earlier, the modes corresponding to δ = 0 are both IR and Raman active. Therefore, the calculated frequencies are first
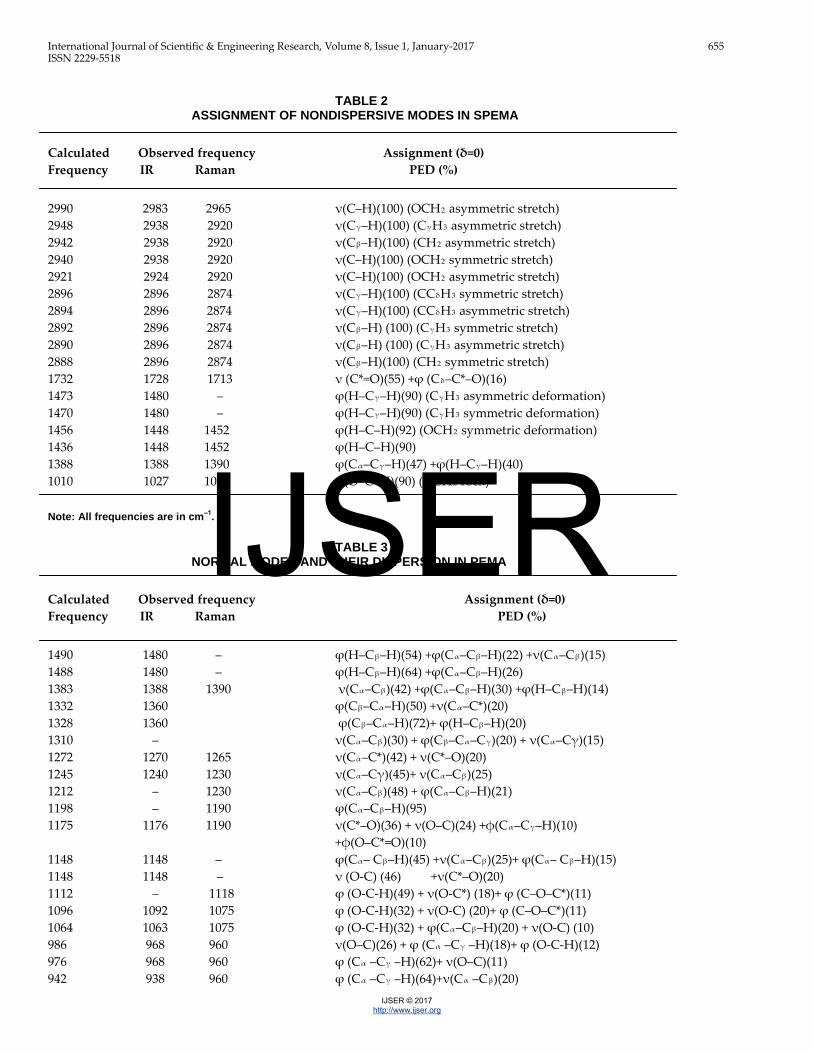
fitted to the observed frequencies for this phase value. Since all the modes above 1390 cm-1 are nondispersive in nature, the dispersion curves are plotted only for the modes below 1390 cm-1. It is convenient to discuss the normal frequencies under nondispersive and dispersive mode, along with their potential energy distribution (PED) are given in table 2, 3 and 4 respectively. 3.1 Nondispersive Modes: The calculated frequencies in the C‒H stretching region from 3000–2800 cm-1 are in good agreement with the observed bands. In our calculations C=O stretching vibration of ester group appears as a mixed mode with Cα‒C*‒O bending and Cα‒C* stretching. It is calculated at 1732 cm-1 and is in good agreement with the observed frequency at 1728 cm-1 in FTIR. In our previously reported work stretching vibration of C*=O at 1740 cm-1. The difference in the wave number is due to the change in the environment of surrounding atoms. The OCH2 rocking mode calculated at 1010 cm-1 and observed IR frequency at 1027cm-1. The calculated frequency of (Cα‒Cγ‒H) and (H‒Cγ‒H) bending mode is calculated at 1388 cm-1 and observed at 1388 cm-1. 3.2 Dispersive Modes: A CH2 group is attached in the backbone to connect the remaining unit of sPEMA. Two zone center modes calculated at 1383 cm-1 and 1332 cm-1, having contribution from CH2 wag, and C‒C backbone stretch. These two modes converge at 1359 cm-1 at the zone boundary and assigned to the peak 1360 cm-1 observed in IR.
The skeletal mode is calculated at 1244 cm-1 with 44% contribution of backbone stretch and assigned to the observed peak at 1240 cm-1 in IR spectra. The C‒O and O‒C stretch modes coupled with (O‒C*=O), are calculated at 1175 cm-1 at zone centre, are assigned to the observed IR peak at 1176 cm-1. The in plane (C*=O) bending coupled with skeletal bending is calculated at 682 cm-1 at the zone center and fitted to the observed peak at 695 cm-1 in IR. The corresponding out‒of‒plane bending is calculated at 756 cm-1 at the zone center and is assigned to the observed peak at 748 cm-1 in IR spectra. The modes at 480 cm-1 arising from (Cα –C*‒O) deformation is assigned to the 495cm-1 in IR spectra. The methyl rocking mode is calculated at 976 cm-1 at δ = 0 and assigned to the 968 cm-1 in IR. This mode is almost nondispersive. The other methyl rocking modes are calculated at 942 and 917 cm-1 is coupled with Cα‒Cβ stretch, assigned to the observed peak at 938 cm-1 in IR spectra.
Cδ
Cβ
C*
O O C
Cα
H
H H
H H
Cγ
H H
H H
H
IJSER
International Journal of Scientific & Engineering Research, Volume 8, Issue 1, January-2017 655 ISSN 2229-5518
IJSER © 2017 http://www.ijser.org
TABLE 2
ASSIGNMENT OF NONDISPERSIVE MODES IN SPEMA Calculated Observed frequency Assignment (δ=0) Frequency IR Raman PED (%) 2990 2983 2965 ν(C‒H)(100) (OCH2 asymmetric stretch) 2948 2938 2920 ν(Cγ‒H)(100) (CγH3 asymmetric stretch) 2942 2938 2920 ν(Cβ‒H)(100) (CH2 asymmetric stretch) 2940 2938 2920 ν(C‒H)(100) (OCH2 symmetric stretch) 2921 2924 2920 ν(C‒H)(100) (OCH2 asymmetric stretch) 2896 2896 2874 ν(Cγ‒H)(100) (CCδH3 symmetric stretch) 2894 2896 2874 ν(Cγ‒H)(100) (CCδH3 asymmetric stretch) 2892 2896 2874 ν(Cβ‒H) (100) (CγH3 symmetric stretch) 2890 2896 2874 ν(Cβ‒H) (100) (CγH3 asymmetric stretch) 2888 2896 2874 ν(Cβ‒H)(100) (CH2 symmetric stretch) 1732 1728 1713 ν (C*=O)(55) +ϕ (Cδ‒C*‒O)(16) 1473 1480 ‒ ϕ(H‒Cγ‒H)(90) (CγH3 asymmetric deformation) 1470 1480 ‒ ϕ(H‒Cγ‒H)(90) (CγH3 symmetric deformation) 1456 1448 1452 ϕ(H‒C‒H)(92) (OCH2 symmetric deformation) 1436 1448 1452 ϕ(H‒C‒H)(90) 1388 1388 1390 ϕ(Cα‒Cγ‒H)(47) +ϕ(H‒Cγ‒H)(40) 1010 1027 1019 ϕ(O‒C‒H)(90) (OCH2 rock) Note: All frequencies are in cm‒1.
TABLE 3 NORMAL MODES AND THEIR DISPERSION IN PEMA
Calculated Observed frequency Assignment (δ=0) Frequency IR Raman PED (%) 1490 1480 ‒ ϕ(H‒Cβ‒H)(54) +ϕ(Cα‒Cβ‒H)(22) +ν(Cα‒Cβ)(15) 1488 1480 ‒ ϕ(H‒Cβ‒H)(64) +ϕ(Cα‒Cβ‒H)(26) 1383 1388 1390 ν(Cα‒Cβ)(42) +ϕ(Cα‒Cβ‒H)(30) +ϕ(H‒Cβ‒H)(14) 1332 1360 ϕ(Cβ‒Cα‒H)(50) +ν(Cα‒C*)(20) 1328 1360 ϕ(Cβ‒Cα‒H)(72)+ ϕ(H‒Cβ‒H)(20) 1310 ‒ ν(Cα‒Cβ)(30) + ϕ(Cβ‒Cα‒Cγ)(20) + ν(Cα‒Cγ)(15) 1272 1270 1265 ν(Cα‒C*)(42) + ν(C*‒O)(20) 1245 1240 1230 ν(Cα‒Cγ)(45)+ ν(Cα‒Cβ)(25) 1212 ‒ 1230 ν(Cα‒Cβ)(48) + ϕ(Cα‒Cβ‒H)(21) 1198 ‒ 1190 ϕ(Cα‒Cβ‒H)(95) 1175 1176 1190 ν(C*‒O)(36) + ν(O‒C)(24) +φ(Cα‒Cγ‒H)(10) +φ(O‒C*=O)(10) 1148 1148 ‒ ϕ(Cα‒ Cβ‒H)(45) +ν(Cα‒Cβ)(25)+ ϕ(Cα‒ Cβ‒H)(15) 1148 1148 ‒ ν (O-C) (46) +ν(C*‒O)(20) 1112 ‒ 1118 ϕ (O-C-H)(49) + ν(O-C*) (18)+ ϕ (C‒O‒C*)(11) 1096 1092 1075 ϕ (O-C-H)(32) + ν(O-C) (20)+ ϕ (C‒O‒C*)(11) 1064 1063 1075 ϕ (O-C-H)(32) + ϕ(Cα‒Cβ‒H)(20) + ν(O-C) (10) 986 968 960 ν(O‒C)(26) + ϕ (Cα ‒Cγ ‒H)(18)+ ϕ (O-C-H)(12) 976 968 960 ϕ (Cα ‒Cγ ‒H)(62)+ ν(O‒C)(11) 942 938 960 ϕ (Cα ‒Cγ ‒H)(64)+ν(Cα ‒Cβ)(20)
IJSER

International Journal of Scientific & Engineering Research, Volume 8, Issue 1, January-2017 656 ISSN 2229-5518
IJSER © 2017 http://www.ijser.org
917 938 960 ϕ (Cα ‒Cγ ‒H)(55)+ν(Cα ‒Cβ )(14) 890 884 865 ν(Cα ‒Cγ )(28)+ ϕ (Cα –Cγ‒ H)(24)+ν(C*‒O)(15) 830 ‒ 825 ν(Cα ‒Cβ )(20)+ ϕ (O‒C‒H)(14)+ν(C*=O)(11) 812 ‒ 825 ω(C*=O)(53)+ ϕ (Cβ ‒Cα –C*)(14)+ ϕ (Cα ‒Cβ – H)(14) 799 ‒ ‒ ϕ (O-C-H)(15)+ ϕ (C‒O‒C*)(14)+ ν(C*=O)(10) 756 748 770 ω(C*=O)(56)+ν(Cα ‒Cβ)(24) 732 730 ‒ ϕ (Cα ‒Cβ ‒H)(68)+ v (C*= O)(18) 682 695 ‒ ϕ (Cα ‒Cβ ‒H)(25)+ ϕ (Cβ ‒Cα ‒Cγ )(16)+ ϕ (C‒O‒ C*)(10)+ν(Cα‒ Cγ )(10)+ ϕ (O‒C*=O)(10) 616 604 598 ν(Cα –C*)(18)+ ϕ (Cβ –Cα‒ Cγ )(13)+ ϕ (O‒C*= O)(13)+ ϕ (C*‒Cα ‒Cγ )(11)+ ϕ(C‒O‒C*)(11)+ν(Cα ‒Cγ )(10) 532 550 548 ϕ (Cα ‒Cβ ‒Cα )(30)+ ϕ (Cγ ‒Cα ‒ Cβ )(28)+ ϕ(Cα –Cγ ‒H)(10) 480 495 490 ϕ (Cα –C*‒O)(22)+ν(Cα ‒Cγ)(18)+ν(C*‒O)(11) 476 495 490 ϕ (Cα –C*‒O)(26)+ν(Cα ‒Cγ)(16)+ν(C*‒O)(14)+ ϕ (C*‒Cα ‒Cγ )(12)+ ϕ (Cβ ‒Cα –C*)(10) 380 375 ‒ ϕ (Cβ ‒Cα ‒Cγ )(68)+ τ (Cα –C*)(16) 362 375 ‒ ϕ (Cβ ‒Cα ‒Cγ)(24)+ ϕ (C‒O‒C*)(17)+ τ (Cα – C*)(10) 340 ‒ 330 ϕ (C‒O‒C*)(42)+ ϕ (O‒C*=O)(36)+ϕ(O=C* ‒Cα) (11) 330 ‒ 330 ϕ (O‒C*=O)(37)+ ϕ (C*‒Cα‒ Cγ)(15)+ ϕ (C‒O‒C*)(12)+ ϕ (O=C*‒Cα )(12) 302 ‒ ‒ ϕ (Cβ ‒Cα ‒Cβ )(40)+ ϕ (C‒O‒C*)(20)+ ϕ (Cα –C*‒ O)(18) 288 ‒ ‒ ϕ (Cβ ‒Cα –C*)(37)+ ϕ (Cβ ‒Cα ‒Cγ )(13)+ τ(O‒C)(12)+ τ (Cα‒ C*)(10) 270 ‒ ‒ ϕ (C*‒Cα ‒Cγ )(32)+ ϕ (Cβ –Cα‒ Cγ )(20)+ν(Cα –C*)(10) 228 ‒ ‒ ϕ (Cβ ‒Cα ‒Cγ )(50)+ τ (O‒C*)(23)+ ϕ (Cβ ‒Cα –C*)(11)+ ϕ (Cα ‒Cβ ‒Cα )(10) 202 ‒ ‒ ϕ (C*‒Cα ‒Cγ )(40)+ ϕ (Cβ –Cα‒ C*)(20)+ ϕ(Cα –C*‒O)(16) 194 ‒ ‒ τ (Cα ‒Cβ )(44)+ τ (O‒C)(32)+ τ (O‒C*)(12) 175 ‒ ‒ τ (Cα ‒Cβ )(56)+ τ (O‒C*)(19)+(10) 158 ‒ ‒ ϕ (Cβ ‒Cα –C*)(32)+ ϕ (Cα –C*‒O)(20)+ ϕ (Cβ ‒Cα ‒Cγ )(15) 150 ‒ ‒ τ (Cβ ‒Cα )(90) 140 ‒ ‒ τ (O‒C*)(38)+ τ (O‒C)(25)+ τ (Cα –C*)(16) 133 ‒ ‒ τ (Cα ‒Cβ)(48)+ τ (O‒C)(40) 120 ‒ ‒ τ (Cα ‒Cβ)(42)+ τ (O‒C)(30)+ τ (O‒C*)(24) 102 ‒ ‒ τ (O‒C*)(45)+ ϕ (Cα ‒Cβ ‒Cα )(23) 58 ‒ ‒ τ (Cα –C*)(30)+ τ (O‒C)(13)+ ϕ (Cβ‒ Cα – C*)(13)+ν(Cα ‒Cβ)(12) 50 ‒ ‒ ϕ (Cβ ‒Cα –C*)(48)+ τ (O‒C)(22)+ ν (C*=O)(12)+ ϕ (Cα ‒Cβ ‒Cα )(10) 46 ‒ ‒ ν(Cα ‒Cβ )(40)+ ϕ (Cβ ‒Cα ‒Cβ )(20)+ τ (Cα – C*)(10) 8 ‒ ‒ τ (Cα ‒Cγ )(99) 7 ‒ ‒ τ (Cα –C*)(67)+ ϕ (Cα ‒Cβ ‒H)(16)
IJSER

International Journal of Scientific & Engineering Research, Volume 8, Issue 1, January-2017 657 ISSN 2229-5518
IJSER © 2017 http://www.ijser.org
TABLE 4 NORMAL MODES AND THEIR DISPERSION IN PEMA
Calculated Observed frequency Assignment (δ=π) Frequency IR Raman PED (%) 1484 1480 1452 ϕ(H‒Cβ‒H)(56) +ϕ(Cα‒Cβ‒H)(24) +ν(Cα‒Cβ)(12) 1359 1360 1390 ϕ(Cα‒ Cβ‒‒H)(41) +ν(Cα‒Cβ)(29)+ ϕ(H‒Cβ‒H)(17) 1307 ‒ ‒ ϕ(Cα‒ Cβ‒H)(41)+ ν(Cα‒C*)(28) +ν(C*‒O)(10) 1281 1270 1265 ν(Cα‒Cβ)(25) + ϕ(Cβ‒Cα‒Cβ)(20)+ ν(Cα‒Cδ)(13) 1175 1176 1190 ν(C*‒O)(30) + ν(O‒C)(20) +φ(Cα‒Cδ‒H)(20) 1164 1176 1190 ϕ(Cα‒Cβ‒H)(30)+ ν(Cα‒Cβ)(22)+ ϕ(Cα‒Cγ‒H)(14) 1118 ‒ 1118 ν(O‒C)(24) + ϕ(Cα‒Cβ‒H)(22) +ϕ (O‒C‒H)(10) 1086 1092 1075 ϕ (O‒C‒H)(54)+ ϕ(Cα‒Cβ‒H)(12) 980 968 960 ϕ (Cα ‒Cγ ‒H)(38)+ ν(O‒C)(20)+ ν(C*‒O)(12) 942 938 958 ϕ (Cα ‒Cγ ‒H)(40)+ν(Cα ‒Cβ )(16) 885 884 864 ϕ (Cα ‒Cγ ‒H)(40)+ ν(C*‒O)(17) 791 ‒ ‒ ω(C*=O)(18)+ ϕ(C‒O‒C*)(15)+ ϕ (O-C-H)(11) 732 730 ‒ ϕ (Cα ‒Cβ ‒H)(68)+ v (C*= O)(18) 592 604 598 ϕ (Cα ‒C*)(23)+ ϕ (Cβ ‒Cα ‒Cβ )(10) 556 550 548 ν(Cα ‒Cβ )(28) + ϕ (Cβ ‒Cα‒Cβ)(22)+ ϕ (Cγ ‒Cα ‒ Cβ) )(18) 476 495 490 ϕ(Cα –C*‒O)(26)+ν(Cα ‒Cγ)(16)+ν(C*‒O)(14)+ ϕ (C*‒Cα ‒Cγ )(12)+ ϕ (Cβ ‒Cα –C*)(10) 367 375 ‒ ϕ (Cβ ‒Cα ‒Cγ)(29)+ ϕ (Cβ ‒Cα ‒C*)(17)+ τ (Cα – C*)(14)+ ϕ (C‒O‒C*)(10) 334 ‒ 330 ϕ (Cβ ‒Cα ‒Cβ )(40)+ ϕ (C‒O‒C*)(27)+ ϕ (Cγ –Cα‒ C*)(10) 259 ‒ ‒ ϕ (C*‒Cα ‒Cγ )(32)+ ϕ (Cβ –Cα‒ Cγ )(22) ϕ (C‒O‒C*)(11) 202 ‒ ‒ τ (O‒C*)(40)+ τ (Cα ‒Cβ )(24)+ τ (O‒C)(12) 191 ‒ ‒ ϕ (Cβ ‒Cα –C*)(20)+ τ (O‒C)(19) + ϕ (Cβ ‒Cα ‒Cγ )(12) 158 ‒ ‒ ϕ (Cβ ‒Cα –C*)(32)+ ϕ (Cα –C*‒O)(20)+ ϕ (Cβ ‒Cα ‒Cγ )(15) 150 ‒ ‒ τ (Cβ ‒Cα )(65)+ ϕ (Cβ‒ Cα – C*)(23) 133 ‒ ‒ τ (Cα ‒Cβ)(48)+ τ (O‒C)(25)+ τ (O‒C*)(18) 102 ‒ ‒ τ (O‒C*)(45)+ ϕ (Cα ‒Cβ ‒Cα )(23) 65 ‒ ‒ ϕ (Cβ ‒Cα –C*)(44)+ ϕ (Cβ ‒Cα –C*)(18)+ ϕ (Cβ ‒Cα –H)(11) 38 ‒ ‒ τ (Cα –C*)(54)+ ϕ (Cβ ‒Cα –C*)(18)+ ϕ (Cα – Cβ ‒H)(18) 5 ‒ ‒ τ (Cα ‒Cγ )(70)+ ϕ (Cα – Cβ‒H)(18) Note: All frequencies are in cm‒1. 3.2 Dispersive Modes: A CH2 group is attached in the backbone to connect the remaining unit of sPEMA. Two zone center modes calculated at 1383 cm-1 and 1332 cm-1, having contribution from CH2 wag, and C‒C backbone stretch. These two modes converge at 1359 cm-1 at the zone boundary and assigned to the peak 1360 cm-1 observed in IR. The skeletal mode is calculated at 1244 cm-1 with 44%
contribution of backbone stretch and assigned to the observed peak at 1240 cm-1 in IR spectra. The C‒O and O‒C stretch modes coupled with (O‒C*=O), are calculated at 1175 cm-1 at zone centre, are assigned to the observed IR peak at 1176 cm-1. The in plane (C*=O) bending coupled with skeletal bending is calculated at 682 cm-1 at the zone center and fitted to the observed peak at 695 cm-1 in IR. The
IJSER

International Journal of Scientific & Engineering Research, Volume 8, Issue 1, January-2017 658 ISSN 2229-5518
IJSER © 2017 http://www.ijser.org
corresponding out‒of‒plane bending is calculated at 756 cm-1 at the zone center and is assigned to the observed peak at 748 cm-1 in IR spectra. The modes at 480 cm-1 arising from (Cα –C*‒O) deformation is assigned to the 495cm-1 in IR spectra.
The methyl rocking mode is calculated at 976 cm-1 at δ = 0 and assigned to the 968 cm-1 in IR. This mode is almost nondispersive. The other methyl rocking modes are calculated at 942 and 917 cm-1 is coupled with Cα‒Cβ stretch, assigned to the observed peak at 938 cm-1 in IR spectra.
3.3 Dispersion Curves: The dispersion curves of sPEMA are plotted in Figs. 2(a), 3(a), and 4(a) for modes below 1500 cm-1. The modes above 1500 cm-1 are highly localized and hence they are nondispersive or their dispersion is small. These modes are mainly stretches of C‒H, C*=O bonds and CH2 and CH3 deformations. The nondispersive modes are not shown in the dispersion curve. Depending on the degree of coupling, chemical species and conformation, these modes show some characteristic features. Some special features of these modes are discussed below.
Figure 2 (a) Dispersion curves of poly (ethyl) methacrylate) Fig. 3 (a) Dispersion curves of poly (ethyl) methacrylate) (1000-1500cm-1); (b) density of states of poly (ethyl) (400-1000cm-1); (b) density of states of poly (ethyl) methacrylate) (400- methacrylate) (1000-1500cm-1). 1000cm-1). For the modes 1383 cm-1 and 1328 cm-1 at the zone centre, there is attraction between them with an increase in the δ value and merges at zone boundary. The mode 1383 cm-1 is due to the stretching of (Cα‒Cβ) and angle bends of [(Cα‒Cβ‒H) +(H‒Cβ‒H)] of the main chain at δ = 0. The mode at 1383 cm-1, at δ = 0 has 42%, 30% & 14% contribution coming from ν (Cα‒Cβ), ϕ(Cα‒Cβ‒H) and ϕ H‒Cβ‒H) respectively . We see the variation in the contribution from different modes with the change in the δ values. Because of the coupled skeletal angle bends along the chain, these modes at 682 cm-1 [ϕ (Cα ‒Cβ ‒H)+ ϕ (Cβ ‒Cα ‒Cβ )+ ϕ (C‒O‒C*)+ν(Cα‒ Cγ )+ ϕ (O‒C*=O)], 380 cm-1 [ϕ (Cβ ‒Cα
‒Cγ )+ τ (Cα –C*)] and 288 cm-1[ϕ (Cβ ‒Cα –C*)+ ϕ (Cβ ‒Cα ‒Cγ ) + τ (O‒C) + τ (Cα‒ C*)] show large dispersion. 3.4 Density-Of-States and Heat Capacity: As discussed in the theory the inverse of the slope of the dispersion curves leads to the density-of-states which shows how energy is distributed in various normal modes. These are shown in Fig 2(b), 3(b) & 4(b). The peaks in the frequency distribution curves indicate the frequencies of high density of state, which compare well with the observed frequencies.
1000
1050
1100
1150
1200
1250
1300
1350
1400
1450
0 0.5 1
Freq
uenc
y (c
m-1
)
Phase Difference (δ)
1000
1050
1100
1150
1200
1250
1300
1350
1400
1450
0 1
Freq
uenc
y cm
-1
Density of States g(ν)
400
500
600
700
800
900
1000
0 0.5 1Fr
eque
ncy
Cm
-1
Density of States g(ν)
400
500
600
700
800
900
1000
0 0.5 1
Freq
uenc
y (C
m-1
)
Phase Difference (δ)
IJSER

International Journal of Scientific & Engineering Research, Volume 8, Issue 1, January-2017 659 ISSN 2229-5518
IJSER © 2017 http://www.ijser.org
Fig. 4 (a) Dispersion curves of poly (ethyl) methacrylate) (0-500cm-1); Fig. 5 Variation of total theoretical heat capacity CP with temperature (b) density of states of poly (ethyl) methacrylate) (0-500cm-1). The frequency distribution curves are used to calculate the heat capacity of sPEMA . It has been used to obtain the heat capacity as a function of temperature. The predictive values have been calculated within the temperature range 40-400 ºK as shown in fig. 5. It may be noted that the contribution from the lattice modes is bound to make a difference to the heat capacity because of its sensitivity to low frequency modes. The calculation of dispersion curves for a three dimension crystal is extremely difficult due to the large matrix size and enormous number of interaction which are difficult to visualize and quantify. However, in spite of several restrictions involved in the calculation of vibrational dynamics, the present work would provide a good starting
point for further basic studies on the thermodynamical behavior of the polymer. 4 CONCLUSION IR and Raman spectral data on sPEMA can be well interpreted by solving the secular equation based on Wilson’s GF matrix method as modified by Higgs and using Urey-Bradley force field. Some of the internal symmetry-dependent features, such as attraction and exchange of character are also well explained. These give rise to higher density-of-states. Heat capacity behavior with temperature is linear in nature.
REFERENCES
0
50
100
150
200
250
300
350
400
450
500
0 0.5 1
Freq
uenc
y (C
m-1
)
Phase difference (δ)
0
50
100
150
200
250
300
350
400
0 1
Freq
uenc
y C
m-1
Density of States g(ν)
0
20
40
60
80
100
120
140
160
0 100 200 300 400 500
Hea
t Cap
acity
(J/m
ol K
)
Temperature(K)
IJSER

International Journal of Scientific & Engineering Research, Volume 8, Issue 1, January-2017 660 ISSN 2229-5518
IJSER © 2017 http://www.ijser.org
[1] S. Jayanthi, A. Arulsankar, G.P. Kokila, S. Banulakshmi, B. Sundaresan. FTIR, XRD and AC Impedance Studies of the Polymer Electrolyte PEMA – KSCN added with SrTiO3. International Journal of ChemTech Research CODEN (USA): IJCRGG ISSN : 0974‒4290 Vol.6, No.13, pp 5366‒5371, November 2014 [2] Ramesh S, Ling OP. Polym.Chem., 2010, 1:702. [3]S. Rajendran*, M. Ramesh Prabhu, M. Usha Rani. Characterization of PVC/PEMA Based Polymer Blend Electrolytes. Int. J. Electrochem. Sci., 3 (2008) 282 – 290 [4] C .Vincent and B.Scrosati, Modern Batteries: an introduction to electrochemical power sources, John Wiley and sons, Inc, New York (1997) [5] Paul, S. (1996) Surface coatings science and technology. Wiley, New York, 312. [6] Odian, G. (1991) Principles of polymerization. John Wiley & Sons Inc., New York, 311‒313 [7] Jakub Reiter, Jirı Michalek, Jirı Vondrak, Dana Chmelıkova, Martin Pradny, Zdenek Micka Poly(ethyl methacrylate) and poly(2‒ethoxyethyl methacrylate) based polymer gel electrolytes. Journal of Power Sources 158 (2006) 509–517 [8]Reiter J, Krejza O, Sedlarikova M. Solar Energy Mater Solar Cells., 2009, 93: 249. [9]S. Fares, Influence of gamma‒ray irradiation on optical and thermal degradation of poly(ethyl‒methacrylate) (PEMA) polymer, Natural Science http://dx.doi.org/10.4236/ns.2012.47067 (polymer degradation, amorphous, band gap, refractive index) [10] Grassie, N., Mc Callum, J.R. and Polym, J. (1964) Thermal and photochemical degradation of poly(n‒butyl methacrylate. Science, A, 2, 983. [11] Malhotra, S.L., Minh, L., Blanchard, L.P. and Macromol, J. (1983) Thermal decomposition and glass transition temperature of poly‒(phenylmethacrylate) and poly (cyclo‒ hexyl methacrylate). Science‒Chemistry A, 19, 559. [12]Andreas Meschede·Thorsten Scharf· Hans‒Ulrich Krebs·Konrad Samwer, Mechanical spectroscopy of laser deposited polymers. Appl Phys A (2008) 93: 599–603 DOI 10.1007/s00339‒008‒4707‒8 ( from this paper we can report glass transition temp. , Amorphous structure XRD and FTIR) [13] 38. J. Brandrup, E. H. Immergut, Polymer Handbook, Wiley Interscience, (1989) [14] H. A. WILLIS, MRS V. J. I. ZICHY and P. J. HENDRA. The Laser‒Raman and Infra‒red Spectra of Poly(Methyl Methacrylate)
[15] Ken-ichi Hamada, Takeshi Serizawa, Tatsuki Kitayama, Nobutaka Fujimoto, Koichi Hatada, and Mitsuru Akashi, Stepwise Stereocomplex Assembly of Isotactic Poly(methyl methacrylate) and Syndiotactic Poly(alkyl methacrylate)s on Surfaces, Langmuir 2001, 17, 5513-5519. [16] H. NAGAI, Infrared Spectra of Stereoregular Polymethyl Methacrylate, Journal Of Applied Polymer Science Vol. 7, PP. 1697-1714 (1963) [17] Anton Neppel And Ian S. Butler, 13C NMR Spectra Of Poly(Methyl Methacrylate) And Poly(Ethyl Methacrylate), Journal of Molecular Structure, 117 (1984) 109-115 Elsewer Science Publishers B.V., Amsterdam - Printed in The Netherlands [18] Parvej Ali, Seema Srivastava, Moiz Ahmad & V. D. Gupta, Vibrational Dynamics and Heat Capacity of Poly(3-methylthiophene): A Conducting Polymer, Journal of Macromolecular Science, Part B: Physics, 53:7, 1305-1317, DOI: 10.1080/00222348.2014.912480 [19] Moiz Ahmad, Seema Srivastava, Pervej Ali, Phonon Dispersion and Heat Capacity of Poly (γ-Ethyl)-LGlutamate, International Journal of Computer & Mathematical Sciences IJCMS ISSN 2347 – 8527 Volume 4, Issue 3 March 2015 [20] Eram Anis,Parvej Ali,Seema Srivastava,M.W. Baig, Moiz Ahmad, Spectroscopic studies, phonon dispersion and heat capacity of poly (vinylidene chloride), Journal of Physical and Theoretical Chemistry of Islamic Azad University of Iran, 12 (2) 167-174: Summer 2015 (J. Phys. Theor. Chem. IAU Iran) ISSN 1735-2126 [21] Sumbul Firdaus, Seema Srivastava, Moiz Ahmad, Saif-ul-Islam Ansari, Parvej Ali, Poly (chlorotrifluoroethylene): Normal Modes, Phonon Dispersion and Heat Capacity, International Journal of Advanced Research (2015), Volume 3, Issue 5, 1071-1077 [22] E. B. Wilson, J. C. Decuis, P. C. Cross, 1980Molecular Vibrations: The theory of infrared and Raman vibrational spectra, Dover Publication, New York.
[23] P. W. Higgs Proc. Roy, 1953. Soc, London, 220:472 - 480.
[24] P. Tondon, V. D. Gupta, O. Prasad, S. Rastogi, V. P.
Gupta, 1997. J. Polym. Sci. B Polym. Phys., 35:2281- 2292. [25] Pan, M.;. Verma, N.; Wunderlich,B. J Therm. Anal, 1989,
35, 955 [26] K.A. Roles, A. Xenopoulos, B. Wunderlich, 1993. Biopolym., 33:753-755.
IJSER

International Journal of Scientific & Engineering Research, Volume 8, Issue 1, January-2017 661 ISSN 2229-5518
IJSER © 2017 http://www.ijser.org
Ref
IJSER


![The structure of Isotactic Polypropylene Crystallized from ... · During the crystallization of isotactic polypropylene, Varga [4] found that, two types of spherulites α-and β-modification.](https://static.fdocuments.in/doc/165x107/5f728cad3c16086d9a751103/the-structure-of-isotactic-polypropylene-crystallized-from-during-the-crystallization.jpg)


![Preparation of Atactic Polypropylene Elastomers With a Cpticl2n[Si(Ch3)3]2mao Catalyst Metallocene](https://static.fdocuments.in/doc/165x107/56d6bf7f1a28ab301696773a/preparation-of-atactic-polypropylene-elastomers-with-a-cpticl2nsich332mao.jpg)


