Vibration Pedestrian
17
1 Vibration serviceability of a footbridge under vertical pedestrian load Stana Živanović Research Associate Vibration Engineering Section Department of Civil and Structural Engineering, The University of Sheffield Sir Frederick Mappin Building, Mappin Street, Sheffield, S1 3JD, UK ABSTRACT Vibration serviceability of footbridges under human induced dynamic loading attracted a lot of attention of the research community in the last several years. Most often, crowd loading scenario and human‐human and human‐structure interaction are analysed. However, between the crowd loading scenario and the single pedestrian that most often features in the current design guidelines, there are at least two other loading scenarios that could be relevant for footbridge design: groups of people walking together and the normal pedestrian traffic, which is usually related to the situation where the people’s movement is not spatially restricted. On top of this the vandal loading should be considered as well. This paper presents a combined numerical and experimental study of a box girder footbridge that is lively in the vertical direction. An attempt is made to analyse most relevant loading scenarios for this bridge residing in the city centre of the capital of Montenegro. The loading scenarios are presented in form of a risk matrix. Experimental data for some loading scenarios are collected and compared with numerical simulations (based either on the current guidelines or on some uncodified procedures). It could be concluded that the existing design guidelines should be used with caution, and that the alternative methods of vibration serviceability evaluation might often be preferable. 1 INTRODUCTION Traditionally, the design guidelines for vibration serviceability of footbridges in the vertical direction rely on estimation of vibration response to single person walking at a pacing frequency that matches the natural frequency of the relevant vibration mode (BSI, 1978; OHBDC, 1983). Although this loading scenario is the worst case scenario for a single person since it induces the resonance, it is not necessarily plausible. For example, the relevant mode could have the natural frequency outside the comfortable range for walking frequencies (1.5‐2.4 Hz), and the resonant scenario would produce conservative estimates of the vibration response. On the other hand there is an opinion that the resonant single person loading scenario presents a simple means of predicting the response to multi‐person traffic. This hypothesis needs verification and a robust single person model that accounts for frequency dependence of the amplitude of the walking force as well as the reduced amplitude for the higher harmonics, which are currently not accounted for in BS5400 (BSI, 1978) and Ontario code (OHBDC, 1983).
-
Upload
salehuddin-ramli -
Category
Documents
-
view
34 -
download
2
description
Pedestrian bridge under vibration load
Transcript of Vibration Pedestrian
1
Vibration serviceability of a footbridge under vertical pedestrian load
Stana Živanović
Research Associate Vibration Engineering Section
Department of Civil and Structural Engineering, The University of Sheffield Sir Frederick Mappin Building, Mappin Street, Sheffield, S1 3JD, UK
ABSTRACT
Vibration serviceability of footbridges under human induced dynamic loading attracted a lot of attention of the research community in the last several years. Most often, crowd loading scenario and human‐human and human‐structure interaction are analysed. However, between the crowd loading scenario and the single pedestrian that most often features in the current design guidelines, there are at least two other loading scenarios that could be relevant for footbridge design: groups of people walking together and the normal pedestrian traffic, which is usually related to the situation where the people’s movement is not spatially restricted. On top of this the vandal loading should be considered as well.
This paper presents a combined numerical and experimental study of a box girder footbridge that is lively in the vertical direction. An attempt is made to analyse most relevant loading scenarios for this bridge residing in the city centre of the capital of Montenegro. The loading scenarios are presented in form of a risk matrix. Experimental data for some loading scenarios are collected and compared with numerical simulations (based either on the current guidelines or on some uncodified procedures). It could be concluded that the existing design guidelines should be used with caution, and that the alternative methods of vibration serviceability evaluation might often be preferable.
1 INTRODUCTION
Traditionally, the design guidelines for vibration serviceability of footbridges in the vertical direction rely on estimation of vibration response to single person walking at a pacing frequency that matches the natural frequency of the relevant vibration mode (BSI, 1978; OHBDC, 1983). Although this loading scenario is the worst case scenario for a single person since it induces the resonance, it is not necessarily plausible. For example, the relevant mode could have the natural frequency outside the comfortable range for walking frequencies (1.5‐2.4 Hz), and the resonant scenario would produce conservative estimates of the vibration response. On the other hand there is an opinion that the resonant single person loading scenario presents a simple means of predicting the response to multi‐person traffic. This hypothesis needs verification and a robust single person model that accounts for frequency dependence of the amplitude of the walking force as well as the reduced amplitude for the higher harmonics, which are currently not accounted for in BS5400 (BSI, 1978) and Ontario code (OHBDC, 1983).

2
With some high profile serviceability failures of footbridges in the last decade, such as Solferino bridge in Paris (Setra, 2006) and Millennium Bridge in London (Dallard et al., 2001), came realisation that attention in the design should be paid to other loading scenarios, such as sparse, dense and very dense crowds featuring in a French guideline (Setra, 2006).
Apart from having reliable load models for various loading scenarios, it is important that criteria for evaluation of response of human (walking or standing) vibration receiver are clearly defined. This is still subject of research, especially due to the fact that data about acceptability of vibrations perceived by moving people are sparse (Živanović et al, 2005a).
A convenient way to approach vibration serviceability issue in footbridge design is to construct a risk matrix that combines information about the hazard associated with a particular loading scenario and its probability of occurrence (McRobie and Morgenthal, 2002). The bridge should be designed in such a way that the most frequent events cause acceptable vibrations for most people, while the vibration level could be allowed to be higher for the events that rarely occur.
This paper presents currently available means of vibration estimation for a footbridge exposed to different loading scenarios. The evaluation of acceptability of this response to footbridge users is outside the scope of this study. The paper starts with the description of the footbridge structure analysed, and possible loading scenarios. It then proceeds to analysing the single person loading scenario, normal pedestrian traffic, groups of people walking together, running and vandal loading, and crowd loading. This is followed by conclusions.
2 STRUCTURAL DESCRIPTION AND EXPECTED TRAFFIC SCENARIOS
The footbridge analysed is a steel box girder shown in Figure 1a residing in the city centre of Podgorica, the capital of Montenegro. Its length is 104 m, with 78 m between inclined columns. Employing FRF‐based modal testing (Živanović et al., 2006) the first vertical (1V) vibration mode (Figure 1b), that is symmetric, with natural frequency of 2.04 Hz, modal mass of 58000 kg and extremely low modal damping ratio of 0.22% was identified as the source of bridge liveliness. In a free decay test it was found that the damping increases to 0.26% for higher vibration magnitudes such as those generated by human‐walking. The footbridge responds to normal pedestrian traffic dominantly in mode 1V (Živanović et al., 2005b).
(a)
1.2
0.8
1.0
0.6
0.4
0.2
0.0
-0.2 0 20 40 60 80 100 120
Bridge length [m]
Mod
e sh
ape
ampl
itude
f
m
n=2.04Hz=0.26%=58000kg
ζ
(b)
78m
Half sine
Mode shape
Figure 1: (a) Footbridge photograph and (b) modal properties of the fundamental mode of vibration.
The bridge is located in the city centre, and therefore is frequently exposed to multi‐person traffic or a few friends crossing together. Apart from this, during quiet daytime periods as well as during nighttimes, it might be exposed to single person loading. These events, therefore, could be considered as those that are highly probable and it is expected that footbridge perform well in these conditions. Additionally, it could be expected that the bridge is occasionally crossed by joggers and crowds, and very rarely by dense crowds or exposed to vandal loading. Based on this consideration, a risk matrix could be constructed, as shown in
3
Table 1. The probability of loading scenarios is estimated based on the experience from traffic monitoring on the bridge, while the severity of various scenarios is automatically associated with that at the diagonal of the risk matrix. If the bridge were not already built, then any realisation after calculation that a traffic scenario of prescribed probability (normally possible to estimate in the design stage based on pedestrian traffic flow and density of the populated area) produces more severe vibrations than expected (upper triangle of the risk matrix) would require the modifications in the design to mitigate the extreme vibrations. If, however, the calculated responses are less severe than expected (lower triangle of the risk matrix) then the design solution is either acceptable or could even be modified to allow for greater slenderness, and therefore reduction in material cost.
Table 1: Risk matrix for possible loading scenarios.
Severity
Probability
Low (vibrations acceptable for
most pedestrians)
Moderate (vibrations acceptable
for certain percentage of
people)
High (vibrations do not need to be acceptable,
but panic should be avoided and integrity
of the structure preserved)
High Single pedestrian loadingNormal traffic, Groups
Moderate Joggers, Crowd
Low Vandals, Dense crowds
3 SINGLE PEDESTRIAN LOADING
Estimation of the vibration response generated by a single pedestrian has been a part of footbridge design guidelines since their introduction 30 years ago. This section starts with presentation of vibration response in analytical form, under an assumption that the relevant mode shape could be described by a half‐sine function. This is followed by presentation of measured vibration response and that calculated according to available design procedures.
3.1 Analytical solution
If a single mode dominates the footbridge response and only a single forcing harmonic of frequency ω is of interest then the response of the bridge could be found by solving the well‐known differential equation of the second order:
(1) ςω ω+ + =&& & 2 ( )( ) 2 ( ) ( )n n
F tx t x t x t
m
where m, ς and ωn are modal mass, damping ratio and circular natural frequency related to relevant mode of vibration, respectively, && &( ), ( )x t x t and x(t) are modal acceleration, velocity and displacement of the structure, respectively, while F(t) is the modal force obtained by multiplying the human‐induced force by the mode shape, transformed from spatial to the time domain using information about the (average) speed of footbridge crossing v:
(2) ω φ ω φ= ⋅ ⋅ = ⋅( ) ( )sin( ) ( ) sin( ) ( ).F t DLF W t x A t vt
DLF is the ratio between amplitude A of the dynamic force and the pedestrian’s weight W, ω is the circular frequency of the relevant forcing harmonic (usually first or second), while φ is the mode shape. Assuming that the mode shape is a half sine function (which is often the case in analytical procedures defined by different authors):
(3) π πφ = =( ) sin sinx vt
xL L
4
where L is the length of the bridge, then equation (1) could be transformed into:
(4) π π πςω ω ω ω ω⎡ ⎤⎛ ⎞ ⎛ ⎞+ + = = − − +⎜ ⎟ ⎜ ⎟⎢ ⎥⎝ ⎠ ⎝ ⎠⎣ ⎦
&& & 2( ) 2 ( ) ( ) sin( )sin cos cos .2n n
A vt A v vx t x t x t t t t
m L m L L
Assuming that the structure is linear, two terms on the right hand side could be solved separately and the principle of superposition applied to get the total response (Inman, 2001). The closed form solution for acceleration, assuming zero initial conditions, due to the first term is:
(5) ( ) ( ) ( ) ( ) ( )ςω β ςω β γας ω ω ω ω
β γ ω β γ ω β γ−
⎡ ⎤−⎢ ⎥= − − −
+ + +⎢ ⎥⎣ ⎦&& 2 2 0 0 01 2 2 2 2 2 2( ) cos sin sinnt n
n d d d
d d
f f fx t e t t t
( ) ( ) ( )ςω ω β ςω β γαςω ω ω ωβ γ β γ β γ
− ⎡ ⎤− − − +⎢ ⎥+ + +⎣ ⎦
0 0 02 2 2 2 2 2
2 sin cos cosnt d nn d d d
f f fe t t t
( ) ( ) ( )ςω ω β ςω ω β γαωω ω ωβ γ β γ β γ
− ⎡ ⎤+ + + −⎢ ⎥+ + +⎣ ⎦
20 0 02 2 2 2 2 2
cos sin sinnt d n d dd d d
f f fe t t t
( ) ( )βα α γα αβ γ
⎡ ⎤− +⎣ ⎦+2 20
2 2cos sin
ft t
where
πω ω ς α ω β ω α γ ςω α= = − = − = − =2 2 20 ; 1 ; ; ; 2 .
2 d n n n
A vf
m L
The closed form solution &&2 ( )x t for acceleration due to the second term in equation (4) is the same as that
presented in equation (5), with πα ω= − = +0 and .
2A v
fm L
Therefore, the general solution to equation (4)
is:
(6) = +&& && &&1 2( ) ( ) ( ).x t x t x t
The solution is derived for an arbitrary forcing frequency.
While the solution might look complicated, it is actually not difficult to code, and therefore is worth implementing instead of making unnecessary simplifications that might lead to erroneous vibration estimates.
The assumption that vibration mode has half‐sine shape allowed for calculation of the closed‐form solution. For Podgorica bridge this assumption seems appropriate for the main 78 m long span (Figure 1b). It is interesting to see how this approximation affects the accuracy of the solution. Figure 2a shows the response according to equation (6), with peak response of 0.31 m/s2, which is a nearly 20% overestimation of the peak response of 0.26 m/s2 calculated using a numerical procedure and taking into account the measured mode shape (Figure 2b). Both responses are calculated under an assumption of force amplitude of 180 N, step frequency of 2.04 Hz and pedestrian speed of 1.84 m/s, which are parameters taken from BS5400 (BSI, 1978). Although the analytical solution overestimates the actual response it might sometimes be convenient to use it in analytical studies. The analytical solution is also shown here since it is a bit tedious to derive, so it could be used as a reference in some future works.
The further calculation in this paper will be done using measured mode shape, to avoid errors due to assumption of half‐sine mode shape.

5
0.4
0.2
0.0
-0.4
Mod
al a
ccel
erat
ion
[m/s
]2
(a)
-0.2
0 10 20 30 40Time [s]
0 10 20 30 40Time [s]
50 60
0.4
0.2
0.0
-0.4
Mod
al a
ccel
erat
ion
[m/s
]2
(b)
-0.2
L=78mhalf sine mode shape
L=104mmeasured mode shapeBS5400 model
Figure 2: Modal acceleration calculated (a) when half‐sine mode shape is assumed, and (b) with measured mode shape.
3.2 Measured responses to single person excitation
The measured peak acceleration response of the bridge to single person excitation was up to 0.5 m/s2 for free walking and up to 0.7 m/s2 for metronome controlled walking in resonance performed by a well‐trained test subject. It is interesting to compare these measured responses with those calculated using some design procedures.
3.3 Response to single person according to various calculation procedures
The response estimate required in British (BSI, 1978) and Canadian (OHBDC, 1983) footbridge codes is identical for this bridge, and produces a peak estimate of 0.26 m/s2 (Figure 2b), as explained previously. However, the model in Eurocode 5 (EC, 1997) for design of timber bridges, defines a single person in the same way as BS5400, except that the force amplitude is 280 N. This produces the response of 0.40 m/s2, which is clearly much closer (than BS5400 estimate) to the maximum measured response of 0.5 m/s2 for free walking. However, it is still an underestimation, and this is purely due to differences in excitation potential between different people. Therefore, it is of crucial importance to update the existing models with the one that takes into account properties of human population (such as range of force magnitude) in a more precise way, i.e. in probabilistic manner.
The most comprehensive database of forcing amplitudes is collected by Kerr (1998). He measured about 1000 force records generated by 40 test subjects. He found great variability in the amplitude and expressed the results in form of DLFs. He concluded that DLF1 is frequency dependent, and could be fitted by a polynomial (Figure 3a):
(7) = − + − +3 21 0.2649 1.3206 1.7597 0.7613,p p pDLF f f f
while the upper and lower bounds covering σ±2 confidence bands (where σ is the standard deviation) are:
(8) −
−
upper bound: 0.5073 0.4843
lower bound: 0.2613 0.2495p
p
f
f
where pf is pacing frequency in Hz.
For walking at 2.04 Hz the most probable DLF1 would therefore be 0.42, while the upper σ2 confidence bound is 0.55. The two factors, applied to a weight of 700 N, produce force amplitudes of 294 N and 385 N, respectively (as opposed to 180 N in BS5400 and 280 N in EC5). Taking walking speed v as function of pacing frequency (Pachi and Ji, 2005):
(9) = = ⋅ =0.71 0.71 2.04 1.45 m/spv f
6
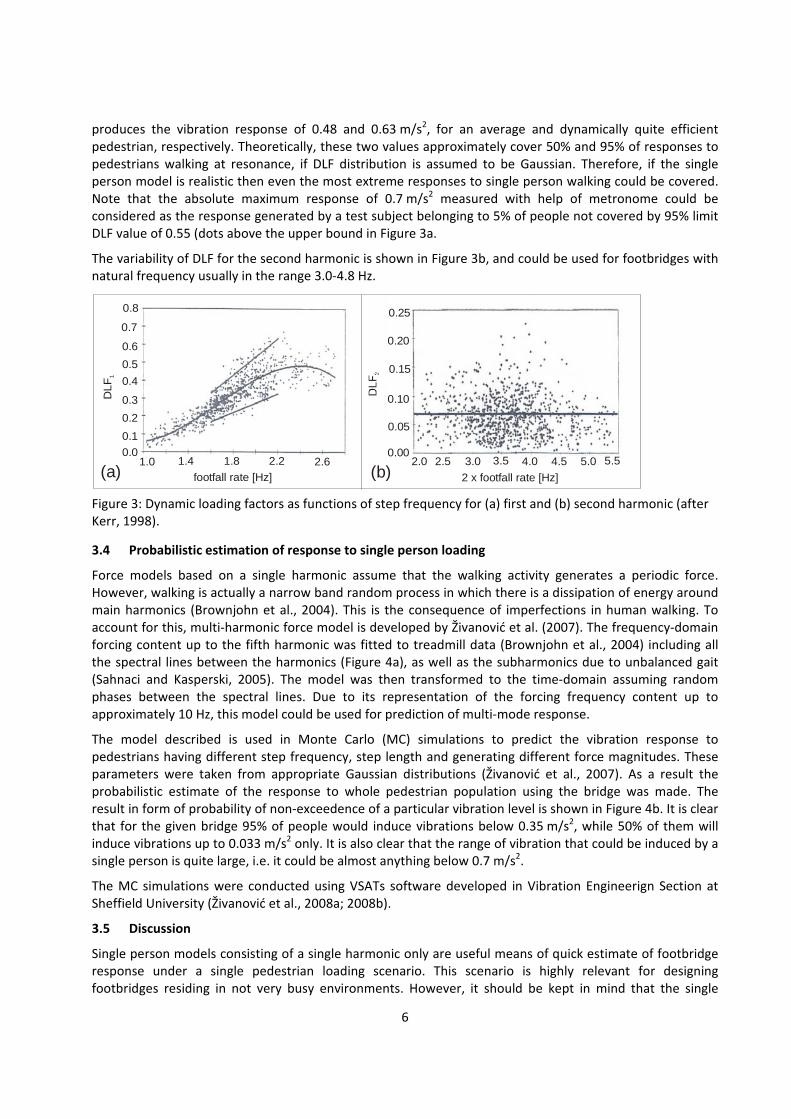
produces the vibration response of 0.48 and 0.63 m/s2, for an average and dynamically quite efficient pedestrian, respectively. Theoretically, these two values approximately cover 50% and 95% of responses to pedestrians walking at resonance, if DLF distribution is assumed to be Gaussian. Therefore, if the single person model is realistic then even the most extreme responses to single person walking could be covered. Note that the absolute maximum response of 0.7 m/s2 measured with help of metronome could be considered as the response generated by a test subject belonging to 5% of people not covered by 95% limit DLF value of 0.55 (dots above the upper bound in Figure 3a.
The variability of DLF for the second harmonic is shown in Figure 3b, and could be used for footbridges with natural frequency usually in the range 3.0‐4.8 Hz.
0.00.10.20.3
0.40.50.6
0.7
0.8
DLF
1
1.0 1.4 1.8 2.2 2.6footfall rate [Hz]
0.00
0.05
0.10
0.15
0.20
0.25
2 x footfall rate [Hz]2.0 2.5 3.0 3.5 4.54.0 5.0 5.5
(a) (b)
Figure 3: Dynamic loading factors as functions of step frequency for (a) first and (b) second harmonic (after Kerr, 1998).
3.4 Probabilistic estimation of response to single person loading
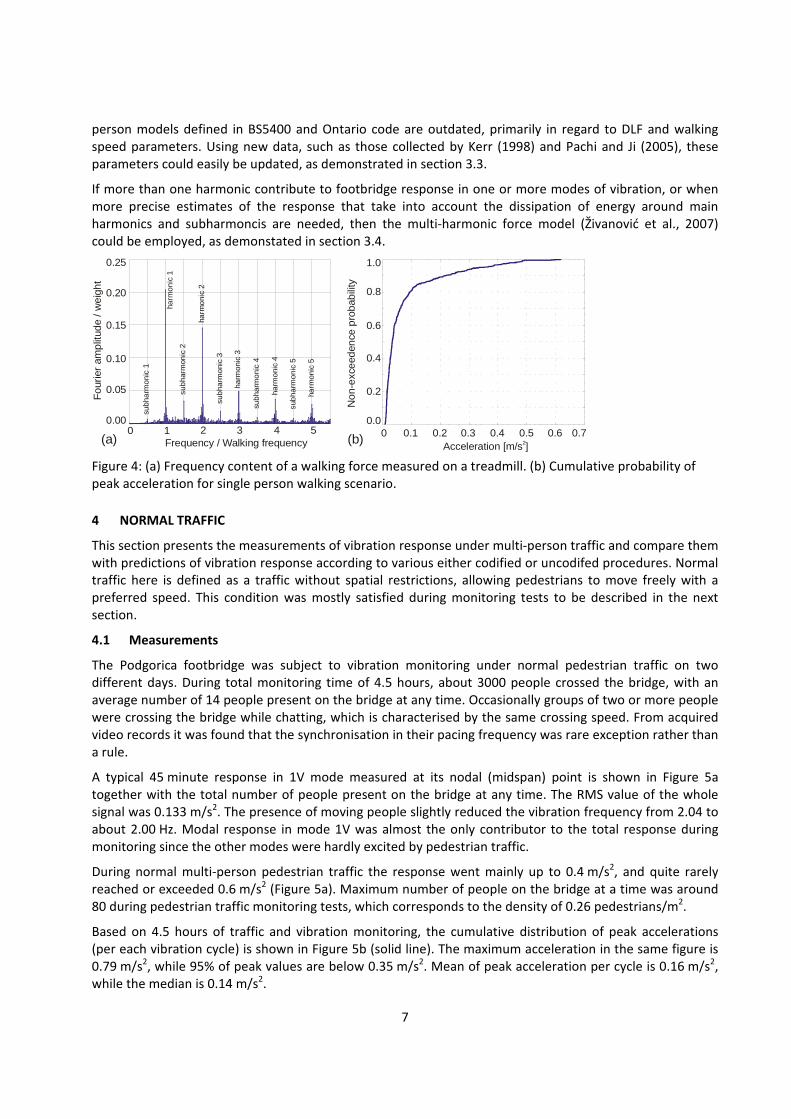
Force models based on a single harmonic assume that the walking activity generates a periodic force. However, walking is actually a narrow band random process in which there is a dissipation of energy around main harmonics (Brownjohn et al., 2004). This is the consequence of imperfections in human walking. To account for this, multi‐harmonic force model is developed by Živanović et al. (2007). The frequency‐domain forcing content up to the fifth harmonic was fitted to treadmill data (Brownjohn et al., 2004) including all the spectral lines between the harmonics (Figure 4a), as well as the subharmonics due to unbalanced gait (Sahnaci and Kasperski, 2005). The model was then transformed to the time‐domain assuming random phases between the spectral lines. Due to its representation of the forcing frequency content up to approximately 10 Hz, this model could be used for prediction of multi‐mode response.
The model described is used in Monte Carlo (MC) simulations to predict the vibration response to pedestrians having different step frequency, step length and generating different force magnitudes. These parameters were taken from appropriate Gaussian distributions (Živanović et al., 2007). As a result the probabilistic estimate of the response to whole pedestrian population using the bridge was made. The result in form of probability of non‐exceedence of a particular vibration level is shown in Figure 4b. It is clear that for the given bridge 95% of people would induce vibrations below 0.35 m/s2, while 50% of them will induce vibrations up to 0.033 m/s2 only. It is also clear that the range of vibration that could be induced by a single person is quite large, i.e. it could be almost anything below 0.7 m/s2.
The MC simulations were conducted using VSATs software developed in Vibration Engineerign Section at Sheffield University (Živanović et al., 2008a; 2008b).
3.5 Discussion
Single person models consisting of a single harmonic only are useful means of quick estimate of footbridge response under a single pedestrian loading scenario. This scenario is highly relevant for designing footbridges residing in not very busy environments. However, it should be kept in mind that the single
7
person models defined in BS5400 and Ontario code are outdated, primarily in regard to DLF and walking speed parameters. Using new data, such as those collected by Kerr (1998) and Pachi and Ji (2005), these parameters could easily be updated, as demonstrated in section 3.3.
If more than one harmonic contribute to footbridge response in one or more modes of vibration, or when more precise estimates of the response that take into account the dissipation of energy around main harmonics and subharmoncis are needed, then the multi‐harmonic force model (Živanović et al., 2007) could be employed, as demonstated in section 3.4.
Frequency / Walking frequency
0.25
Four
ier a
mpl
itude
/ w
eigh
t
0 1 2 3 4 5
0.20
0.15
0.10
0.05
0.00
(a)
harm
onic
1
harm
onic
2
harm
onic
3
harm
onic
4
harm
onic
5
subh
arm
onic
1
subh
arm
onic
2
subh
arm
onic
3
subh
arm
onic
4
subh
arm
onic
5
0 0.1 0.2 0.3 0.4 0.5 0.6 0.7
1.0
0.8
0.6
0.4
0.2
0.0
(b) Acceleration [m/s ]2
Non
-exc
eede
nce
prob
abilit
y
Figure 4: (a) Frequency content of a walking force measured on a treadmill. (b) Cumulative probability of peak acceleration for single person walking scenario.
4 NORMAL TRAFFIC
This section presents the measurements of vibration response under multi‐person traffic and compare them with predictions of vibration response according to various either codified or uncodifed procedures. Normal traffic here is defined as a traffic without spatial restrictions, allowing pedestrians to move freely with a preferred speed. This condition was mostly satisfied during monitoring tests to be described in the next section.
4.1 Measurements
The Podgorica footbridge was subject to vibration monitoring under normal pedestrian traffic on two different days. During total monitoring time of 4.5 hours, about 3000 people crossed the bridge, with an average number of 14 people present on the bridge at any time. Occasionally groups of two or more people were crossing the bridge while chatting, which is characterised by the same crossing speed. From acquired video records it was found that the synchronisation in their pacing frequency was rare exception rather than a rule.
A typical 45 minute response in 1V mode measured at its nodal (midspan) point is shown in Figure 5a together with the total number of people present on the bridge at any time. The RMS value of the whole signal was 0.133 m/s2. The presence of moving people slightly reduced the vibration frequency from 2.04 to about 2.00 Hz. Modal response in mode 1V was almost the only contributor to the total response during monitoring since the other modes were hardly excited by pedestrian traffic.
During normal multi‐person pedestrian traffic the response went mainly up to 0.4 m/s2, and quite rarely reached or exceeded 0.6 m/s2 (Figure 5a). Maximum number of people on the bridge at a time was around 80 during pedestrian traffic monitoring tests, which corresponds to the density of 0.26 pedestrians/m2.
Based on 4.5 hours of traffic and vibration monitoring, the cumulative distribution of peak accelerations (per each vibration cycle) is shown in Figure 5b (solid line). The maximum acceleration in the same figure is 0.79 m/s2, while 95% of peak values are below 0.35 m/s2. Mean of peak acceleration per cycle is 0.16 m/s2, while the median is 0.14 m/s2.

8
40
30
20
10
0-0.5
0.00.5
-1.0
1.0
Num
ber o
f peo
ple
on th
e br
idge
Mod
al a
cc. [
m/s
]2
0 1000 2000 3000Time [s]
Prob
abili
ty o
f non
-exc
eeda
nce
1.0
0.8
0.6
0.4
0.2
0.0 0 0.2 0.4 0.6 0.8
Peak acceleration per vibration cycle [m/s ]2
1.0(a) (b)
RMS=0.133m/s2
Figure 5: (a) Modal acceleration and the corresponding number of people during a 45 min long test. (b) Cumulative distribution of the peak acceleration per vibration cycle as measured and calculated.
4.2 Numerical models
The available calculation procedures, either defined in the time or frequency domain, will be presented in this section and their outputs compared with the measured responses.
4.2.1 Empirical model in form of GEV distribution
When measurements of footbridge response under normal pedestrian traffic are available then an estimate of the peak response as a function of return period could be made based on generalised extreme value (GEV) distribution fit of the experimental data (Živanović et al., 2008c). This allows for prediction of the peak response (or so called return level) depending on the return period of interest (Figure 6a). Note that the confidence intervals are broader (i.e. the confidence in response estimate is smaller) for higher return levels, as would be expected due to unavailability of experimental data for higher return levels.
The property of underlying Weibull distribution, used in GEV fit, is that it has a finite maximum (Coles, 2001). Theoretically, this maximum level corresponds to zero probability of occurrence (i.e. infinite return period) and on Podgorica bridge it is equal to 1.27 m/s2 which is a believable estimate for normal pedestrian traffic. The existence of an absolute maximum in the theoretical model agrees well with the logical expectation that a bridge has a physical limit of maximum vibration level that depends on its stiffness, mass and damping properties as well as ability to accommodate a limited number of pedestrians.
4.2.2 Matsumoto et al.’s (1978) model
Early research on crowd loading conducted by Matsumoto et al. (1978) suggested estimation of vibration response to normal pedestrian traffic by multiplying the response to a single person exciting the resonance
of the footbridge by a factor N , where N is the number of people on the bridge at the same time. This dependence was derived by summing responses of individual pedestrians arriving on the bridge according to the Poisson distribution and inducing the walking forces with equal (resonant) frequencies and random phases. Assuming that a single average pedestrian induced the peak acceleration of 0.48 m/s2 (see Section 3.3), the predicted peak response for mean number of 14 pedestrians would be 1.80 m/s2, while for maximum of 80 people it would be 4.29 m/s2, therefore significantly overestimating the measured values. Clearly, a single person response of 0.48 m/s2 is quite good estimate of the response to normal traffic. It seems that there is no room for significant increase of this response under multi‐person loading, and therefore Wheeler’s (1982) suggestion that the single person response is good enough estimate of multiperson traffic seems valid on this bridge, as long as the single person is modelled with a realistic DLF dependent on walking frequency.

9
0.90.8
0.7
0.6
0.5
0.4
0.3
0.2
0.10 10 20 30 40 50 60 70 80
2.0
1.9
1.8
1.7
1.6
Number of people on bridge
Mea
n pa
cing
freq
uenc
y [H
z]
(b)
Peak acceleration [m/s ]2
100 101 102 103 104
Return period [s]
0.10.2
0.30.4
0.50.6
0.7
0.80.91.01.11.2
Ret
urn
leve
l [m
/s] 2
(a)
Figure 6: (a) Return level estimate as a function of return period. The 95% confidence intervals for the return levels are shown as dashed lines. (b) Peak acceleration as a function of mean pacing rate of the pedestrian population and number of people on the bridge.
4.2.3 Setra (2006) model
With maximum pedestrian density of about 0.26 ped/m2 (for 80 people), the bridge is closest to Class III defined in French Setra guideline (Setra, 2006). For this class the multiplication factor for single person response is defined as
(10) ( )ς φ⋅ ⋅Ψ ⋅ = ⋅ ⋅ ⋅ ⋅ =∫010.8 ( ) / 10.8 1 0.0026 39.0 /104.0 0.21L
N x dx L N N
where Ψ is the factor related to risk of resonance, ς and N are the modal damping and total number of people on the bridge, while φ( )x and L are the mode shape and footbridge length, respectively. Setra guideline requires multiplying the stationary resonant response produced by a single person by this multiplication factor to get response to normal traffic. Single person force having amplitude of 280 N generates the maximum response of 0.93 m/s2. Therefore, for 80 people on the bridge the estimated
response would be ⋅ =0.21 80 0.93 1.75m/s2. However, if moving single person model producing 0.48 m/s2 peak acceleration is used, the predicted response would be 0.90 m/s2, which is in quite reasonable agreement with measured level of 0.79 m/s2.
4.2.4 Design spectrum approach
Based on Monte Carlo simulations of response of a ‘standard bridge’ to a ‘standard population of people’ design spectrum representing the peak response of the bridge in a single vibration mode as a function of natural frequency could be constructed (Ingolfsson et al. 2008; Georgakis and Ingolfsson 2008). The design spectra of this kind are similar to those used by the earthquake engineering community where peak modal response values are presented as a function of mode frequency for a specific input. The ‘square root sum of squares’ (SRSS) approach is used to sum the modes. To account for differences between a bridge to be designed and the ‘standard’ one used while constructing the design spectra some correction factors for different parameters are introduced. The differences between the parameters characterising the real and ‘standard’ populations are dealt with in a similar manner.
Response of Podgorica bridge to ‘standard population’ estimated using the appropriate spectrum is 0.25 m/s2. Taking the actual modal properties of the Podgorica bridge, and the fact that pedestrian population crossing the bridge walked at a mean pacing rate of 1.87 Hz, the correction factors related to bridge length, damping ratio, mode shape, modal mass, pedestrian arrival time, mean step frequency and return period for which calculation is being done (4.5 hours in this case) the peak response predicted for

10
average traffic of 14 people on the bridge would be 0.36 m/s2, while with maximum of 80 people on the bridge it would be 0.86 m/s2. These estimates are in good agreement with the experimental results.
The method described could be used for estimation of the response to various arrival times as well as different mean pacing rates in the population of pedestrians using the bridge. These are presented in Figure 6b is form of contour curves.
4.2.5 Scruton number
Newland (2004) suggested that the footbridge serviceability could be evaluated using an equivalent of the Scruton number (originally used in wind engineering), defined as:
(11) ς
=2
p
MS
m
where pS is pedestrian Scruton number, ς is modal damping ratio, M is bridge mass per unit length and m
is pedestrian mass per unit length. Higher value of structural damping and mass are beneficial, and they produce higher Scruton number. Increasing the number of people, however, reduces Scruton number. This is supposed to account for potential instability of the bridge under crowd, although the instability in the vertical direction does not seem very probable (Živanović et al., 2005b; Setra, 2006). Newland (2004) suggested that Scruton number should exceed a provisional value of 0.27 for footbridge to be stable under pedestrian load.
Scruton number was calculated for Podgorica bridge, which total mass is about 260 tonnes, assuming presence of maximum of 80 pedestrians (75 kg each) uniformly distributed across the bridge and value of 0.23 was obtained. This is below the provisional limit of 0.27 suggesting that the bridge is prone to vibration in the vertical direction (although this could not be related to instability phenomenon), which is in agreement with what was observed in practice.
4.2.6 Monte Carlo simulations
Using VSATs software (Živanović et al., 2008a; 2008b) Monte Carlo simulation for 4.5 hours of pedestrian traffic were conducted assuming the arrival time of 7 people per minute from either end of the bridge, a little above the experimentally observed total of 11 crossings per minute. Each pedestrian was modelled according to model defined in by Živanović et al. (2007). Distribution of amplitude of main harmonics of the walking force as well as pacing frequency was assumed to be normal. Taking into account modal properties of the relevant vibration mode, an overestimation of the response would be obtained (Živanović et al. 2005b). Since it seems that HSI occurs on this bridge when pedestrians feel perceptible vibrations in the form of dampening them out the new simulations of the bridge response with damping level increased from 0.26 to 0.6% were conducted. The result in form of distributions for peak acceleration per cycle is shown in Figure 5b (dashed line). It can be seen that the distribution is very close to the measured one (solid line in Figure 5b).
4.2.7 Brownjohn et al. (2004) model
This model defines the pedestrian loading in form of auto spectral density (ASD) that depends on probability distribution of pedestrian pacing rates. The ASD of the response could be obtained by multiplication of ASD for force, square of the frequency response function for the structure and the coherence function between pedestrians at different locations taking also into account the ordinate of the mode shape at position of each pedestrian. The square root of the response ASD gives estimate of the RMS response. Since currently there is no data about coherence available, it could be assumed that it is equal to zero. Assuming damping of 0.6% and that 38 people is present on the bridge, which was maximum in the test shown in Figure 5a, the
11
RMS response predicted is around 0.10 m/s2. The underestimation of the measured RMS value (Figure 5a) is expected, and could be corrected once the appropriate form of coherence function is available. Therefore the coherence function requires additional research and experimental quantification.
4.3 Discussion
The key parameters characterising normal pedestrian traffic are the arrival time (that influences the number of people on the bridge at any time, and therefore the pedestrian density) and probability distribution of their pacing frequencies. The only guideline that can cope with this traffic scenario and could give a quite reasonable estimate of the measured response is Setra (2006) guideline. However, it should be said that some improvisation in its implementation is required. Additionally, response obtained by a couple of other models, such as those defined by Brownjohn et al. (2004) and Georgakis and Ingolfsson (2008) are quite promising as well. This gives hope that some of these procedures will become part of design codes and will be used in footbridge design on daily basis. However, for this to happen verification of all these procedures on other footbridges is also required.
Finally, a question arises if the notion that the response to a (dynamically most efficient) single person could be used as prediction of the response to multi person traffic is a myth of reality. On Podgorica bridge it seems that this notion is quite realistic, since the maximum estimate to single person loading of 0.7 m/s2 (Figure 4b) is quite close to the peak response measured during monitoring time. However, to answer the question with confidence, more data from other bridges should be used for verification purpose.
5 GROUP LOADING
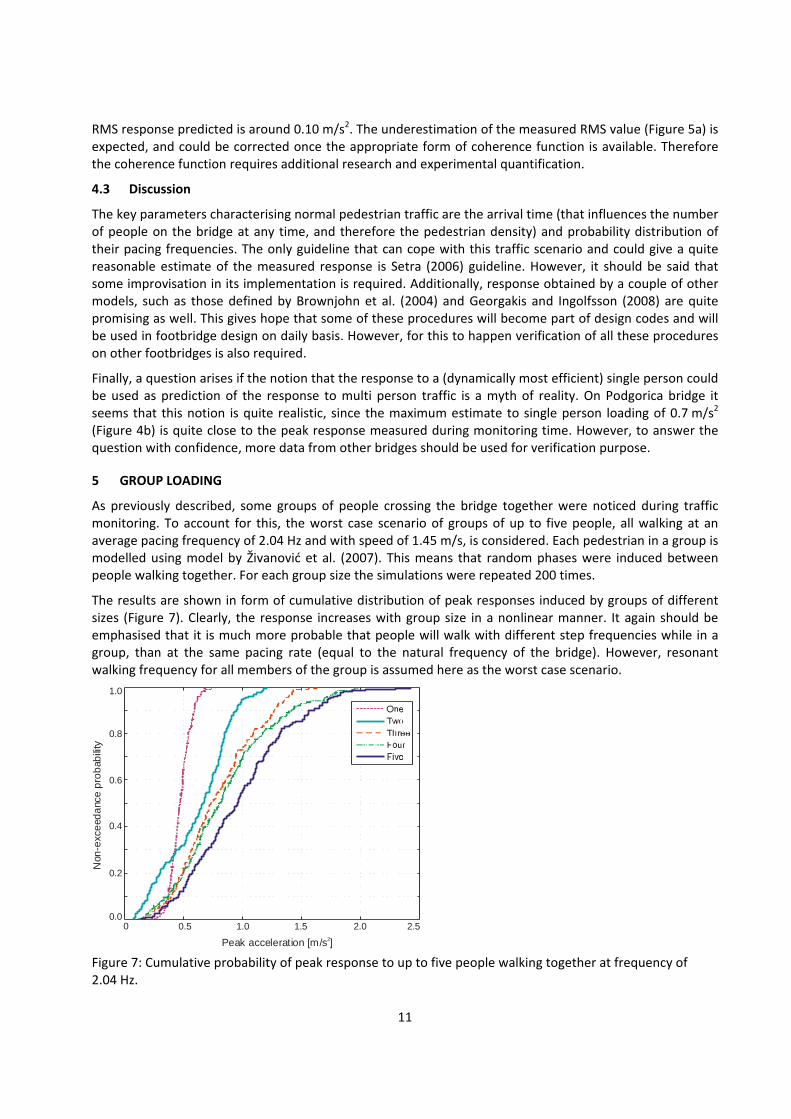
As previously described, some groups of people crossing the bridge together were noticed during traffic monitoring. To account for this, the worst case scenario of groups of up to five people, all walking at an average pacing frequency of 2.04 Hz and with speed of 1.45 m/s, is considered. Each pedestrian in a group is modelled using model by Živanović et al. (2007). This means that random phases were induced between people walking together. For each group size the simulations were repeated 200 times.
The results are shown in form of cumulative distribution of peak responses induced by groups of different sizes (Figure 7). Clearly, the response increases with group size in a nonlinear manner. It again should be emphasised that it is much more probable that people will walk with different step frequencies while in a group, than at the same pacing rate (equal to the natural frequency of the bridge). However, resonant walking frequency for all members of the group is assumed here as the worst case scenario.
1.0
0.8
0.6
0.4
0.2
0.0
Non
-exc
eeda
nce
prob
abilit
y
0 0.5 1.0 1.5 2.0 2.5
Peak acceleration [m/s ]2
Figure 7: Cumulative probability of peak response to up to five people walking together at frequency of 2.04 Hz.

12
6 RUNNING AND VANDAL LOADING
Running and jumping (or vandal loading) normally induce the dynamic forces that are much larger than those induced by walking. Typical frequencies for these activities are 1.9‐3.3 Hz for running and 1.3‐2.4 Hz for jumping (Bachmann, 2002). Therefore, there is a danger that some runners/jumpers could induce resonance in Podgorica bridge by matching its natural frequency of 2.04 Hz.
Differently from walking activity that is characterised by continuous contact with the ground, running and jumping activities are both composed of a contact and a flying phase in each step/jump. This is the reason that they are often modelled in a similar way. Bachamnn and Ammann (1987) suggested a half‐sine model for describing the contact phase while the force is zero during the flying phase:
(12) ( )π⎧ ≤
= ⎨< <⎩
sin / for ( )
0 for p c c
c
k W t t t tF t
t t T
where W is test subject’s weight, tc is contact time, T is the period of running/jumping activity and pk is
dynamic impact factor, which is a function of the ratio between contact time and period (so called contact ratio):
(13) ( / ) .2 /p c
c
k t Tt Tπ
=
This factor is calculated using energy preservation equation for flying phase and the impulse theorem for contact phase (Ellis and Ji, 1997; Occhiuzzi et al., 2008).
This model is one of rare models available for running/jumping activity, and will be used here for estimation of the response of Podgorica bridge. However, it is worth saying that Bachmann and Amman (1987) warned that this model could both over‐ and under‐estimate the force measured experimentally. This is probably partly due to inter‐ and intra‐subject variability, and partly due to oversimplification of the force description, which actually could differ significantly from a half‐sine shape.
6.1 Running on Podgorica bridge
It is assumed that a single runner, weighing 750 N, is crossing the bridge at frequency 2.04 Hz and with speed 2 m/s. The contact ratio is assumed to be 1/3. With these parameters the peak response of the bridge would be 1.82 m/s2. Clearly, two synchronised runners would induce twice this value; three will induce three times this value, and so on.
However, it is difficult to expect that, say two joggers will synchronise perfectly well, as well as that timing of either jogger will be impeccable so that force is repeated exactly with period T and with the same contact time throughout the crossing. If contact ratio for each leg contact with the bridge for either jogger is generated randomly from a Gaussian distribution having mean of 1/3 and coefficient of variation (COV) of 5%, and the period of the force is generated from Gaussian distribution with mean of 1/2.04 s with COV equal to 5%, then the response can vary hugely. The response to two joggers was calculated in 1000 runs to account for randomness of the parameters used. The envelopes of some responses (four of them emphasised just to represent the shape of the response envelopes) are shown in Figure 8a. Any peak response between 0.3 m/s2 and 3.3 m/s2 is feasible, but with different probability of occurrence, as shown in Figure 8b.

13
3.5
2.5
1.5
0.5
0.0
3.0
2.0
1.0
0 10 20 30 40 50 60Time [s]
Mod
al a
ccel
erat
ion
[m/s
]2
(a) 0 3.50.5 1.0 1.5 2.0 2.5 3.0
70
60
50
40
30
20
10
0
Freq
uenc
y of
occ
urre
nce
Modal acceleration [m/s ]2(b) Figure 8: (a) Envelopes for responses for 50 different simulations of two joggers. (b) Histogram of peak acceleration response generated by two runners.
6.2 Vandal loading on Podgorica bridge
Usually, several people jumping in unison are considered as vandal loading. Bachmann (2002) suggests that up to three people could synchronise their movement quite well, and therefore should be modelled as perfectly in phase with each other. Apart from jumping, bouncing should also be considered as possible vandal loading, especially in structures with natural frequencies above the range for normal jumping, say up to 4 Hz. For Podgorica bridge, the jumping load is relevant since a jumping at frequency of 2.04 Hz is quite comfortable.
For a single jumper weighing 850 N, and jumping at frequency of 2.04 Hz for 50 s, with contact ratio equal to 1/3 (Ellis and Ji, 1997), the peak response calculated is 4.1 m/s2. Two perfectly synchronised jumpers would induce 8.2 while four of them would induce 16.4 m/s2. These levels are quite high, dangerous and unrealistic. To support this claim, 1000 runs of simulation involving four people jumping, with each jump of each person having normally distributed contact ratio and period, this time with COV=10%, would produce time histories for some of which envelopes are presented in Figure 9a. Again, broad range of peak values was obtained, with their probability of occurrence shown in Figure 9b. An experiment with 4 people trying to jump in a synchronised manner produced the acceleration of about 2 m/s2, but they were ordered to stop jumping due to strong vibration of the footbridge.
8
6
4
2
00 10 20 30 40 50
Time [s](a) (b)
Mod
al a
ccel
erat
ion
[m/s
]2
1 2 3 4 5 6 7 8
70
60
50
40
30
20
10
0
Freq
uenc
y of
occ
urre
nce
Modal acceleration [m/s ]2
Figure 9: (a) Envelopes for responses for 50 different simulations of four jumpers. (b) Histogram of peak acceleration response generated by four jumpers.
6.3 Discussion
The guidance on footbridge design with regard to running and vandal loading is sparse and require further research. This especially applies to possibility of synchronisation during running and jumping in small groups, to the more realistic mathematical description of the loading, and to expected duration of vandal

14
excitation. Also, the correlation between changes in period, contact ratio and force amplitude with each step/jump could be investigated.
The numerical simulations shown in this paper are only an illustration how small (assumed) variation in contact ratio and period could influence the peak response. This is typical for bridges with small damping. This variation should experimentally be quantified before some design recommendations can be made.
7 CROWDS
Apart from normal pedestrian traffic with unrestricted pedestrian movement, possible scenarios are some medium crowd of density around 0.5 ped/s2 and quite dense crowds with density 1 ped/s2. The only design guideline able to cope with these loading scenarios is Setra (2006) guideline.
For the medium crowds of 156 people on the bridge at a time Setra (2006) predicts peak response of 1.26 m/s2 (using actual peak response to single person instead of recommended resonant response), while for density of 1 ped/m2, the predicted response would be 5.88 m/s2. On the other hand, the design spectrum model (Georgakis and Ingolfsson, 2008) would produce around 1.2 and 1.7 m/s2, respectively. While the estimates for medium crowd are similar, the ones for dense crowd are quite different. It seems that Setra estimate is heavily conservative in this case.
Finally, Monte Carlo simulations of medium and dense crowds were conducted using VSATs software (Živanović et al., 2008a; 2008b), and assuming an increased structural damping of 0.63%. The 45 minute long time domain response with 1s RMS trend, its spectrum and the distribution of peak response per vibration cycle are shown in Figure 10 for medium and in Figure 11 for dense crowds. It could be seen that the peak response estimates are around 1.64 and 2.48 m/s2, respectively. However, these are probably conservative estimates since it would be expected that the modal damping ratio is higher than assumed 0.63% due to increased number of people on the bridge and the human structure dynamic interaction.
8 CONCLUSIONS
Footbridge structures are likely to be exposed to various loading scenarios during their lifetime. It is recommended to conduct a risk analysis for occurrence of different loading scenarios depending on footbridge position, density of population in the area, alternative routes available, etc. Current design guidance how to model various loadings is limited, with the Setra (2006) guideline currently being the most advance one. However, certain degree of improvisation even when applying this guideline is required. Therefore, the current design codes should be used with caution, and should always be accompanied with calculations according to more advanced design procedures.
This paper analysed several possible loading scenarios on a box girder footbridge, and compared results from different numerical models available. While some advances are noticeable in modelling the crowd loading, it seems that there is still research work to be done for estimating of the response to vandal and running loading.
ACKNOWLEDGEMENTS
The author would like to thank to the financial support which came from the UK Engineering and Physical Sciences Research Council (EPSRC) for grant reference GR/T03000/01 (Stochastic Approach to Human‐Structure Dynamic Interaction).

15
Figure 10: The response estimate under medium crowd of people, with approximate density of 0.5 ped/m2.

16
Figure 11: The response estimate under dense crowd of people, with approximate density of 1 ped/m2.
REFERENCES
Bachmann, H. and Ammann, W. (1987). Vibrations in Structures Induced by Man and Machines IABSE ‐ AIPC ‐ IVBH, Zürich, Switzerland.
Bachmann, H. (2002) Lively footbridges ‐ a real challenge. In the Proceedings of the International Conference on the Design and Dynamic Behaviour of Footbridges, Paris, France, 20‐22 November.
Brownjohn, J. M. W., Pavic, A. and Omenzetter, P. (2004) A spectral density approach for modelling continuous vertical forces on pedestrian structures due to walking, Canadian Journal of Civil Engineering, 31 (1), 65‐77.
BSI (1978) Steel, concrete and composite bridges. Specification for loads, BS 5400: Part 2, British Standard Institution 1978; London.
Coles, S. (2001) An Introduction to Statistical Modeling of Extreme Values, Springer, London.
Dallard P, Fitzpatrick AJ, Flint A, Le Bourva S, Low A, Ridsdill‐Smith RM, Willford M. (2001) The London Millennium Footbridge. Structural Engineer, 79 (22), 17‐33.
EC (1997) Eurocode 5, Design of Timber Structures–Part 2: Bridges, ENV 1995‐2: 1997, European Committee for Standardization, Brussels, Belgium.
Ellis, B. R. and Ji, T. (1997) The response of structures to dynamic crowd loads. BRE Digest Report 426.
Georgakis, C. T. and Ingolfsson, E. T. (2008) Vertical footbridge vibrations: the response spectrum methodology, In Proceedings of the 3rd International Conference Footbridge 2008, Porto, 2‐4 July.
17
Ingolfsson, E. T., Georgakis, C. T. and Svendsen, M. N. (2008) Vertical footbridge vibrations: details regarding experimental validation of the response spectrum methodology, In Proceedings of the 3rd International Conference Footbridge 2008, Porto, 2‐4 July.
Inman, D. J. (2001) Engineering Vibration, Prentice Hall 2001, Upper Saddle River, New Jersey.
Kerr, S. C. (1998) Human induced loading on staircases, PhD Thesis, University College London, Mechanical Engineering Department, UK.
Matsumoto Y, Nishioka T, Shiojiri H, Matsuzaki K. (1978) Dynamic design of footbridges. IABSE Proceedings 1978, No. P‐17/78, 1‐15.
McRobie, A. & Morgenthal, G. (2002). Risk Management for Pedestrian‐Induced Dynamic of Footbridges, in the 1st International Conference Footbridge 2002on the Design and Dynamic Behaviour of Footbridges, Paris, 20‐22 November.
Newland, D. E. (2004) Pedestrian excitation of bridges. Journal of Mechanical Engineering Science; 218 (5), 477‐492.
Occhiuzzi, A., Spizzuoco, M. and Ricciardelli, F. (2008) Loading models and response control of footbridges excited by running pedestrians. Structural Control and Health Monitoring, 15 (3), 349‐368.
OHBDC (1983) Ontario Highway Bridge Design Code. Highway Engineering Division; Ministry of Transportation and Communication, Ontario, Canada.
Pachi, A. and Ji, T. (2005) Frequency and velocity of people walking. The Structural Engineer 2005; 83 (3), 46‐40.
Sahnaci, C. and Kasperski, M. (2005) Random loads induced by walking, in Sixth European Conference on Structural Dynamics (EURODYN), Millpress, Rotterdam, Paris, pp. 441‐446.
Setra (2006) Guide méthodologique passerelles piétonnes. Setra.Service d’etudes techniques des routes et autoroutes, Paris.
Wheeler, J. E. (1982) Prediction and control of pedestrian induced vibration in footbridges. Journal of the Structural Division ASCE, 108 (ST9), 2045‐2065.
Živanović, S., Pavic, A. and Reynolds, P. (2005a). Vibration serviceability of footbridges under human‐induced excitation: a literature review. Journal of Sound and Vibration, 279 (1‐2), 1‐74.
Živanović, S., Pavic, A., Reynolds, P. and Vujović, P. (2005b) Dynamic analysis of lively footbridge under everyday pedestrian traffic, Sixth European Conference on Structural Dynamics, Vol. 1, pp. 453‐459, Paris, France, 4‐7 September.
Živanović, S., Pavic, A. and Reynolds, P. (2006) Modal testing and finite element model tuning of Podgorica footbridge. Engineering Structures, 28, 857‐868.
Živanović, S., Pavic, A. and Reynolds, P. (2007) Probability‐based prediction of multi‐mode vibration response to walking excitation, Engineering Structures, 29 (6), 942‐954.
Živanović, S., Pavic, A. and Brownjohn, J. M. W. (2008a) Vibration serviceability assessment of slender structures using VSATs software. 26th International Modal Analysis Conference (IMAC XXVI), Orlando, Florida, USA, 4‐7 February.
Živanović, S., Pavic, A. and Brownjohn, J. M. W. (2008b) Vibration serviceability assessment of footbridges using VSATs software, in Proceedings of the 7th European Conference on Structural Dynamics EURODYN 2008, Southampton, 7‐9 July.
Živanović, S., Brownjohn, J. M. W. and Pavic, A. (2008c) Vibration performance of footbridges under pedestrian traffic, in Proceedings of the 3rd International Conference Footbridge 2008, Porto, 2‐4 July.