Large scale shearography inspection of the Space Shuttle ...
Vibration Excitation Methods Applied to Digital Shearography and ESPI
Dirk Findeis, Jasson Gryzagoridis and Leovigildo Mahon Gerona Department of Mechanical Engineering
University of Cape Town, Private Bag, Rondebosch, 7700 South Africa
Phone: +27 21 650 3670 Fax: +27 21 650 3240
E-mail: [email protected]
Abstract Digital Shearography (DS) and Electronic Speckle Pattern Interferometry (ESPI) are laser based optical interference techniques used amongst other to inspect materials and manufactured components for defects. DS captures the rate of surface displacement and ESPI the displacement of an object in response to an applied stress. There are a number of ways to stress the object during the inspection process, the most common being the use of thermal heating or vacuum and pressure chambers. These forms cause whole field object responses, which generate the equivalent fringe patterns. Within these fringe patterns fringe anomalies revealing the presence of a defect are sometimes masked due to the object’s whole field displacement. As an alternative stressing technique, this paper investigates the use of vibration excitation methods. The intention with this approach is that the friction produced in an object’s defect area generates localised thermal gradients which in turn should be revealed in the produced fringe pattern. This paper describes the above mentioned inspection techniques and examines the results obtained using Digital Shearography and ESPI when applied to selected samples. In particular the results obtained using vibration excitation are compared with results obtained using thermal stressing techniques, which ultimately attempts to determine the suitability of vibration excitation methods to inspect objects for defects. Introduction Composite materials are nowadays used in many different applications and products. When used in critical applications, such as the space and aircraft industry, the integrity of the manufactured components has to be verified at regular intervals. Non destructive testing techniques are commonly used for this purpose and include dye penetrants, X-Ray, Ultrasound, Eddy Current and Optical Inspection methods [1]. Two inspection techniques which fall into the category of Optical Non Destructive Testing techniques are Digital Shearography (DS) and Electronic Speckle Pattern Interferometry (ESPI). It has been shown that these techniques are particularly suited for the inspection of Carbon and Fibreglass based composite for defects, the likes of which include delaminations, debonds and cracks [2]. Theory Digital Shearography is an optical interference technique and is based on the recording of speckle images, created when two light waves interfere with one another. In order for this to occur, the light waves have to be monochromatic, which is why single mode lasers are employed to illuminate the object being inspected. A video camera is used to view the object through a shearing device. The shearing device is often a proprietary design, but a conventional Michelson Interferometer, as indicated in Figure 1 below, can be used to illustrate the process. The laser light reflected off the object is split into two by the beamsplitter and directed onto mirrors M1 and M2. By tilting mirror M1 either horizontally or vertically, the reflected images can be misaligned, or sheared with respect to each other when recombined at the beamsplitter surface. The video lens then focuses the sheared image onto the CCD. At the CCD plane the recombined lightwaves interfere with each other and produce a speckle pattern which can be captured and digitized using a PC.
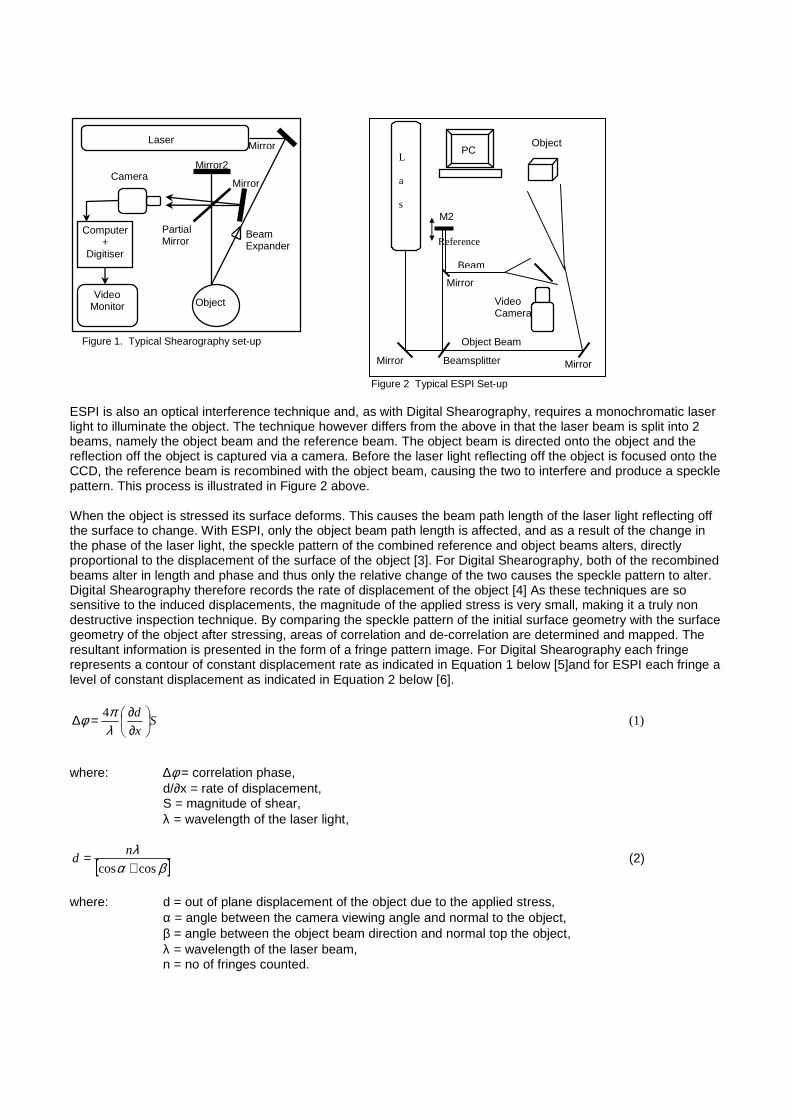
ESPI is also an optical interference technique and, as with Digital Shearography, requires a monochromatic laser light to illuminate the object. The technique however differs from the above in that the laser beam is split into 2 beams, namely the object beam and the reference beam. The object beam is directed onto the object and the reflection off the object is captured via a camera. Before the laser light reflecting off the object is focused onto the CCD, the reference beam is recombined with the object beam, causing the two to interfere and produce a speckle pattern. This process is illustrated in Figure 2 above. When the object is stressed its surface deforms. This causes the beam path length of the laser light reflecting off the surface to change. With ESPI, only the object beam path length is affected, and as a result of the change in the phase of the laser light, the speckle pattern of the combined reference and object beams alters, directly proportional to the displacement of the surface of the object [3]. For Digital Shearography, both of the recombined beams alter in length and phase and thus only the relative change of the two causes the speckle pattern to alter. Digital Shearography therefore records the rate of displacement of the object [4] As these techniques are so sensitive to the induced displacements, the magnitude of the applied stress is very small, making it a truly non destructive inspection technique. By comparing the speckle pattern of the initial surface geometry with the surface geometry of the object after stressing, areas of correlation and de-correlation are determined and mapped. The resultant information is presented in the form of a fringe pattern image. For Digital Shearography each fringe represents a contour of constant displacement rate as indicated in Equation 1 below [5]and for ESPI each fringe a level of constant displacement as indicated in Equation 2 below [6].
Sx
d
∂∂=∆
λπφ 4 (1)
where: ∆φ = correlation phase, d/∂x = rate of displacement, S = magnitude of shear,
λ = wavelength of the laser light,
[ ]βαλcoscos +
= nd (2)
where: d = out of plane displacement of the object due to the applied stress,
α = angle between the camera viewing angle and normal to the object, β = angle between the object beam direction and normal top the object, λ = wavelength of the laser beam, n = no of fringes counted.
Figure 1. Typical Shearography set-up
Camera
Video Monitor
Computer +
Digitiser
Mirror2
Laser
Mirror
Partial Mirror
Object
Beam Expander
Mirror Object
Video Camera
L
a
s
Mirror
M2
Object Beam
Beamsplitter
Reference
Beam
Mirror
Mirror
PC
Figure 2 Typical ESPI Set-up

There are many ways to stress an object. Typical methods used are based on pressure, thermal or mechanical applications. Another method which can be used is vibratory excitation. With this method the vibratory energy is coupled and transferred to the object and converted to thermal energy due to frictional effects at the location of a defect. The thermal coefficient of expansion of the material in turn causes the object to deform in the region of the defect and thus produce a displacement field which can be captured. As described above, ESPI and Digital Shearography produce intensity based fringe patterns. In order to determine the object’s displacement or rate of displacement, the modulation of the laser phase due to the applied stress needs to be determined as well. This can be achieved using a technique called phase stepping. With this technique, the phase of one of the interfering wavefronts is altered by predetermined amounts during the image capturing stage. For Digital Shearography this would be achieved by moving Mirror2 in Figure 1 and for ESPI, by moving mirror M2 in Figure 2. For a 4 image configuration, the beam path length is increased by a quarter of a wavelength (π/2) between each of four images captured before and again after the object has been stressed. The intensities of the images can be represented in equation 4 as follows [7].
( ) ( ) ( ) ( )( )2/,cos,,, πθ ⋅++= iyxyxIyxIyxI MPBi (3)
( ) ( ) ( )( ) ( )
−−
=yxIyxI
yxIyxIyx
,,
,,arctan,
24
13φ (4)
( ) ( ) ( )yxyxyx ba ,,, φφβ −= (5)
where i = 1,2,3,4 φa(x,y) = phase distribution after stressing,
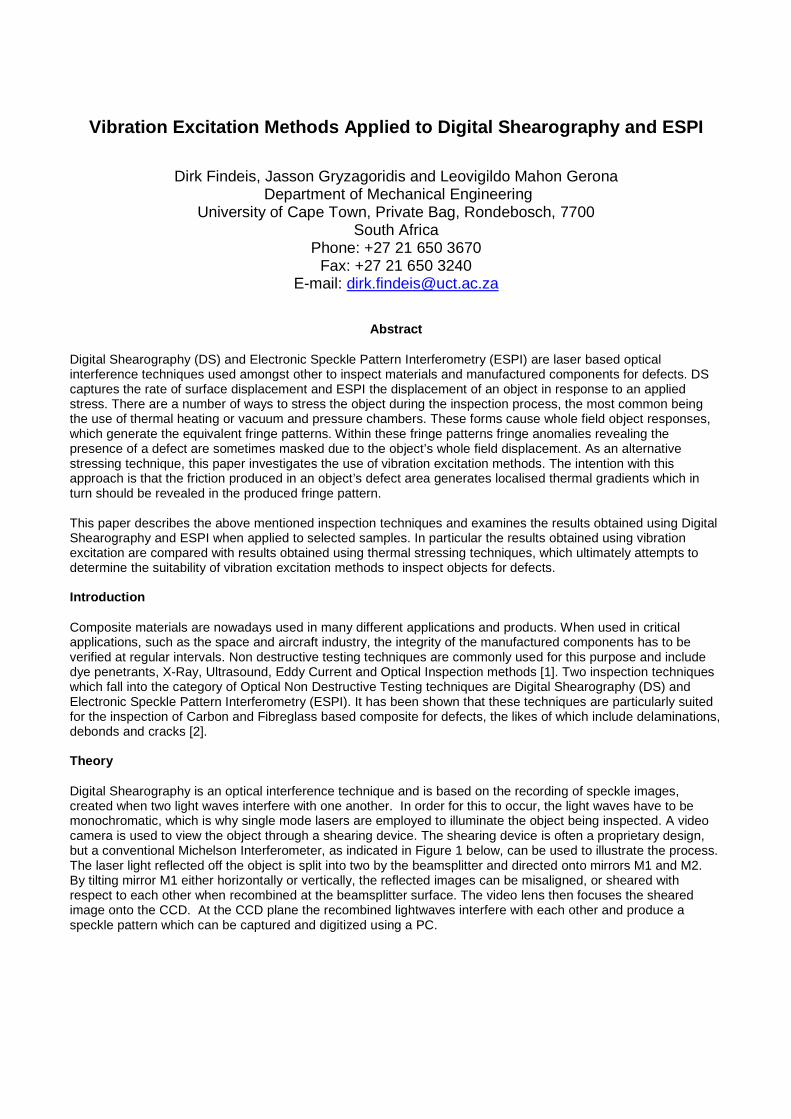
φb(x,y) = phase distribution before stressing In order to apply ESPI using UCT’s purpose built Digital Shearography system, a modified form of the ESPI configuration was employed. With the modified configuration, the laser light emitted by the unit is directed onto the object to be illuminated as well as a flat plate, placed next to the object to be inspected. The adjustable mirror in the shearing configuration is then tilted such that the illuminated plate overlaps the object when the two images reflected off the two mirrors in the shearing device are recombined in the camera CCD plane. In this way the beam path of the shearing device acts as the object beam and the second beam path acts as the reference beam. When the object is then stressed, the beam path length from the laser to the object surface and then to the CCD plane changes, but the beam path length from the laser to the plate and then to the CCD plane doesn’t. The change in phase and speckle pattern is due to the change in the object surface only and the fringe patterns produced depict the magnitude of the object surface displacement. This applies to both the intensity based fringe pattern as well as the Phase stepped fringe pattern. Results In order to investigate the use of vibration excitation for the NDT of composite materials an electro-magnetic vibration generator, manufactured by Frederiksen was purchased. The unit had a limiting current of 1A and could operate at frequencies ranging from 0.1 Hz to 5 kHz. The unit was connected to a function generator in order to control the frequency of the sine wave output, as well as the amplitude of the signal. Three samples were prepared for this investigation. The first was a section cut from a composite helicopter rotor blade which consisted of a shaped Nomex honeycomb core of varying thickness, covered with carbon fiber skins. The section was prepared with 9 external round defects all applied on the surface facing away from the viewing side. i.e. invisible to the naked eye from the inspection side. The second prepared sample was a 20mm thick sandwich honeycomb consisting of a Nomex core and carbon fiber inner and outer skin. In this sample 4 holes were drilled, all to a depth of 5mm, but with different diameters varying from 5 mm to 20mm. With this sample it was intended to determine whether the size of a defect had an influence on the fringe density when using vibration excitation methods. The third sample was again prepared from a section of the helicopter rotor blade. For this test, the outer skin was removed and three internal debonds created. This was achieved by fixing three square brass plates onto the inside of the removed skin and then rebonding the skin onto the Nomex core. The three samples can be seen in Figure 3 below.

Figure 3. Composite test samples All inspections were carried out on the laboratory vibration isolation table, using a Helium Neon laser and a selection of optics, as shown in Figure 4 below. The samples were placed on the table and clamped where needed. The vibration generator was positioned such that the probe tip was placed in contact with the object surface. The base plate was then weighted down to prevent shifting of the generator. For thermal heating, an infrared lamp placed sufficiently far from the test piece and connected to a timer was used to stress the samples. A typical application of both methods of stressing can be seen in Figure 5 below.
Figure 4. Laboratory inspection setup
Figure 5. Vibration generator and heating lamp applied to inspection samples.
The first sample to be inspected was the 9 hole helicopter section sample. As a reference image, a separate inspection of the test piece was made by using thermal heating for 5 seconds during the inspection process. The result of this inspection using Digital Shearography is depicted in Figure 6 below. The results clearly reveal the location of the defects via the familiar double bulls-eye or butterfly fringe pattern. Three of the locations are not clearly seen due to the magnitude of the applied shear, but their presence is clearly visible. The variation in fringe density also indicates the severity of the defect, as all man-made defects were not the same. In addition the sample was exposed to vibratory excitation along the length of the section as well as perpendicular to the section. Both directions yielded results and it was thus decided to focus on the perpendicular direction only, as depicted in Figure 4 above. The results of the Digital Shearography based inspection is depicted in Figure 7 below. From simple observation it is clear that the use of a vibration generator also reveals the presence of all 9 defects. It must be noted that the application of the vibratory energy was in the order of 5 minutes and the results were captured only after the generator had been switched off, i.e. during the cooling process. The vertical fringes covering the whole sample in Figure 6 also shows a displacement gradient across the whole helicopter section. This phenomenon cannot be seen in the result in Figure 7, which indicates a uniform energy distribution within the bulk of the sample which is intact. It is only the cross-section anomalies, namely the defects, which reveal a variation in energy levels and thus displacement gradients.
Figure 6. Digital Shearography result using thermal stressing
Figure 7. Digital Shearography result using vibratory stressing
.
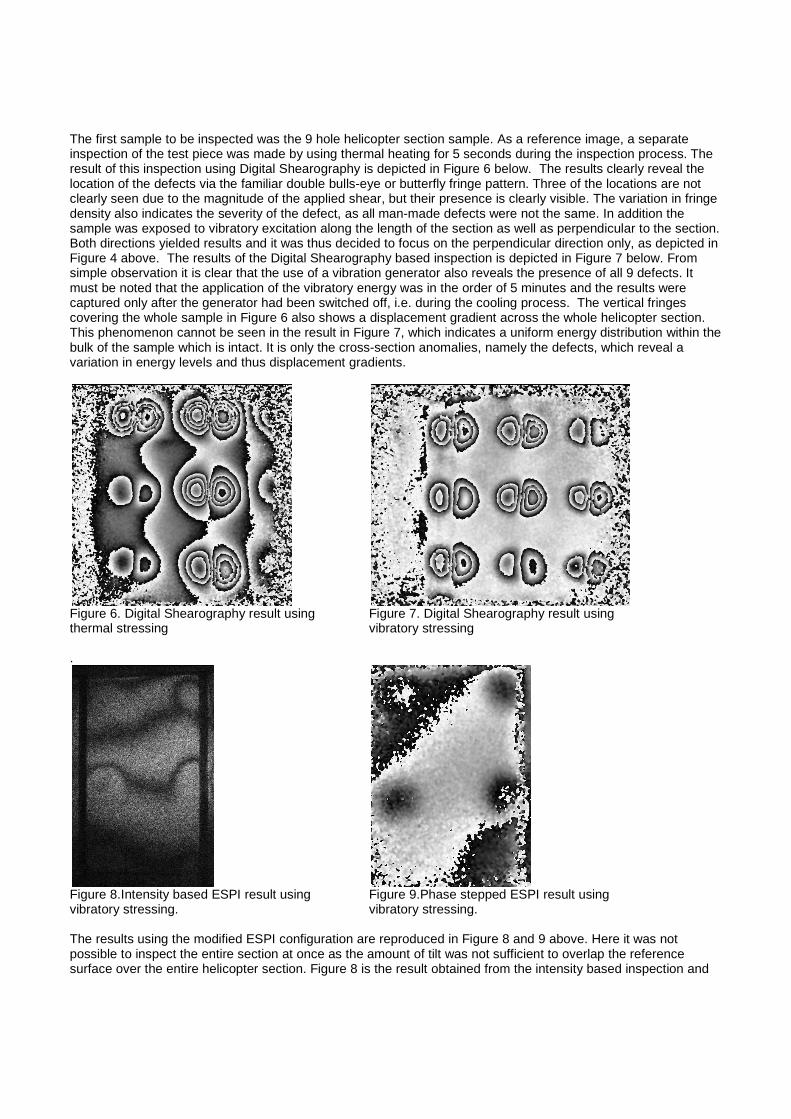
Figure 8.Intensity based ESPI result using vibratory stressing.
Figure 9.Phase stepped ESPI result using vibratory stressing.
The results using the modified ESPI configuration are reproduced in Figure 8 and 9 above. Here it was not possible to inspect the entire section at once as the amount of tilt was not sufficient to overlap the reference surface over the entire helicopter section. Figure 8 is the result obtained from the intensity based inspection and
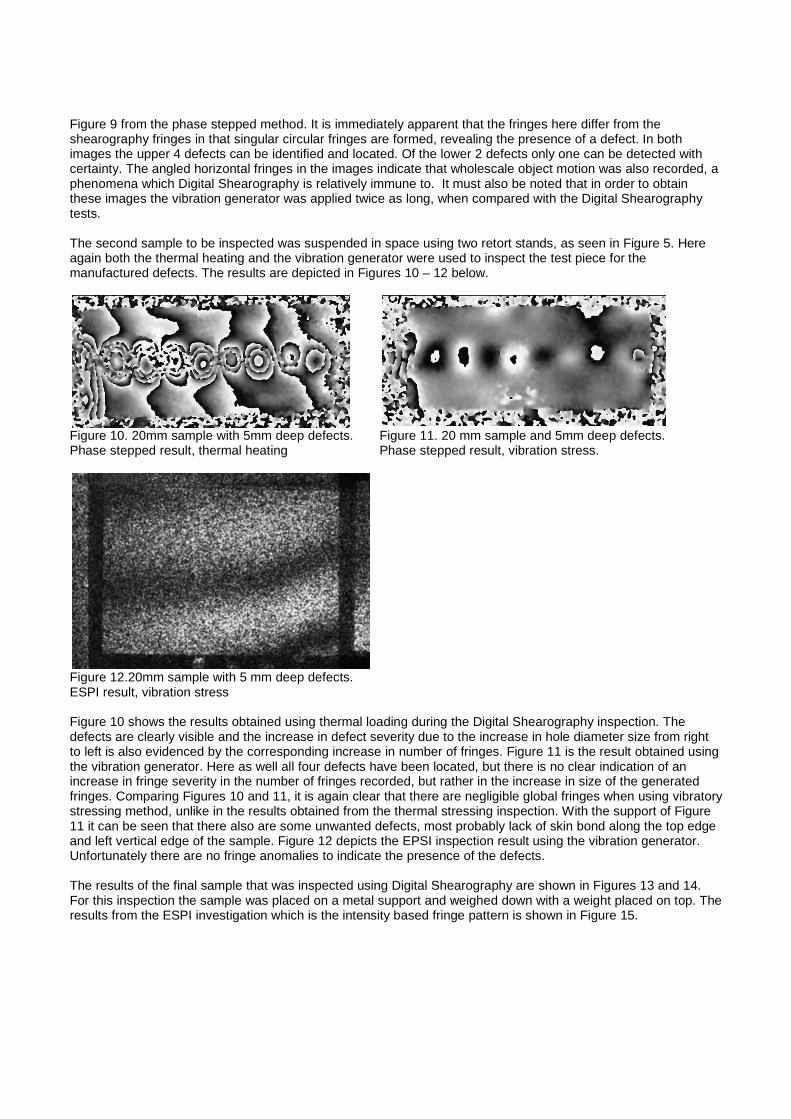
Figure 9 from the phase stepped method. It is immediately apparent that the fringes here differ from the shearography fringes in that singular circular fringes are formed, revealing the presence of a defect. In both images the upper 4 defects can be identified and located. Of the lower 2 defects only one can be detected with certainty. The angled horizontal fringes in the images indicate that wholescale object motion was also recorded, a phenomena which Digital Shearography is relatively immune to. It must also be noted that in order to obtain these images the vibration generator was applied twice as long, when compared with the Digital Shearography tests. The second sample to be inspected was suspended in space using two retort stands, as seen in Figure 5. Here again both the thermal heating and the vibration generator were used to inspect the test piece for the manufactured defects. The results are depicted in Figures 10 – 12 below.
Figure 10. 20mm sample with 5mm deep defects. Phase stepped result, thermal heating
Figure 11. 20 mm sample and 5mm deep defects. Phase stepped result, vibration stress.
Figure 12.20mm sample with 5 mm deep defects. ESPI result, vibration stress Figure 10 shows the results obtained using thermal loading during the Digital Shearography inspection. The defects are clearly visible and the increase in defect severity due to the increase in hole diameter size from right to left is also evidenced by the corresponding increase in number of fringes. Figure 11 is the result obtained using the vibration generator. Here as well all four defects have been located, but there is no clear indication of an increase in fringe severity in the number of fringes recorded, but rather in the increase in size of the generated fringes. Comparing Figures 10 and 11, it is again clear that there are negligible global fringes when using vibratory stressing method, unlike in the results obtained from the thermal stressing inspection. With the support of Figure 11 it can be seen that there also are some unwanted defects, most probably lack of skin bond along the top edge and left vertical edge of the sample. Figure 12 depicts the EPSI inspection result using the vibration generator. Unfortunately there are no fringe anomalies to indicate the presence of the defects. The results of the final sample that was inspected using Digital Shearography are shown in Figures 13 and 14. For this inspection the sample was placed on a metal support and weighed down with a weight placed on top. The results from the ESPI investigation which is the intensity based fringe pattern is shown in Figure 15.
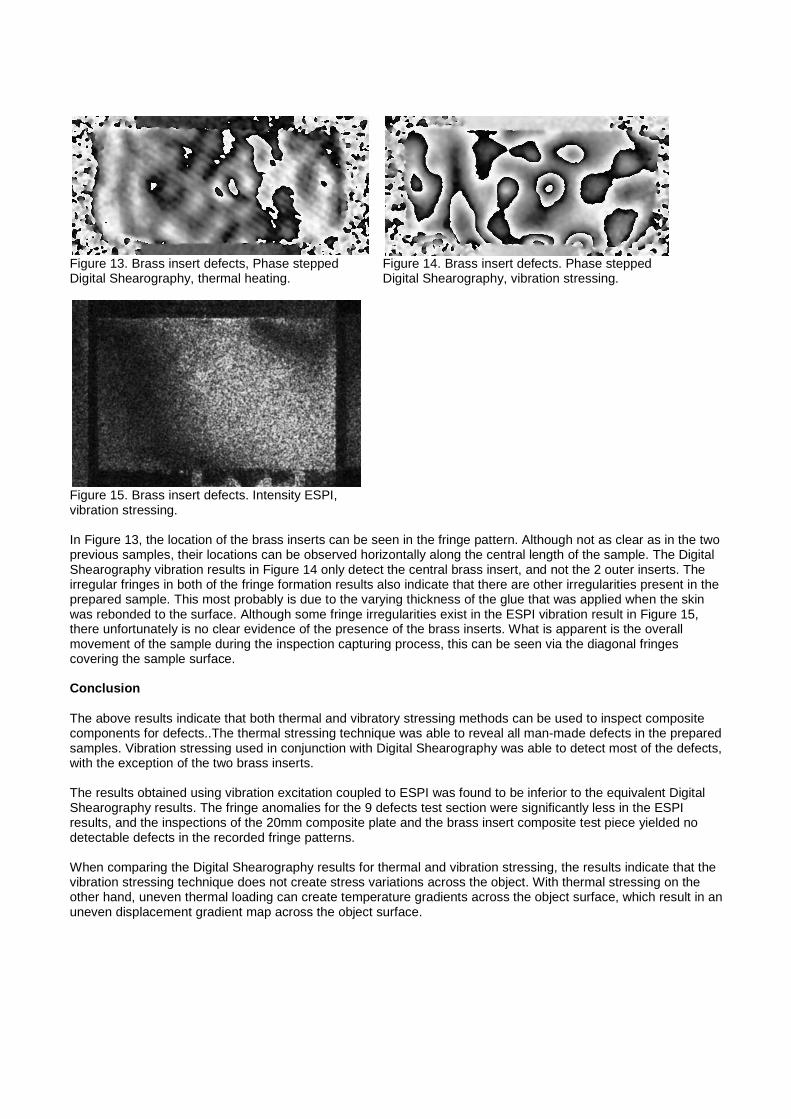
Figure 13. Brass insert defects, Phase stepped Digital Shearography, thermal heating.
Figure 14. Brass insert defects. Phase stepped Digital Shearography, vibration stressing.
Figure 15. Brass insert defects. Intensity ESPI, vibration stressing. In Figure 13, the location of the brass inserts can be seen in the fringe pattern. Although not as clear as in the two previous samples, their locations can be observed horizontally along the central length of the sample. The Digital Shearography vibration results in Figure 14 only detect the central brass insert, and not the 2 outer inserts. The irregular fringes in both of the fringe formation results also indicate that there are other irregularities present in the prepared sample. This most probably is due to the varying thickness of the glue that was applied when the skin was rebonded to the surface. Although some fringe irregularities exist in the ESPI vibration result in Figure 15, there unfortunately is no clear evidence of the presence of the brass inserts. What is apparent is the overall movement of the sample during the inspection capturing process, this can be seen via the diagonal fringes covering the sample surface. Conclusion The above results indicate that both thermal and vibratory stressing methods can be used to inspect composite components for defects..The thermal stressing technique was able to reveal all man-made defects in the prepared samples. Vibration stressing used in conjunction with Digital Shearography was able to detect most of the defects, with the exception of the two brass inserts. The results obtained using vibration excitation coupled to ESPI was found to be inferior to the equivalent Digital Shearography results. The fringe anomalies for the 9 defects test section were significantly less in the ESPI results, and the inspections of the 20mm composite plate and the brass insert composite test piece yielded no detectable defects in the recorded fringe patterns. When comparing the Digital Shearography results for thermal and vibration stressing, the results indicate that the vibration stressing technique does not create stress variations across the object. With thermal stressing on the other hand, uneven thermal loading can create temperature gradients across the object surface, which result in an uneven displacement gradient map across the object surface.
References
1. Stanley R K, Moore P O, Mcintire P, Nondestructive Testing Handbook, 2nd Ed, American Society for Nondestructive Testing,1995.
2. Moser E, ”Shearography NDT of Aerospace Structures”, Proc DGZfP International Symposium on NDT in
Aerospace, Dec 3-5,Fuerth, Germany, p 174, 2008.
3. Claud G, Optical Methods in Experimental Mechanics, Part 8, Experimental Techniques, Sept/Oct 2003,pp 15-18, 2003.
4. Hung YY, ”Shearography: a new optical method for strain measurement and non-destructive testing”, Opt. Eng. 21 (3), pp 391-395, 1982.
5. Venkatraman B, Jayakumar T, Kalyanasundaram, P, and Raj, B, “NDE Methodologies for Examination of
Tail Rotor Blades of Helicopters,” Proc.15th World Conference on Non-Destructive Testing, Roma 15-21 October,2000.
6. Jones R, Wykes C, Holographic and Speckle Interferometry, 2nd Ed. Cambridge University Press, 1989.
7. Findeis D, Gryzagoridis J, Matlali M, “Phase Stepping Shearography and Electronic Speckle Pattern Interferometry”, Proceedings 3rd US-Japan Symposium on Advancing Capabilities and Applications in NDE, Maui, 20-24 June. 2005.