VIBRATION CONTROL REPORT CLEANROOM PHYSICS AND …homepages.spa.umn.edu/~crowell/Vibration...
20
VIBRATION CONTROL REPORT CLEANROOM PHYSICS AND NANOTECHNOLOGY BUILDING UNIVERSITY OF MINNESOTA MINNEAPOLIS, MINNESOTA ESI Project 1721 November 15, 2011 (Rev. 2) Prepared for: Ms. Ellen Olson, AIA Architectural Alliance 400 Clifton Avenue South Minneapolis, MN 55403-3299 Tel: D. 612-874-4135 Prepared by Barry Whiteaker, P.E. ESI ENGINEERING, INC. 7831 Glenroy Road, Suite 430 Minneapolis, Minnesota 55439 Tel (952) 831-4646 Fax (952) 831-6897 esi-engineering.com
Transcript of VIBRATION CONTROL REPORT CLEANROOM PHYSICS AND …homepages.spa.umn.edu/~crowell/Vibration...
VIBRATION CONTROL REPORT CLEANROOM PHYSICS AND NANOTECHNOLOGY BUILDING
UNIVERSITY OF MINNESOTA MINNEAPOLIS, MINNESOTA
ESI Project 1721
November 15, 2011 (Rev. 2)
Prepared for: Ms. Ellen Olson, AIA
Architectural Alliance 400 Clifton Avenue South
Minneapolis, MN 55403-3299 Tel: D. 612-874-4135
Prepared by Barry Whiteaker, P.E.
ESI ENGINEERING, INC. 7831 Glenroy Road, Suite 430 Minneapolis, Minnesota 55439
Tel (952) 831-4646 Fax (952) 831-6897
esi-engineering.com

Physics & Nanotechnology Building – University of Minnesota 1-1
VIBRATION CONTROL REPORT PHYSIC AND NANOTECHNOLOGY BUILDING
UNIVERSITY OF MINNESOTA MINNEAPOLIS, MINNESOTA
ESI Engineering, Inc.
1 INTRODUCTION
A new Physics and Nanotechnology Building at the Minneapolis campus of the University of Minnesota, is currently being designed. The new facility has been on the U’s wish list for many years and has finally emerged as a project with a high priority. This is due in part to the increased interest in nanotechnology. Research in this area is on the cutting edge of science and promises to be an important part of our future.
Figure 11. View of the Physics and Nanotechnology building from the southwest.
Nanotechnology depends on working at higher and higher resolutions with equipment that deals with ever smaller particles and components. Vibration at even very low levels is an important aspect in the design of this facility.
A key component of the new building is a cleanroom that will be used for nanotechnology research. Some of this research is currently being done in the Semiconductor facility in the Electrical Engineering Building located southwest of the new building.
The cleanroom is roughly 60’ x 90’ and is near grade level on the west side of the building. There is no basement under this portion of the building. There is, however a basement under the remainder of the building located east of the cleanroom area.
There are many causes of vibration in a building including movement of people and equipment inside the facility, and mechanical HVAC equipment. Outside sources must also be considered. This building has traffic on streets adjacent to the site and from a new Light Rail Transit (LRT) line that is under construction, just one block away, on Washington Avenue.

Physics & Nanotechnology Building – University of Minnesota 2-1
2 VIBRATION DESIGN GOAL
The vibration design goal for the cleanroom floor has been discussed many times during the early phases of this project. These discussions have also dealt with the site-related and budgetary constraints of the project. It is our understanding that some but not all of the research planned for this facility is very sensitive to vibrations VC-E, the lowest curve shown in Figure 2-1. This curve in terms of velocity is a straight line at 125 μ-inches/sec from 1 Hz to 80 Hz. The VC-E criterion is recognized as being difficult to achieve, and is at a level that can be easily exceeded by a variety of transient and steady state disturbances, some of which may be impossible to identify and/or control. This is especially true in a highly developed, dense urban environment such as exists on the Minneapolis campus.
For comparison the vibration used for hospital OR’s is at 4000 μ-inches/sec which is near the limit of human perception for most people.
Some of the research in the cleanroom could be done at a vibration level of VC-D which is a straight line at 250 μ-inches/sec shown just above VC-E in the Figure.
1253
100
1000
10000
100000
1 10 100
One-Third Octave Band Center Frequency, Hz.
Vel
oci
ty,
mic
ro-i
n/s
ec r
ms
40
50
60
70
80
90
100
Ve
loci
ty,
dB
re
mic
ro-i
n/s
ec
OFFICE (ISO)
RESIDENCES, DAY (ISO)
OP ROOMS (ISO), MICROSCOPES TO 100X
VC-A, MICROSCOPES TO 400X
VC-B: MICRO-SURGERY, MICROSCOPES > 400X
SLEEP AREAS (ISO)
ISO BASE CURVE(~PERCEPTION LIMIT)
VC-C: Inspection and lithography equipment to 1 detail
VC-D: Electron microscopes and E-Beam systems
VC-E: Difficult to achieve - long path, laser based, small target systems
Figure 21. Vibration criteria curves.

Physics & Nanotechnology Building – University of Minnesota 3-1
3 MEASURED VIBRATION LEVELS
Vibration tests for the new facility were conducted on December 20, 2010. The purpose of these tests was to determine the current vibration levels at the site.
3.1 Building location
The new building will be located one block north of Washington Avenue, north of the Washington Avenue Parking Ramp and West of Harvard Street S E as shown in Figure 3-1. The portion of Union Street SE at the site is being abandoned and Akerman Hall is to the west.
Four points were chosen for the accelerometer locations, one at each corner of the building. The results of the tests show that the lowest vibration levels are on the west side of the site, where the cleanroom will be located. The lowest levels measured are on the north end of the cleanroom at Point 3.
This data shows the current ground vibration at the site. Changes in traffic have already occurred due to construction of the Central Corridor LRT. Changes will occur in the future as the campus grows and the LRT becomes operational. While the LRT is a concern, the designers of the system are using an isolated floating bed and they predict that the resulting vibrations caused by normal operations of the LRT will be at or below the levels currently caused by buses and trucks on Washington Avenue. Since the new building is one block away, vibration levels will be lower than those adjacent to the LRT.
Figure 31. Site Plan with test locations. Harvard St. (curved road) was in place at time of tests.
Physics & Nanotechnology Building – University of Minnesota 3-2
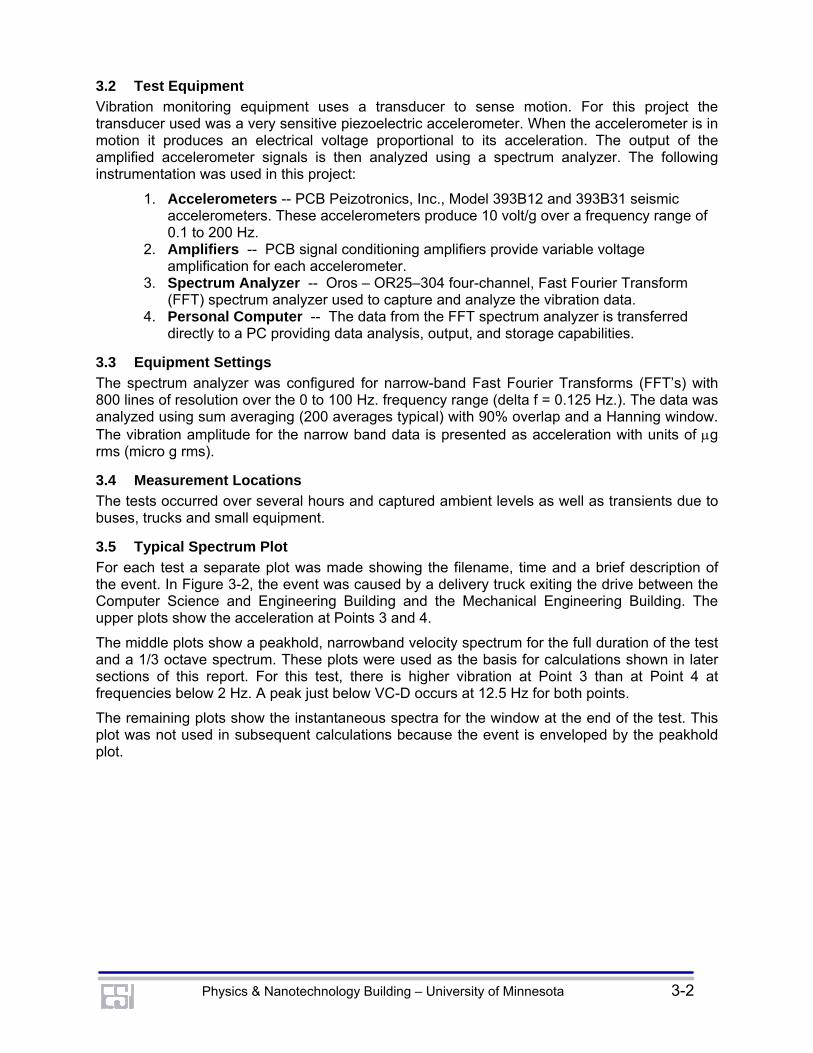
3.2 Test Equipment
Vibration monitoring equipment uses a transducer to sense motion. For this project the transducer used was a very sensitive piezoelectric accelerometer. When the accelerometer is in motion it produces an electrical voltage proportional to its acceleration. The output of the amplified accelerometer signals is then analyzed using a spectrum analyzer. The following instrumentation was used in this project:
1. Accelerometers -- PCB Peizotronics, Inc., Model 393B12 and 393B31 seismic accelerometers. These accelerometers produce 10 volt/g over a frequency range of 0.1 to 200 Hz.
2. Amplifiers -- PCB signal conditioning amplifiers provide variable voltage amplification for each accelerometer.
3. Spectrum Analyzer -- Oros – OR25–304 four-channel, Fast Fourier Transform (FFT) spectrum analyzer used to capture and analyze the vibration data.
4. Personal Computer -- The data from the FFT spectrum analyzer is transferred directly to a PC providing data analysis, output, and storage capabilities.
3.3 Equipment Settings
The spectrum analyzer was configured for narrow-band Fast Fourier Transforms (FFT’s) with 800 lines of resolution over the 0 to 100 Hz. frequency range (delta f = 0.125 Hz.). The data was analyzed using sum averaging (200 averages typical) with 90% overlap and a Hanning window. The vibration amplitude for the narrow band data is presented as acceleration with units of g rms (micro g rms).
3.4 Measurement Locations
The tests occurred over several hours and captured ambient levels as well as transients due to buses, trucks and small equipment.
3.5 Typical Spectrum Plot
For each test a separate plot was made showing the filename, time and a brief description of the event. In Figure 3-2, the event was caused by a delivery truck exiting the drive between the Computer Science and Engineering Building and the Mechanical Engineering Building. The upper plots show the acceleration at Points 3 and 4.
The middle plots show a peakhold, narrowband velocity spectrum for the full duration of the test and a 1/3 octave spectrum. These plots were used as the basis for calculations shown in later sections of this report. For this test, there is higher vibration at Point 3 than at Point 4 at frequencies below 2 Hz. A peak just below VC-D occurs at 12.5 Hz for both points.
The remaining plots show the instantaneous spectra for the window at the end of the test. This plot was not used in subsequent calculations because the event is enveloped by the peakhold plot.

Physics & Nanotechnology Building – University of Minnesota 3-3
Figure 32. Typical response spectrum plot.
Physics & Nanotechnology Building – University of Minnesota 3-4
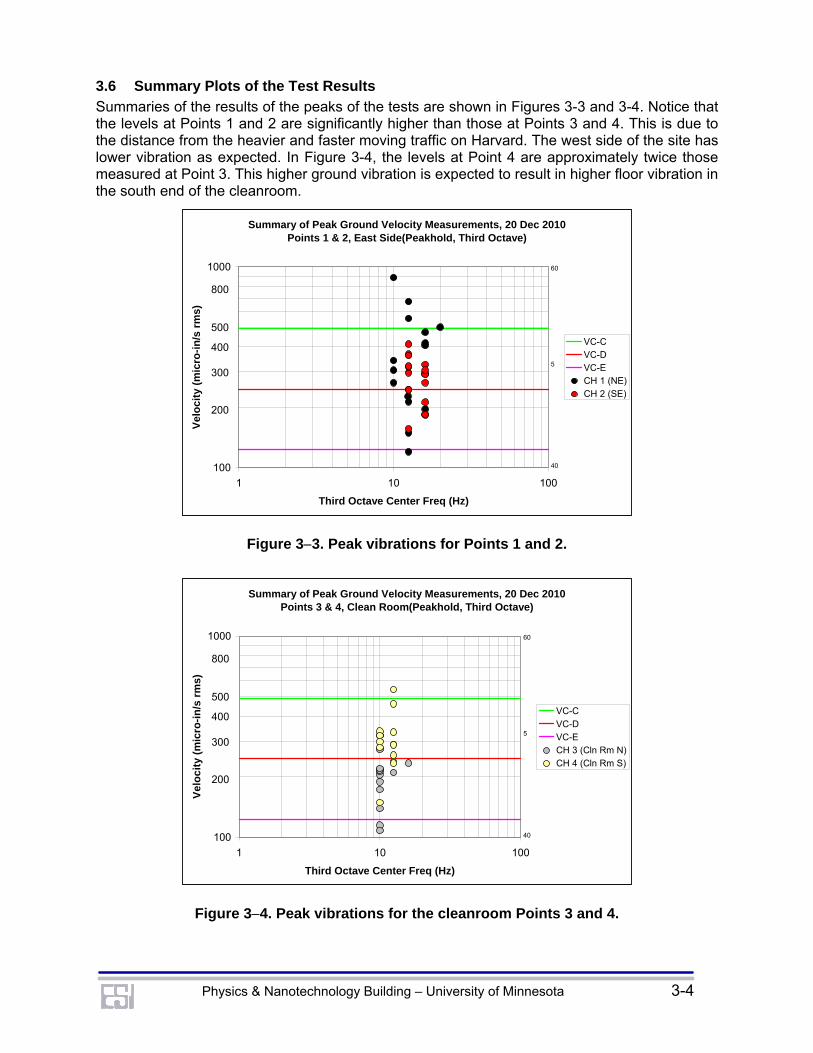
3.6 Summary Plots of the Test Results
Summaries of the results of the peaks of the tests are shown in Figures 3-3 and 3-4. Notice that the levels at Points 1 and 2 are significantly higher than those at Points 3 and 4. This is due to the distance from the heavier and faster moving traffic on Harvard. The west side of the site has lower vibration as expected. In Figure 3-4, the levels at Point 4 are approximately twice those measured at Point 3. This higher ground vibration is expected to result in higher floor vibration in the south end of the cleanroom.
Summary of Peak Ground Velocity Measurements, 20 Dec 2010Points 1 & 2, East Side(Peakhold, Third Octave)
100
1000
1 10 100
Third Octave Center Freq (Hz)
Vel
oci
ty (
mic
ro-i
n/s
rm
s)
VC-CVC-DVC-ECH 1 (NE)CH 2 (SE)
200
300
400
500
800
60
5
40
Figure 33. Peak vibrations for Points 1 and 2.
Summary of Peak Ground Velocity Measurements, 20 Dec 2010Points 3 & 4, Clean Room(Peakhold, Third Octave)
100
1000
1 10 100
Third Octave Center Freq (Hz)
Vel
oc
ity
(mic
ro-i
n/s
rm
s)
VC-C
VC-D
VC-ECH 3 (Cln Rm N)
CH 4 (Cln Rm S)
200
300
400
500
800
60
5
40
Figure 34. Peak vibrations for the cleanroom Points 3 and 4.

Physics & Nanotechnology Building – University of Minnesota 4-1
4 CLEANROOM FLOOR SYSTEM
Although the levels in this area are relatively low compared to the east side, the tests indicate that a slab on grade will not be sufficient to provide the necessary isolation from traffic on adjacent streets. Since the building will be supported on drilled piers, a decision was made to use the same means to support the laboratory floor.
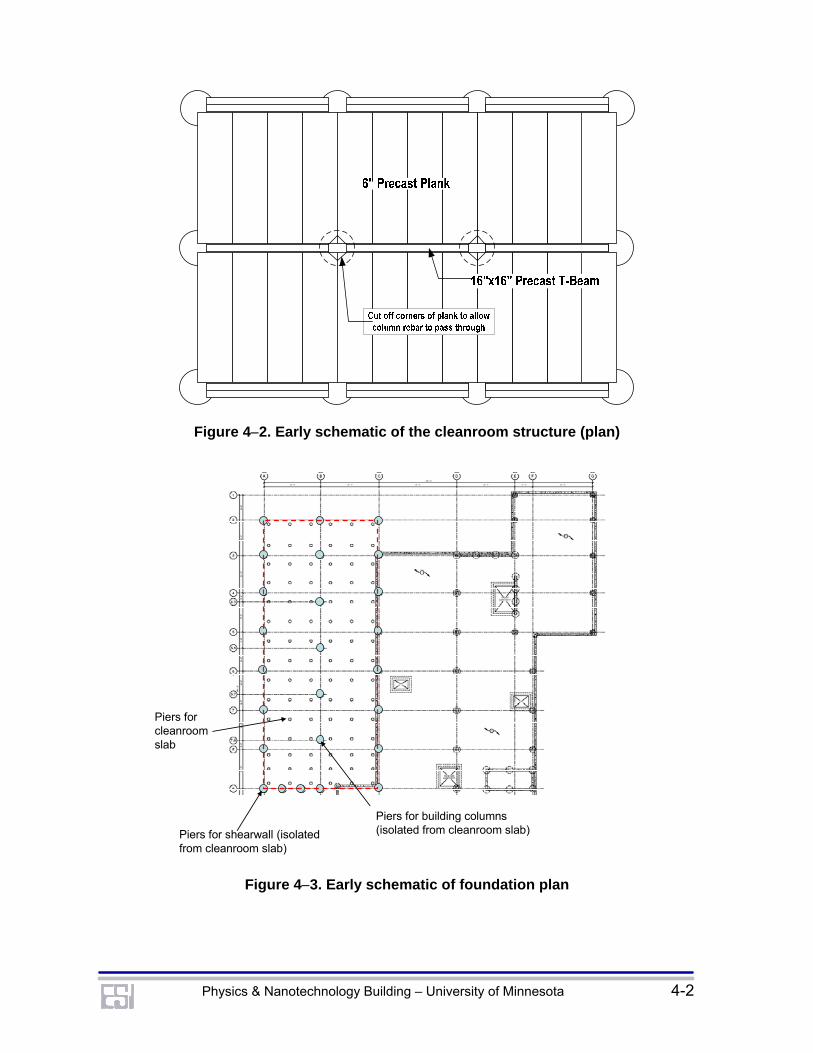
Figures 4-1 through 4-3 show a schematic of the structure proposed originally by ESI. In order to isolate the slab from the soil below, precast inverted T-beams are placed on top of the drilled piers. The T-beams support the precast planks, which in turn support a cast in place slab until the concrete hardens to form a thick monolithic slab. There is an air space below the slab so there is no direct contact with the soil below. This will significantly reduce the vertical motion in the cleanroom slab.
The design has evolved as shown in Figures 44 through 46. Following extensive discussions with the design team and contractor, the total slab thickness was reduced to 24 inches. The final design consists of 8-inch precast planks plus 16 inches of cast in place concrete. The final design was based upon a 12.5’ x 20’ array of piers, with some modification to accommodate the main building columns. A small pier spacing (12.5’ x 10’) was used in the southwest corner of the cleanroom to provide enhanced vibration mitigation for the sensitive equipment that will be located there. The main building columns are isolated from the cleanroom slab.
It was suggested that cardboard forms could be used rather than the precast elements to reduce cost. While this seems like it might be a reasonable alternative, it is our experience that the cardboard forms do not break down as expected. There is not sufficient moisture in the sandy soil at the University to decompose this material readily so the forms remain in contact and transmit vibration from the soil to the slab.
Figure 41. Early schematic of the cleanroom structure (elevation).
Physics & Nanotechnology Building – University of Minnesota 4-2
Figure 42. Early schematic of the cleanroom structure (plan)
Piers for building columns (isolated from cleanroom slab)Piers for shearwall (isolated
from cleanroom slab)
Piers for cleanroomslab
Figure 43. Early schematic of foundation plan

Physics & Nanotechnology Building – University of Minnesota 4-3
Figure 44. Current (BP 1) foundation plan in cleanroom area.

Physics & Nanotechnology Building – University of Minnesota 4-4
N
Figure 45. Current (BP 1) foundation/framing plan in cleanroom area.

Physics & Nanotechnology Building – University of Minnesota 4-5
Figure 46. Sections through cleanroom slab at interior and outside beam lines.

Physics & Nanotechnology Building – University of Minnesota 5-1
5 MODELING THE SYSTEM
Analysis of the floor system for dynamic response went through several iterations. The original calculations were done with Mathcad to determine the natural frequency and stiffness of the proposed system. A single mass oscillator model was used and the goal was to find a system with a thick slab and drilled piers stiff enough to produce a system with a natural frequency that is significantly higher than the fundamental frequency of the soil which is around 12 Hz. This was accomplished with the scheme shown above in Figures 4-2 and 4-3. Computer models confirmed the Mathcad calculation.
Cost estimates of the whole building showed that significant cuts needed to be made overall and that any reductions that could be made to the cost of the cleanroom floor should be considered. In order to accomplish this goal, the model was refined to evaluate variations on the initial design.
5.1 Detailed Finite Element Model
A detailed Finite Element Analysis (FEA) was used to examine the slab, drilled piers and soil. A parameter study was done by varying the thickness of the slab, spacing of the piers and the diameter of the piers to determine the effects each parameter has on the performance of the structure.
The first cases were done without including the soil in the model. After the importance of these parameters was evaluated, the soil was added to the model to further understand the interaction of the whole system. The refined model is shown in Figure 5-1. The model has more than 9400 nodes and 8400 elements. As shown, the model includes only the south half of the cleanroom floor structure (approximately up to Grid 6) and the soil below it. The soil and drilled piers extend down to bedrock.
SE corner of clean room floor
soil
drilled piers
(soil not shown)
N
Figure 51. Finite Element Model

Physics & Nanotechnology Building – University of Minnesota 5-2
5.2 Third Octave Ground Motion
The data collected from the site monitoring at Points 3 and 4 is shown in Figures 5-2 and 5-3 respectively. The peak of all of the data points at each third octave band was used as the driving function for the FEA model.
Summary of Peak Ground Velocity Measurements, 20 Dec 2010Point 3, Clean Room(Peakhold, Third Octave)
10
100
1000
1 10 100
Third Octave Center Freq (Hz)
Ve
loc
ity
(mic
ro-i
n/s
rm
s)
VC-CVC-D
VC-ECH 3 (Cln Rm N)
60
5
40
50
200
500
Figure 52. Third octave ground data at Point 3
Summary of Peak Ground Velocity Measurements, 20 Dec 2010Point 4, Clean Room(Peakhold, Third Octave)
10
100
1000
1 10 100
Third Octave Center Freq (Hz)
Vel
oci
ty (
mic
ro-i
n/s
rm
s)
VC-CVC-DVC-ECH 4 (Cln Rm S)
50
200
500
60
5
40
Figure 53. Third octave ground data at Point 4

Physics & Nanotechnology Building – University of Minnesota 5-3
5.3 Frequency Response Analysis
5.3.1 Methodology A frequency response analysis was performed on the model. A line of harmonic vertical forces is assumed on the soil surface, just south the cleanroom floor, and the ground velocity is computed as a function of frequency. Figure 5-4 shows the applied soil forces. The measured ground motion is then compared to predicted ground motion, and an appropriate scale factor is determined. The predicted response at any point in the soil or on the floor slab is then determined by applying the same scale factor to that point. The plots which follow are the result of that technique.
Forces on soil surface
N
Figure 54. Applied forces on the soil surface used for the frequency response analysis.
Figure 5-5 shows the nodal points on the cleanroom floor where the velocity response was computed. The velocity was computed along four lines extending from the south edge of the cleanroom floor back into the middle of the floor. In addition, in the southeast corner, the floor response was evaluated at six additional points in the area where the sensitive Vistec-E-Beam equipment will be located.
A modal damping value of 5 percent of critical was assumed for all modes. In our opinion, this represents a conservative assumption. Soil damping and structural damping due to equipment and walls located on the cleanroom slab will contribute.

Physics & Nanotechnology Building – University of Minnesota 5-4
Row 4Row 5Row 6Row 7 SE corner of clean room floor
N
Figure 55. Nodal points for frequency response analysis. Labels represent node numbers.
5.3.2 Results Figures 5-6 through 5-10 show the predicted velocity on the cleanroom floor. As explained in Section 5.2, the predictions are calibrated with the peak ground measured at Points 3 and 4. Each curve represents a point on the floor, with the velocity predicted at each third octave frequency. The highest response is just above 150 μ-inches/sec at 20 Hz, and occurs at node 13629 in Row 7, as seen in Figure 5-9. Recall that the VC-E criterion is at 125 μ-inches/sec independent of frequency. It is noted that the all the predicted responses are at or below the VC-E criterion, with the exception of a few points on the south edge of the floor slab. The magnitude of the predicted velocity generally falls below 100 μ-inches/sec for nodal locations north of the first line of drilled piers.
Figure 5-10 shows that the predicted velocity in the area of the sensitive Vistec E-Beam equipment located at the southeast corner of the cleanroom floor, is below the VC-E criterion, in spite of being close to the disturbing forces. It appears that the closer spacing of the drilled piers in this area is effective in reducing vibration.

Physics & Nanotechnology Building – University of Minnesota 5-5
1/3 Octave Velocity vs. FrequencyFloor, Row 4
0
20
40
60
80
100
120
140
160
180
200
0 5 10 15 20 25 30 35 40
Frequency (Hz)
Ve
loc
ity
- (
mic
ro-i
n/s
ec
)Predicted Response at 13549Predicted Response at 69Predicted Response at 539Predicted Response at 544Predicted Response at 549Predicted Response at 555Predicted Response at 560Predicted Response at 574Predicted Response at 584VC-E
Figure 56. Predicted floor response in Row 4
1/3 Octave Velocity vs. FrequencyFloor, Row 5
0
20
40
60
80
100
120
140
160
180
200
0 5 10 15 20 25 30 35 40
Frequency (Hz)
Vel
oci
ty -
(m
icro
-in
/sec
)
Predicted Response at 13573Predicted Response at 81Predicted Response at 1247Predicted Response at 1252Predicted Response at 1257Predicted Response at 1263Predicted Response at 1268Predicted Response at 1282Predicted Response at 1292VC-E
Figure 57. Predicted floor response in Row 5

Physics & Nanotechnology Building – University of Minnesota 5-6
1/3 Octave Velocity vs. FrequencyFloor, Row 6
0
20
40
60
80
100
120
140
160
180
200
0 5 10 15 20 25 30 35 40
Frequency (Hz)
Ve
loc
ity
- (
mic
ro-i
n/s
ec
)Predicted Response at 13601
Predicted Response at 95
Predicted Response at 2073
Predicted Response at 2089
Predicted Response at 2108
VC-E
Figure 58. Predicted floor response in Row 6
1/3 Octave Velocity vs. FrequencyFloor, Row 7
0
20
40
60
80
100
120
140
160
180
200
0 5 10 15 20 25 30 35 40
Frequency (Hz)
Ve
loci
ty -
(in
/sec
)
Predicted Response at 13629
Predicted Response at 109
Predicted Response at 2899
Predicted Response at 2909
Predicted Response at 1257
VC-E
Figure 59. Predicted floor response in Row 7

Physics & Nanotechnology Building – University of Minnesota 5-7
1/3 Octave Velocity vs. FrequencyFloor Response at Vistec-E-Beam
0
20
40
60
80
100
120
140
160
180
200
0 5 10 15 20 25 30 35 40
Frequency (Hz)
Ve
loci
ty -
(in
/se
c)
Predicted Response at 75
Predicted Response at 893
Predicted Response at 898
Predicted Response at 4
Predicted Response at 126
VC-E
Figure 510. Predicted floor response at Vistec E-Beam.

Physics & Nanotechnology Building – University of Minnesota 6-1
6 SUMMARY
ESI performed a vibration survey in December 2010, to characterize current vibration at the site. The data indicated that a slab on grade would not be sufficient to provide the necessary isolation from traffic on adjacent streets. Since the building columns will be supported on drilled piers, a decision was made to use the same means to support the laboratory floor. Based upon our preliminary analysis and experience with previous designs, ESI recommended a closely spaced array of piers, drilled to bedrock, supporting a thick monolithic floor slab.
Following the vibration survey, ESI collaborated with the other team members to refine the design and minimize cost. The critical element of the current design is a void between the top of the soil and the bottom of the floor slab so that vibration from the soil is not transmitted directly to the floor slab. A total slab thickness of 24 inches was decided upon, after a careful consideration of cost versus performance. The final design consists of 8-inch precast planks plus 16 inches of cast in place concrete.
The predicted vibration of the cleanroom floor slab has been analyzed by using a series of increasingly more complex techniques to predict the vibration on the cleanroom floor. The final analysis was done with a FEA model using a frequency response analysis. Using this method, the current measured ground vibration was used as input to predict the expected vibration of the cleanroom floor. This is not an exact analysis but rather it is an approximate method. The accuracy of the model depends on the material properties used, the boundary conditions assumed and details of the model. Additionally, the predictions are based upon the conditions that were encountered during our December 2010 vibration survey, and these conditions may change.
The VC-E vibration criterion is difficult to reach even under the best conditions. Our model shows that the predicted vibration of the cleanroom floor should be close to the criteria. The proposed structure is a reasonable solution to a challenging set of requirements and budget constraints, and should serve its intended purpose well.