Validating a Finite Element Model of a Structure Subjected ...

Shock and Vibration 17 (2010) 631–639 631DOI 10.3233/SAV-2010-0554IOS Press
Vibration analysis and design of a structuresubjected to human walking excitations
M. Setareh∗ and M. LovelaceVirginia Polytechnic Institute and State University, Blacksburg, Virginia, USA
Abstract. Annoying building floor vibrations have become a serious serviceability issue. This is mainly due to decrease in thesystem mass resulting from the use of higher strength materials; use of computer-assisted design and the Load and ResistanceFactor Design Method to optimize the structure based on the strength requirements; fewer partitions and more innovative designsby architects achieving long, column free spans resulting in a reduction in the natural frequency and damping. This paper providesdetails of the vibration analysis and design of a novel office building. Three-dimensional computer models of the structure werecreated and various modifications were made to the original structure, designed based on static loads, to reduce the possibleexcessive floor vibrations when subjected to walking excitations. Tuned mass dampers were also designed as a back-up vibrationcontrol system. A series of dynamic tests were conducted on the building floor to identify the dynamic properties of the structureand these were then used to update the original computer model. Finally, various forcing functions representing human walksand the updated computer model of the structure were used to evaluate the accuracy of the walking excitation force models topredict the structural response. Conclusions are made on the validity of each forcing function studied here.
Keywords: Serviceability problems, floor vibrations, tuned mass damper, human walk force model
1. Introduction
Building designers have in recent years been faced with excessive and annoying floor vibrations due to normalwalking traffic occurring more frequently. One of the main causes of this problem is more innovative designs byarchitects in response to the tendency of the building owners to require long, column free spaces. To evaluate thesusceptibility of building floors to such excitations, several design guides, standards and references recommendforcing functions in terms of general walk step frequencies. The acceleration response of the floor is usuallycompared with an acceptable limit to assess the vibration and the design of the structure. This paper presents variousstudies related to the analysis and design of an office floor susceptible to excessive floor vibrations, and it includesthe results of the floor modal tests. It also uses four forcing functions defined in terms of the Fourier series of thewalking step frequency, which are based on the recommendation of Bachmann, et al. [1], Murray, et al. [2], ISO10137 [3] and Smith, et al. [4]. In addition, two measured-step forcing functions reported by Bachmann, et al. [1]and Khoncarly [5] are used for computer analysis of the structure to estimate the floor response and compare withthe field measurements.
2. Building description
The structure used for this study is an office building located in Hudsonville, Michigan which serves as theheadquarters for Lamar Construction Corporation. It consists of a steel structure with a total plan dimension of 134ft-2 in. (40.9 m) by 50 ft-0 in. (15.2 m), overhanging a garage and warehouse facility as shown in Fig. 1.
∗Corresponding author. E-mail: [email protected].
ISSN 1070-9622/10/$27.50 2010 – IOS Press and the authors. All rights reserved

632 M. Setareh and M. Lovelace / Vibration analysis and design of a structure subjected to human walking excitations
Fig. 1. The lamar construction headquarters, Hudsonville, Michigan.
Fig. 2. Plan and section of the building.
The final configuration of the main supporting system consists of two 112 ft-6 in. (34.29 m) long, 16 ft-0 in.(4.88 m) deep cantilevered trusses, with the floor beams attached to the bottom flanges of the truss lower chord ascontinuous members as shown in Fig. 2. A 24 in. (610 mm) thick concrete core housing the elevator and a stair wellprovided structural stability.

M. Setareh and M. Lovelace / Vibration analysis and design of a structure subjected to human walking excitations 633
3. Preliminary vibration analysis and design
SAP2000 [6] computer software was used to create a three-dimensional computer model of the building structurebased on the preliminary static design. Dynamic analyses of the structure resulted in the estimated natural frequenciesof 1.90 Hz, 2.36 Hz and 3.24 Hz, representing the torsional mode, vertical (bending) mode and the lateral (sway)mode, respectively. Since the range of normal walk speeds is about 1.6–2.3 steps per second [1], the first two modesof the structure were susceptible to excitations due to the first harmonics of the walking force. The third mode couldonly get excited by the second harmonics of the walking force.
The force was placed at the anti-nodes for the relevant modes (R1 and 2, Fig. 2). The walk forcing functionsas recommended by Bachmann, et al. [1] in the form of Fourier series were used to compute the floor structureresponse:
F (t) = G
[1 +
n∑i=1
α1 sin(2πift− φi)
](1)
where F (t) represents the walk forcing function, t is the time, G is the weight of the walker, f is the excitationfrequency in Hz, αi is the Fourier coefficient of the i−th harmonic, φ i is the phase lag of the i-th harmonic relativeto the first harmonic and n is the total number of contributing harmonics. The average weight of a walker, G, wasassumed to be 180 lb. (82 kg). Bachmann, et al. [1] recommend α 1 = 0.45; α2 = 0.1, φ2 = π/2; and α3 = 0.1 andφ3 = π/2.
A modal damping ratio of 2% was used and the excitation frequencies were set equal to the first and secondmode natural frequencies of the structure to consider the most critical conditions. For the third mode, the excitationfrequency was selected at one-half the natural frequency. The maximum vertical acceleration at the corner edge ofthe floor (R1 and 2, Fig. 2) was 1% g, which was higher than the acceptable limit of about 0.5% g recommended byMurray, et al. [2] and the National Building Code of Canada [7].
4. Final design analytical studies
A number of modifications were made to raise the structure’s natural frequencies thus making it less susceptibleto excessive vibrations from walking. These included changes made in the orientation of the diagonal members ofthe trusses and increases in floor beams and truss member sizes. Also, the length of the cantilever portion of thefloor beams was reduced from 14 ft-0 in. (4.27 m) to 12 ft-0 in. (3.66 m), and the span between the trusses wasincreased from 22 ft-0 in. (6.70 m) to 26 ft-0 in. (7.92 m) as shown in Fig. 2. A 12 in. (305 mm) high, raised floorwas also added as part of the owner’s requirements. The first four natural frequencies were f 1 = 2.61 Hz (verticalmode), f2 = 3.41 Hz (lateral mode), f3 = 5.36 Hz (Torsional mode), and f4 = 7.32 Hz (local floor vertical mode).The mode shapes can be found in Setareh [8].
The computer model was subjected to the walking load excitations at the sub-harmonics of the natural frequenciesof the structure since the floor natural frequencies were outside the normal range of walking speeds (1.6–2.3steps/second). In addition, a walking excitation of 2.3 steps/sec, the upper bound of a normal walk, was included.The force was applied at the corner edge of the floor (R1 and 2, Fig. 2) as an individual in-place marching excitationusing Eq. (1). Assuming a 2% modal damping ratio, the maximum vertical and lateral accelerations were 0.26% gand 0.13% g, respectively. These values are below the acceptable limits of 0.5% g for the vertical and 0.2% g for thelateral vibrations. However, based on the senior author’s past experience, variation in the construction method mayhave resulted in changes in the structure natural frequencies and, therefore, higher accelerations could be expected.For this reason, the floor was subjected to a walking excitation at 2.6 steps/sec (representing brisk walks) to matchthe first mode natural frequency. This resulted in the maximum accelerations of 0.9% g and 0.05% g for the verticaland lateral directions, respectively. In this case, the vertical acceleration was well above the acceptable limit foroffice environments. Figure 3 shows the maximum floor vertical vibration responses when walking at 2.3 and 2.6steps/sec.

634 M. Setareh and M. Lovelace / Vibration analysis and design of a structure subjected to human walking excitations
0 5 10 15 20
-2
0
2
x 10-3
Time (sec)
Acc
eler
atio
n (g
)
0 5 10 15 20-0.01
-0.005
0
0.005
0.01
Time (sec)
Acc
eler
atio
n (g
)
(a) walking at 2.3 steps/sec (b) walking at 2.6 steps/sec
Fig. 3. The floor maximum vertical acceleration vs. time response.
5. Tuned mass dampers provisions
Since there was still a possibility that the as-built floor system would have been susceptible to excessive walkingvibrations even after the modifications to the structure, the decision was made to provide for the possible installationof tuned mass dampers (TMDs) within the raised floor plenum. The TMDs were designed to consist of weights,8,000 lb (3,600 kg) in total, for tuning to the first and third modes which had the largest response contributions.It was determined that the extra TMD weights would not have resulted in any static overstressing of the structuralmembers. The 4–2,000 lb (900 kg) option was adopted; however, the results were also applicable to the 2–4,000 lb(1,800 kg) configuration. With the effective mass ratio of 0.022 and 0.011 for the two modes, the optimum tuningfrequency and damping ratios were: f t = 0.993 and ξ = 0.10 for the first mode and f t = 0.998 and ξ = 0.067 forthe third mode.
Figure 4 shows the point accelerance FRF of the floor at the corner of the cantilever edge (R1 and 2, Fig. 2) beforeand after the TMDs installation. From this figure, it can be noted that the TMD placement can result in a reductionof about 72% in the first (bending) mode and 63% in the third (torsional) mode vibrations. The maximum level ofvertical acceleration due to walking after the TMDs installation can also be reduced to about 0.3% g, which is withinthe acceptable range.
6. Modal testing
A series of modal tests were conducted, both during the building construction and after its completion, toestimate the dynamic properties of the floor structure and possible needs for TMD installation. For these testsan electrodynamic shaker (APS Dynamics, Model 113), with an APS Model 114 amplifier and a number ofaccelerometers were used. An eight-channel Siglab Spectrum Analyzer (Spectral Dynamics, Model 20–84) was usedto analyze and record the test measurements. A burst chirp excitation with a frequency bandwidth of 2–6 Hz wasselected. A PCB 3701G capacitive accelerometer was attached to the shaker armature to measure the accelerationand compute input force. In addition, PCB 393C seismic accelerometers were used to measure the floor responses.Figure 5 shows the shaker, amplifier and the associated accelerometers.
The response records were analyzed using ME’scope VES [9] upon completion of the tests to identify the modalproperties of the structure. Details of modal testing and analyses can be found in Setareh [8]. The estimated naturalfrequencies (f ) and modal damping ratios (ξ) for the completed structure were: for the bending mode, f 1 = 2.25 Hz,ξ1 = 0.36%; for the lateral/torsional mode, f2 = 2.54 Hz, ξ2 = 1.1%; and for the torsional mode, f3 = 2.99 Hz, ξ3 =1.0%. It can be noted that the measured damping ratios were less than the values used for the structural responseprediction during the design phase. This can be attributed to the fact that the floor vibration was due to the globalstructural response, which did not result in the participation of non-structural elements such as full-height partitions.The results also showed that the structure natural frequencies were smaller than initially predicted, which was due

M. Setareh and M. Lovelace / Vibration analysis and design of a structure subjected to human walking excitations 635
0 2 4 6 80
0.5
1x 10
-4
Frequency (Hz)
Acc
eler
ance
FR
F (
g/lb
)
0 2 4 6 80
0.5
1x 10
-4
Frequency (Hz)
Acc
eler
ance
FR
F (
g/lb
)
(a) without TMDs (b) with TMDs
Fig. 4. Floor point accelerance FRF at R1 and 2 without and with TMDs.
Fig. 5. Shaker, amplifier and accelerometers used for the modal testing.
(a) f1=2.25 Hz (b) f2=2.54 Hz (c) f3=2.99 Hz
Fig. 6. Measured mode shapes from the modal tests and analysis.
to the larger estimated stiffness and smaller mass of the curtain walls [8]. The structure mode shapes are shown inFig. 6.
A number of controlled walks by an individual along the office corridor, located next to the trusses (see Fig. 2),were also conducted. The largest measured acceleration from these tests was about 0.67% g when the personwalked at 2.25 steps/seconds as shown in Fig. 7. This is within the unacceptable range based on Murray, et al. [2]and NBCC [7]. However, evaluation and assessment of the vibration records based on other design guides and

636 M. Setareh and M. Lovelace / Vibration analysis and design of a structure subjected to human walking excitations
Table 1Values of αi and φi for the walking/jogging force excitations from different sources
Harmonic (i) Bachmann, et al. [1] ISO 10137 [3] Murray, et al. [2] Smith, et al. [4]Walking Jogging Walking Jogging Walking Walking
1 α1 0.45 1.60 0.37(f− 1.0) 1.40 0.83e−0.35f 0.436(f − 0.95)φ1 0 0 0 0 0 0
2 α2 0.10 0.70 0.10 0.40 0.83e−0.70f 0.006(f + 12.3)φ2 π/2 0 0 0 0 π/2
3 α3 0.10 0.20 0.06 0.10 0.83e−1.05f 0.007(f + 5.2)φ3 π/2 0 0 0 0 −π
4 α4 − − − − 0.83e−1.40f 0.007(f + 2.0)φ4 − − − − 0 −π/2
Note: Murray, et al. [2] and Smith, et al. [4] do not include values for the jogging/running.
0 10 20 30 40
-5
0
5
x 10-3
Time (sec)
Acc
eler
atio
n (g
)
Fig. 7. Vertical acceleration response of location R1 and 2 when the individual walked at 2.25 steps/sec.
standards proved this not to be the case [8]. Since the building was opened nearly three years ago, there have beenno complaints from the occupants regarding possible annoying vibrations.
7. Human walk force models
The results of the modal testing and analysis were used to update the computer model of the structure. The firstthree natural frequencies of the updated model were 2.24 Hz, 2.74 Hz and 3.07 Hz. Comparing these values withthe results of the modal analysis mentioned above shows a maximum of 8% difference between the measured andcomputed natural frequencies.
The accuracy of four different walk force models defined in terms of the Fourier series of the step frequency inpredicting the floor vibration response was evaluated. These forcing functions were recommended by Bachmann,et al. [1], Murray, et al. [2], ISO 10137 [3] and Smith, et al. [4]. All of these functions follow the relationship givenin Eq. (1). Table 1 shows the values of the Fourier coefficient α i and the phase lag, φi, for various harmonics of theforcing functions from each source.
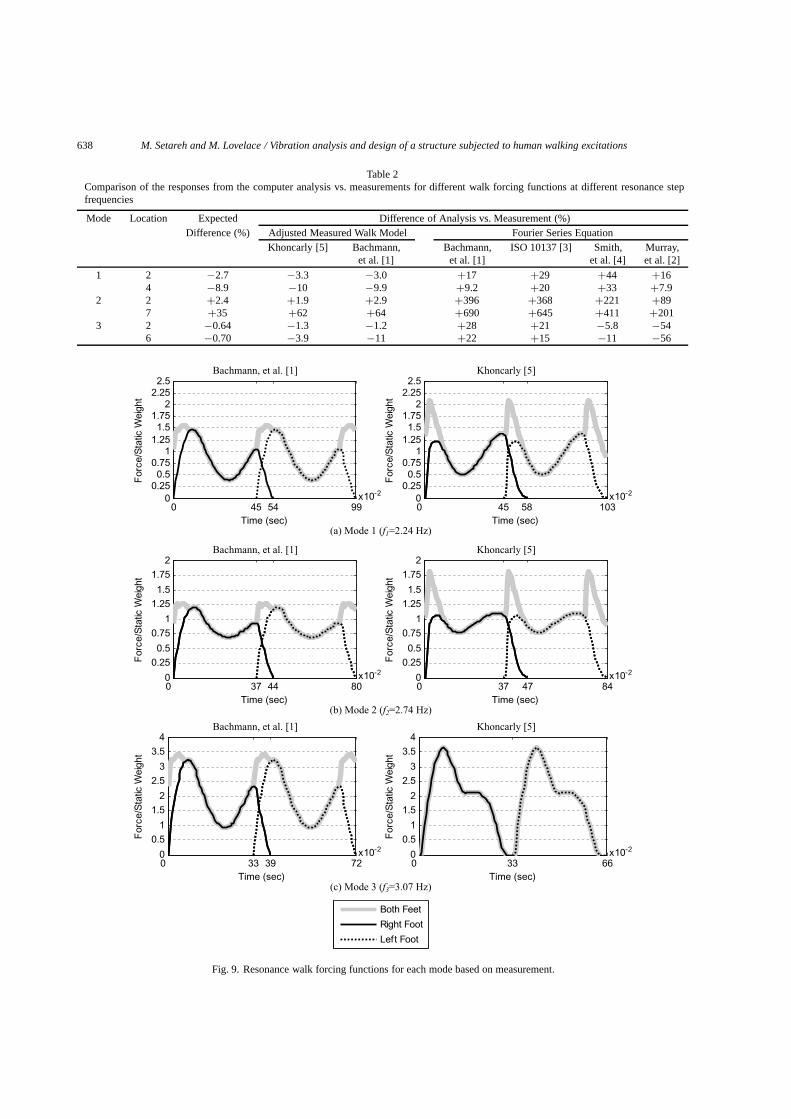
In addition, two measured force functions ([1] and [5]) were used. To better reflect the particular walks conductedon the structure, the frequency components of these forcing functions were adjusted [10]. Figures 8 and 9 show theresonance walk forcing functions, with step frequencies equal to each mode natural frequency, based on the Fourierseries and measurements after adjustments, respectively. As can be noted, Fig. 8 shows the combined forces of twoconsecutive steps. However, Fig. 9 includes each step force in addition to the total force. For the first mode resonancewalks (at 2.24 steps/sec), the peak force amplitudes from the measured Bachmann, et al. [1] and the Fourier-based

M. Setareh and M. Lovelace / Vibration analysis and design of a structure subjected to human walking excitations 637
0 22 45 67 890
1
2
3
Time (sec)
For
ce/S
tatic
Wei
ght
x10-2
0 18 37 55 730
1
2
3
Time (sec)
For
ce/S
tatic
Wei
ght
x10-2
(a) Mode 1 (f1=2.24 Hz) (b) Mode 2 (f2=2.74 Hz)
0 16 33 49 650
1
2
3
Time (sec)
For
ce/S
tatic
Wei
ght
x10-2
(c) Mode 3 (f3=3.07 Hz)
Bachmann, et al. [1]Murray, et al. [2] ISO 10137 [3] Smith, et al. [4]
Fig. 8. Resonance walk forcing function for each mode based on Fourier series.
forcing functions are close to each other. However, this is not the case for the second and third modes walk forcingfunctions. For the third mode walks, the Fourier-based Bachmann, et al. [1], ISO 10137 [3], and adjusted measuredforce of Khoncarly [5] represent a more realistic shape for the forcing function as they include loss of foot contactwith the ground during a jog or very brisk walk.
Table 2 shows the percentage difference between the computer analysis and measured responses at differentlocations when the individual walked at the first, second and third mode frequencies. Locations 2, 4 and 6 are thevertical directions along lines R1 and 2, 4 and 6, respectively (see Fig. 2). Location 7 is the lateral direction at R1and 6. The table also includes the expected differences between the computer analysis and measurements based onthe comparison of the FRFs from the modal tests and the computer analyses [10].
For all cases, these results show that the measured adjusted walk models provided the best match with themeasurements. This was expected as the adjustments were based on the modification of the frequency responseof the forcing function. Amongst the Fourier series based forcing functions, Bachmann, et al. [1] and Murray, etal. [2] provided the best match for the first mode response. For the second mode, none of the Fourier based forcingfunctions provided an acceptable match. Finally, for the third mode the forcing function recommended by Smith,et al. [4] resulted in the best match between the computer analysis and the measurements among the Fourier basedforcing functions.
8. Summary and conclusion
This paper presented a study of a long cantilevered, office building structure susceptible to walking vibrations.Various design modifications to reduce the vibration levels, in addition to the use of TMD passive control system,were presented. Results of the modal tests conducted after the completion of construction were presented. Thisshowed a large discrepancy between the assumed and measured damping levels. The low level of the measureddamping can be attributed to the fact that floor response was the result of the structure global dynamic behaviorrather than the local deck vibrations. Using the results of the test measurements, the computer model of the structurewas updated. Several different walking force functions were used to measure the floor response and were comparedwith the measurements. It was observed that in each case the adjusted measured walk model provided the best matchwith the measurements. The forcing functions recommended by Bachmann, et al. [1] and Murray, et al. [2] providedthe best match when the first mode was excited. For the third mode excitation, Smith, et al. [4] resulted in the bestmatch with the measurements among the Fourier series based forcing functions.
638 M. Setareh and M. Lovelace / Vibration analysis and design of a structure subjected to human walking excitations
Table 2Comparison of the responses from the computer analysis vs. measurements for different walk forcing functions at different resonance stepfrequencies
Mode Location Expected Difference of Analysis vs. Measurement (%)Difference (%) Adjusted Measured Walk Model Fourier Series Equation
Khoncarly [5] Bachmann, Bachmann, ISO 10137 [3] Smith, Murray,et al. [1] et al. [1] et al. [4] et al. [2]
1 2 −2.7 −3.3 −3.0 +17 +29 +44 +164 −8.9 −10 −9.9 +9.2 +20 +33 +7.9
2 2 +2.4 +1.9 +2.9 +396 +368 +221 +897 +35 +62 +64 +690 +645 +411 +201
3 2 −0.64 −1.3 −1.2 +28 +21 −5.8 −546 −0.70 −3.9 −11 +22 +15 −11 −56
Bachmann, et al. [1] Khoncarly [5]
0 45 54 990
0.250.5
0.751
1.251.5
1.752
2.252.5
Time (sec)
For
ce/S
tatic
Wei
ght
x10-2
0 45 58 1030
0.250.5
0.751
1.251.5
1.752
2.252.5
Time (sec)
For
ce/S
tatic
Wei
ght
x10-2
(a) Mode 1 (f1=2.24 Hz)
Bachmann, et al. [1] Khoncarly [5]
0 37 44 800
0.250.5
0.751
1.251.5
1.752
Time (sec)
For
ce/S
tatic
Wei
ght
x10-2
0 37 47 840
0.250.5
0.751
1.251.5
1.752
Time (sec)
For
ce/S
tatic
Wei
ght
x10-2
(b) Mode 2 (f2=2.74 Hz)
Bachmann, et al. [1] Khoncarly [5]
0 33 39 720
0.51
1.52
2.53
3.54
Time (sec)
For
ce/S
tatic
Wei
ght
x10-2
0 33 660
0.51
1.52
2.53
3.54
Time (sec)
For
ce/S
tatic
Wei
ght
x10-2
(c) Mode 3 (f3=3.07 Hz)
Both Feet
Right Foot
Left Foot
Fig. 9. Resonance walk forcing functions for each mode based on measurement.

M. Setareh and M. Lovelace / Vibration analysis and design of a structure subjected to human walking excitations 639
Acknowledgements
The study presented here was supported by the National Science Foundation under grant No. CMMI-0324471.This support is gratefully acknowledged. Any opinions, findings, and conclusions expressed in this paper are those ofthe authors and do not necessarily reflect the view of the National Science Foundation. Contribution and cooperationof Structural Design, Inc. and in particular Mr. Paul Dannels are greatly appreciated.
References
[1] H. Bachmann et al., “Vibration Problems in Structures: Practical Guidelines”, Birkhauser Verlag, Basel, Switzerland, 1995.[2] T.M. Murray, D.E. Allen and E.E. Ungar, Floor Vibrations Due to Human Activities, Steel Design Guide Series-11, AISC/CISC, 1997.[3] ISO 10137, Bases for Design of Structures-Serviceability of Buildings and Walkways against Vibrations-ISO 10137, International
Organization for Standardization, Geneva, Switzerland, 2007.[4] A.L. Smith, S.J. Hicks and P.J. Devine, “Design of Floors for Vibration: A New Approach”, The Steel Construction Institute, Ascot,
Barkshire, UK, 2007.[5] M.M. Khoncarly, “Dynamic Response of Floor Systems to Footfall-Induced Vibrations”, PhD Thesis, Case Western Reserve University,
Cleveland, Ohio, 1997.[6] CSI, “SAP2000 – Static and Dynamic Finite Element Analysis of Structures,” Version 11.0.8, Computers and Structures, Inc., Berkeley,
California, 2007.[7] NBCC, “Users’ Guide – National Building Code of Canada: Structural Commentaries – Commentary D: Deflection and Vibration Criteria
for Serviceability and Fatigue Limit States, Canadian Commission on Building and Fire Codes”, National Research Council of Canada,Ottawa, Ontario, Canada, 2005.
[8] M. Setareh, “Floor Vibration Serviceability Studies, College of Architecture and Urban Studies”, Virginia Tech, Blacksburg, Virginia,2009.
[9] Vibrant Technology, Inc., “ME’scope VES 5.0,” Scotts Valley, California, 2008.[10] M. Lovelace and M. Setareh, “Vibration Studies of an Office Building”, College of Architecture and Urban Studies, Virginia Tech,
Blacksburg, Virginia, 2009.

International Journal of
AerospaceEngineeringHindawi Publishing Corporationhttp://www.hindawi.com Volume 2010
RoboticsJournal of
Hindawi Publishing Corporationhttp://www.hindawi.com Volume 2014
Hindawi Publishing Corporationhttp://www.hindawi.com Volume 2014
Active and Passive Electronic Components
Control Scienceand Engineering
Journal of
Hindawi Publishing Corporationhttp://www.hindawi.com Volume 2014
International Journal of
RotatingMachinery
Hindawi Publishing Corporationhttp://www.hindawi.com Volume 2014
Hindawi Publishing Corporation http://www.hindawi.com
Journal ofEngineeringVolume 2014
Submit your manuscripts athttp://www.hindawi.com
VLSI Design
Hindawi Publishing Corporationhttp://www.hindawi.com Volume 2014
Hindawi Publishing Corporationhttp://www.hindawi.com Volume 2014
Shock and Vibration
Hindawi Publishing Corporationhttp://www.hindawi.com Volume 2014
Civil EngineeringAdvances in
Acoustics and VibrationAdvances in
Hindawi Publishing Corporationhttp://www.hindawi.com Volume 2014
Hindawi Publishing Corporationhttp://www.hindawi.com Volume 2014
Electrical and Computer Engineering
Journal of
Advances inOptoElectronics
Hindawi Publishing Corporation http://www.hindawi.com
Volume 2014
The Scientific World JournalHindawi Publishing Corporation http://www.hindawi.com Volume 2014
SensorsJournal of
Hindawi Publishing Corporationhttp://www.hindawi.com Volume 2014
Modelling & Simulation in EngineeringHindawi Publishing Corporation http://www.hindawi.com Volume 2014
Hindawi Publishing Corporationhttp://www.hindawi.com Volume 2014
Chemical EngineeringInternational Journal of Antennas and
Propagation
International Journal of
Hindawi Publishing Corporationhttp://www.hindawi.com Volume 2014
Hindawi Publishing Corporationhttp://www.hindawi.com Volume 2014
Navigation and Observation
International Journal of
Hindawi Publishing Corporationhttp://www.hindawi.com Volume 2014
DistributedSensor Networks
International Journal of