
VIABILITY OF POWERLINE COMMUNICATION FOR … · power grids. However, to immigrate to the new grid,...
92
VIABILITY OF POWERLINE COMMUNICATION FOR SMART GRID REALIZATION by Fariba Aalamifar A thesis submitted to the Department of Electrical and Computer Engineering In conformity with the requirements for the degree of Master of Applied Science Queen’s University Kingston, Ontario, Canada (April, 2012) Copyright ©Fariba Aalamifar, 2012
Transcript of VIABILITY OF POWERLINE COMMUNICATION FOR … · power grids. However, to immigrate to the new grid,...
VIABILITY OF POWERLINE COMMUNICATION FOR
SMART GRID REALIZATION
by
Fariba Aalamifar
A thesis submitted to the Department of Electrical and Computer Engineering
In conformity with the requirements for
the degree of Master of Applied Science
Queen’s University
Kingston, Ontario, Canada
(April, 2012)
Copyright ©Fariba Aalamifar, 2012
i
Abstract
There is an international effort to develop smart grids to overcome the problems caused by aging
power grids. However, to immigrate to the new grid, the IT infrastructure has to be integrated
with the current power grid. There is currently an ongoing debate surrounding what would be the
best choice for smart grid communication technology. One of the promising communication
technologies for smart grid realization is powerline communication (PLC). PLC provides utilities
the opportunity of managing their own network infrastructure. Power cables are everywhere; even
rural areas are covered with power cables. However, because of its noisy environment and the
low capacity of narrowband powerline communication (NBPLC), its viability for smart grid
realization is being questioned. To investigate this issue, smart grid communication network
requirements and powerline communication technologies and channel models are studied. Then,
using MATLAB and Network Simulator-2, powerline communication and a smart grid
communication network (SGCN) are simulated. The performance of different powerline channels
for smart grid realization is investigated and a viable PLC infrastructure for smart grid
communication network is proposed. Furthermore, to have a better understanding of the viability
of powerline communication for the smart grid, some future smart grid advanced applications are
investigated and integrated to the system. It is shown that although two types of powerline
channels do not perform well, the proposed powerline communication infrastructure, even under
advanced traffic, is capable of providing the smart grid with its communication prerequisites.

ii
تقديم به پدر و مادر عزيزم

iii
Acknowledgements
This thesis would not have been possible without the valuable guidance of several people who
assisted me in the completion of my thesis.
First and foremost, I would like to express my sincere gratitude to my supervisors, Dr. Hossam
Hassanein and Dr. Glen Takahara for their valuable advisements, insight, support and
encouragement in the preparation of this thesis. They are with no doubt among the most
understanding and supportive of supervisors.
I would like to thank and dedicate my work to my parents for their unending love and support
throughout my education.
It is a pleasure to thank my colleagues, Mohammad Salah, Kashif Ali, Walid Ibrahim and Louai
Al-Awami for their support in several aspects to accomplish this thesis.
I would like to thank my dearest sister, Fereshteh Aalamifar and dearest friend, Parisa Abedi for
their continuous support throughout preparing and reviewing this work.
I am grateful to thank my uncle, Dr. Hassan Nikkhajoei, for his great support throughout
understanding the power grid infrastructure and smart grid requirements.
I am indebted to my dear friends, Ali Ramezani and Ali Bakhshali for their help in explaining
powerline communication and the smart grid.
I would like to acknowledge the great support of Kingston Utilities and Hydro One for providing
us with the required information of the Kingston and Toronto power grid infrastructure.
I would like to thank Basia Palmer for her helpful comments in reviewing my thesis.
Finally, I would like to thank God for his countless blessings and for giving me the strength to
complete this work.
iv
Table of Contents
Abstract ............................................................................................................................................. i
Acknowledgements ......................................................................................................................... iii
List of Figures ................................................................................................................................ vii
List of Tables ................................................................................................................................ viii
Glossary of Acronyms .................................................................................................................... ix
Chapter 1 Introduction ..................................................................................................................... 1
1.1 Smart Grid Characteristics ..................................................................................................... 2
1.2 Smart Grid Communication Network (SGCN) ...................................................................... 3
1.3 Motivation and the Scope of the Work .................................................................................. 4
1.4 State of the Art ....................................................................................................................... 5
1.5 Contribution and Challenges .................................................................................................. 6
1.6 Thesis Outline ........................................................................................................................ 7
Chapter 2 Background and Literature Review ................................................................................. 8
2.1 Introduction ............................................................................................................................ 8
2.2 Smart Grids ............................................................................................................................ 9
2.3 Automatic Meter Reading (AMR) ....................................................................................... 10
2.4 Smart Grid Communication Networks ................................................................................ 11
2.4.1 Home Area Network (HAN) ......................................................................................... 12
2.4.2 Advanced Metering Infrastructure (AMI) ..................................................................... 12
2.4.3 Wide Area Network (WAN) ......................................................................................... 12
2.5 Smart Grid Communication Requirements .......................................................................... 12
2.6 Smart Grid Communication Network Data Traffic ............................................................. 13
2.7 Options for Smart Grid Networks ........................................................................................ 19
2.7.1 Wireless Mesh Network ................................................................................................ 19
2.7.2 WiMAX ........................................................................................................................ 19
2.7.3 Powerline Communication (PLC) ................................................................................. 20
2.7.4 Optical Networks .......................................................................................................... 20
2.8 Related Works ...................................................................................................................... 20
2.9 Electrical Infrastructure ....................................................................................................... 23
2.10 Powerline Communication ................................................................................................. 24
v
2.10.1 Powerline Communication Topology ......................................................................... 24
2.10.2 Power Grid Topology ................................................................................................. 24
2.10.3 Architecture of Powerline Communication Networks ................................................ 25
2.11 Powerline Communication Technologies .......................................................................... 26
2.11.1 NarrowBand PowerLine Communication (NBPLC) .................................................. 26
2.11.2 Broadband Powerline Communication (BPLC) .......................................................... 27
2.12 Powerline Communication Channel Model ....................................................................... 28
2.12.1 Powerline Communication Channel Models .............................................................. 28
2.13 Noise in Powerline Communication .................................................................................. 30
2.14 Bit Error Rate ..................................................................................................................... 31
Chapter 3 Experimental System Configuration ............................................................................. 33
3.1 Introduction .......................................................................................................................... 33
3.2 Simulation Setup .................................................................................................................. 33
3.2.1 Developing PLC Model ................................................................................................ 33
3.2.2 Importing BER into the Simulation .............................................................................. 35
3.2.2.1 BER in Narrowband PLC ...................................................................................... 35
3.2.2.2 BER in Broadband PLC ......................................................................................... 36
3.2.3 System Topology (Smart Grid Communication Network Topology) ........................... 36
3.2.4 Summary of System Setup ............................................................................................ 38
3.2.5 Traffic Model ................................................................................................................ 40
Chapter 4 Performance Evaluation ................................................................................................ 45
4.1 Introduction .......................................................................................................................... 45
4.2 Performance Metrics ............................................................................................................ 45
4.3 Simulation Results ............................................................................................................... 47
4.3.1 Studying the Performance of Different PLC Channel Models for the Smart Grid ....... 47
4.3.1.1 Experiment 1: Studying the Performance of PLC Channel 1, Class of Length
150m-Good ........................................................................................................................ 48
4.3.1.2 Experiment 2: Studying the Performance of PLC Channel 2, Class of Length
150m-Medium.................................................................................................................... 49
4.3.1.3 Experiment 3: Studying the Performance of PLC Channel 3, Class of Length
150m-Bad ........................................................................................................................... 51
vi
4.3.1.4 Experiment 4: Studying the Performance of PLC Channel 4, Class of Length
250m-Good ........................................................................................................................ 52
4.3.1.5 Experiment 5: Studying the Performance of PLC Channel 5, Class of Length
250m-Medium.................................................................................................................... 53
4.3.1.6 Experiment 6: Studying the Performance of PLC Channel 6, Class of Length
350m-Good ........................................................................................................................ 55
4.3.1.7 Experiment 7: Studying the Performance of PLC Channel 7, Class of Length
350m-Medium.................................................................................................................... 56
4.3.1.8 Experiment 8: Studying the Performance of PLC Channel 8, Class of Length
350m-Bad ........................................................................................................................... 57
4.3.1.9 Summary ................................................................................................................ 59
4.3.2 Finding a Viable PLC Infrastructure for Smart Grid Realization ................................. 60
4.3.2.1 Experiment 9: Studying the Performance of NBPLC-NBPLC-BPLC Topology .. 62
4.3.2.2 Experiment 10: Studying the Performance of NBPLC-NBPLC-BPLC Topology
for the AMR Infrastructure ................................................................................................ 63
4.3.2.3 Experiment 11: Studying the Performance of NBPLC (CENELEC-A)-BPLC-
BPLC Topology ................................................................................................................. 64
4.3.2.4 Experiment 12: Studying the Performance of NBPLC (US-FCC)-BPLC-BPLC
Topology ............................................................................................................................ 66
4.3.2.5 Experiment 13: Studying the Performance of NBPLC (CENELEC-A)-BPLC-
BPLC Topology under Advanced Traffic .......................................................................... 68
4.3.3 Cost Estimation ............................................................................................................. 71
4.3.4 Discussion ..................................................................................................................... 71
Chapter 5 Conclusion and Further Work ....................................................................................... 74
5.1 Conclusion ........................................................................................................................... 74
5.2 Further Work ........................................................................................................................ 76
References ...................................................................................................................................... 78
vii
List of Figures
Figure 2-1: A High-Level Smart Grid Communication Network Infrastructure ........................... 11
Figure 2-2: A Typical Power Grid Topology ................................................................................. 25
Figure 3-1: Performance of NBPLC-Length 150m, Good............................................................. 35
Figure 3-2: Performance of an Un-Coded OFDM BPLC Channel ("Class 150m-Good") ............ 36
Figure 3-3: Smart Grid Communication Network Topology ......................................................... 37
Figure 4-1: Performance of Reference Channel 1 ......................................................................... 49
Figure 4-2: Performance of Reference Channel 2 ......................................................................... 50
Figure 4-3: Performance of Reference Channel 3 ......................................................................... 51
Figure 4-4: Performance of Reference Channel 4 ......................................................................... 52
Figure 4-5: Performance of Reference Channel 5-16QAM Modulation Scheme .......................... 54
Figure 4-6: Performance of Reference Channel 5-8PSK Modulation Scheme .............................. 54
Figure 4-7: Performance of Reference Channel 6 ......................................................................... 55
Figure 4-8: Performance of Reference Channel 7 ......................................................................... 57
Figure 4-9: Performance of Reference Channel 8 ......................................................................... 58
Figure 4-10: Observed Delays for Different Traffic Classes-Experiment 9 .................................. 62
Figure 4-11: Observed Delays for Different Traffic Classes-Experiment 11 ................................ 65
Figure 4-12: Provided Reliability in System Topology of NBPLC (CENELEC-A) -BPLC-BPLC
....................................................................................................................................................... 66
Figure 4-13: Provided Reliability in the System Topology of NBPLC (US-FCC)-BPLC-BPLC . 67
Figure 4-14: Delay Comparison when Advanced Traffic Is Added to the System ........................ 69
Figure 4-15: Observed Delays for Different Traffic Classes when Advanced Traffic Is Added to
the System ...................................................................................................................................... 70
Figure 4-16: Simulated Topology for the SGCN (WiMAX-NBPLC) .......................................... 72
viii
List of Tables
Table 2-1: Two-way Data Traffic between Utility Company and a HAN ..................................... 15
Table 2-2: Two-way Data Traffic between Utility Company and Distribution System ................ 17
Table 2-3: Advanced Smart Grid Traffic ....................................................................................... 18
Table 2-4: NBPLC PHY Parameters-PRIME Technology ............................................................ 27
Table 2-5: Broadband Powerline Communication PHY Parameters [8] ....................................... 27
Table 3-1: Attached Field Automated Devices to the SGCN ........................................................ 39
Table 3-2: Simulated Smart Grid Data Traffic .............................................................................. 41
Table 3-3: Advanced Applications for the Smart Grid .................................................................. 42
Table 4-1: PLC PHY Parameters ................................................................................................... 48
Table 4-2: Parameters of Reference Channel 1 (“Class 150m-Good”) [43] .................................. 49
Table 4-3: Parameters of Reference Channel 2 (“Class 150m-Medium”) [43] ............................. 50
Table 4-4: Parameters of Reference Channel 3 ("Class 150m-Bad") [43] .................................... 51
Table 4-5: Parameters of Reference Channel 4 ("Class 250m-Good") [43] .................................. 52
Table 4-6: Parameters of Reference Channel 5 ("Class 250m-Medium") [43] ............................. 53
Table 4-7: Parameters of Reference Channel 6 (“Class 350m-Good”) [43] .................................. 55
Table 4-8: Parameters of Reference Channel 7 ("Class 350m-Medium") [43] ............................. 56
Table 4-9: Parameters of Reference Channel 8 (“Class 350m-Bad”) [43] .................................... 58
Table 4-10: Perfromance Analysis of Different PLC Channels ..................................................... 59
Table 4-11: Simulation Parameters ................................................................................................ 61
Table 4-12: AMR Traffic ............................................................................................................... 63
Table 4-13: Traffic Delays-Experiment 10 .................................................................................... 64
Table 4-14: WiMAX Simulation Settings Summary ..................................................................... 72
ix
Glossary of Acronyms
AMI Advanced Metering Infrastructure
AMR Automatic Meter Reading
BER Bit Error Rate
BPLC Broadband PowerLine Communication
CRM Customer Relationship Management
CSMA Carrier Sense Multiple Access
CSMA/CA Carrier Sense Multiple Access/Collision Avoidance
CSMA/CD Carrier Sense Multiple Access/Collision Detection
DA Distribution Automation
DAS Distribution Automation System
DLC Digital Loop Carrier
DMS Distribution Management System
DR Demand Response
FAN Field Area Network
FEC Forward Error Coding
FSK Frequency-Shift Keying
GSM Global System for Mobile communication
HAN Home Area Network
LV Low Voltage
MAC Medium Access Control
MDM Meter Data Management
MV Medium Voltage
x
NBPLC NarrowBand PowerLine Communication
NRT Near Real Time
OFDM Orthogonal Frequency Division Multiplexing
PAM Pulse Amplitude Modulation
PER Packet Error Rate
PHY Physical Layer
PLC PowerLine Communication
PLDS PowerLine Digital Subcarrier
PMU Phase Measuring Unit
PSK Phase-Shift Keying
PQMI Power Quality Monitoring Instrument
PRIME PoweRline Intelligent Metering Evolution
QAM Quadrature Amplitude Modulation
QoS Quality of Service
RF Radio Frequency
RT Real Time
SCADA Supervisory Control and Distribution Automation
SGCN Smart Grid Communication Network
SNR Signal to Noise Ratio
TDMA Time Division Multiple Access
VR Voltage Regulator
WAN Wide Area Network

1
Chapter 1
Introduction
Smart grid has recently been introduced to provide a smarter power grid via adding sensors and
intelligent devices. These devices will collect data from the power grid. In case of any problems,
e.g., blackout, sometimes the smart grid is able to heal itself automatically and oftentimes, the
collected information from the power grid needs to be transmitted to the utilities (control centers),
then according to the received information, the utilities will send commands to the power grid.
The main smart grid services include:
Vehicle to power grid technology: vehicles store power during off peak hours and send it
back to the power grid during on peak hours.
Power grid monitoring: electrical properties such as voltage and current of the power grid
infrastructure are monitored.
Demand side management: it is comprised of two parts:
o load shifting/demand response.
o energy conservation, e.g., using energy efficient products [1]
Home networking between electrical devices for energy management.
Automatic meter reading.

2
1.1 Smart Grid Characteristics
In the smart grid, there is an attempt to follow the seven goals below [2]:
Customer participation: customers will receive price signals and adjust their electronic
devices according to it. In addition, under the demand response program, some customers
permit the utility companies to control their smart electric devices at home. Hence,
utilities are allowed to turn the customers’ devices off in case of emergency or during
peak hours.
Power quality for the 21st century: through monitoring the power factors such as current
and voltage, the power work forces are able to identify the power grid problems.
Integration of all generations and storage options: smart grid aims to integrate distributed
electrical generations, e.g., micro grids and renewable energies with the power grid.
Thus, managing the produced power would be easier.
Self healing: the power grid would be able to heal itself automatically. It can decide
based on the collected data and react dynamically.
Resilience against attacks and disasters: this characteristic can be provided by increasing
power grid robustness, protecting key assets from physical attacks and providing
sufficient redundancy in the power grid [3].
Asset management and operational efficiency: quality of assets and how efficient they are
working in the power grid will be monitored. For example, the cable temperature is
measured.
3
New markets and operations: smart grid will integrate and open new businesses to the
power grid. For instance, it integrates IT infrastructure to the power grid; Smart devices
are needed to be designed and communication infrastructures are needed to be developed.
1.2 Smart Grid Communication Network (SGCN)
As mentioned earlier, to upgrade the current power grid to a smart one, the information collected
by smart devices needs to be provided to customers, operators and utilities, offering the
opportunity of dynamically responding to changes in power grid conditions [4]. Therefore, a
reliable two-way digital communication network is essential for smart grid implementation.
However, there is currently an ongoing debate surrounding what will be the best choice for smart
grid communication technology [2]. Among wireless technologies, Worldwide Interoperability
for Microwave Access (WiMAX) and wireless mesh networks are the two considered
technologies for smart grid realization. WiMAX [5], as a next generation network, covers a large
area, 10 km, and provides a high data rate of 63 Mbps. On the other hand, it is not as secure as
other wired communication technologies and it still has not been deployed everywhere.
Wireless mesh network is a favorable Advanced Metering Infrastructure (AMI) solution
implemented by some utilities in the United States. It is a self configuring network and can be
deployed easily. It experiences high latency and uses unlicensed radio frequency. Hence, it can
interfere with other communication devices.
Among wired communication technologies, there is an increasing interest in using powerline
communication (PLC). Utilities may prefer to have their own communication infrastructure, and
PLC offers them this opportunity. Powerlines exist everywhere. Even rural areas can be covered
by PLC since powerlines are already deployed there, while providing these areas with other kinds
of communication technologies is hard. On the other hand, PLC has some disadvantages. It
suffers from noise. For example, turning electrical devices on and off makes noise and pulses.
4
Furthermore, transformers because of their high inductances act as low pass filters and block high
frequencies. Therefore, in Broadband PowerLine Communication (BPLC) couplers are needed to
be attached at the transformers to allow high frequencies to pass through them.
There are two general technologies for PLC: NarrowBand PowerLine Communication (NBPLC)
and BPLC. Different governments define different frequency ranges to be used for NBPLC.
According to the European standard, NBPLC operates in the frequency range of 9 to 140 kHz
with maximum 128 kbps data rate [6], [7], while the US-FCC standard allows a frequency
spectrum usage of up to 500 kHz providing 576 kbit/s data rate [7]. BPLC modems operate in the
frequency range of 500 kHz to 30 MHz and a high data rate of at least 100 Mbps is provided [8].
1.3 Motivation and the Scope of the Work
Currently, there are many researches being conducted on the smart grid. Many countries have
assigned an enormous budget to address a new power grid. For instance, in October 2009, the
United States Department of Energy issued a seizure of 4.5 billion USD to stimulate smart grid
deployment in the United States [9].
The transition to smart grid technologies enables the integration of renewable energies into the
power grid, reduces the blackouts and problems with the power grid and enables the power grid
to restore more quickly. It will also encourage consumers to manage their electricity usage and
accommodate more electric vehicles into the power grid [9], [10].
However, to transform to the new grid, the IT infrastructure has to be integrated with the current
power grid. According to what has been mentioned in the previous section, since utilities can
have both the information source and the information technology on one system, PLC is one of
the most interesting communication technologies for the smart grid.
Currently, there are many claims that PLC can be advanced to have enough potential to be used
for smart grid communication and can even replace other communication technologies such as
5
wireless communication. The reason for these claims is that with new advances in
communications, for example Orthogonal Frequency Division Multiplexing (OFDM1) and other
modulation schemes, communication signals can resist the impulsive noise which is the most
destructive noise to PLC and a high data rate will be achieved. In this work, we aim to provide an
answer to whether PLC can satisfy SGCN requirements.
1.4 State of the Art
The selection of a communication technology for the smart grid depends on various factors
including the power grid infrastructure, coverage and security. In Europe and Asia-Pacific, PLC
technology is the mostly deployed and favorable technology for smart metering infrastructure
[11]. In North America, although some utilities have opted for PLC, the mostly deployed
automated meter infrastructures are based on wireless mesh networks. This is because in Europe,
each transformer will serve 10 or even 100 customers while in North America, the number of
smart meters served by one transformer is much less; for example, there are some situations in
which just one smart meter is served by a transformer [12]. Hence, in the US the number of
couplers required to be attached to the transformers is more; consequently, the installation cost
increases.
In the literature there are some studies discussing the advantages and disadvantages of using
NBPLC and BPLC [12]. Some research is focused on proposing new channel models for PLC in
different frequency ranges [13]. Furthermore, there are some discussions on communication
requirements for the smart grid [14], [15].
It is revealed that although there are some concerns regarding the use of PLC for the smart grid,
to the best of our knowledge there is no detailed simulation evaluating the viability of PLC for
1 method of sending digital data on multiple carrier frequencies
6
smart grid realization. Hence, in this thesis, we use MATLAB and Network Simulator-2 to
simulate a SGCN and PLC to evaluate PLC performance for the smart grid.
1.5 Contribution and Challenges
The contributions of this work are as follows:
A viable PLC infrastructure for the smart grid is proposed. To find the most appropriate
infrastructure, our goal is to minimize the infrastructure cost while maintaining
satisfaction of SGCN requirements; hence, it is better to use NBPLC where possible.
The performance of different powerline channels in terms of Bit Error Rate (BER) to the
Signal to Noise Ratio (SNR) and their effects on the SGCN are studied. Among eight
investigated PLC channels, it is shown that two types of PLC channels even with high
SNRs, do not perform well; they experience high BERs and therefore, they are not
suitable for smart grid realization.
Some advanced traffic types are investigated and the simulation results are provided. It is
observed that the proposed PLC infrastructure can perform well even when the advanced
traffic is integrated to the system.
However, there are several challenges to achieve the above goals.
Firstly, smart grid is a new topic and there is a renewed interest in developing PLC
technology. Hence, one of the challenges for this thesis was the lack of a comprehensive
literature in the area.
Secondly, to the best of our knowledge, there is no commercial simulator simulating
powerline channels. Therefore, we modeled a PLC channel and its Medium Access
Control (MAC) layer using MATLAB and Network Simulator 2.

7
There are many traffic types that should be passed through the smart grid. One of the
challenges in developing SGCN was to identify the main traffic classes. 14 essential ones
were distinguished; to compensate other types of traffic, background traffic was also
imported to the system.
1.6 Thesis Outline
After presenting the introduction, problem statement, and motivation in the first chapter, Chapter
2 provides an overview of background information on SGCN, PLC and the existing work in the
literature. The background information on SGCN describes different promising networks for the
smart grid; it also provides the hierarchical network architecture for the smart grid and explains
SGCN data traffic and their QoS requirements in detail. Chapter 2 focuses on PLC properties
including PLC technologies, its channel model, different types of noise and average BER in PLC.
Chapter 3 presents details on the developed simulator for SGCN and PLC. Furthermore, in
Section 4.3, all the conducted experiments along with their results and analysis are explained. The
final chapter concludes the thesis and presents some ideas for future research.
8
Chapter 2
Background and Literature Review
2.1 Introduction
This chapter focuses on two main aspects of smart grids: Smart Grid Communication Networks
(SGCN) and PowerLine Communication (PLC). It also provides a literature review of the works
conducted on SGCN and PLC.
Smart Grid Communication Networks
The background information on the SGCNs presents the conceptual hierarchical architecture,
SGCN requirements and all data traffic that needs to be passed over the SGCN; as well the
characteristics of SGCN data traffic and the QoS requirements. Concluding this aspect will be the
promising network technologies for the smart grid.
PowerLine Communication
Considering both the increasing interest in PLC for smart grid realization and the challenges
presented, investigating the viability of PLC for the smart grid was chosen to be a worthy
research area. We will provide related works done on PLC and the SGCN. Background
information on PLC, its topology, and PLC technologies including NBPLC and BPLC will be
reviewed. We will introduce the PLC channel model, different types of noise in PLC, Forward
Error Coding (FEC) and BER in both coded and uncoded OFDM powerline communication.

9
2.2 Smart Grids
Power electric systems in most countries have become old and inefficient and there is a national
effort to develop smart grids to overcome the problems caused by aging power grids. This
transition aims to increase energy efficiency, reduce gas emissions and have a sustainable
profitable power grid infrastructure satisfying current and future needs.
Smart grid technology becomes possible by applying sensors, field automated devices and smart
meters to the electrical distribution power grid. These devices measure and control power grid
conditions and communicate the information to customers, operators and utility companies,
providing the opportunity to dynamically respond to changes in power grid conditions [4].
Therefore, a reliable two-way digital communication network is essential for smart grid
implementation.
All field automated devices which are required to be connected to the electrical power grid for
data collection and processing are listed as follows [14], [16]:
Feeder Voltage Regulator: This device is an adjustable ratio transformer which is used to
regulate the voltage as it changes along the distribution feeder.
Feeder Medium Voltage Line Sensor: A device used to measure and report electrical
properties such as voltage, current, phase angle or power factor on a medium voltage
(MV) distribution line.
Feeder Low Voltage Line Sensor: A device used to measure and report electrical
properties such as voltage, current, phase angle or power factor at a low voltage (LV)
customer delivery point.

10
Transformer (MV2 to LV3): A device transferring electricity from one circuit to another
while converting the voltage level. In the smart grid context there will be a need to
measure some electrical or physical characteristics of this transformer such as voltage
(high and/or low side) current, MV load, temperature, etc.
Phase Measuring Unit (PMU): A device capable of measuring the phase of the voltage or
current waveform relative to a reference.
Capacitor Bank: This device adds capacitances at certain points of the distribution grid to
better manage and control the power factor and voltage level.
Motorized Switch: This device can be accessed remotely and is used to open or close the
circuit.
Fault Detector: This device is used to provide an indication of the fault.
Intelligent Fault Detector: This device can sense the fault and provide more detailed
information of the fault condition.
2.3 Automatic Meter Reading (AMR)
The technology to automatically read and diagnose the problems with water and electrical meters
is called AMR. This technology enables utility providers to read meters without the need to go to
each physical location. Furthermore, customers and utility providers can monitor and manage
resource usage more easily. To implement AMR, different technologies such as PLC, radio
frequency and mobile data collection vehicles can be used. In all these technologies, usually, a
transceiver sends a wake up signal to the particular transmitter and asks it to send its data [17].
2 Medium Voltage 3 Low Voltage
11
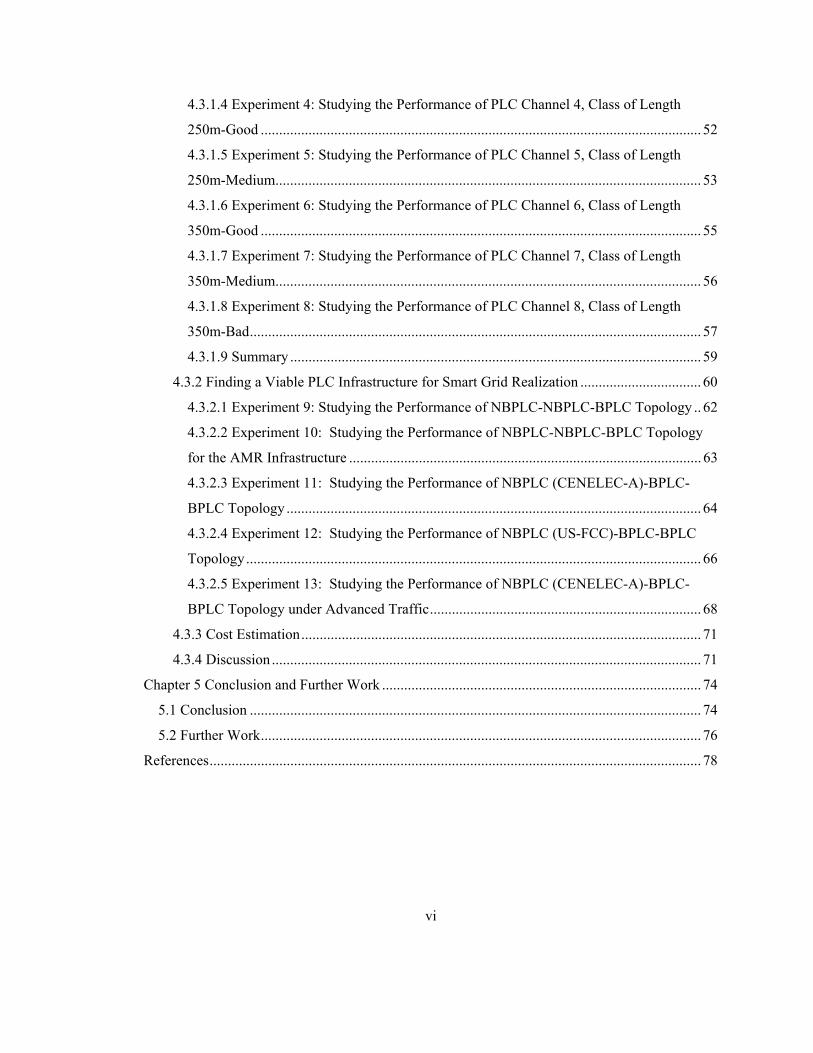
2.4 Smart Grid Communication Networks
A two-way digital communication is required for smart grid realization. Figure 2-1 shows a high-
level conceptual model of a SGCN infrastructure which illustrates a general classification of all
data traffic that should be passed through a SGCN. This data traffic will be discussed in detail in
Section 2.6.
SmartMetersoftware
upgrade
Voice Datatalking with a staff/ direct crew dispatch
HAN: Home Area NetworkDAS: Distribution Automation SystemAMI: Automated Meter InfrastructureDR: Demand ResponseCRM: Customer Relationship ManagementMDM: Meter Data ManagementDA: Distribution AutomationPMU: Phase Measuring UnitVR: Voltage Regulator
Feeder Sensors
Advertisements
Two‐Way Data Traffic
Figure 2-1: A High-Level Smart Grid Communication Network Infrastructure
A three-level hierarchy can be defined for a SGCN which includes the Home Area Network
(HAN), Advanced Metering Infrastructure (AMI)/Field Area Network (FAN) and Wide Area
Network (WAN).
12
2.4.1 Home Area Network (HAN)
Adding intelligence into the home/building devices and monitoring and controlling the electrical
devices at the home leads to having a HAN technology. In a HAN, smart devices at home can
communicate with one another and react to the price signal they get from the utility.
2.4.2 Advanced Metering Infrastructure (AMI)
This infrastructure collects all the data from smart meters and the Distribution Automation
System (DAS) and sends it to the WAN. The DAS requires additional sensors, smart automated
devices and communication infrastructure to the power grid distribution network.
AMI deployment provides the opportunity for utility companies to control end user devices, send
real time commands, and control the distribution grid devices. This infrastructure is also called a
Field Area Network (FAN).
2.4.3 Wide Area Network (WAN)
This network transmits collected information from the AMI to the utility control servers including
Meter Data Management (MDM), Customer Relationship Management (CRM), Demand
Response (DR) and Distribution Automation (DA).
2.5 Smart Grid Communication Requirements
Low latency, high reliability, scalability and security are the characteristics that describe the
SGCN. The SGCN is responsible for collecting and transmitting data between all the nodes/actors
of the smart grid [15]. According to [14] and [15], latency and reliability are considered to be the
main SGCN requirements.
Latency: As stated in [14], latency is defined as the summation of the node processing time and
network processing time from the sending node to the receiving node. For each kind of smart grid
13
data traffic, a certain amount of latency is acceptable. Some components of the SGCN are more
latency tolerant while some are less and need a quick response [15].
Reliability: The probability that an operation will complete without failure over a specific period
[14].
Bandwidth: Bandwidth represents how much data can be sent over a specific network
connection per given unit of time. The IEEE P230 standard is still trying to precisely define the
bandwidth requirements for a SGCN [18].
Security: Smart grid data traffic such as billing, signal prices and control messages is very
important traffic that needs to be encrypted and prevented from malicious changes and
unauthorized access. Integrity (no malicious modification), and authenticity (message originality
and access rights) are the important security aspects in a SGCN [4], [19].
2.6 Smart Grid Communication Network Data Traffic
In order to identify all data traffic that is needed to be sent over the smart grid, we divided smart
grid applications into three general classes as illustrated in Figure 2-1.
Two-way data traffic between the utility company and a HAN: In this case, all the
traffic needed to be communicated between the HAN and utility company is aggregated in the
smart meter. Thus, this kind of traffic not only consists of reading smart meters, but also includes
other traffic data such as safety, maintenance, demand-response (customer reaction to smart grid
reliability and price signals), billing, peak hours and time of use rates.
Two-way data traffic between the utility company and distribution system: In this
type of traffic, all the distribution automation system devices such as capacitor banks, voltage
regulators, medium voltage line regulators and fault detectors will sense and measure data from
the distribution system and then send it to the related collectors. We classify this type of traffic
14
into two general categories:
o Distribution automation and control: This type of traffic includes all commands
and data traffic used for controlling and reacting to different power grid conditions.
o Monitoring and maintenance: This type of traffic is used for monitoring the status
of power cables and electrical devices in the power grid.
Advanced smart grid applications: If we want to have a long term view to smart grid
implementation, we need to consider some advanced applications in order to analyze the smart
grid’s requirements better.
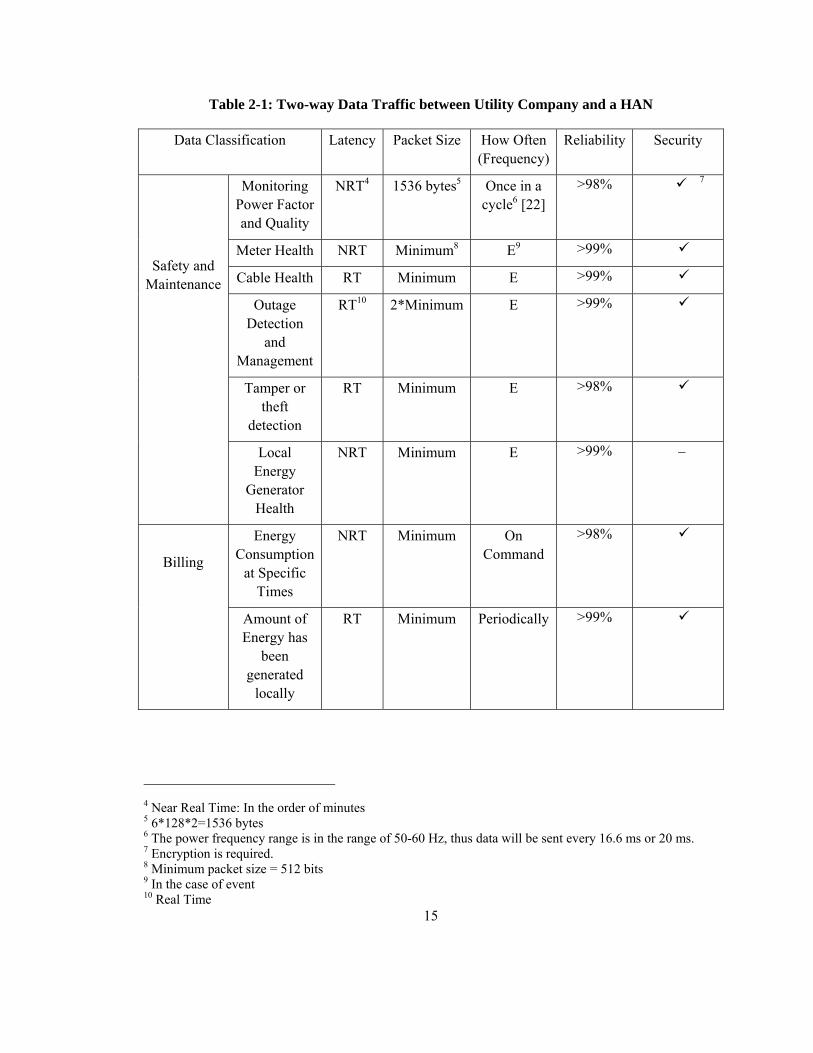
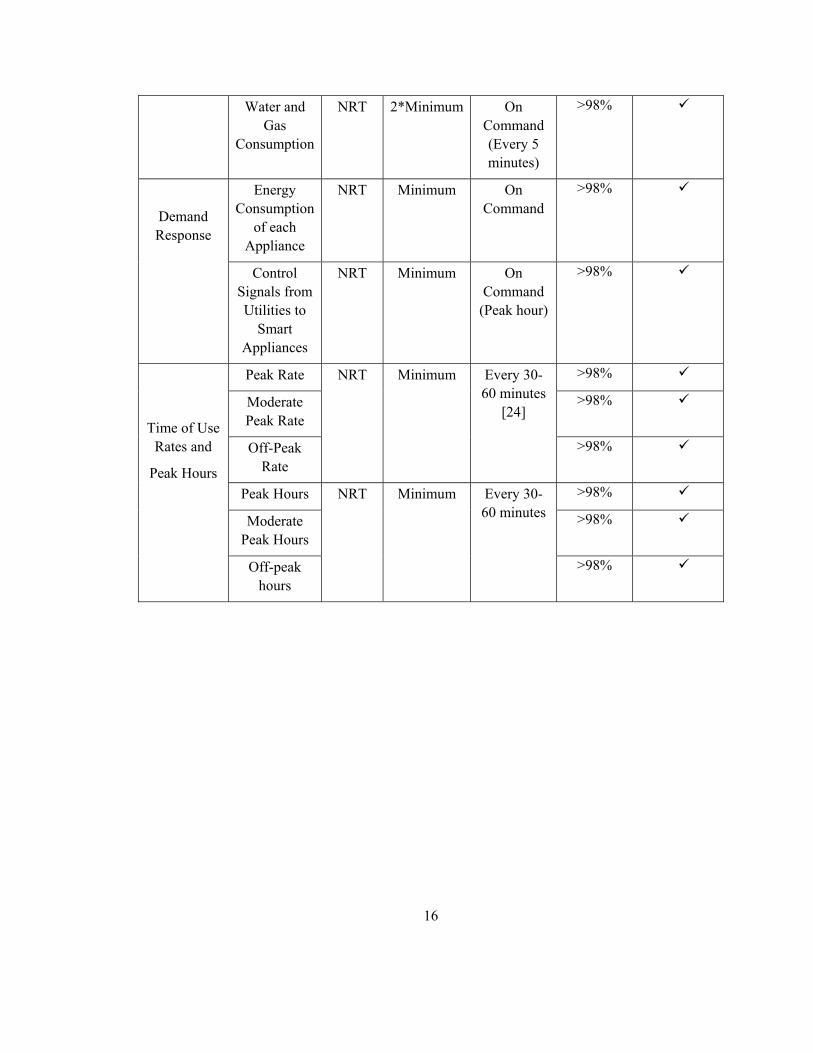
In Table 2-1, Table 2-2, Table 2-3 the different types of data traffic sent over the SGCN are
shown. To collect this information, different resources [4], [20], [21] have been studied. A
detailed comprehensive SGCN has been demonstrated in [14].
For each kind of data traffic, latency objective, packet size, frequency (how often), detailed data
that should be sent, and reliability percentage have been identified and also it determines for
which traffic types encryption is required.
SGCN Data Traffic Characterization
To clarify the data traffic tables, consider the first kind of data traffic from Table 2-1, “monitoring
power factor and quality”. For this kind of application, we need to send three phase voltage and
three phase current [22]. This data must be sent every power cycle and since the power frequency
range is between 50-60 Hz [23], i.e. data will be sent every 16.6-20 ms. Suppose a power quality
monitoring instrument (PQMI) samples three phase voltages and three phase currents, it samples
128 data points per period for each analogue input channel (we need to convert the analogue
signal to digital data, consequently encoding is needed) and each sample is represented by two
bytes, then the PQMI transmits 6*128*2=1536 bytes every power cycle [22]. If we consider 20
ms for the power cycle, the data transmission speed would be 1536*50*8=614,400 bps.
15
Table 2-1: Two-way Data Traffic between Utility Company and a HAN
Data Classification Latency Packet Size How Often (Frequency)
Reliability Security
Safety and Maintenance
Monitoring Power Factor and Quality
NRT4 1536 bytes5 Once in a cycle6 [22]
>98% 7
Meter Health NRT Minimum8 E9 >99%
Cable Health RT Minimum E >99%
Outage Detection
and Management
RT10 2*Minimum E >99%
Tamper or theft
detection
RT Minimum E >98%
Local Energy
Generator Health
NRT Minimum E >99%
Billing
Energy Consumption
at Specific Times
NRT Minimum On Command
>98%
Amount of Energy has
been generated
locally
RT Minimum Periodically >99%
4 Near Real Time: In the order of minutes 5 6*128*2=1536 bytes 6 The power frequency range is in the range of 50-60 Hz, thus data will be sent every 16.6 ms or 20 ms. 7 Encryption is required. 8 Minimum packet size = 512 bits 9 In the case of event 10 Real Time
16
Water and Gas
Consumption
NRT 2*Minimum On Command (Every 5 minutes)
>98%
Demand Response
Energy Consumption
of each Appliance
NRT Minimum On Command
>98%
Control Signals from Utilities to
Smart Appliances
NRT Minimum On Command
(Peak hour)
>98%
Time of Use Rates and
Peak Hours
Peak Rate NRT Minimum Every 30-60 minutes
[24]
>98%
Moderate Peak Rate
>98%
Off-Peak Rate
>98%
Peak Hours NRT Minimum Every 30-60 minutes
>98%
Moderate Peak Hours
>98%
Off-peak hours
>98%
17
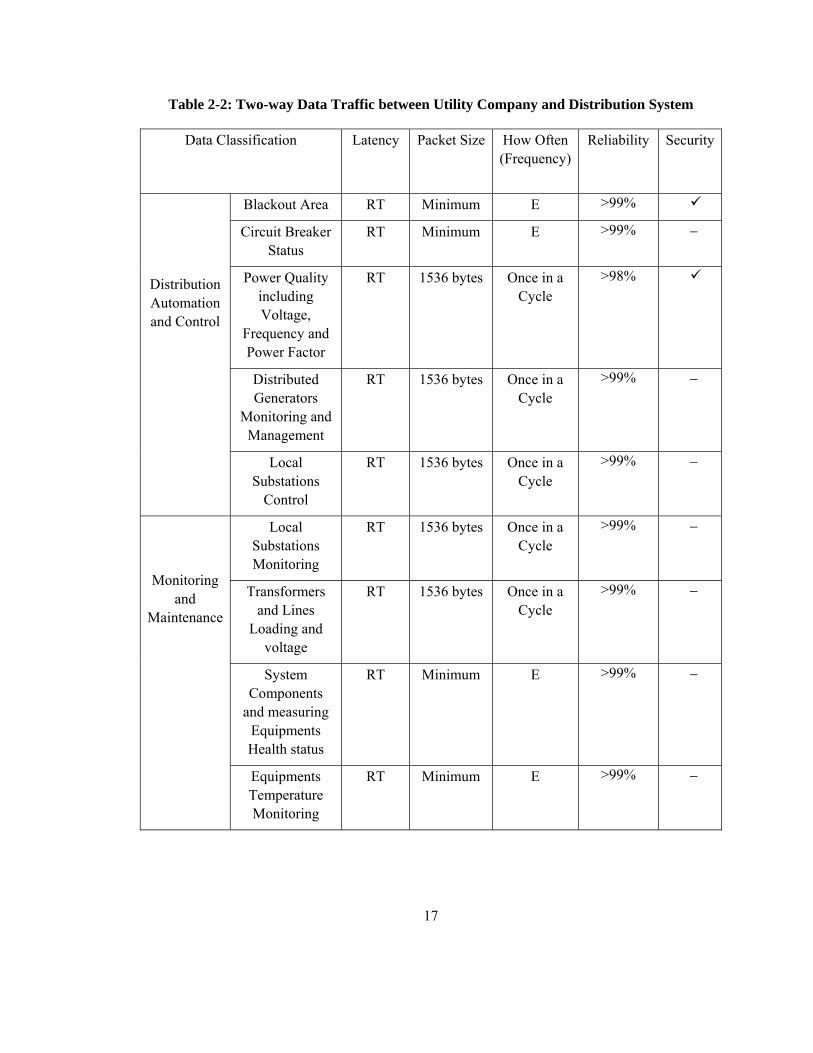
Table 2-2: Two-way Data Traffic between Utility Company and Distribution System
Data Classification Latency Packet Size How Often (Frequency)
Reliability Security
Distribution Automation and Control
Blackout Area RT Minimum E >99%
Circuit Breaker Status
RT Minimum E >99%
Power Quality including Voltage,
Frequency and Power Factor
RT 1536 bytes Once in a Cycle
>98%
Distributed Generators
Monitoring and Management
RT 1536 bytes Once in a Cycle
>99%
Local Substations
Control
RT 1536 bytes Once in a Cycle
>99%
Monitoring and
Maintenance
Local Substations Monitoring
RT 1536 bytes Once in a Cycle
>99%
Transformers and Lines
Loading and voltage
RT 1536 bytes Once in a Cycle
>99%
System Components
and measuring Equipments Health status
RT Minimum E >99%
Equipments Temperature Monitoring
RT Minimum E >99%
18
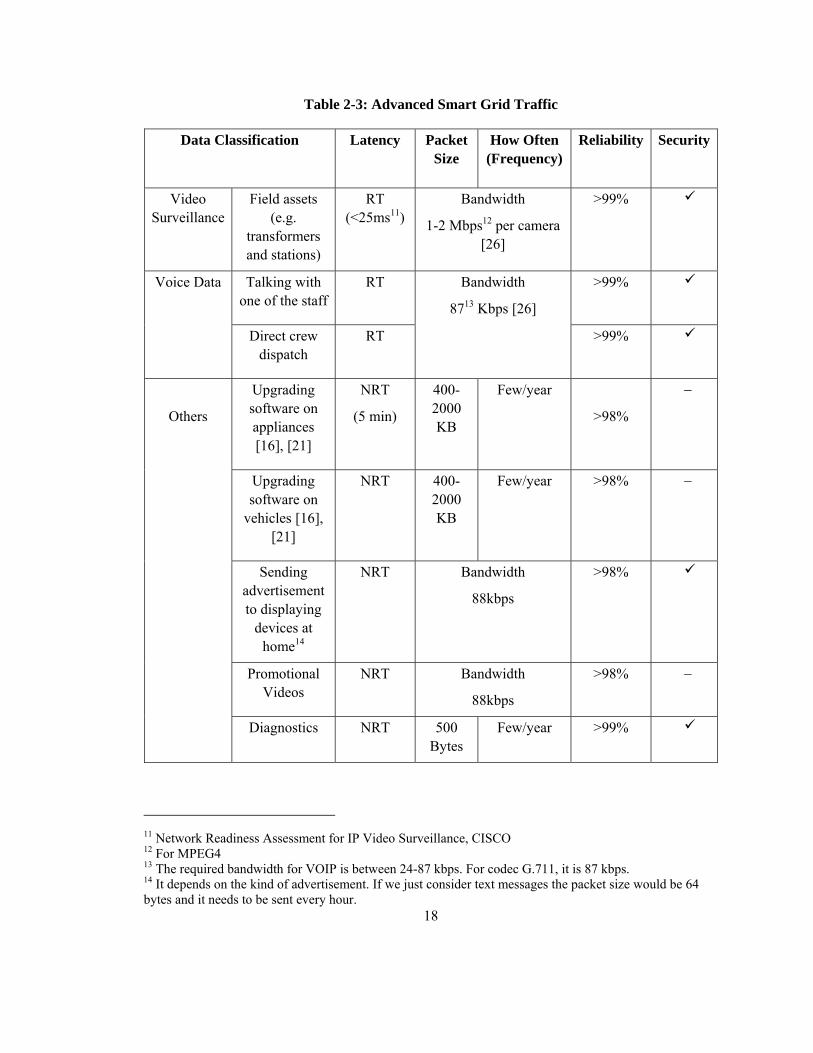
Table 2-3: Advanced Smart Grid Traffic
Data Classification Latency Packet Size
How Often (Frequency)
Reliability Security
Video Surveillance
Field assets (e.g.
transformers and stations)
RT (<25ms11)
Bandwidth
1-2 Mbps12 per camera [26]
>99%
Voice Data Talking with one of the staff
RT Bandwidth
8713 Kbps [26]
>99%
Direct crew dispatch
RT >99%
Others
Upgrading software on appliances [16], [21]
NRT
(5 min)
400-2000 KB
Few/year
>98%
Upgrading software on
vehicles [16], [21]
NRT 400-2000 KB
Few/year
>98%
Sending advertisement to displaying
devices at home14
NRT Bandwidth
88kbps
>98%
Promotional Videos
NRT Bandwidth
88kbps
>98%
Diagnostics NRT 500 Bytes
Few/year >99%
11 Network Readiness Assessment for IP Video Surveillance, CISCO 12 For MPEG4 13 The required bandwidth for VOIP is between 24-87 kbps. For codec G.711, it is 87 kbps. 14 It depends on the kind of advertisement. If we just consider text messages the packet size would be 64 bytes and it needs to be sent every hour.
19
2.7 Options for Smart Grid Networks
There are different communication technologies that can be used for a SGCN. Each one has its
own advantages and disadvantages which will be discussed in the following sections.
2.7.1 Wireless Mesh Network
A wireless mesh network is a multi-hop ad hoc network, which does not usually require
sophisticated planning, and hence provides a reliable flexible network in which wireless devices
assist each other in transmitting their packets throughout the network. A wireless mesh network
can be easily scaled and deployed quickly. Each packet can reach its destination from different
paths offering redundancy for the network.
This type of network is one of the leading Automated Meter Infrastructure (AMI) communication
solutions in North America. Each smart meter acts as a relay node and will forward messages to
the next smart meter. Therefore, latency is one of the concerns regarding using this network.
Furthermore, wireless mesh network uses an unlicensed radio frequency, 900 MHz [21]. Hence,
the interference probability is high.
2.7.2 WiMAX
Worldwide Interoperability for Microwave Access (WiMAX) is a common name for IEEE802.16
standard [5], a solution to broadband wireless communication technology providing the last mile
connectivity for the consumers. It runs over a licensed wireless spectrum, 2-11 GHz and offers a
secure, reliable communication. WiMAX technology can provide rates of upto 100 Mbit/s data
rate and can cover upto a 5-50 km radius area [27], [28]. One of the advantages regarding using
WiMAX technology is that QoS can be guaranteed through IEEE 802.16e standard which is
beneficial for the smart grid where some messages are more important.
20
2.7.3 Powerline Communication (PLC)
In PLC, data and electricity will be transmitted over existing powerlines simultaneously. PLC can
provide large coverage, since the powerlines are already installed everywhere [6]. This is
beneficial especially for substations located in rural areas where there is no communication
infrastructure. Furthermore, this communication network can be established cost-effectively since
it uses the existing powerlines.
However, PLC has its own disadvantages. There are some noise sources over powerlines such as
lights, electrical motors and radio signal interference. This noise results in high error rates.
The second disadvantage is the open circuit problem. Occasionally, switches, located at some
places in the power grid, are open. Hence, communication is lost at those points [6].
The other issue with the PLC is security. Since powerline cables are not well twisted, oftentimes,
its signals can be received by other radio receivers. Thus, encrypting data over PLC is essential.
More details are in Section 2.10.
2.7.4 Optical Networks
This communication infrastructure provides higher data rates. Moreover, it is immune to
electromagnetic interference and radio frequency interference. Thus, it is an ideal communication
medium for high voltage lines.
However, laying new optical cables is costly and needs a lot of construction which takes a long
time. Therefore, it can be used as a backbone communication with the cost spread over a large
number of users.
2.8 Related Works
In this thesis, we focus on the viability of PLC for smart grid realization. To investigate this, the
provided communication requirements by different PLC infrastructures were investigated.
21
Furthermore, the performance of different PLC channel models in terms of SNR to BER was
evaluated.
To the best of our knowledge, there is no prior work investigating the viability of PLC as
presented in this thesis (i.e. whether PLC can satisfy SGCN requirements, what is the best
combination of different PLC technologies for smart grid realization, and studying the
performance of different PLC channel models for the smart grid).
In the previous work done on “PLCs for the SGCN” [12], the authors do not report any
quantitative results of the performance of PLC for the smart grid. However, they present a
qualitative guideline of the properties of NBPLC and BPLC, and the advantages and
disadvantages of each technology. The paper also describes the role of PLCs for LV and MV
networks. Furthermore, it gives an analysis of the MV distribution network topology. To
accomplish that, they studied a sample 396-node MV distribution network in which they
evaluated some topology metrics such as network size, connectivity percentage and the average
shortest path between any pair of nodes.
In [15] the authors discuss the communication requirements for the smart grid. Latency,
bandwidth and QoS are considered as the main requirements for a SGCN. Furthermore, a three-
level hierarchy for a SGCN is proposed: Core Network, Distribution Network and Access
Network. The Core Network handles connectivity between substations and utility companies
(i.e. control centers). The Distribution Network handles broadband connectivity for transmitting
data collected by the smart meter sensors and concentrators located on the power grid to their
databases which are located at headquarters. The Access Network controls last mile connectivity
of end user appliances to the smart meters. The authors also mention the Distributed Autonomous
Real Time (DART) system, in which they report the required transfer rate for the smart grid. The
22
required bandwidth for a substation was reported to be 3.31 Mbps and 8.1 Mbps within a zone
formed of 10 substations.
In [29], the authors are focused on analyzing different standards and specifications related to
AMR over PLCs. They implemented and simulated IEC 60870-5-104 and Device Language
Message Specification (DLMS)/COmpanion Specification for Energy Metering (COSEM) using
the OPNET modeler; then the performance metrics of these two standards in terms of the number
of the smart meters which can be read during a certain time have been compared.
In [19], the authors discuss an end-to-end communication architecture for the smart grid. The
requirements for the communication system are described. High reliability and availability of the
communication system, high coverage and distances, capability to cover a large number of
communication nodes, communication security, and appropriate communication delay and
system responsiveness are considered to be the communication requirements for the smart grid. A
two-level hierarchical architecture for the smart grid is proposed in which an IP-based
environment for the backbone applications and an appropriate field level network for the
distributed communication entities are employed. To interconnect these two types of networks,
hiring access points (to ensure that the higher level network can talk with the lower level
network) and a combination of gateways and tunneling solutions are proposed. Then, the authors
describe different possible field-level network technologies for the smart grid and discuss the
advantages and disadvantages of each technology separately. They consider PLC as an
increasingly attractive possible solution to be used as a SGCN. It uses the existing power cabling
and moderate network elements are required but more complex technology is needed to overcome
poor PLC channel characteristics. The authors also consider wireless communication options such
as Global System for Mobile communication (GSM) and WiMAX as promising communication
alternatives. They have high coverage and low installation cost if the infrastructure already exists.
23
The authors in [19] mention the REMPLI project as one of the developed architectures which
uses PLC as the FAN. The goal in this project is to interconnect application servers and field-
level equipments in a way that still supports existing standards such as SCADA (Supervisory
Control and Data Acquisition Protocols) and metering protocols.
In [30], a PLC channel model based on OFDM system operating over low voltage powerlines is
presented. The characteristics of powerlines such as frequency selective, noise and time varying
noise are considered. In this model, a transceiver is developed for smart grid communication. In
the developed OFDM system, the authors try to maximize the user data rate by allocating a sub-
band with the highest SNR to the meter with the lowest total SNR. To evaluate the acquired
efficiency, the performance of each smart meter in terms of BER to the transmitted power has
been shown.
2.9 Electrical Infrastructure
An electrical grid is an interconnected network for delivering electricity from suppliers to
consumers. It consists of three main components: Transmission Network, Distribution Network
and Access Network.
Transmission Network: in this network, the generated high voltage power is transmitted long
distances over the transmission lines to the substations located in the city.
Distribution Network: through the transformers located in substations, the high voltage power
will be reduced to MV and is distributed all the way from substations to the transformers located
near the consumers.
Access Network: the MV power will be converted down in transformers and transmitted through
LV lines to the customer premises.
24
2.10 Powerline Communication
PowerLine Communication (PLC), or Powerline Digital Subscriber (PLDS), is a technology for
carrying data on the same conductor in which electricity passes through.
Usually, transformers act as low pass filters and do not allow digital carriers in high frequencies
to pass through the transformer. Therefore, a coupling capacitor is attached to the radio
transmitters at the transformers to carry higher frequencies.
2.10.1 Powerline Communication Topology
PLC systems operate by using a modulated carrier signal on the electrical wiring system.
Therefore, the PLC topology is the same as power grid topology. In the following sections,
firstly, power grid topology is described. After that, PLC topology is discussed in detail.
2.10.2 Power Grid Topology
Depending on the area and geographical conditions, different power grid topologies can be
considered. The most prevalent structure which is also the cheapest and simplest structure for a
distribution or transmission grid is a radial structure. This structure is in a tree shape where power
from a large supply radiates out into progressively lower voltage lines until the destination homes
and businesses are reached [31].
Figure 2-2 shows a typical instance of power grid topology. The information regarding this
topology is drawn from Utilities Kingston and Hydro One company. The Maximum distance
between smart meters and transformers are 350 m, and the maximum distance between
transformers and substations are 700 m [32].
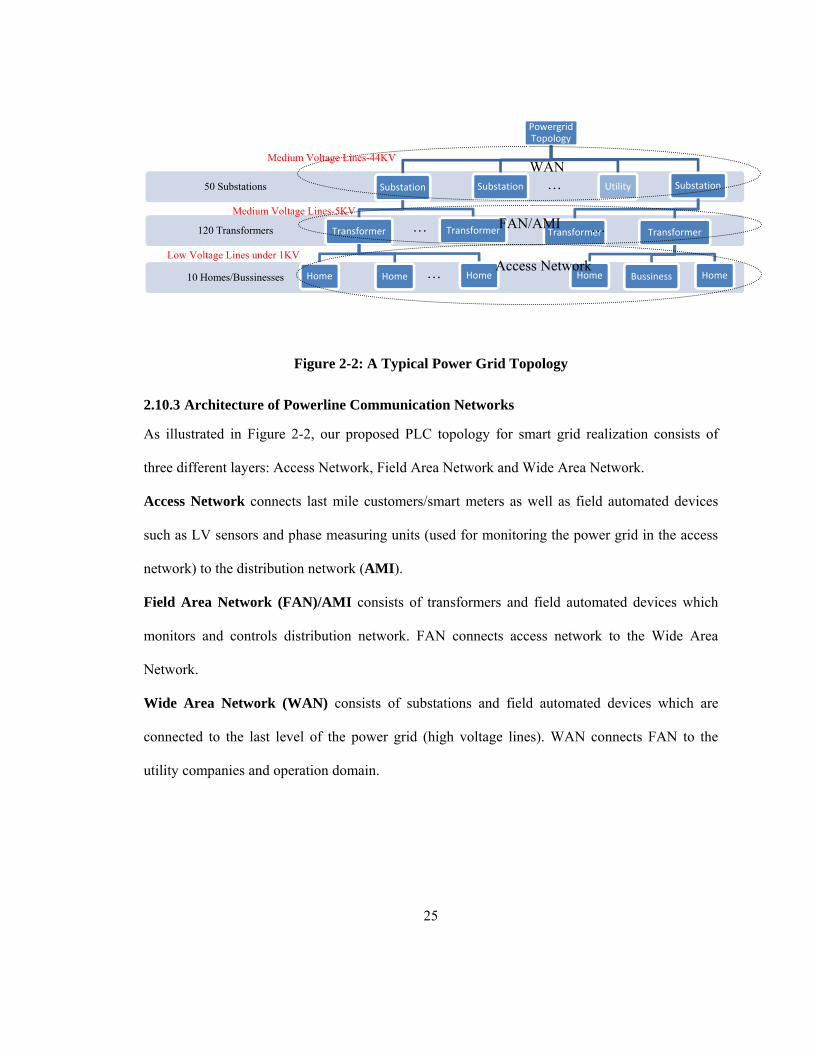
25
Figure 2-2: A Typical Power Grid Topology
2.10.3 Architecture of Powerline Communication Networks
As illustrated in Figure 2-2, our proposed PLC topology for smart grid realization consists of
three different layers: Access Network, Field Area Network and Wide Area Network.
Access Network connects last mile customers/smart meters as well as field automated devices
such as LV sensors and phase measuring units (used for monitoring the power grid in the access
network) to the distribution network (AMI).
Field Area Network (FAN)/AMI consists of transformers and field automated devices which
monitors and controls distribution network. FAN connects access network to the Wide Area
Network.
Wide Area Network (WAN) consists of substations and field automated devices which are
connected to the last level of the power grid (high voltage lines). WAN connects FAN to the
utility companies and operation domain.
10 Homes/Bussinesses
120 Transformers
50 Substations
Powergrid Topology
Substation
Transformer
Home Home Home
Transformer
Substation Utility Substation
Transformer Transformer
Home Bussiness Home
Low Voltage Lines under 1KV
Medium Voltage Lines-44KV
Medium Voltage Lines-5KV
…
…
…
…
Access Network
FAN/AMI
WAN
26
2.11 Powerline Communication Technologies
Different types of PLCs use different frequency bands and provide different data rates [33].
NBPLC and BPLC are two general standards for PLC. In the following sections, each standard is
discussed in detail.
2.11.1 NarrowBand PowerLine Communication (NBPLC)
NBPLC networks operate within the frequency range specified by the CENELEC norm providing
a frequency spectrum from 9 to 140 kHz for PLCs. CENELEC norm significantly differs from
American and Japanese standards, which specify a frequency range up to 500 kHz for the
application of PLC services.
CENELEC Narrowband Powerline Communication
CENELEC frequency range, 9 to 140 kHz, is divided into three bands: A (9-95 kHz), B (95-125
kHz) and C (125-140 kHz). Band A is to be used by the utilities. They use NBPLC for the
realization of energy-related services. Frequency bands B and C are mainly used for the
realization of building and home automation [6].
US FCC Narrowband Powerline Communication
American NBPLC allows a frequency spectrum usage of up to 500 kHz for the application of
PLC services. The Distribution Line Carrier (DLC) System technology used a frequency range of
9 to 500 kHz which provides data rate up to 576 kbit/s [34].
Narrowband Powerline Communication Modulation Schemes
Different modulation schemes such as Binary Phase-Shift Keying (BPSK), Differential
Quadrature Phase-Shift Keying (DQPSK) and Frequency-Shift Keying (FSK) can be applied on
NBPLC systems [6], [13]. It is mentioned that Amplitude Shift Keying (ASK) is not suitable for
PLC since it is not robust against disturbances [6]. Although, OFDM has been used as a
transmission modulation in BPL for a long time, recently, it is being used in NBPLC as well [13].
27
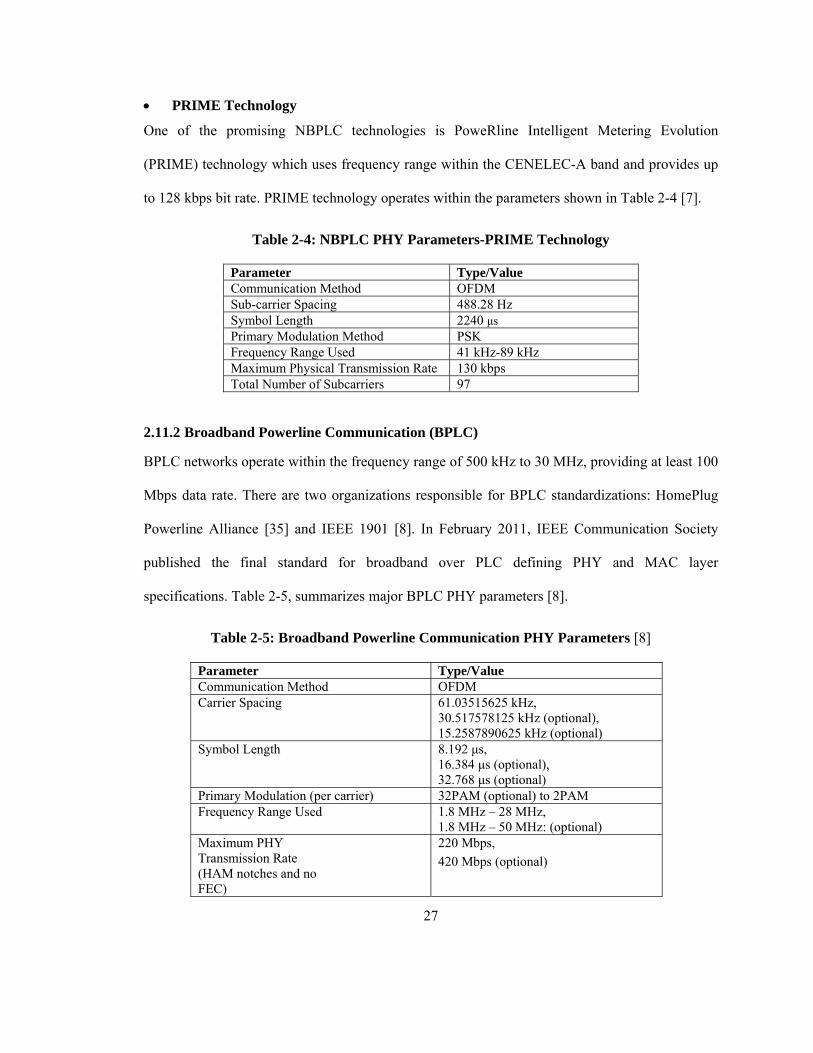
PRIME Technology
One of the promising NBPLC technologies is PoweRline Intelligent Metering Evolution
(PRIME) technology which uses frequency range within the CENELEC-A band and provides up
to 128 kbps bit rate. PRIME technology operates within the parameters shown in Table 2-4 [7].
Table 2-4: NBPLC PHY Parameters-PRIME Technology
Parameter Type/Value Communication Method OFDM Sub-carrier Spacing 488.28 Hz Symbol Length 2240 μs Primary Modulation Method PSK Frequency Range Used 41 kHz-89 kHz Maximum Physical Transmission Rate 130 kbps Total Number of Subcarriers 97
2.11.2 Broadband Powerline Communication (BPLC)
BPLC networks operate within the frequency range of 500 kHz to 30 MHz, providing at least 100
Mbps data rate. There are two organizations responsible for BPLC standardizations: HomePlug
Powerline Alliance [35] and IEEE 1901 [8]. In February 2011, IEEE Communication Society
published the final standard for broadband over PLC defining PHY and MAC layer
specifications. Table 2-5, summarizes major BPLC PHY parameters [8].
Table 2-5: Broadband Powerline Communication PHY Parameters [8]
Parameter Type/Value Communication Method OFDM Carrier Spacing 61.03515625 kHz,
30.517578125 kHz (optional), 15.2587890625 kHz (optional)
Symbol Length 8.192 μs, 16.384 μs (optional), 32.768 μs (optional)
Primary Modulation (per carrier) 32PAM (optional) to 2PAM Frequency Range Used 1.8 MHz – 28 MHz,
1.8 MHz – 50 MHz: (optional) Maximum PHY Transmission Rate (HAM notches and no FEC)
220 Mbps,
420 Mbps (optional)
28
2.12 Powerline Communication Channel Model
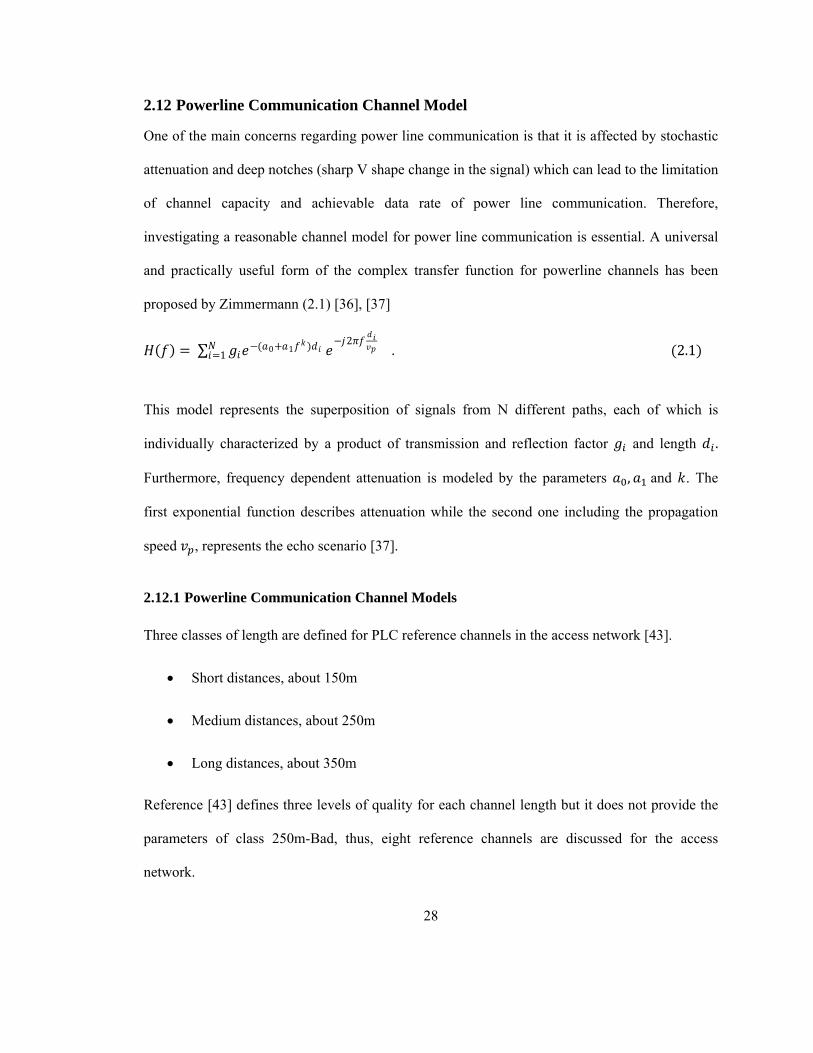
One of the main concerns regarding power line communication is that it is affected by stochastic
attenuation and deep notches (sharp V shape change in the signal) which can lead to the limitation
of channel capacity and achievable data rate of power line communication. Therefore,
investigating a reasonable channel model for power line communication is essential. A universal
and practically useful form of the complex transfer function for powerline channels has been
proposed by Zimmermann (2.1) [36], [37]
∑ 0 1 2
1 . 2.1
This model represents the superposition of signals from N different paths, each of which is
individually characterized by a product of transmission and reflection factor and length .
Furthermore, frequency dependent attenuation is modeled by the parameters , and . The
first exponential function describes attenuation while the second one including the propagation
speed , represents the echo scenario [37].
2.12.1 Powerline Communication Channel Models
Three classes of length are defined for PLC reference channels in the access network [43].
Short distances, about 150m
Medium distances, about 250m
Long distances, about 350m
Reference [43] defines three levels of quality for each channel length but it does not provide the
parameters of class 250m-Bad, thus, eight reference channels are discussed for the access
network.

29
In the following, each reference channel will be described. To study the effect of multipath, each
channel is modeled by specific number of paths. Reference [43] reports the required number of
paths for modeling each class. Signal propagation speed in media for all channels would be
81.53*10 /pv m s .
Class of Length 150m
Class of Length 150m-Good: This class is a channel without any branches. It provides a low
attenuation channel with low pass characteristics. Impulsive noise takes 1.5µs [43]. This is an
ideal channel.
Class of Length 150m-Medium: The second channel of this class shows a more distinct low
pass characteristic, and high frequency deep notches do not exist. Impulse response shows a very
complex behavior, thus 17 paths for modeling are required.
Class of Length 150m-Bad: The third reference channel has a similar attenuation as the
second channel, but shows frequency selective notches. The model deals with 15 paths.
Class of Length 250m
This class shows a more distinct low pass characteristic in comparison to the 150m channel
length and experiences higher attenuation.
Class of Length 250m-Good: The first reference channel of this class can be modeled by 14
paths.
Class of Length 250m-Medium: The second reference channel of this class shows a more
distinct low pass characteristic and can be modeled by 12 paths.
30
Class of Length 350m
Channels of this class suffer from higher attenuation and a very distinct low pass characteristic.
Class of Length 350m-Good: The first reference channel has few branches. Five paths are
sufficient to model this channel.
Class of Length 350m-Medium: The second reference channel of this class shows typical
notches at certain frequencies, and 13 paths were used for modeling this channel.
Class of Length 350m-Bad: The last reference channel of this class shows the most intense
low pass characteristic. It has a high attenuation in low frequency ranges. The model uses six
paths.
2.13 Noise in Powerline Communication
Powerlines are designed to be a transmission medium for electrical energy; therefore, they may
not be suitable media for data communication [6]. PLC suffers from noise generated by a variety
of electrical devices such as microwave ovens, vacuum cleaners as well as communicational
devices such as broadcast systems working at the same frequency range as BPLC devices
operates [8], [15]. PLC noises can be classified in four general categories [8], [15], [38]:
1. Colored background noise: this is a thermal Gaussian noise which can be approximated
by several white noises and is generated via electrical devices such as hair dryers and
computers using the powerlines.
2. Narrowband noise: this noise normally consists of modulated sinusoids, originated from
broadcast radio stations operating in high frequencies.
31
3. Impulsive noise: there are two types of impulsive noise: aperiodic and periodic noise.
Aperiodic noise is generated by transient switching gears and periodic ones are generated
by rectifier diodes, etc.
4. Multiple access interference: when some users share the same power link, multiple access
interference exists.
2.14 Bit Error Rate
OFDM is considered as one of the most promising modulation methods for powerline
communications [6]. OFDM has some desirable properties, which can be utilized properly in
order to mitigate the harsh characteristics of powerline channels [39]. Reference [40] reports that
the BER of a Quadrature Amplitude Modulation (QAM) scheme under Additive Gaussian Noise
Regime follows (2.2). Where M is the modulation level and 2kM when k is even. E is the
average symbol power and 0N is the noise power. Thus, if QAM modulation is used for each
subcarrier, we can express the average BER of an OFDM system with N subcarriers (assuming no
inter-carrier interference (ICI) and no inter symbol interference (ISI)) as (2.2) and (2.3) [39]
1
21
∑ 1 ,√
2
1 2.2
where
,√ 2 11
√
3 2
1 0 . 2.3
In (2.3), H is the channel transfer function of k subchannel. In low speed PLC, the BER has
been calculated using (2.2).
According to our calculations, presented in Section 3.2.2.2, and also according to [39], we
observe that the performance of BPLC using OFDM modulation without any kind of coding is
very poor and it has to tolerate high BER. Therefore, to make the use of BPLC practical, some

32
type of coding such as Golay coding [40] is needed to be combined with OFDM modulation. This
should result in lower BER in BPLC.
33
Chapter 3
Experimental System Configuration
3.1 Introduction
In this chapter, we explain how PLC and SGCN simulators are developed. Regarding PLC,
modeling its noisy environment, the MAC protocol and importing the BER into the NS-2 for both
BPLC and NBPLC are discussed. Considering SGCN, the considered system topology is shown.
Furthermore, the details of the data traffic models including both standard smart grid traffic
classes and future smart grid services are given.
3.2 Simulation Setup
PLC and a SGCN using powerline communication are simulated and developed using MATLAB
and NS-2. Before explaining how we develop the SGCN, we describe PLC simulation and the
simulation settings that are considered for developing PLC and a SGCN.
3.2.1 Developing PLC Model
To the best of our knowledge, there is no commercial simulator program capable of simulating
PLC. Therefore, we develop one using MATLAB and Network Simulator-2 (NS-2).
Most existing and suggested PLC MAC protocols are based on wireless MAC schemes such as
Carrier Sense Multiple Access/Collision Avoidance (CSMA/CA) and Time Division Multiple
Access (TDMA) and this is because there are some similarities between the powerline medium
and the wireless medium [8], [31]. Thus, CSMA/CA [41] has been chosen to be the MAC
protocol in our simulation.
34
According to the IEEE P1901TM 1 /D4.01 draft standard [8] which identifies MAC and PHY
layer specifications for broadband over power line communications, the PLC MAC frame format
would be very similar to the Ethernet frame format. Since the Ethernet MAC protocol is derived
from Carrier Sense Multiple Access/Collision Detection (CSMA/CD) [42] and the frame formats
of PLC are similar to Ethernet frame formats, MAC802.3 is considered as the fundamental layer
of the PLC MAC protocol in our simulation, and the code is modified to act as CSMA/CA and
follows PLC properties. Since sending RTS and CTS in CSMA/CA protocol will increase the
system overhead, in our simulation, we do not use them. To enable CSMA/CD to emulate
CSMA/CA, whenever a node finds the channel as idle, it will wait for a random backoff time and
if after the backoff time it still finds the channel as idle, it will send its packet to the channel. This
method will decrease the collision probability to almost zero.
As mentioned earlier, modified Ethernet links are used. What makes powerlines different from
standard Ethernet cables is the noisy environment of powerline channels. To make Ethernet links
similar to the powerline channels, PLC BERs are calculated and imported to the system.
35
3.2.2 Importing BER into the Simulation
3.2.2.1 BER in Narrowband PLC
In our study, to model powerline channels using MATLAB, Zimmermann’s method (refer to
Section 2.12) is used [36]. Wherever we use NBPLC, the BERs are calculated using Equation
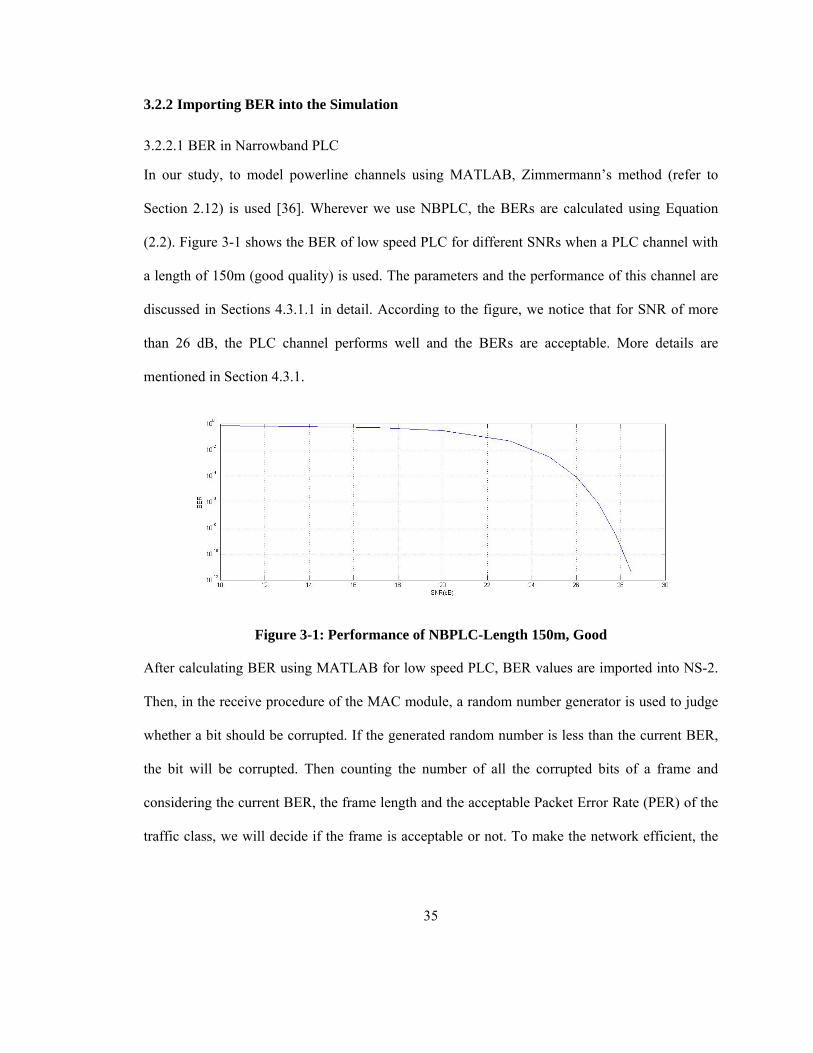
(2.2). Figure 3-1 shows the BER of low speed PLC for different SNRs when a PLC channel with
a length of 150m (good quality) is used. The parameters and the performance of this channel are
discussed in Sections 4.3.1.1 in detail. According to the figure, we notice that for SNR of more
than 26 dB, the PLC channel performs well and the BERs are acceptable. More details are
mentioned in Section 4.3.1.
Figure 3-1: Performance of NBPLC-Length 150m, Good
After calculating BER using MATLAB for low speed PLC, BER values are imported into NS-2.
Then, in the receive procedure of the MAC module, a random number generator is used to judge
whether a bit should be corrupted. If the generated random number is less than the current BER,
the bit will be corrupted. Then counting the number of all the corrupted bits of a frame and
considering the current BER, the frame length and the acceptable Packet Error Rate (PER) of the
traffic class, we will decide if the frame is acceptable or not. To make the network efficient, the
36
percentage of error in each packet will be measured at each switch and if it is more than the
acceptable error rate, the packet will be dropped immediately.
3.2.2.2 BER in Broadband PLC
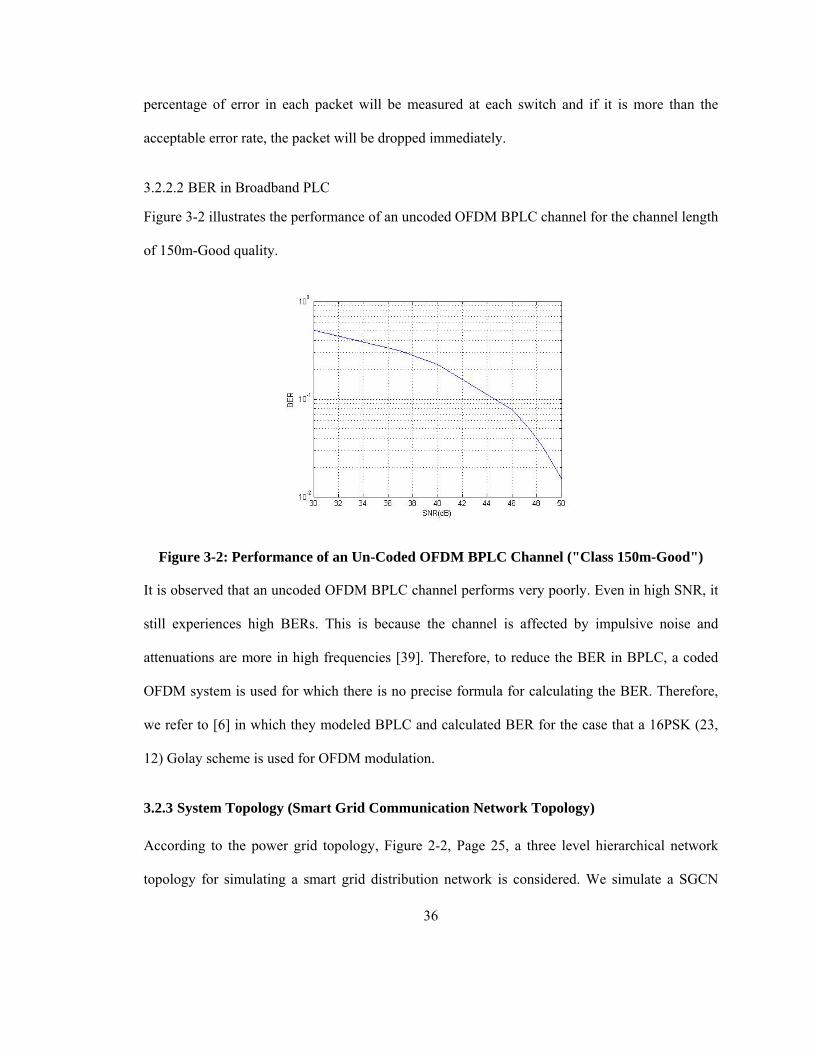
Figure 3-2 illustrates the performance of an uncoded OFDM BPLC channel for the channel length
of 150m-Good quality.
Figure 3-2: Performance of an Un-Coded OFDM BPLC Channel ("Class 150m-Good")
It is observed that an uncoded OFDM BPLC channel performs very poorly. Even in high SNR, it
still experiences high BERs. This is because the channel is affected by impulsive noise and
attenuations are more in high frequencies [39]. Therefore, to reduce the BER in BPLC, a coded
OFDM system is used for which there is no precise formula for calculating the BER. Therefore,
we refer to [6] in which they modeled BPLC and calculated BER for the case that a 16PSK (23,
12) Golay scheme is used for OFDM modulation.
3.2.3 System Topology (Smart Grid Communication Network Topology)
According to the power grid topology, Figure 2-2, Page 25, a three level hierarchical network
topology for simulating a smart grid distribution network is considered. We simulate a SGCN
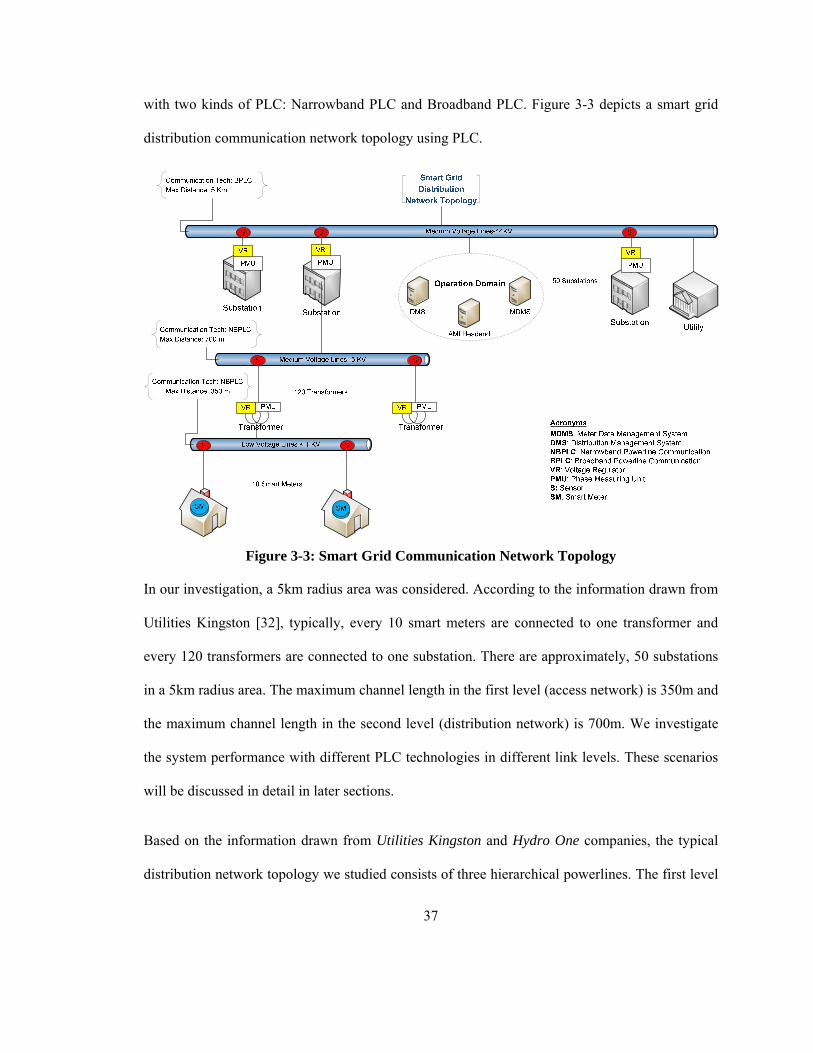
37
with two kinds of PLC: Narrowband PLC and Broadband PLC. Figure 3-3 depicts a smart grid
distribution communication network topology using PLC.
Figure 3-3: Smart Grid Communication Network Topology
In our investigation, a 5km radius area was considered. According to the information drawn from
Utilities Kingston [32], typically, every 10 smart meters are connected to one transformer and
every 120 transformers are connected to one substation. There are approximately, 50 substations
in a 5km radius area. The maximum channel length in the first level (access network) is 350m and
the maximum channel length in the second level (distribution network) is 700m. We investigate
the system performance with different PLC technologies in different link levels. These scenarios
will be discussed in detail in later sections.
Based on the information drawn from Utilities Kingston and Hydro One companies, the typical
distribution network topology we studied consists of three hierarchical powerlines. The first level
38
of the topology (access network) connects last mile customers/smart meters as well as field
automated devices (such as low voltage sensors and phase measuring units) which are linked to
the LV lines to the MV lines. The second level of the topology (FAN) connects all the devices
(including transformers and field automated devices such as phase measuring units, voltage
regulators and feeder sensors) connected to the MV line to the high voltage line. The third level
of the topology (WAN) connects substations and field automated devices (used for monitoring
substations and the electrical devices linked to the high voltage line) connected to the high
voltage line to the operation domain and utility company.
The main traffic generators and receivers in the SGCN are Feeder sensors, voltage regulators,
PMUs, transformers, smart meters, substations, utility and the operation domain. There is two-
way data traffic between utility, operation domain, field automated devices and smart meters
sending commands or measured data. A complete list of data traffic which has been applied to the
system is provided in the following sections.
3.2.4 Summary of System Setup
According to the IEEE P1901TM 1 /D4.01 draft standard [8] the BPLC link speed is considered
to be 100Mbps and according to the PRIME standard, the NBPLC link speed is considered to be
128 kbps [7].
All the scenarios have been run for 3600 seconds. Each scenario is carried out on 1 substation,
120 transformers and 1200 smart meters. In addition to the mentioned devices, some field
automated devices are required for monitoring the power grid (Listed in Chapter 2). Among all
field automated devices, LV feeder sensors, MV feeder sensors, phase measuring units and
voltage regulators are identified to be the main traffic generators. Table 3-1 gives the list of field
automated devices which are considered in simulating the SGCN. Therefore, 1200 low voltage

39
feeder sensors (equal to the number of customers), 120 MV sensors (equal to the number of
transformers), 1321 PMUs (1 substation, 120 transformers and 1200 customers) and 1320 voltage
regulators (120 transformers and 1200 customers) are added to the network.
Table 3-1: Attached Field Automated Devices to the SGCN15
15 Data is obtained from references [16], [50].
Distribution
Automated
Device
Attached to/
Place on
Power Grid
Definition
Feeder Voltage
Regulator
Transformers
and
Substations
This device is an adjustable ratio transformer placed at
strategic points in a distribution grid and is utilized to
better manage and control the voltage as it changes
along the distribution feeder.
Feeder Medium
Voltage Line
Sensor
Transformers
and
Substations
A device used to measure and report electrical
properties (such as voltage, current, phase angle or
power factor, etc.) on a medium voltage distribution
line.
Feeder Low
Voltage Line
Sensor
Homes A device used to measure and report electrical
properties (such as voltage, current, phase angle or
power factor, etc.) at a low voltage customer delivery
point.
Transformer (MV
to LV)
Transformers
(MV to LV)
A standard point of delivery transformer. In the smart
grid context it is presumed there will be a need to
measure some electrical or physical characteristics of
this transformer such as voltage (high and/or low side)
current, MV load, temperature, etc.
Phase Measuring
Unit (PMU)
Transformers
and
Substations
A device capable of measuring the phase of the voltage
or current waveform relative to a reference.
40
NBPLC PHY parameters follow the PRIME technology standard ( 2.11). BPLC PHY parameters
are based on the IEEE 1901 Draft Standard ( 2.11.2). Since in our study, the maximum channel
length in the first level of the topology is 350m, parameters of this channel are considered for
modeling NBPLC and calculating BER in NBPLC.
3.2.5 Traffic Model
Among the traffic mentioned in Chapter II, 14 essential traffic types, illustrated in Table 3-2, are
distinguished and applied into the simulated topology, Figure 3-3. This essential traffic generates
many packets quickly and/or has restrictive QoS requirements. To account for other kinds of
traffic, 30% background traffic is added to the system. The properties of each traffic class such as
the acceptable traffic latencies are drawn from Open SG documents [16]. According to these
documents, all traffic types are generated in a constant bit rate.
The NBPLC PHY layer parameters follow the PRIME technology. The PRIME PHY layer uses
OFDM modulation along with FEC and data interleaving that ultimately allow for robust high
speed communication over powerlines. Thus, an acceptable PER has been defined for each traffic
class in Table 3-2.
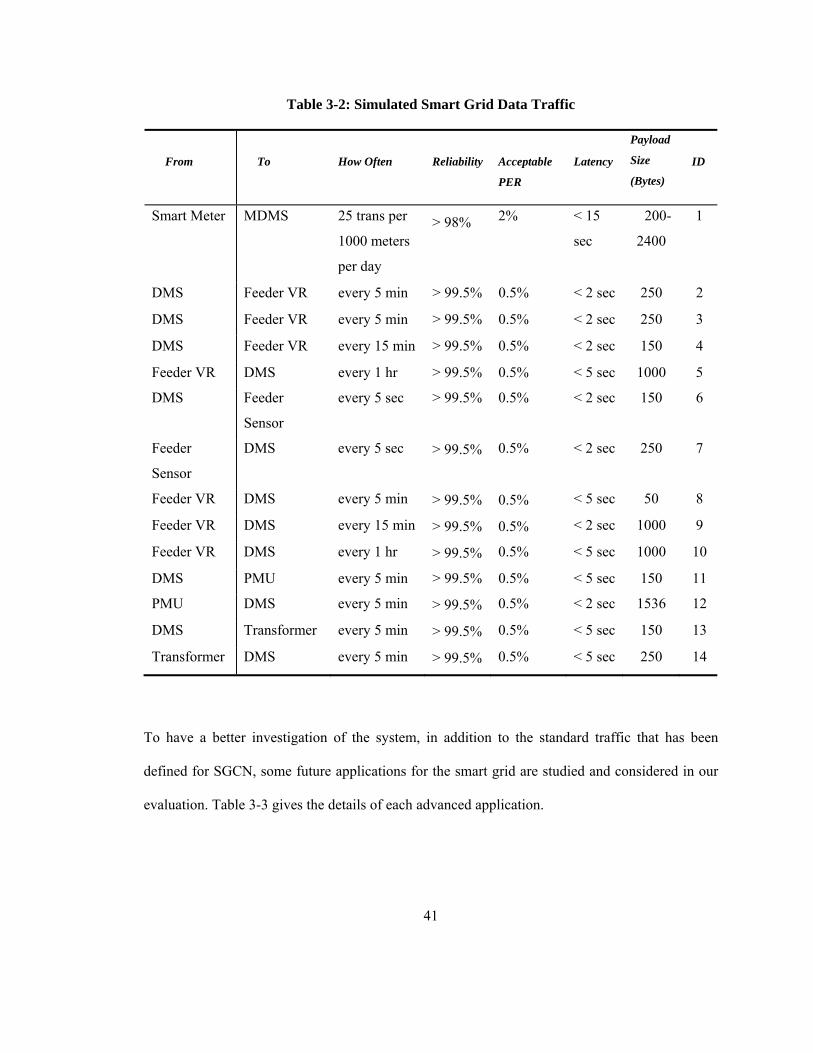
41
Table 3-2: Simulated Smart Grid Data Traffic
To have a better investigation of the system, in addition to the standard traffic that has been
defined for SGCN, some future applications for the smart grid are studied and considered in our
evaluation. Table 3-3 gives the details of each advanced application.
From
To
How Often
Reliability
Acceptable
PER
Latency
Payload
Size
(Bytes)
ID
Smart Meter MDMS 25 trans per
1000 meters
per day
> 98% 2%
< 15
sec
200-
2400
1
DMS Feeder VR every 5 min > 99.5% 0.5% < 2 sec 250 2
DMS Feeder VR every 5 min > 99.5% 0.5% < 2 sec 250 3
DMS Feeder VR every 15 min > 99.5% 0.5% < 2 sec 150 4
Feeder VR DMS every 1 hr > 99.5% 0.5% < 5 sec 1000 5
DMS Feeder
Sensor
every 5 sec > 99.5% 0.5% < 2 sec 150 6
Feeder
Sensor
DMS every 5 sec > 99.5% 0.5% < 2 sec 250 7
Feeder VR DMS every 5 min > 99.5% 0.5% < 5 sec 50 8
Feeder VR DMS every 15 min > 99.5% 0.5% < 2 sec 1000 9
Feeder VR DMS every 1 hr > 99.5% 0.5% < 5 sec 1000 10
DMS PMU every 5 min > 99.5% 0.5% < 5 sec 150 11
PMU DMS every 5 min > 99.5% 0.5% < 2 sec 1536 12
DMS Transformer every 5 min > 99.5% 0.5% < 5 sec 150 13
Transformer DMS every 5 min > 99.5% 0.5% < 5 sec 250 14
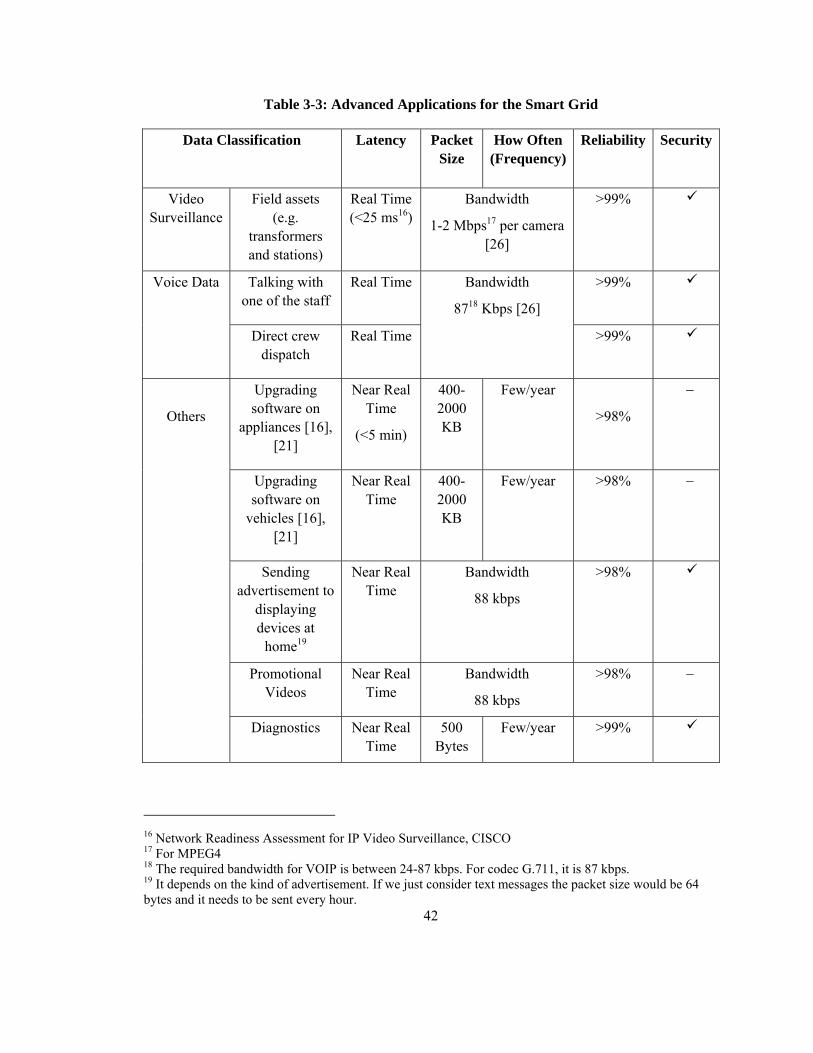
42
Table 3-3: Advanced Applications for the Smart Grid
Data Classification Latency Packet Size
How Often (Frequency)
Reliability Security
Video Surveillance
Field assets (e.g.
transformers and stations)
Real Time (<25 ms16)
Bandwidth
1-2 Mbps17 per camera [26]
>99%
Voice Data Talking with one of the staff
Real Time Bandwidth
8718 Kbps [26]
>99%
Direct crew dispatch
Real Time >99%
Others
Upgrading software on
appliances [16], [21]
Near Real Time
(<5 min)
400-2000 KB
Few/year
>98%
Upgrading software on
vehicles [16], [21]
Near Real Time
400-2000 KB
Few/year
>98%
Sending advertisement to
displaying devices at
home19
Near Real Time
Bandwidth
88 kbps
>98%
Promotional Videos
Near Real Time
Bandwidth
88 kbps
>98%
Diagnostics Near Real Time
500 Bytes
Few/year >99%
16 Network Readiness Assessment for IP Video Surveillance, CISCO 17 For MPEG4 18 The required bandwidth for VOIP is between 24-87 kbps. For codec G.711, it is 87 kbps. 19 It depends on the kind of advertisement. If we just consider text messages the packet size would be 64 bytes and it needs to be sent every hour.
43
According to the Trilliant company website, there is a potential need of conducting video
surveillance over power grid assets, particularly substations. This is because remote substations
are subject to tampering, vandalism or terrorism [44]. Therefore, a live video surveillance from
substation facilities is needed. From a communications perspective, not only do substations
require significant bandwidth for live video feeds, they also require latency-sensitive and always-
on connectivity to enable real-time monitoring [44].
In addition to the monitoring of substation facilities, it is important to monitor the status of
reclosers/circuit breakers which are attached to the branches. Therefore, when there is a fault in
the circuit, crews can monitor the status of the recloser remotely and change its state without
going to the location. It has been proposed that camera sensors at reclosers will only be activated
when there is a fault to the system.
There are three kinds of traffic that should be transmitted through the SGCN: video traffic, voice
traffic, and data traffic. The main and prevalent kind of traffic in a SGCN is data traffic. Hence,
high reliability and low latency are required for most of the traffic. Voice and video traffic is
required for implementing future smart grid applications.
VoIP Traffic
The Voice over Internet Protocol (VoIP) traffic we apply to our system is the G.711 codec which
generates 87kbps data rate. The payload size is 160Bytes which is generated at a constant rate
every 20ms. The information for voice traffic was obtained from [26]. We assume that at each
time 10% of customers are talking with the staff.
44
Video Traffic
The information for video surveillance was obtained from CISCO [25]. Each camera sensor,
using MPEG4 coding, generates at least 2 Mbps data traffic. Camera sensors with 2 Mbps data
rates are considered in the simulation. Packets are generated at a constant rate with a packet
length of 1400 bytes every 6 ms.
FTP Traffic
Upgrading software does not need strict latency. Therefore, its packets are generated in a best
effort traffic type. FTP traffic, as a best effort traffic type is used to simulate the packet
generation of upgrading software. The packet size is considered to be 1000 bytes.
Data Traffic
According to Table 3-2, all data traffic is generated in a constant bit rate. Low latency and high
reliability are the essential data traffic requirements in a SGCN. For reliable communication, TCP
connections are considered for all kinds of traffic. In Section 4.3, the delay for each traffic class is
measured. In addition, the provided reliability in each PLC infrastructure is evaluated.
45
Chapter 4
Performance Evaluation
4.1 Introduction
This chapter provides the experimental work done to evaluate the performance of PLC for the
smart grid. The results obtained from the experiments conducted using MATLAB and Network
Simulator-2 (NS-2) are discussed as well.
The metrics used for performance evaluation include BER, latency, reliability, loss, good
throughput and cost. Through the experiments, the performance of different PLC channels for the
smart grid is evaluated. Then, a viable PLC infrastructure is proposed. Furthermore, to have a
long-term view of the system, some advanced applications for the smart grid are investigated and
imported to the system. The performance of the proposed PLC infrastructure under advanced
smart grid applications is studied. Finally, a brief discussion of the cost estimation for the
proposed PLC infrastructure in terms of the PLC modems as well as the viability of WiMAX
technology for smart grid realization is provided.
4.2 Performance Metrics
In this section, all the performance metrics used for evaluations are defined.
Packet Latency: The latency of a packet is measured from the time the packet is enqueued in the
transmitter node queue to the time the packet is received by its destination. To calculate latency,
send and receive times are read for each packet ID and the difference is considered as the packet
latency. For each traffic class, a flow ID is considered. All the packets from the same traffic class
carry this ID. The average latency of all the packets having the same traffic class ID is calculated
and considered as the average latency of the traffic class.

46
By calculating average packet latency of each traffic class, we can conclude whether the studied
infrastructure can satisfy the latency requirement of each traffic class. As the average latency is
not a good representative of the required packet latency, “Reliability” is defined as well.
Reliability: Reliability for each traffic class is defined as the total number of packets received
correctly at the supposed destination before the accepted latency. To measure reliability
percentage, the total number of packets which have been lost or received at the destination after
the accepted latency is calculated. The summation of lost packets and received packets after the
accepted latency is divided by the total number of packets which have been sent in a specific
traffic class. The obtained value will be subtracted from one and then multiplied by 100.
Consequently, we have the reliability percentage of the traffic class.
1
∗ 100%
Calculating the reliability percentage for each traffic class will help us to compare it with the
required reliability percentage for each traffic class and then estimate how efficient each
infrastructure or technology is for smart grid implementation.
Loss Percentage: The percentage of the packets that have been sent but never received at the
destination is considered as the loss percentage. This value is used in the reliability percentage
calculation.
Good Throughput: Defined as the total number of bits received at the destination during the
simulation time divided by the simulation time. Since it does not include retransmissions, it
represents good throughput.
47
Cost: One of the important factors for comparing different possible infrastructures for SGCN
implementation. To calculate PLC infrastructure cost, since powerlines already exist, the cost of
NBPLC and BPLC modems are considered.
Bit Error Rate: To investigate the performance of different powerline channels for smart grid
realization, their BERs versus the SNR for QAM and PSK modulations are calculated.
4.3 Simulation Results
We look at the following aspects of the system performance under different scenarios. These
include:
Finding a viable combination of PLC technologies for smart grid realization: To find out
the best PLC infrastructure for smart grid realization, different combinations of PLC
topologies are considered. As mentioned earlier, latency and reliability are considered as
the main QoS requirements for smart grid. Therefore, to check the viability of each
infrastructure, packet latency and reliability are measured for several traffic classes and
compared with the smart grid requirements.
Investigating the system performance applying future smart grid traffic to the system.
Investigating the system performance under different PLC channel conditions.
The results obtained from the experiments are analyzed and discussed in the following sections.
4.3.1 Studying the Performance of Different PLC Channel Models for the Smart Grid
Here we investigate which PLC channel conditions can satisfy smart grid PLC communication
network requirements. There are three different channel lengths with three channel qualities for
each of the PLC classes (explained in Section 2.12.1). The parameters for one of the PLC cases
are not specified, therefore, 8 PLC channel models are studied. To study the performance of each
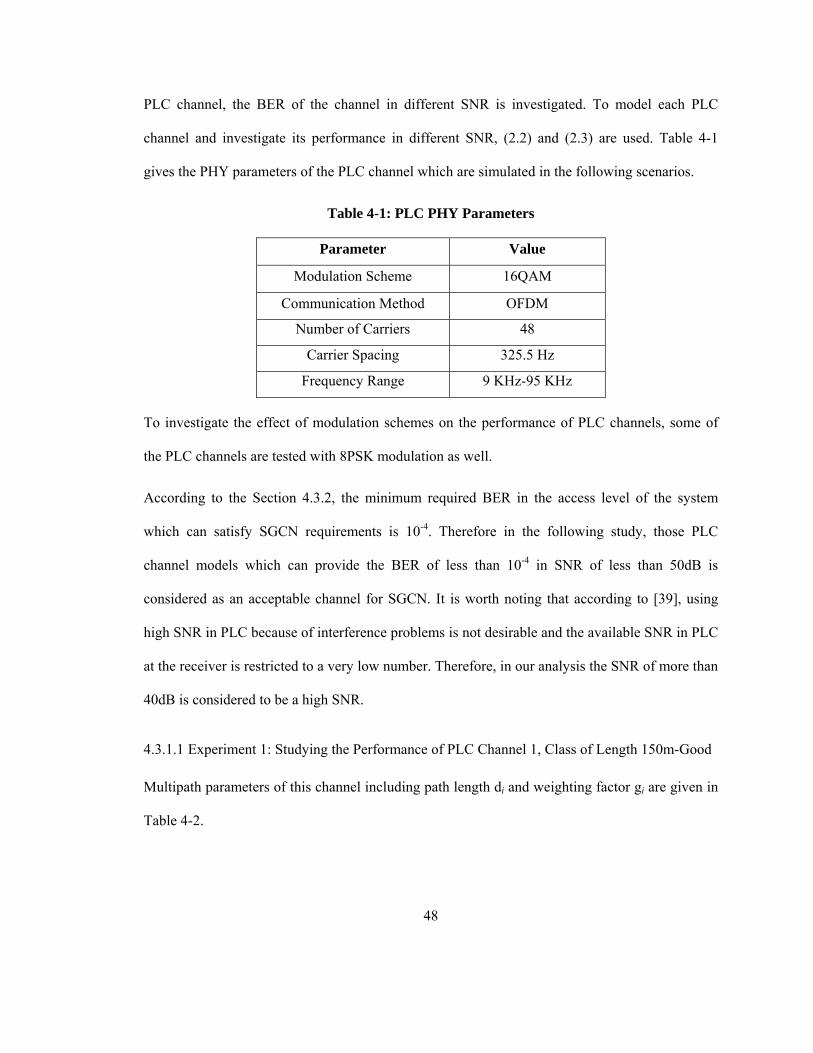
48
PLC channel, the BER of the channel in different SNR is investigated. To model each PLC
channel and investigate its performance in different SNR, (2.2) and (2.3) are used. Table 4-1
gives the PHY parameters of the PLC channel which are simulated in the following scenarios.
Table 4-1: PLC PHY Parameters
Parameter Value
Modulation Scheme 16QAM
Communication Method OFDM
Number of Carriers 48
Carrier Spacing 325.5 Hz
Frequency Range 9 KHz-95 KHz
To investigate the effect of modulation schemes on the performance of PLC channels, some of
the PLC channels are tested with 8PSK modulation as well.
According to the Section 4.3.2, the minimum required BER in the access level of the system
which can satisfy SGCN requirements is 10-4. Therefore in the following study, those PLC
channel models which can provide the BER of less than 10-4 in SNR of less than 50dB is
considered as an acceptable channel for SGCN. It is worth noting that according to [39], using
high SNR in PLC because of interference problems is not desirable and the available SNR in PLC
at the receiver is restricted to a very low number. Therefore, in our analysis the SNR of more than
40dB is considered to be a high SNR.
4.3.1.1 Experiment 1: Studying the Performance of PLC Channel 1, Class of Length 150m-Good
Multipath parameters of this channel including path length di and weighting factor gi are given in
Table 4-2.
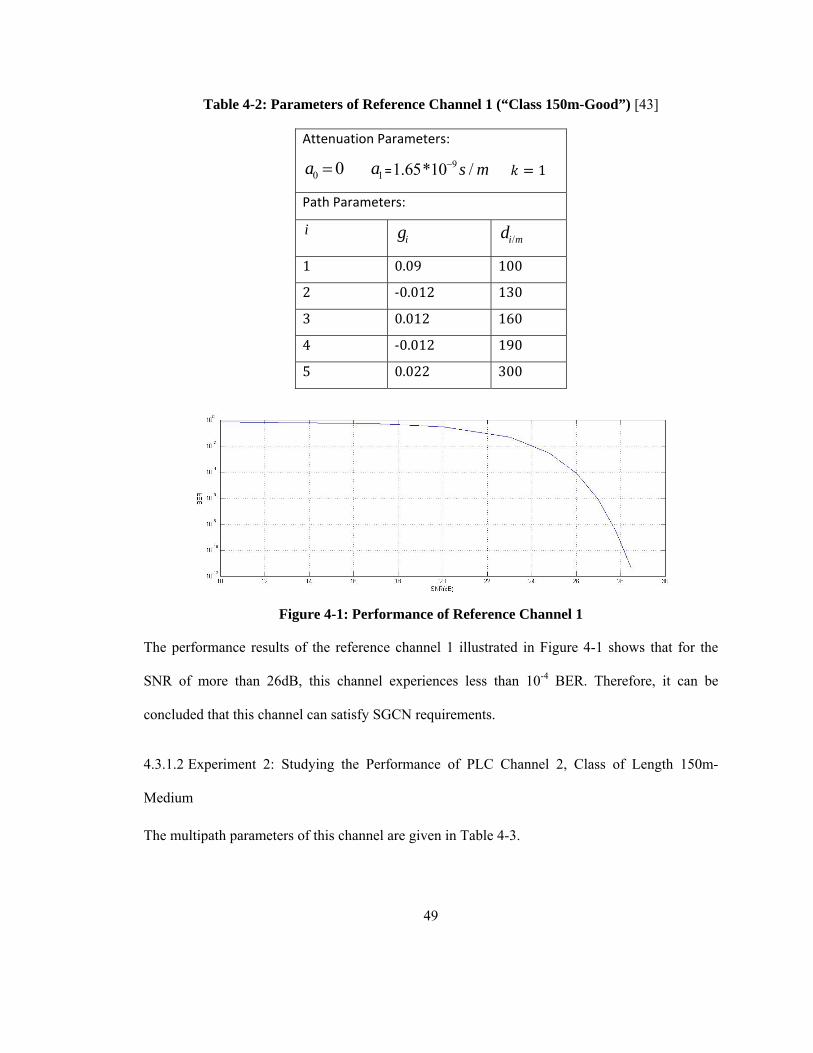
49
Table 4-2: Parameters of Reference Channel 1 (“Class 150m-Good”) [43]
Attenuation Parameters:
0 0a 1a =91.65*10 /s m
1
Path Parameters:
i ig /i md
1 0.09 100
2 ‐0.012 130
3 0.012 160
4 ‐0.012 190
5 0.022 300
Figure 4-1: Performance of Reference Channel 1
The performance results of the reference channel 1 illustrated in Figure 4-1 shows that for the
SNR of more than 26dB, this channel experiences less than 10-4 BER. Therefore, it can be
concluded that this channel can satisfy SGCN requirements.
4.3.1.2 Experiment 2: Studying the Performance of PLC Channel 2, Class of Length 150m-
Medium
The multipath parameters of this channel are given in Table 4-3.
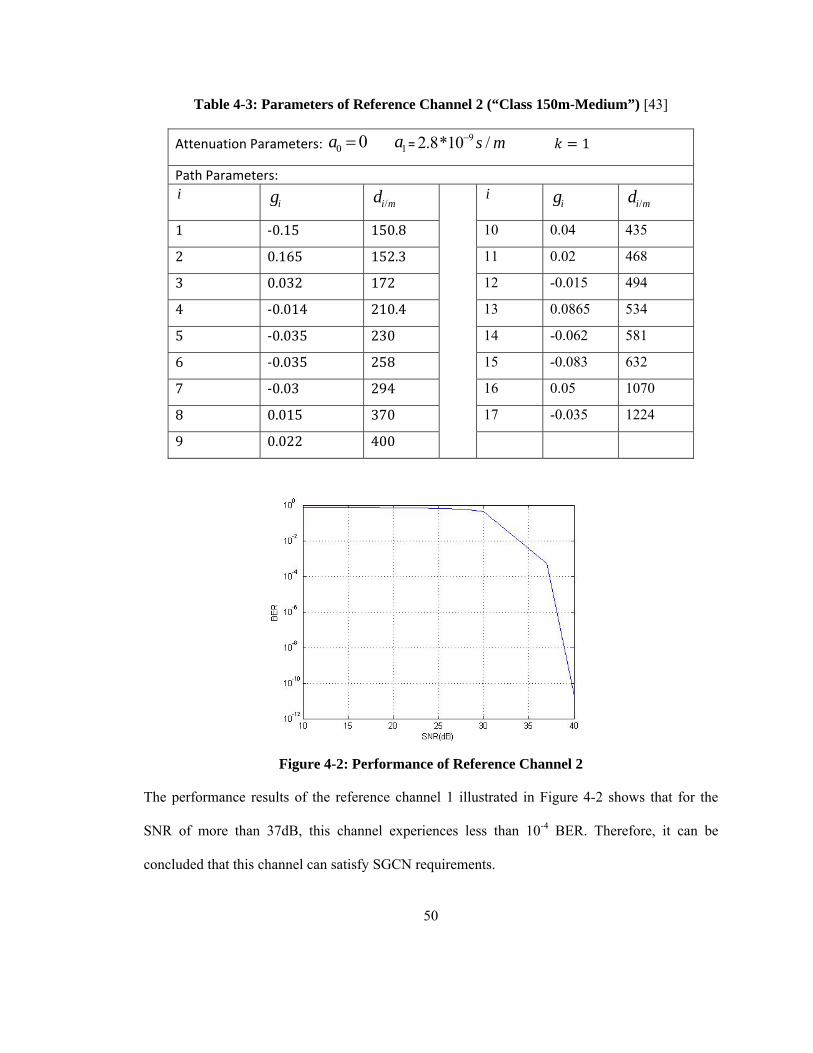
50
Table 4-3: Parameters of Reference Channel 2 (“Class 150m-Medium”) [43]
Attenuation Parameters: 0 0a 1a =92.8*10 /s m
1
Path Parameters: i
ig /i md iig /i md
1 ‐0.15 150.8 10 0.04 435
2 0.165 152.3 11 0.02 468
3 0.032 172 12 -0.015 494
4 ‐0.014 210.4 13 0.0865 534
5 ‐0.035 230 14 -0.062 581
6 ‐0.035 258 15 -0.083 632
7 ‐0.03 294 16 0.05 1070
8 0.015 370 17 -0.035 1224
9 0.022 400
Figure 4-2: Performance of Reference Channel 2
The performance results of the reference channel 1 illustrated in Figure 4-2 shows that for the
SNR of more than 37dB, this channel experiences less than 10-4 BER. Therefore, it can be
concluded that this channel can satisfy SGCN requirements.
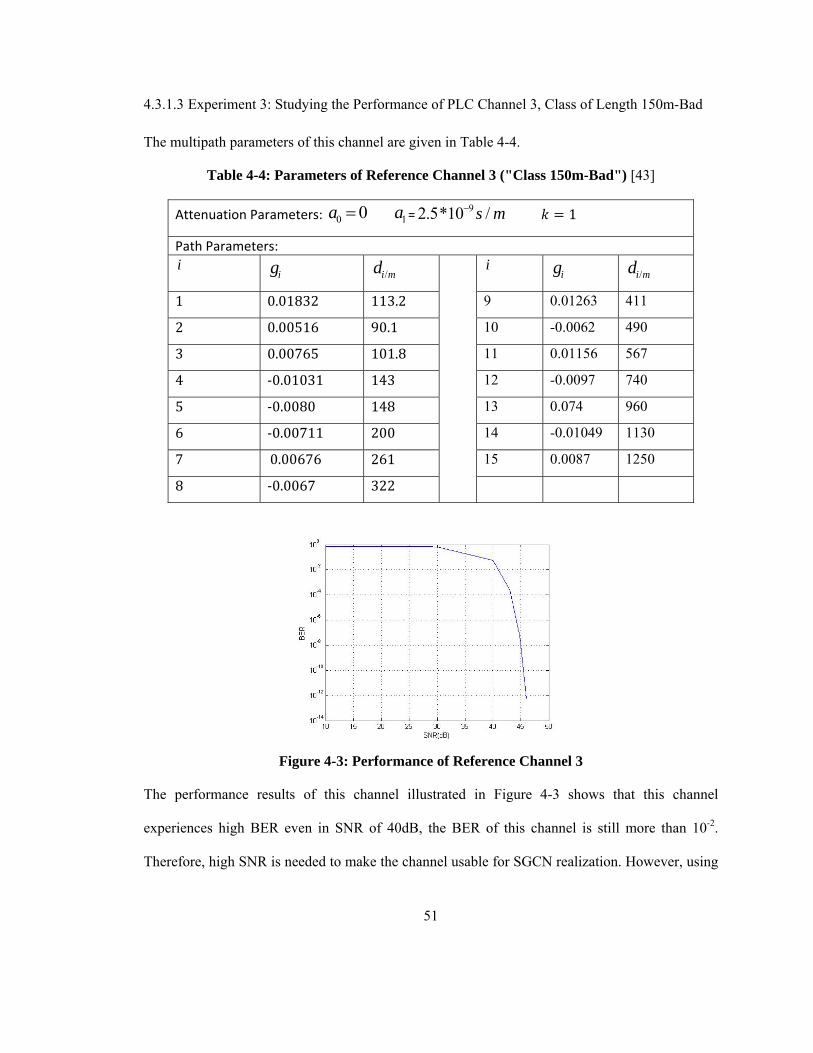
51
4.3.1.3 Experiment 3: Studying the Performance of PLC Channel 3, Class of Length 150m-Bad
The multipath parameters of this channel are given in Table 4-4.
Table 4-4: Parameters of Reference Channel 3 ("Class 150m-Bad") [43]
Attenuation Parameters: 0 0a 1a =92.5*10 /s m
1
Path Parameters: i
ig /i md iig /i md
1 0.01832 113.2 9 0.01263 411
2 0.00516 90.1 10 -0.0062 490
3 0.00765 101.8 11 0.01156 567
4 ‐0.01031 143 12 -0.0097 740
5 ‐0.0080 148 13 0.074 960
6 ‐0.00711 200 14 -0.01049 1130
7 0.00676 261 15 0.0087 1250
8 ‐0.0067 322
Figure 4-3: Performance of Reference Channel 3
The performance results of this channel illustrated in Figure 4-3 shows that this channel
experiences high BER even in SNR of 40dB, the BER of this channel is still more than 10-2.
Therefore, high SNR is needed to make the channel usable for SGCN realization. However, using
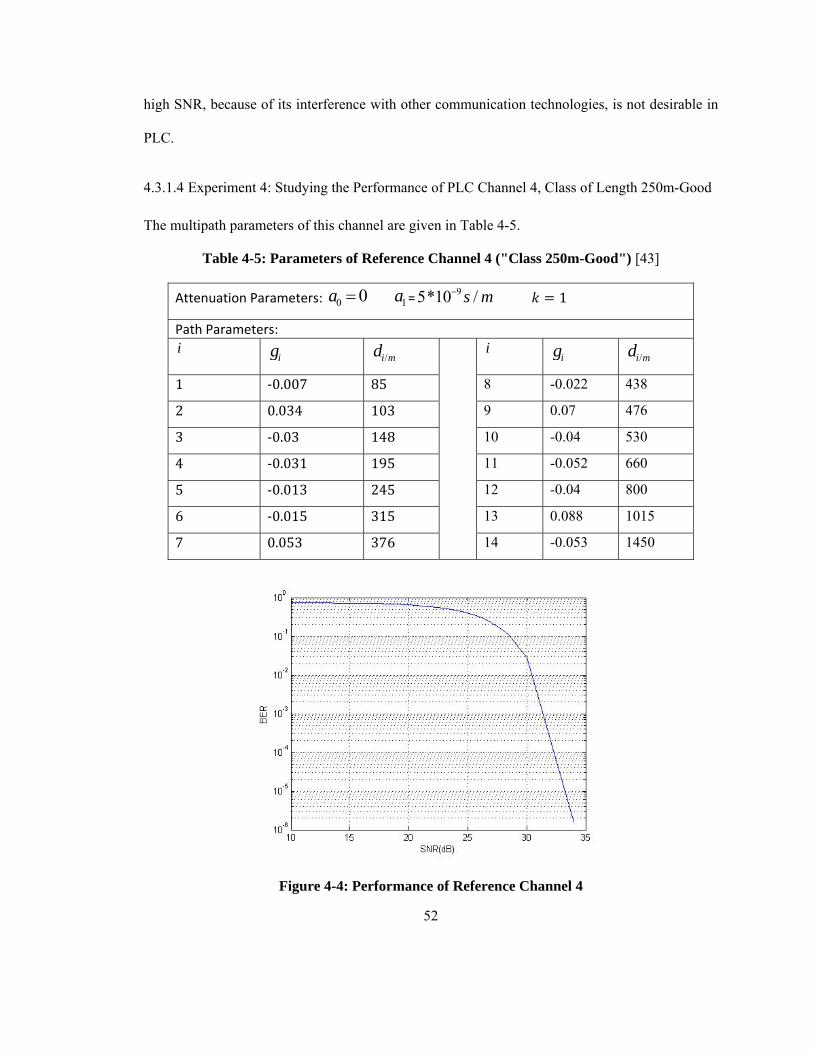
52
high SNR, because of its interference with other communication technologies, is not desirable in
PLC.
4.3.1.4 Experiment 4: Studying the Performance of PLC Channel 4, Class of Length 250m-Good
The multipath parameters of this channel are given in Table 4-5.
Table 4-5: Parameters of Reference Channel 4 ("Class 250m-Good") [43]
Attenuation Parameters: 0 0a 1a =95*10 /s m
1
Path Parameters: i
ig /i md iig /i md
1 ‐0.007 85 8 -0.022 438
2 0.034 103 9 0.07 476
3 ‐0.03 148 10 -0.04 530
4 ‐0.031 195 11 -0.052 660
5 ‐0.013 245 12 -0.04 800
6 ‐0.015 315 13 0.088 1015
7 0.053 376 14 -0.053 1450
Figure 4-4: Performance of Reference Channel 4
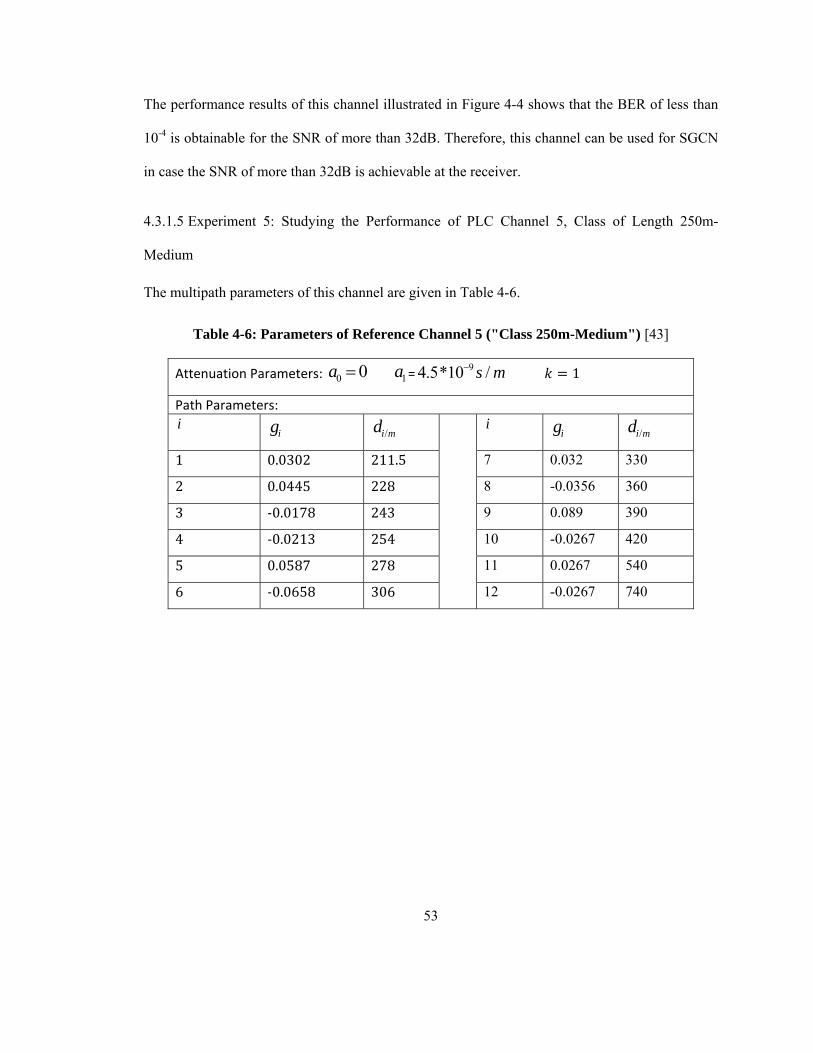
53
The performance results of this channel illustrated in Figure 4-4 shows that the BER of less than
10-4 is obtainable for the SNR of more than 32dB. Therefore, this channel can be used for SGCN
in case the SNR of more than 32dB is achievable at the receiver.
4.3.1.5 Experiment 5: Studying the Performance of PLC Channel 5, Class of Length 250m-
Medium
The multipath parameters of this channel are given in Table 4-6.
Table 4-6: Parameters of Reference Channel 5 ("Class 250m-Medium") [43]
Attenuation Parameters: 0 0a 1a =94.5*10 /s m
1
Path Parameters: i
ig /i md iig /i md
1 0.0302 211.5 7 0.032 330
2 0.0445 228 8 -0.0356 360
3 ‐0.0178 243 9 0.089 390
4 ‐0.0213 254 10 -0.0267 420
5 0.0587 278 11 0.0267 540
6 ‐0.0658 306 12 -0.0267 740
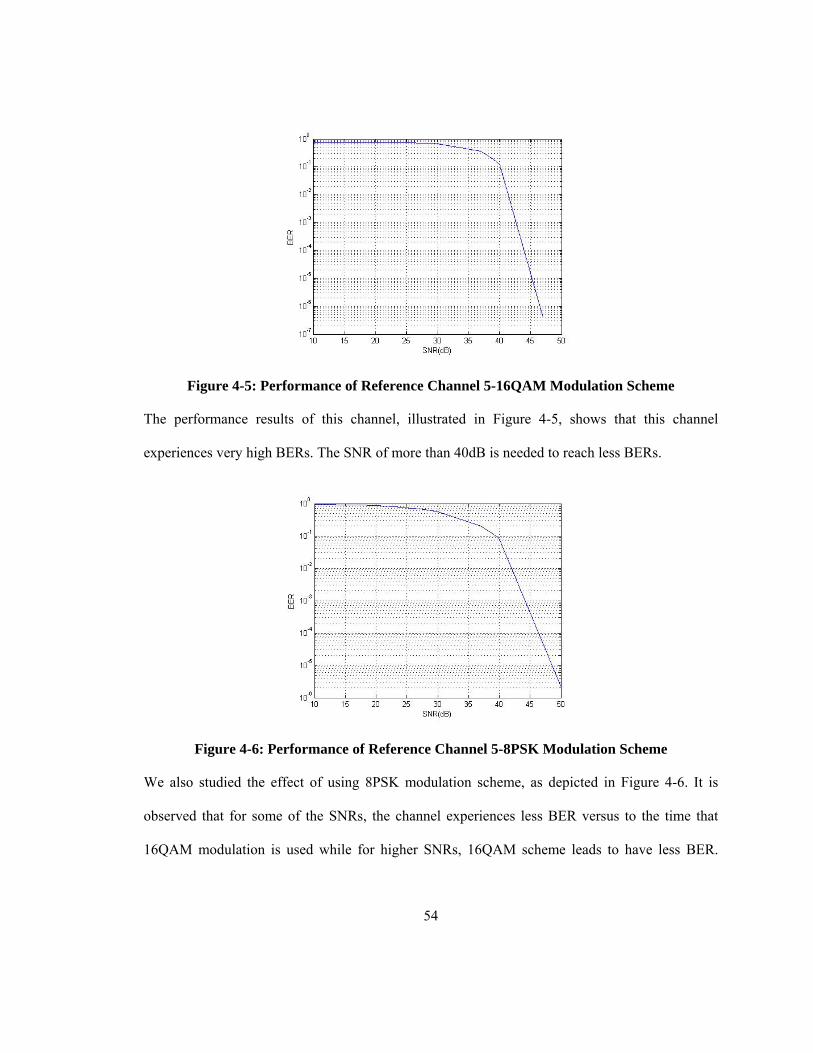
54
Figure 4-5: Performance of Reference Channel 5-16QAM Modulation Scheme
The performance results of this channel, illustrated in Figure 4-5, shows that this channel
experiences very high BERs. The SNR of more than 40dB is needed to reach less BERs.
Figure 4-6: Performance of Reference Channel 5-8PSK Modulation Scheme
We also studied the effect of using 8PSK modulation scheme, as depicted in Figure 4-6. It is
observed that for some of the SNRs, the channel experiences less BER versus to the time that
16QAM modulation is used while for higher SNRs, 16QAM scheme leads to have less BER.
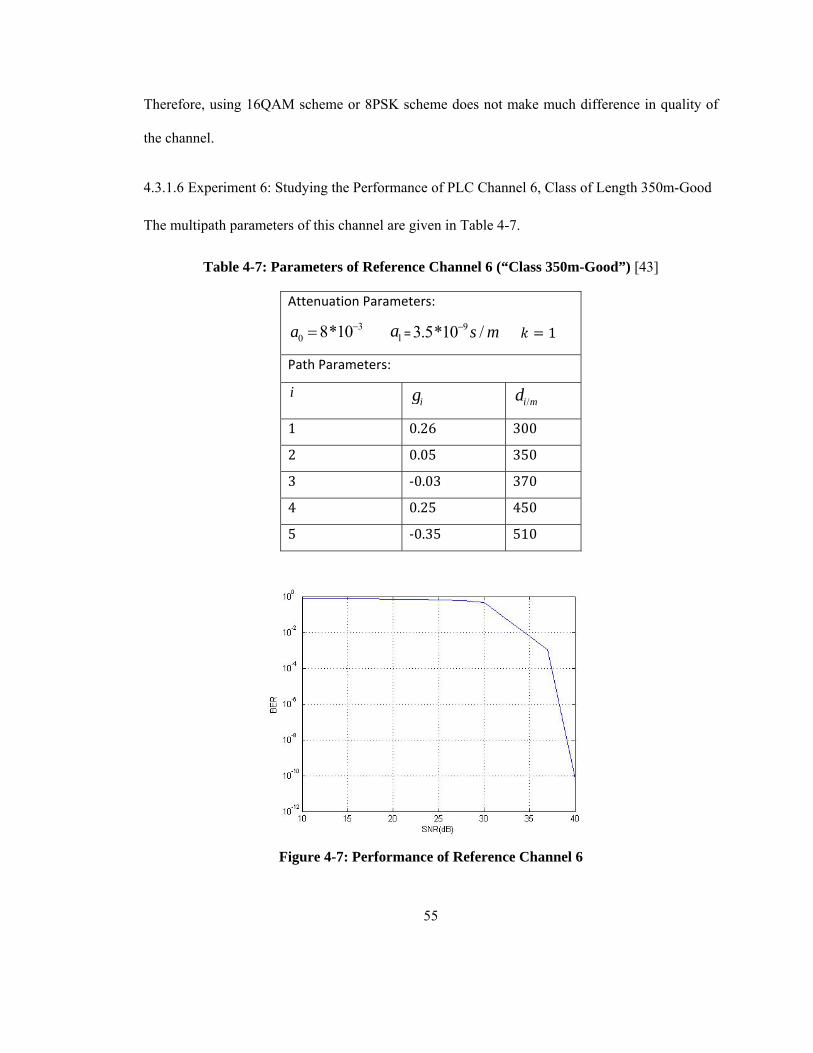
55
Therefore, using 16QAM scheme or 8PSK scheme does not make much difference in quality of
the channel.
4.3.1.6 Experiment 6: Studying the Performance of PLC Channel 6, Class of Length 350m-Good
The multipath parameters of this channel are given in Table 4-7.
Table 4-7: Parameters of Reference Channel 6 (“Class 350m-Good”) [43]
Attenuation Parameters:
30 8*10a 1a =
93.5*10 /s m 1
Path Parameters:
i ig /i md
1 0.26 300
2 0.05 350
3 ‐0.03 370
4 0.25 450
5 ‐0.35 510
Figure 4-7: Performance of Reference Channel 6
56
The performance results of this channel, illustrated in Figure 4-7, show that for the SNR less than
37dB, this channel experiences high BER. Therefore, to make this channel possible for SGCN,
the SNR of at least 37dB is required to be achieved at the destination.
4.3.1.7 Experiment 7: Studying the Performance of PLC Channel 7, Class of Length 350m-
Medium
The multipath parameters of this channel are given in Table 4-8.
Table 4-8: Parameters of Reference Channel 7 ("Class 350m-Medium") [43]
Attenuation Parameters: 0 0a 1a =99*10 /s m
1
Path Parameters: i
ig /i md iig /i md
1 0.00039 40 8 0.0051 230
2 ‐0.0045 68 9 0.0112 450
3 ‐0.0062 86 10 -0.0141 560
4 0.0281 129 11 0.1125 830
5 ‐0.0169 185 12 -0.1687 895
6 ‐0.0028 237 13 0.0675 1000
7 ‐0.0056 235
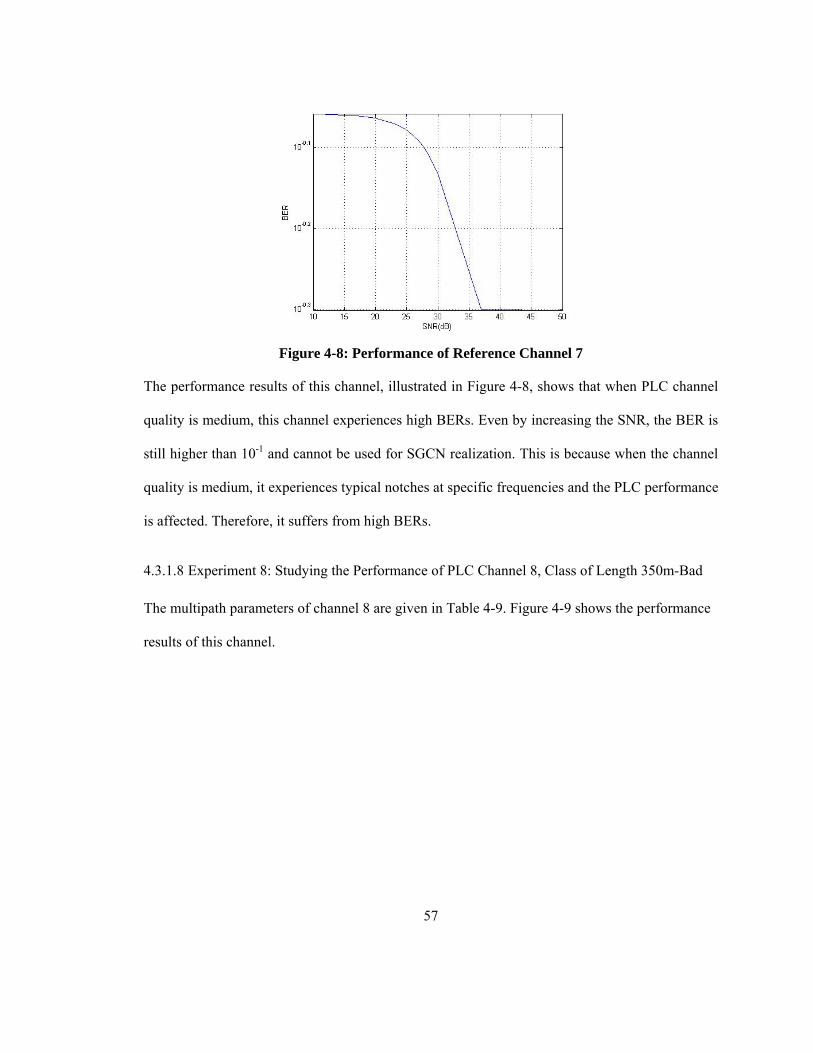
57
Figure 4-8: Performance of Reference Channel 7
The performance results of this channel, illustrated in Figure 4-8, shows that when PLC channel
quality is medium, this channel experiences high BERs. Even by increasing the SNR, the BER is
still higher than 10-1 and cannot be used for SGCN realization. This is because when the channel
quality is medium, it experiences typical notches at specific frequencies and the PLC performance
is affected. Therefore, it suffers from high BERs.
4.3.1.8 Experiment 8: Studying the Performance of PLC Channel 8, Class of Length 350m-Bad
The multipath parameters of channel 8 are given in Table 4-9. Figure 4-9 shows the performance
results of this channel.
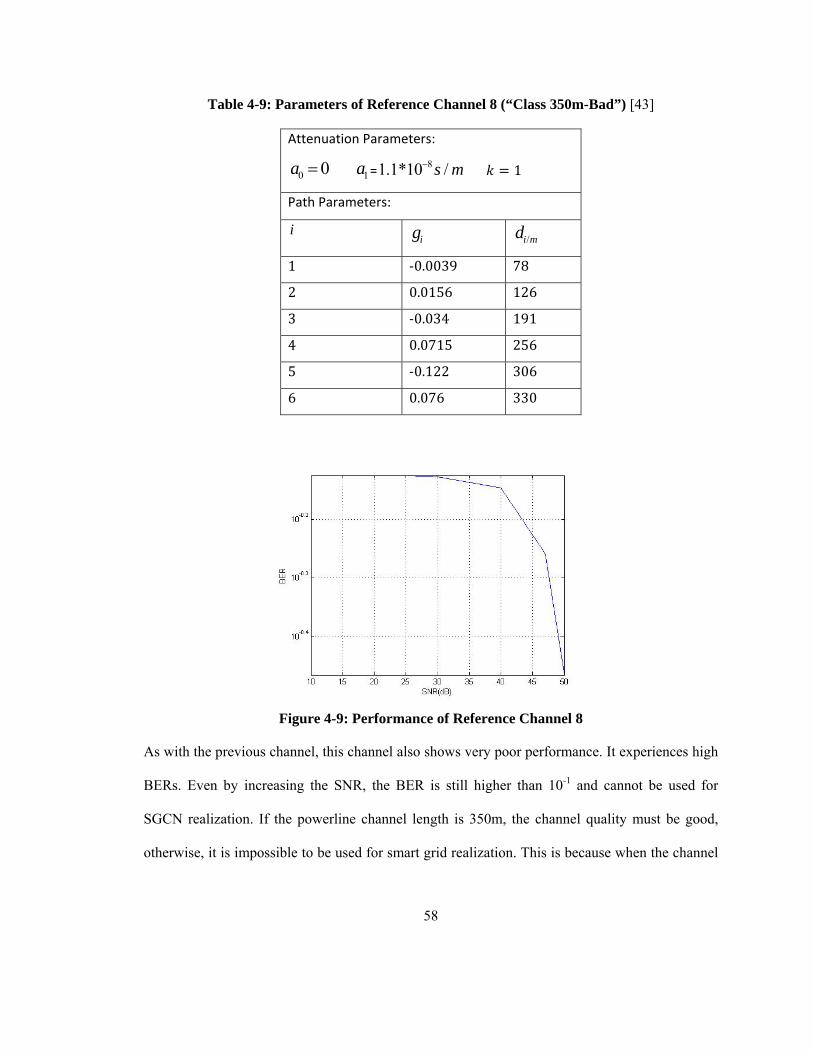
58
Table 4-9: Parameters of Reference Channel 8 (“Class 350m-Bad”) [43]
Attenuation Parameters:
0 0a 1a =81.1*10 /s m
1
Path Parameters:
i ig /i md
1 ‐0.0039 78
2 0.0156 126
3 ‐0.034 191
4 0.0715 256
5 ‐0.122 306
6 0.076 330
Figure 4-9: Performance of Reference Channel 8
As with the previous channel, this channel also shows very poor performance. It experiences high
BERs. Even by increasing the SNR, the BER is still higher than 10-1 and cannot be used for
SGCN realization. If the powerline channel length is 350m, the channel quality must be good,
otherwise, it is impossible to be used for smart grid realization. This is because when the channel
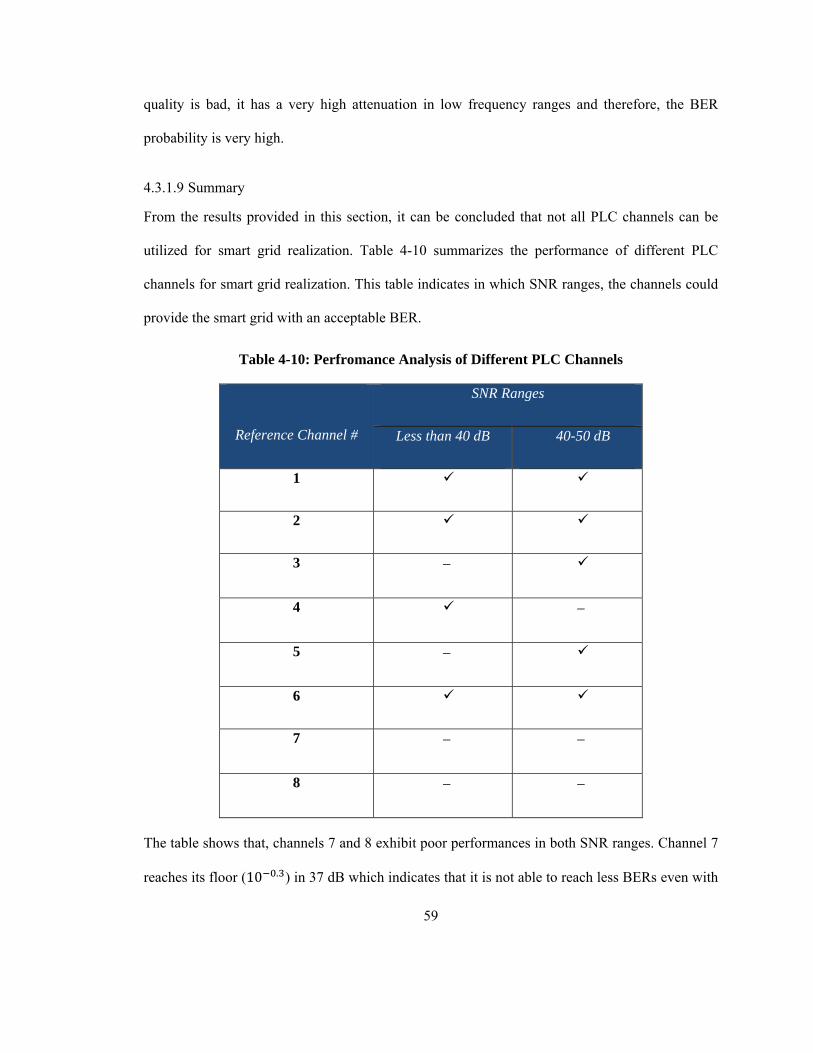
59
quality is bad, it has a very high attenuation in low frequency ranges and therefore, the BER
probability is very high.
4.3.1.9 Summary
From the results provided in this section, it can be concluded that not all PLC channels can be
utilized for smart grid realization. Table 4-10 summarizes the performance of different PLC
channels for smart grid realization. This table indicates in which SNR ranges, the channels could
provide the smart grid with an acceptable BER.
Table 4-10: Perfromance Analysis of Different PLC Channels
Reference Channel #
SNR Ranges
Less than 40 dB 40-50 dB
1
2
3
4
5
6
7
8
The table shows that, channels 7 and 8 exhibit poor performances in both SNR ranges. Channel 7
reaches its floor (10 . ) in 37 dB which indicates that it is not able to reach less BERs even with

60
high SNRs. In order to make channels 3 and 5 usable, a high SNR is required while on the other
hand, high SNR is not desirable in PLC. Furthermore, QAM and PSK modulation schemes do not
make much difference in the channel performance.
Channel 6 is used for the remainder of the experiments. This is because the maximum PLC line
length in the typical area we are studying is 350 m, and this channel type performs well for this
line length. In the other potential cases, the powerline is not able to pass the data with an
acceptable BER.
4.3.2 Finding a Viable PLC Infrastructure for Smart Grid Realization
In the following scenarios our goal is to find out an economic PLC infrastructure for smart grid
realization. Therefore, three different combinations of NBPLC and BPLC infrastructures are
studied.
It is worth noting that the cost of NBPLC devices is much lower in comparison to that of BPLC
devices. Moreover, BPLC devices suffer from higher interference from other broadband devices.
To make the use of BPLC possible, Golay coding is applied with OFDM modulation.
Table 4-11, illustrates a summary of simulation setups used in the following experiments.
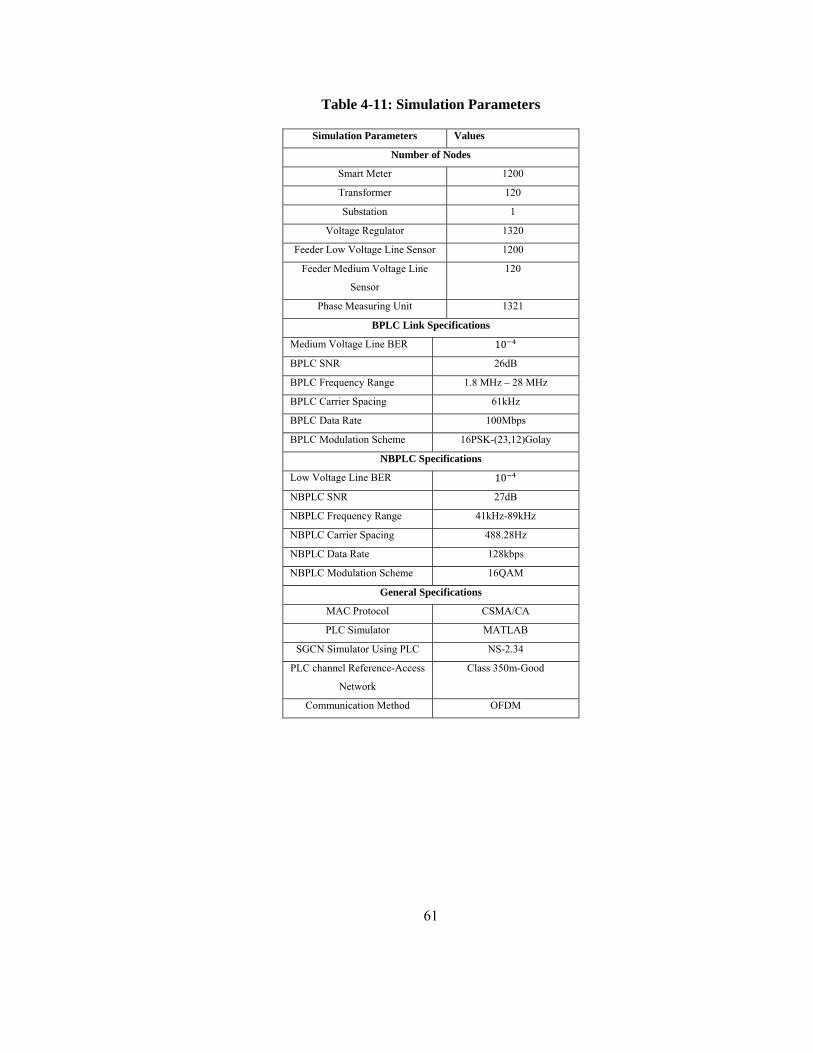
61
Table 4-11: Simulation Parameters
Simulation Parameters Values
Number of Nodes
Smart Meter 1200
Transformer 120
Substation 1
Voltage Regulator 1320
Feeder Low Voltage Line Sensor 1200
Feeder Medium Voltage Line
Sensor
120
Phase Measuring Unit 1321
BPLC Link Specifications
Medium Voltage Line BER 10
BPLC SNR 26dB
BPLC Frequency Range 1.8 MHz – 28 MHz
BPLC Carrier Spacing 61kHz
BPLC Data Rate 100Mbps
BPLC Modulation Scheme 16PSK-(23,12)Golay
NBPLC Specifications
Low Voltage Line BER 10
NBPLC SNR 27dB
NBPLC Frequency Range 41kHz-89kHz
NBPLC Carrier Spacing 488.28Hz
NBPLC Data Rate 128kbps
NBPLC Modulation Scheme 16QAM
General Specifications
MAC Protocol CSMA/CA
PLC Simulator MATLAB
SGCN Simulator Using PLC NS-2.34
PLC channel Reference-Access
Network
Class 350m-Good
Communication Method OFDM
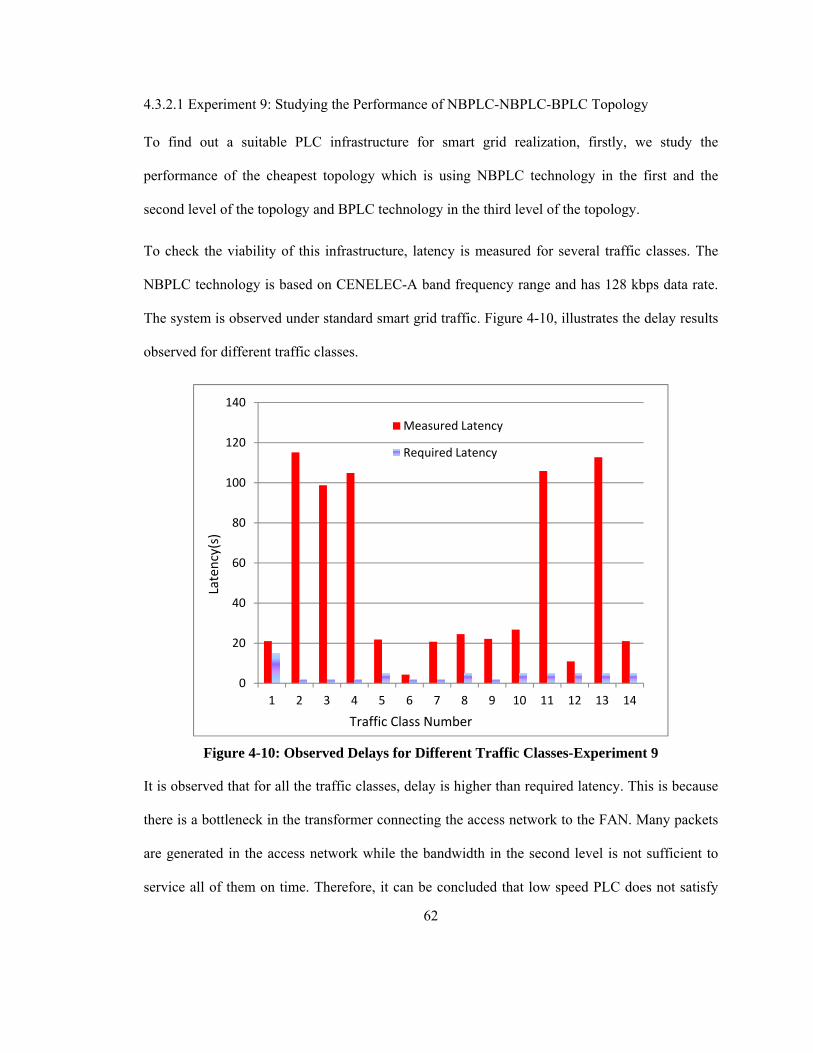
62
4.3.2.1 Experiment 9: Studying the Performance of NBPLC-NBPLC-BPLC Topology
To find out a suitable PLC infrastructure for smart grid realization, firstly, we study the
performance of the cheapest topology which is using NBPLC technology in the first and the
second level of the topology and BPLC technology in the third level of the topology.
To check the viability of this infrastructure, latency is measured for several traffic classes. The
NBPLC technology is based on CENELEC-A band frequency range and has 128 kbps data rate.
The system is observed under standard smart grid traffic. Figure 4-10, illustrates the delay results
observed for different traffic classes.
Figure 4-10: Observed Delays for Different Traffic Classes-Experiment 9
It is observed that for all the traffic classes, delay is higher than required latency. This is because
there is a bottleneck in the transformer connecting the access network to the FAN. Many packets
are generated in the access network while the bandwidth in the second level is not sufficient to
service all of them on time. Therefore, it can be concluded that low speed PLC does not satisfy
0
20
40
60
80
100
120
140
1 2 3 4 5 6 7 8 9 10 11 12 13 14
Measured Latency
Required Latency
Latency(s)
Traffic Class Number
63
smart grid communication requirements and the bandwidth in the second level needs to be
increased [51].
The observed good throughput in this topology is 6.72 kbps. The minimum required bandwidth is
also measured and reported to be 2.11 Mbps. Therefore, we can conclude that the congestion
percentage in the network is a lot and this network topology does not work efficiently.
4.3.2.2 Experiment 10: Studying the Performance of NBPLC-NBPLC-BPLC Topology for the
AMR Infrastructure
Congestion and insufficient bandwidth are the problems with the previous experiment. AMR
infrastructure generates less traffic in comparison to the smart grid. In this experiment, we intend
to study the same topology under automatic meter reading traffic to see whether this topology can
be appropriate for AMR services. Table 4-12 describes the traffic classes which have been
applied to the system.
Table 4-12: AMR Traffic
From To Payload
Name
How Often Acceptable
PER
Latency Payload Size
(Bytes)
ID
Smart
Meter
MDMS Meter-
Reading
25 trans per
1000 mtrs
per day
2%
< 15s 200 – 2400 0
Smart Meter
- Elect
Resdnt
AMI
Head-End
Meter-
Reading
4-6 trans
per day
2% < 4hr 1600 – 2400 1
Smart Meter
- Gas Resdnt
AMI
Head-End
Meter-
Reading
1-6 trans
per day
2% < 4hr 1600 – 2400 2
64
Table 4-13 illustrates the delay values obtained for AMR services. From the results, we observe
that smart meter delay requirement is not satisfied. Therefore, we can conclude that this PLC
infrastructure cannot satisfy AMR services requirements either.
Table 4-13: Traffic Delays-Experiment 10
Traffic ID Measured Latency
Accepted Latency
Class 0 48.7921 <15s
Class 1 52.2148 <4h
Class 2 49.4709 <4h
Compared to the previous experiments, a higher good throughput, 9kbps is observed in this
experiment. This is because that the number of congestions becomes less and more packets are
received at their destinations.
4.3.2.3 Experiment 11: Studying the Performance of NBPLC (CENELEC-A)-BPLC-BPLC
Topology
After observing high traffic delays in previous scenarios, because of the congestion in the second
level of the topology, a new PLC infrastructure is considered. In this infrastructure, the first level
of the system topology is equipped with the NBPLC, the second and the third levels of the system
topology are equipped with the BPLC technology. The NBPLC technology in the first level uses
CENELEC-A band and therefore, has 128 kbps data rate. Studying this infrastructure will help us
to determine which PLC infrastructure is the best topology for smart grid. To check the viability
of this infrastructure, latency and reliability of all the traffic classes are measured. Standard smart
grid traffic has been applied to the system.
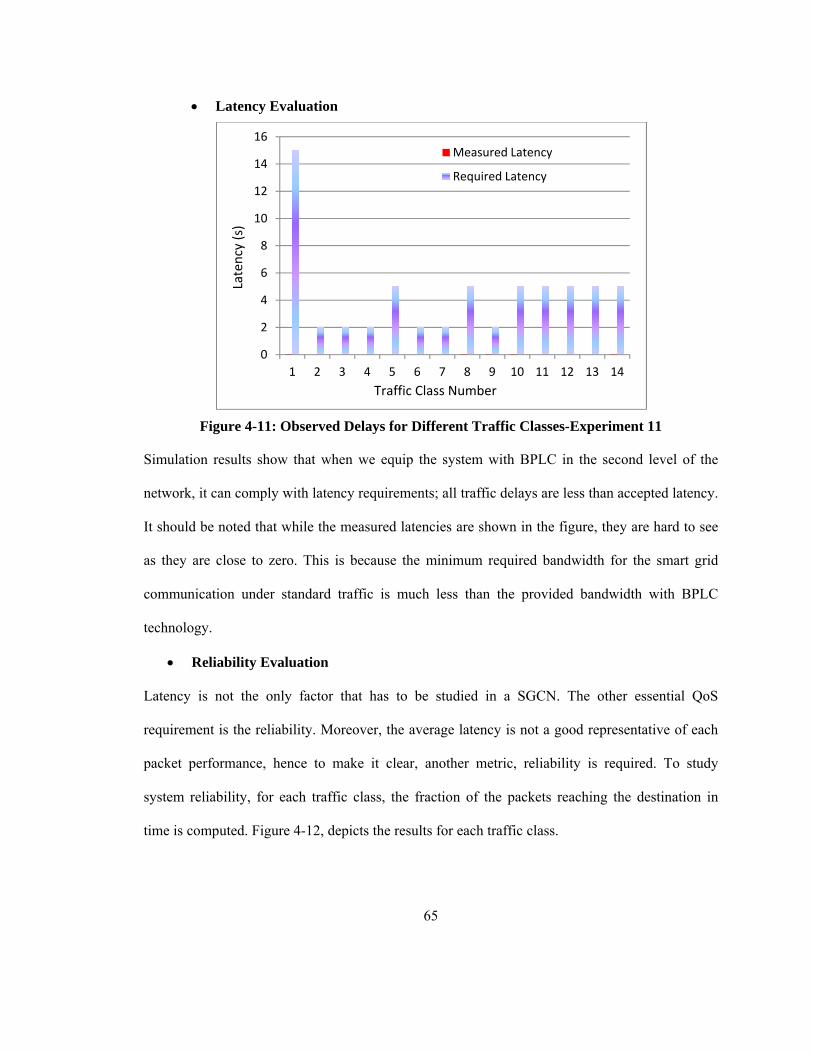
65
Latency Evaluation
Figure 4-11: Observed Delays for Different Traffic Classes-Experiment 11
Simulation results show that when we equip the system with BPLC in the second level of the
network, it can comply with latency requirements; all traffic delays are less than accepted latency.
It should be noted that while the measured latencies are shown in the figure, they are hard to see
as they are close to zero. This is because the minimum required bandwidth for the smart grid
communication under standard traffic is much less than the provided bandwidth with BPLC
technology.
Reliability Evaluation
Latency is not the only factor that has to be studied in a SGCN. The other essential QoS
requirement is the reliability. Moreover, the average latency is not a good representative of each
packet performance, hence to make it clear, another metric, reliability is required. To study
system reliability, for each traffic class, the fraction of the packets reaching the destination in
time is computed. Figure 4-12, depicts the results for each traffic class.
0
2
4
6
8
10
12
14
16
1 2 3 4 5 6 7 8 9 10 11 12 13 14
Measured Latency
Required Latency
Latency (s)
Traffic Class Number
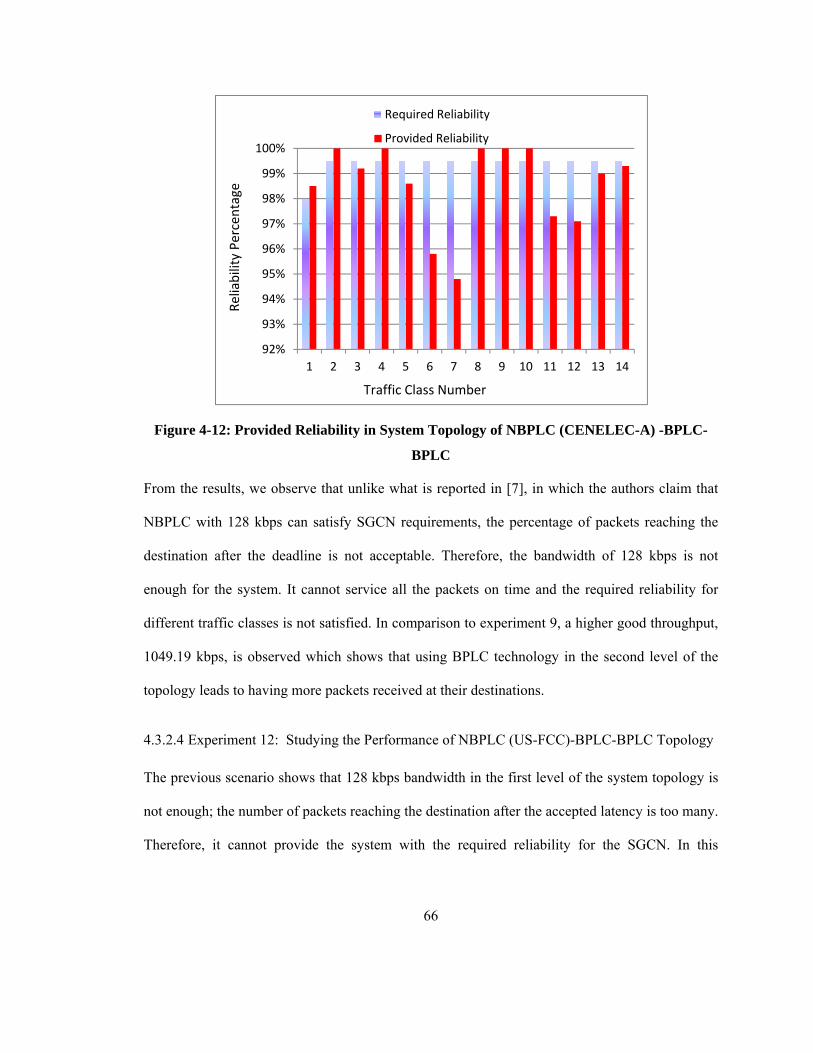
66
Figure 4-12: Provided Reliability in System Topology of NBPLC (CENELEC-A) -BPLC-
BPLC
From the results, we observe that unlike what is reported in [7], in which the authors claim that
NBPLC with 128 kbps can satisfy SGCN requirements, the percentage of packets reaching the
destination after the deadline is not acceptable. Therefore, the bandwidth of 128 kbps is not
enough for the system. It cannot service all the packets on time and the required reliability for
different traffic classes is not satisfied. In comparison to experiment 9, a higher good throughput,
1049.19 kbps, is observed which shows that using BPLC technology in the second level of the
topology leads to having more packets received at their destinations.
4.3.2.4 Experiment 12: Studying the Performance of NBPLC (US-FCC)-BPLC-BPLC Topology
The previous scenario shows that 128 kbps bandwidth in the first level of the system topology is
not enough; the number of packets reaching the destination after the accepted latency is too many.
Therefore, it cannot provide the system with the required reliability for the SGCN. In this
92%
93%
94%
95%
96%
97%
98%
99%
100%
1 2 3 4 5 6 7 8 9 10 11 12 13 14
Required Reliability
Provided Reliability
Traffic Class Number
Reliability Percentage
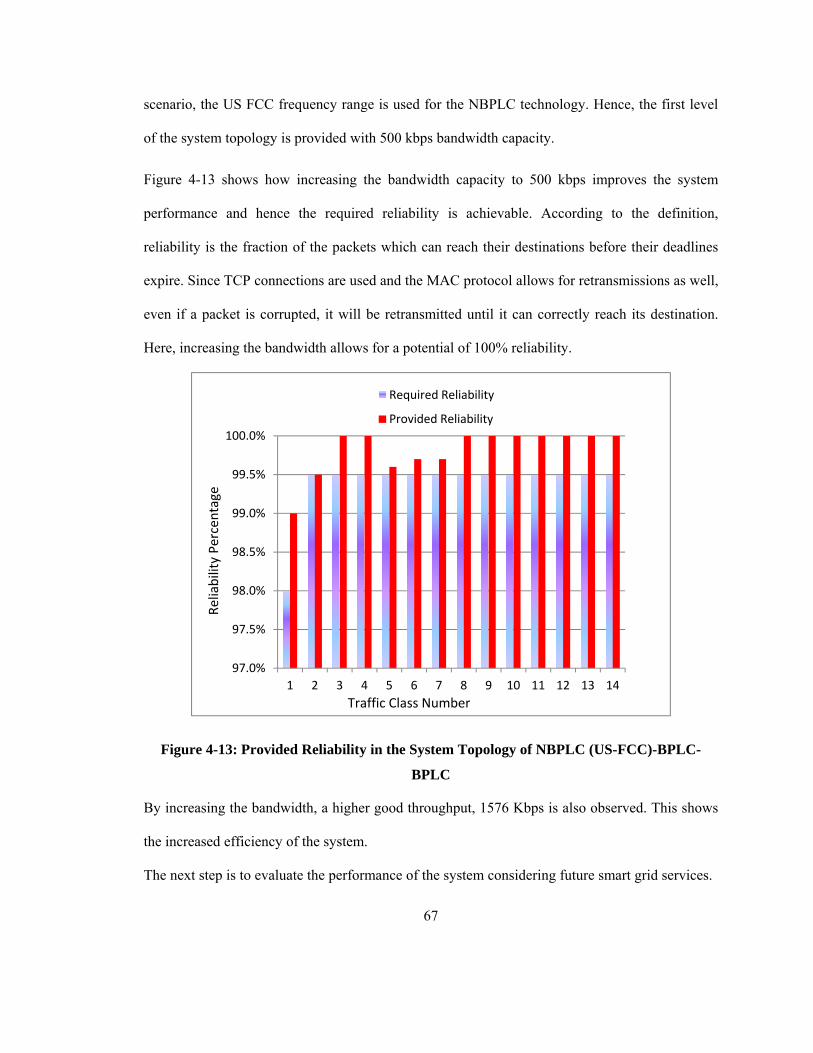
67
scenario, the US FCC frequency range is used for the NBPLC technology. Hence, the first level
of the system topology is provided with 500 kbps bandwidth capacity.
Figure 4-13 shows how increasing the bandwidth capacity to 500 kbps improves the system
performance and hence the required reliability is achievable. According to the definition,
reliability is the fraction of the packets which can reach their destinations before their deadlines
expire. Since TCP connections are used and the MAC protocol allows for retransmissions as well,
even if a packet is corrupted, it will be retransmitted until it can correctly reach its destination.
Here, increasing the bandwidth allows for a potential of 100% reliability.
Figure 4-13: Provided Reliability in the System Topology of NBPLC (US-FCC)-BPLC-
BPLC
By increasing the bandwidth, a higher good throughput, 1576 Kbps is also observed. This shows
the increased efficiency of the system.
The next step is to evaluate the performance of the system considering future smart grid services.
97.0%
97.5%
98.0%
98.5%
99.0%
99.5%
100.0%
1 2 3 4 5 6 7 8 9 10 11 12 13 14
Required Reliability
Provided Reliability
Traffic Class Number
Reliability Percentage
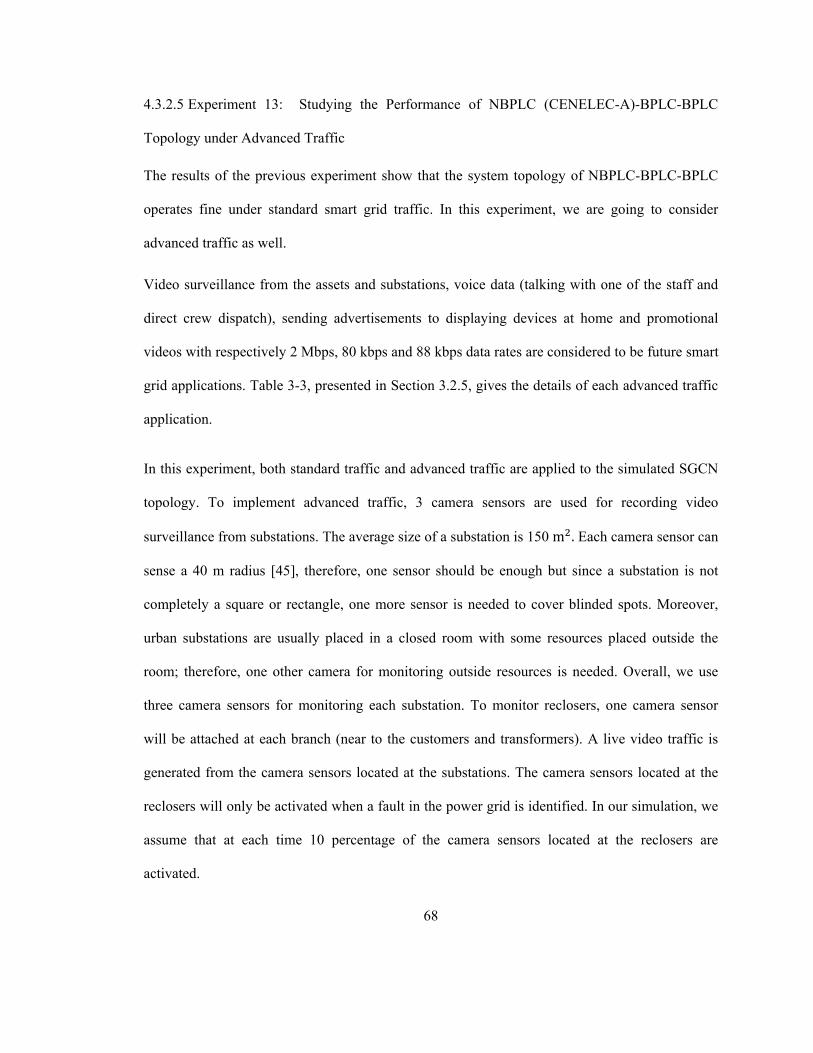
68
4.3.2.5 Experiment 13: Studying the Performance of NBPLC (CENELEC-A)-BPLC-BPLC
Topology under Advanced Traffic
The results of the previous experiment show that the system topology of NBPLC-BPLC-BPLC
operates fine under standard smart grid traffic. In this experiment, we are going to consider
advanced traffic as well.
Video surveillance from the assets and substations, voice data (talking with one of the staff and
direct crew dispatch), sending advertisements to displaying devices at home and promotional
videos with respectively 2 Mbps, 80 kbps and 88 kbps data rates are considered to be future smart
grid applications. Table 3-3, presented in Section 3.2.5, gives the details of each advanced traffic
application.
In this experiment, both standard traffic and advanced traffic are applied to the simulated SGCN
topology. To implement advanced traffic, 3 camera sensors are used for recording video
surveillance from substations. The average size of a substation is 150 m . Each camera sensor can
sense a 40 m radius [45], therefore, one sensor should be enough but since a substation is not
completely a square or rectangle, one more sensor is needed to cover blinded spots. Moreover,
urban substations are usually placed in a closed room with some resources placed outside the
room; therefore, one other camera for monitoring outside resources is needed. Overall, we use
three camera sensors for monitoring each substation. To monitor reclosers, one camera sensor
will be attached at each branch (near to the customers and transformers). A live video traffic is
generated from the camera sensors located at the substations. The camera sensors located at the
reclosers will only be activated when a fault in the power grid is identified. In our simulation, we
assume that at each time 10 percentage of the camera sensors located at the reclosers are
activated.
69
Latency is measured for all traffic classes. Figure 4-14 shows average delay values in different
traffic classes once we applied advanced traffic and compared it with the time we had applied
standard smart grid traffic to the system. It is noted that depending on the traffic class properties,
the measured latency for some of the classes is almost zero and hence, it is hard to observe it in
the figure.
Figure 4-14: Delay Comparison when Advanced Traffic Is Added to the System
Figure 4-15 compares the observed delays for different traffic classes with the required latency
once we applied advanced traffic to the system.
0
0.1
0.2
0.3
0.4
0.5
0.6
1 2 3 4 5 6 7 8 9 10 11 12 13 14
Standard Traffic
Advanced Traffic
Traffic Class Number
Latency(s)
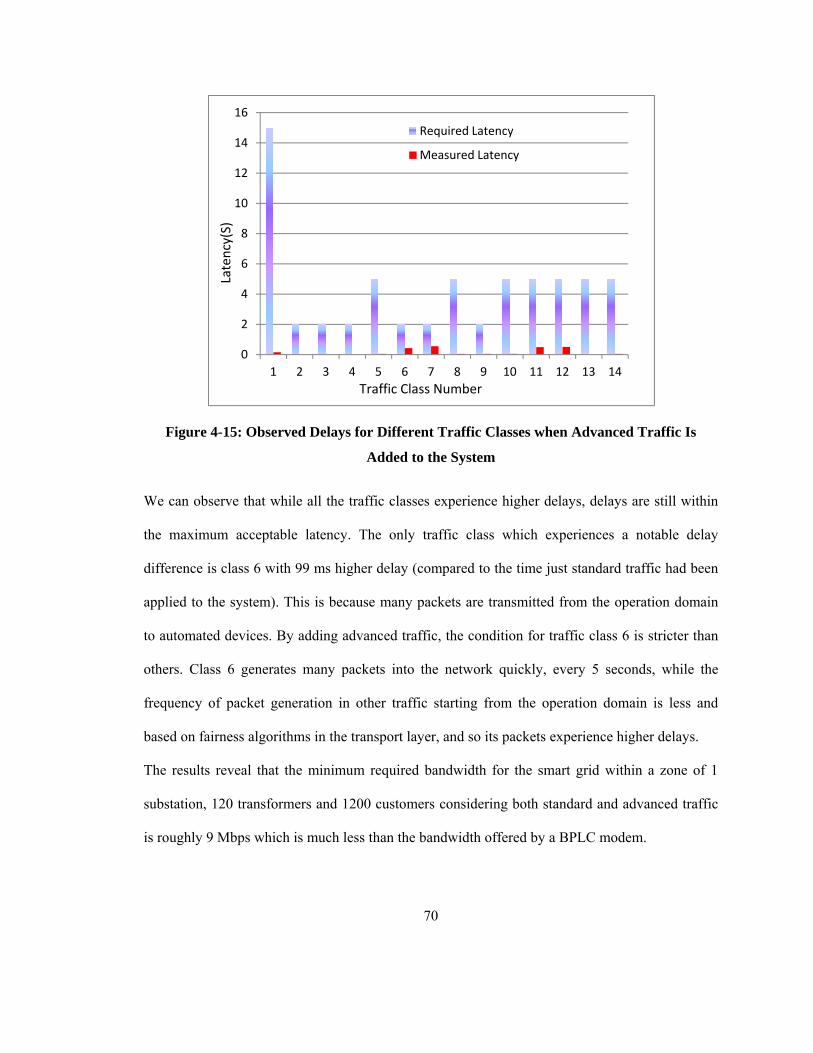
70
Figure 4-15: Observed Delays for Different Traffic Classes when Advanced Traffic Is
Added to the System
We can observe that while all the traffic classes experience higher delays, delays are still within
the maximum acceptable latency. The only traffic class which experiences a notable delay
difference is class 6 with 99 ms higher delay (compared to the time just standard traffic had been
applied to the system). This is because many packets are transmitted from the operation domain
to automated devices. By adding advanced traffic, the condition for traffic class 6 is stricter than
others. Class 6 generates many packets into the network quickly, every 5 seconds, while the
frequency of packet generation in other traffic starting from the operation domain is less and
based on fairness algorithms in the transport layer, and so its packets experience higher delays.
The results reveal that the minimum required bandwidth for the smart grid within a zone of 1
substation, 120 transformers and 1200 customers considering both standard and advanced traffic
is roughly 9 Mbps which is much less than the bandwidth offered by a BPLC modem.
0
2
4
6
8
10
12
14
16
1 2 3 4 5 6 7 8 9 10 11 12 13 14
Required Latency
Measured Latency
Traffic Class Number
Latency(S)
71
4.3.3 Cost Estimation
According to references [46] and [47], the price of a NBPLC modem (when ordered in 1000’s) is
8.50 USD and the price of a BPLC modem is 68 USD. In a 5km radius area, around 60,000 field
automated devices are needed to be attached to the NBPLC lines and around 1550 field
automated devices are needed to be attached to the BPLC lines. Therefore, the cost of the
proposed PLC infrastructure for smart grid realization in a 5km radius area is approximately
615,400 USD (60,000*8.50+1550*68).
4.3.4 Discussion
Another viable and promising communication technology for smart grid is WiMAX. It offers
high data rate, up to 100 Mbps, with a large coverage, 5-50 km [27]. The price of each WiMAX
modem device is 25 USD [48] and the price of each WiMAX base station is 3,495 USD [49]
while using the already deployed WiMAX BSs is another possibility or a good option which
needs to be investigated. However, using deployed WiMAX BSs deprives utilities from having
their own network and furthermore, WiMAX BSs have to manage some data other than just smart
grid data which might cause problems for smart grid realization.
We evaluate the viability of WiMAX technology, considering both standard and advanced traffic
in a specific environment condition with 1 substation, 120 transformers and 1200 smart meters in
a 5 km radius area. Table 4-14 presents the summary of simulation settings considered for this
evaluation. Figure 4-16 illustrates the simulated topology.
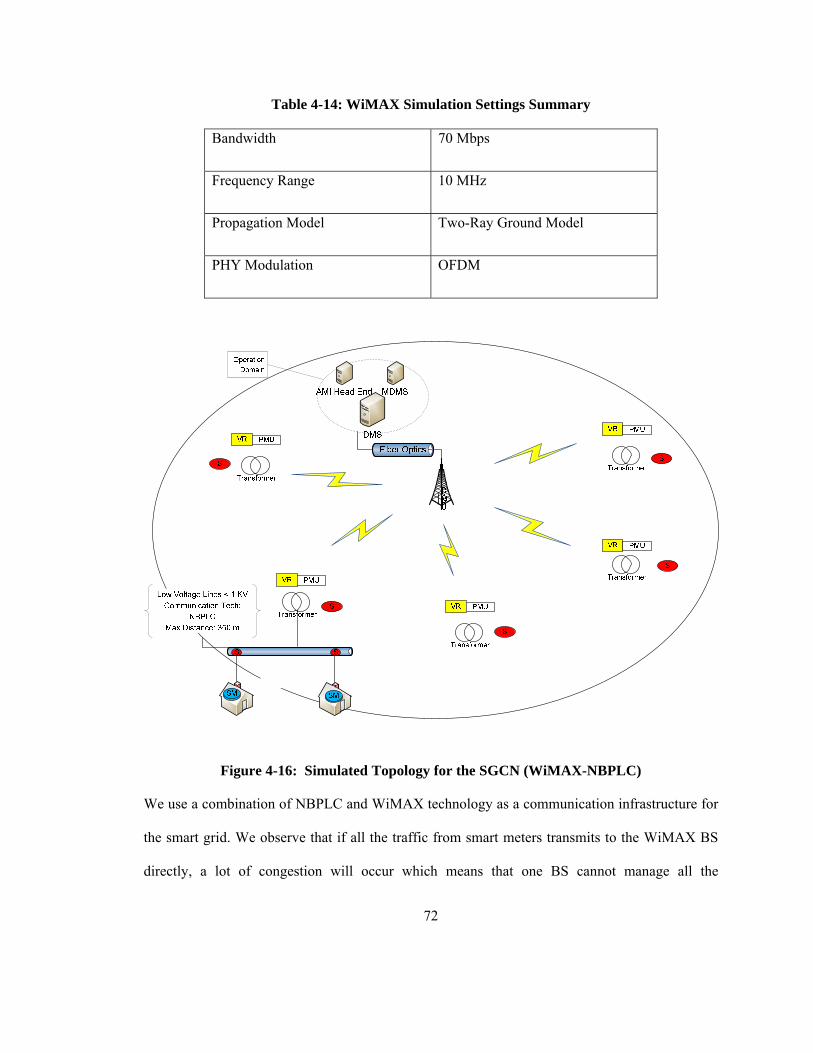
72
Table 4-14: WiMAX Simulation Settings Summary
Bandwidth 70 Mbps
Frequency Range 10 MHz
Propagation Model Two-Ray Ground Model
PHY Modulation OFDM
Figure 4-16: Simulated Topology for the SGCN (WiMAX-NBPLC)
We use a combination of NBPLC and WiMAX technology as a communication infrastructure for
the smart grid. We observe that if all the traffic from smart meters transmits to the WiMAX BS
directly, a lot of congestion will occur which means that one BS cannot manage all the

73
simultaneous access requests. Therefore, we propose to use a heterogeneous network consisting
of NBPLC and WiMAX technologies together. NBPLC can be used as a communication
technology for the first level of the network (access network) and WiMAX can be used as a
communication technology for the second (FAN) and third (WAN) level of the network.
Transformers act as the aggregator. All data traffic from smart meters and distribution automated
devices (connected to the access network) will be aggregated at the transformers and then from
the transformers, they will be sent to the utility company and operation domain using WiMAX
technology.
From the experiments, we observe that although delay values for all the traffic classes under both
standard and advanced traffic (except for two classes for the advanced traffic) is acceptable, the
simulated infrastructure could not provide the required reliability for the SGCN. We found that
there are many packet drops in the system which is because a WiMAX BS can serve at most 200
simultaneous subscribers and even with the proposed infrastructure (Using transformers as the
aggregators), there are still many field automated devices in the second level of the network
which leads to congestion during channel access. Hence, another layer of aggregation seems to be
needed.
The advantage of using WiMAX versus PLC is that scalability can be provided by increasing the
number of WiMAX BSs. In the case of using BPLC the electrical infrastructure is already
deployed and scalability cannot be provided except by adding new power cables. On the other
hand, the maximum offered bandwidth by BPLC modem is 400 Mbps [8] which is much higher
than what can be provided by a WiMAX BS.
74
Chapter 5
Conclusion and Further Work
5.1 Conclusion
Smart grid can achieve its goals through collecting data from different parts of the power grid
including customers, distribution network and distributed generation. This can only be fulfilled
via integrating a communication infrastructure to the power grid. Implementing communication
infrastructure is not the only step that is required for smart grid realization. Other steps such as
analyzing data traffic, providing the grid with micro grids and renewable energies are needed,
too. By providing the power grid with a reliable communication infrastructure which can provide
it with its quality of service requirements, the first and essential step in implementing a smart grid
is provided.
In this thesis, a SGCN and its requirements were studied. To identify all data traffic that is needed
to be sent over the smart grid, smart grid applications were divided into three general traffic
classes. The QoS requirements of these traffic classes were investigated. Among all types of
traffic, the essential ones with high sending frequency rates or restricted QoS requirements were
distinguished.
As mentioned before, a two-way digital communication network is an essential requirement for
developing the smart grid. There is currently an ongoing debate surrounding what would be the
best communication technology for smart grid realization. In this thesis, all the promising
communication networks with their advantages and disadvantages were considered.
Among these, there is a notable interest in using PLC for smart grid realization. It is because
powerlines already exist and utilities can manage their own network. However, its noisy
75
environment, low capacity in NBPLC and its signal interference with other kinds of
communication technologies are the concerns regarding using PLC technology.
In this thesis, the viability of PLC for smart grid realization in terms of providing QoS
requirements for different smart grid traffic classes was investigated. In addition, the performance
of different channel models and different PLC infrastructures were evaluated.
To evaluate the viability of PLC for smart grid realization, a simulator for simulating PLC and
SGCN was developed using NS-2 and MATLAB. To simulate the noisy environment of PLC, its
BERs were calculated and imported to NS-2.
Investigating the performance of different PLC channel models for the access network of the
smart grid, it can be concluded that 6 channel classes could reach an acceptable SGCN BER for
some SNR of less than 50 dB.
For the channel length of 350 m, it is observed that the channel can perform well only if it is in a
good condition, otherwise, the BER is high and is not acceptable for SGCN.
In BPLC, it should be noted that to reach an acceptable BER for the smart grid, a coded OFDM
system is required and it has to be applied to the simulated environment.
Evaluating different combinations of PLC infrastructures, we found out that the combination of
NBPLC in the first level (which connects smart meters to transformers) of the network and BPLC
in the second (connects transformers to substations) and third (connects substations to operation
domain and utility company) levels of the network is a viable PLC infrastructure for smart grid
realization which can satisfy SGCN requirements.
Although the latency requirements of different traffic classes can be satisfied with NBPLC
operating in the CENELEC-A frequency range, the minimum acceptable reliability for SGCN
cannot be met. To provide the proposed PLC infrastructure with the required reliability, NBPLC
76
should operate in the US-FCC frequency range. Consequently, a higher bandwidth would be
accessible in the first level of the PLC network and SGCN requirements are satisfied.
To have a long term perspective of the SGCN, some advanced traffic classes were investigated
and applied to the system. After applying advanced traffic, the viability of the proposed PLC
infrastructure for smart grid realization was evaluated. It is observed that the latency requirements
of all the traffic classes were satisfied.
For the typical area we studied (1 substation, 120 transformers, 1200 smart meters and all
required field automated devices at the second level of the network), it is observed that the
minimum required bandwidth considering standard smart grid traffic is 2.11 Mbps. However,
after adding advanced traffic to the system, at least 9 Mbps bandwidth is required.
5.2 Further Work
In terms of evaluating the viability of PLC for the smart grid, a step further is to increase the
number of substations and to estimate what would be the maximum number of substations that
can be covered by broadband PLC. Since substations are already deployed, we can find out the
areas in which BPLC can be used. On the other hand, for some applications, the number of
devices can be adjusted. For instance, in video surveillance, the maximum number of camera
sensors which can be connected to the substations can be estimated. In addition, using PLC as a
communication technology for the smart grid leads to having both the power source and
information technology on the same infrastructure. Therefore a cable break can cause a loss in the
communication network as well. Hence, the tolerance of PLC against faults needs to be
investigated. Furthermore, the proposed PLC infrastructure can be investigated with more traffic
detail. Traffic classes can be prioritized according to their privileges. At each time, conducting an
experiment, a fixed bit error rate was imported to the system while the powerline channels are
77
time variant. Hence, a further investigation considering this property of powerline channels is
needed.
WiMAX as a broadband communication technology with lower implementation cost (compared
to the BPLC) and also as a future promising communication technology (next generation of
wireless networks), is a viable communication technology. However, its performance in different
environment conditions/different propagation models for the SGCN needs to be explored.
78
References
[1] B. Davito, H. Tai, and R. Uhlane, "Mckinsey on Smart Grid: The Smart Grid and The Promise of Demand-Side Management," vol. 1, pp. 38-44, 2010.
[2] L. A. Burkhart, "The DOE's "7 Traits of a Smart Grid"," Fortnightly's, vol. 70, 2009.
[3] National Energy Technology Laboratory, "Smart Grid Principal Characteristic: Operates Resiliently against Attack and Natural Disasters," Office of Electricity Delivery and Energy Reliability, 2009.
[4] "NIST Framework and Roadmap for Smart Grid Interoperability Standards, Release 1.0," NIST Special Publication 1108, National Institute of Standards and Technology, January 2010.
[5] B. Li, Y. Qin, C. P. Low and C. L. Gwee, "A Survey on Mobile WiMAX [Wireless Broadband Access]," Communications Magazine, IEEE, vol. 45, pp. 70-75, 2007.
[6] H. Hrasnica, A. Haidine and R. Lehnert, Broadband Powerline Communications Networks: Network Design. John Wiley & Sons Inc, 2004.
[7] PRIME Project, "PRIME. PHY, MAC and Convergence Layers," Technology Whitepaper, 2008.
[8] "IEEE Draft Standard for Broadband over Power Line Networks: Medium Access Control and Physical Layer Specifications," IEEE P1901/D4. 01, July 2010, pp. 1-1589, 2010.
[9] Smart Grid Network, (2012). "Smart Grid USA-Charting a New Energy Future," [Online]. Available: http://www.smartgrid.com/.
[10] Watts Up With That, (2011). "Obama's Smart Grid Plans," [Online]. Available:
http://wattsupwiththat.com/2011/06/14/obamas-smartgrid-plans/.
[11] Catherine Violey, (2011, Aug. 03). "Smart Grid Opinions: Who's Who in Smart Meter Communications?" [Online]. Available: http://www.smartgridopinions.com/article/who%E2%80%99s-who-smart-meter-communications.
[12] S. Galli, A. Scaglione and Z. Wang, "Power Line Communications and the Smart Grid," in Smart Grid Communications (SmartGridComm), 2010 First IEEE International Conference on, pp. 303-308, 2010.
[13] M. Korki, N. Hosseinzadeh, H. L. Vu, T. Moazzeni and C. H. Foh, "A Channel Model for Power Line Communication in the Smart Grid," in Power Systems Conference and Exposition (PSCE), 2011 IEEE/PES, pp. 1-7, 2011.
79
[14] Open Smart Grid-Open SG, (2010). "SG Networks System Requirements System Specifications," Tech. Rep. v4.0-parents-r0.4, [Online]. Available: http://osgug.ucaiug.org/UtiliComm/Shared%20Documents/Forms/AllItems.aspx?RootFolder=%2FUtiliComm%2FShared%20Documents%2FSG-NET%20PAP%20work-in-progress&View=%7BDB95205C-1142-45B1-97C0-A4DD7F9EC4DA%7D.
[15] M. Daoud and X. Fernando, "On the Communication Requirements for the Smart Grid," Energy and Power Engineering, vol. 3, PP. 6-11, 2011.
[16] R. Cunningham, M. Gillmore, B. Godwin, M. Northern, D. Sturek, V. Bemmel and et. al. (2010)."SG Networks System Requirements Specifications," [Online]. Available: http://osgug.ucaiug.org/UtiliComm/Shared%20Documents/SG-NET%20PAP%20work-in-progress/SG%20Network%20System%20Requirements%20Specification%20v1.04.doc.
[17] Wikipedia, (2012, March 8). "Automatic Meter Reading," [Online]. Available: http://en.wikipedia.org/wiki/Automatic_meter_reading.
[18] K. Moslehi and R. Kumar, "Smart Grid-a Reliability Perspective," in Innovative Smart Grid Technologies (ISGT), 2010, pp. 1-8.
[19] T. Sauter and M. Lobashov, "End-to-End Communication Architecture for Smart Grids," Industrial Electronics, IEEE Transactions on, vol. 58, pp. 1218-1228, 2011.
[20] S. M. Kaplan and T. Net, Smart Grid: Modernizing Electric Power Transmission and Distribution; Energy Independence, Storage and Security; Energy Independence and Security Act of 2007 (EISA); Improving Electrical Grid Efficiency, Communication, Reliability, and Resiliency; Integrating New and Renewable Energy Sources. The Capitol Net Inc, 2009.
[21] D. Leeds, (2009). "The Smart grid in 2010: Market Segments, Applications and Industry Players," [Online]. Available: http://www.Gtmresearch.com/report/smart-Grid-in-2010.
[22] Y. Bi, J. Zhao and D. Zhang, "Research on Power Communication Network and Power Quality Monitoring Using OPNET," in 2nd IEEE Conference on Industrial Electronics and Applications. ICIEA 2007., pp. 507-511, 2007.
[23] J. J. Grainger and W. D. Stevenson, Power System Analysis. McGraw-Hill New York, 1994.
[24] IEC Smart Grid Standardization RoadMap, "SMB Smart Grid Strategic Group SG3", Edition 1.0, 2010.
[25] CISCO, (2012). "Network Readiness Assessment for IP Video Surveillance," [Online]. Available: http://www.cisco.com/en/US/docs/solutions/Enterprise/Video/IPVS/IPVS_Network_Assessment.html.
80
[26] Westbay Engineers Limited, (2011, June 07). "Bandwidth Requirements for Voice over IP transmission,", http://www.erlang.com/bandwidth.html.
[27] J. Rakesh and U. Dalal, "A Survey of Mobile WiMAX IEEE 802.16 m Standard," Arxiv Preprint arXiv:1005.0976, 2010.
[28] A Discovery Company, (2012)."Howstuffworks," [Online]. Available: http://www.howstuffworks.com/.
[29] A. Zaballos, A. Vallejo, M. Majoral and J. M. Selga, "Survey and Performance Comparison of AMR over PLC standards," Power Delivery, IEEE Transactions on, vol. 24, pp. 604-613, 2009.
[30] G. N. S. Prasanna, A. Lakshmi, S. Sumanth, V. Simha, J. Bapat, and G. Koomullil, “Data Communication over the Smart Grid,” in Proc. IEEE Int. Symp. Power Line Communications and Its Applications (ISPLC), pp. 273–279, Mar. 29–Apr. 1 2009.
[31] M. S. Kim, D. M. Son, Y. B. Ko and Y. H. Kim, "A Simulation Study of the PLC-MAC Performance Using Network Simulator-2," in Proc. IEEE Int. Symp. Power Line Communications and its Applications (ISPLC), pp. 99-104, 2008.
[32] Private Communication, "Utilities Kingston," http://www.utilitieskingston.com.
[33] Wikipedia, (2012). "Power Line Communication," [Online]. Available: http://en.wikipedia.org/wiki/Power_line_communication.
[34] M. Bauer, W. Plappert, C. Wang and K. Dostert, "Packet-Oriented Communication Protocols for Smart Grid Services over Low-Speed PLC," in Proc. IEEE Int. Symp. Power Line Communications and its Applications (ISPLC), pp. 89-94, 2009.
[35] HomePlug Powerline Alliance, (2005). "HomePlug AV," [Online]. Available: https://www.homeplug.org/tech/whitepapers/HPAV-White-Paper_050818.pdf.
[36] M. Zimmermann and K. Dostert, "A Multipath Model for the Powerline Channel," Communications, IEEE Transactions on, vol. 50, pp. 553-559, 2002.
[37] J. Anatory, N. Theethayi, M. Kissaka and N. Mvungi, "Broadband PowerLine Communications: Performance Analysis," Enformatika Trans.on Engineering, Computing and Technology, vol. 18, pp. 250-254, 2006.
[38] M. Gotz, M. Rapp and K. Dostert, "Power Line Channel Characteristics and their Effect on Communication System Design," Communications Magazine, IEEE, vol. 42, pp. 78-86, 2004.
[39] P. Amirshahi, S. M. Navidpour. and M. Kavehrad, "Performance Analysis of Uncoded and Coded OFDM Broadband Transmission over Low Voltage Power-line Channels with Impulsive Noise," Power Delivery, IEEE Transactions on, vol. 21, pp. 1927-1934, 2006.
81
[40] J. G. Proakis, Digital Communications. McGraw-hill, 1987.
[41] IEEE 802.11 n Working Group, "IEEE Standard for Information Technology-Telecommunications and Information Exchange Between Systems-Local and Metropolitan Area Networks-Specific Requirements-Part 11: Wireless LAN Medium Access Control (MAC) and Physical Layer (PHY) Specification," IEEE Std 802.11-2007 (Revision of IEEE Std 802.11-1999), pp. C1, 2009.
[42] "IEEE Standard for Information technology-Telecommunications and information exchange between systems-Local and metropolitan area networks-Specific requirements Part 3: Carrier Sense Multiple Access with Collision Detection (CSMA/CD) Access Method and Physical Layer Specifications," IEEE Std 802. 3ba-2010 , pp. 1-457, 2010.
[43] Channel Model Sub-committee of P1901, "Electrical Network and Topology Channel and Noise Model," P1901-10-0356-00, Sept. 2010.
[44] Trilliant Company, (2012). "Substation Video Monitoring," [Online]. Available: http://www.trilliantinc.com/solutions/distribution/substation-video-monitoring.
[45] M. A. Guvensan and A. G. Yavuz, "On Coverage Issues in Directional Sensor Networks: A Survey," Ad Hoc Networks, PP. 1238-1255, 2011.
[46] MAXIM innovation Delivered, (2011). "MAX2990, 10kHz to 490kHz OFDM-Based Power Line Communications Modem," [Online]. Available: http://www.maxim-ic.com/datasheet/index.mvp/id/5890.
[47] NGSHOPPING, (2010). "85M Cat Power Line Networking Communication High Link 85 Mbps Ethernet," [Online]. Available: http://www.ngshopping.com/Product-2333459-85M-Cat-Modem-Power-Line-Networki.aspx.
[48] Alibaba, (2012). "Wireless WiMAX Modem 3G," [Online]. Available: http://www.alibaba.com/product-gs/518569486/wireless_wimax_modem_3g.html.
[49] Rowe Networks, (2012). "Vecima Networks Base Station WiMAX 5Ghz," [Online]. Available: http://www.rowewireless.com/vecima-networks-base-station-wimax-5ghz.
[50] W.Godwin and et. al., (2012). "SG DA Field Device Data Requirements," [Online]. Available: http://osgug.ucaiug.org/UtiliComm/Shared%20Documents/SG-NET%20PAP%20work-in-progress/DA%20Data%20for%20PAP%20r5.xls.
[51] F. Aalamifar, H. S. Hassanein, G. Takahara, “Viability of Powerline Communication for the Smart Grid”, Queen's Biennial Symposium on Communications, 2012.