Via Afrika Mathematical Literacy - Lebowakgomo Circuit 10/Mathematical Literacy Gr10 S… · Basic...
197
Via Afrika Mathematical Literacy Grade 10 Study Guide A. Gilfillan • N. Vermeulen
Transcript of Via Afrika Mathematical Literacy - Lebowakgomo Circuit 10/Mathematical Literacy Gr10 S… · Basic...

Via AfrikaMathematical Literacy
Grade 10
Study Guide
A. Gilfillan • N. Vermeulen

© Via Afrika Publishers » Mathematical Literacy Grade 10 ii
Contents
Introduction to Mathematical Literacy ................................................................. iii
Topic 1 Basic Skills ........................................................................................... 2overview ........................................................................................................... 3Chapter 1 Numbers and calculations with numbers ............................................. 4 Practice Exercises ..............................................................................................19Chapter 2 Patterns, relationships and representations .......................................25Practice Exercises ............................................................................................. 36
Topic 2 Application of Mathematical Skills ....................................................... 43overview ......................................................................................................... 44Chapter3 Finance ............................................................................................45 Practice Exercises ............................................................................................. 65Chapter4 Measurement ...................................................................................75Practice Exercises ............................................................................................. 94Chapter 5 Maps, plans and other representations of the physical world ...........103 Practice Exercises ............................................................................................ 114Chapter 6 Data Handling ...............................................................................122Practice Exercises ............................................................................................140Chapter 7 Probability .................................................................................... 145Practice Exercises ............................................................................................ 153
Exam Papers .................................................................................................... 155How question papers are drawn up ................................................................... 155Question Paper 1..............................................................................................162Question Paper 2 .............................................................................................168Question Paper 1 Memorandum ........................................................................ 172Question Paper 2 Memorandum ........................................................................180
Glossary ..........................................................................................................186

© Via Afrika Publishers » Mathematical Literacy Grade 10 iii
Introduction to Mathematical Literacy
What is Mathematical Literacy all about?
According to the Curriculum and Assessment Policy Statement (CAPS) for Mathematical Literacy:
The competencies developed through Mathematical Literacy allow individuals to make sense of, participate in and contribute to the twenty-first-century world — a world characterised by numbers, numerically based arguments and data represented and misrepresented in a number of different ways.
Such competencies include the ability to reason, make decisions, solve problems, manage resources, interpret information, schedule events and use and apply technology.
Learners must be exposed to both mathematical content and real-life contexts to develop these competencies.
Mathematical content is needed to make sense of real-life contexts; on the other hand, contexts determine the content that is needed.
It is clear that, in Mathematical Literacy, both mathematical content and real-life contexts are crucial. Mathematical content provides us with a means for accessing and making sense of real-life contexts, while real-life contexts provide meaning for the content and a reason for learning the content.
Equally important to content and context, however, is that learners must develop problem-solving skills. This involves the ability to apply mathematical content in order to solve problems based on often complex and unfamiliar real-life contexts. The focus in Mathematical Literacy is on the use of content rather than on the knowing of content.
Problem-solving skills Problem-solving skillsv Problem-solving skil
ls P
robl
em-s
olvi
ng s
kills
Content Content

© Via Afrika Publishers » Mathematical Literacy Grade 10 iv
How this guide will help youThis Via Afrika Study Guide will help you prepare for your Grade 10 end-of-year examination. The authors carefully thought of what a learner requires to effectively prepare for and successfully write the examination. They identified these needs:
●● an understanding of the basic mathematical content that will be assessed in the end-of-year examination
●● an understanding of the nature and purpose of Mathematical Literacy, and how it will be assessed
●● an example of Paper 1 and Paper 2 with complete solutions, accompanied by comments to help you understand how to answer each question.
To meet these needs, this Study Guide has been divided into the following topics:
Topics 1 and 2 – Basic and Application Mathematical SkillsThese contain summaries of the mathematical content and skills that you should learn.
The topics have been divided into chapters, each dealing with a different concept. It follows this pattern:
●● revision of the concepts outlined in the curriculum for Grade 10●● examples based on the concepts covered●● practice exercises that give you opportunities to practise what you have learnt.
Work through the topics thoroughly to enable you to apply the necessary concepts and skills when you work through the exam papers.
Exam question papersThis section contains information about:
●● how exam question papers are drawn up●● how Paper 1 is different to Paper 2●● the four levels on which you will be assessed●● how to approach answering questions in any exam (or test) paper.
In addition, this section contains:●● examples of Paper 1 and Paper 2●● memoranda (solutions) to the two papers●● comments in the memoranda to help you understand and answer each question.
These comments refer to the level of the question, the purpose of the question, and the content or skills required to answer the question.

Unit XX
©Via Afrika Publishers » Mathematical Literacy Grade 10 2
Basic skills
Topic 1
Basic skills
Numbers and
calculations with
numbers
TOPIC 1 Page 2
CHAPTER 1 Page 4
∙ Making sense of graphs that tell a story
∙ Relationships and variables
∙ Linear relationships
∙ Non-linear relationships
∙ Constant (fixed) relationships
∙ More about equations
∙ Number formats and conventions
∙ Operations on numbers and calculator skills
∙ Rounding
∙ Ratio
∙ Proportion
∙ Rate
∙ Percentage
Pattern, relationships
and representations
CHAPTER 2 Page 25

Unit XX
©Via Afrika Publishers » Mathematical Literacy Grade 10 3
Numbers and calculations with numbers
Chapter 1
Overview
Basic skills
CHAPTER 2
Number formats and
conventions
SECTION 1 Page 3 ∙ The thousands separator
• Number conventions and decimals
• Different numbering conventions
• Negative &positive numbers as directional indicators
∙ Order of operations
• Powers and roots
• Calculator skills
• Fractions
• Estimation
• Dividing & multiplying by 10, 100,1000 without a
calculator
Operations on numbers
and calculator skills
SECTION 2 Page 4
• Rounding off
• Rounding up
• Rounding downRounding
SECTION 3 Page 8
• Basic principles
• Calculating using ratio: The Unit Method
• Comparing ratios
• Sharing an amount in a given ratio
Ratio
SECTION 4 Page 10
• Direct proportion
• Indirect (inverse) proportionProportion
SECTION 5 Page 13
• Constant rate
• Average rateRate
SECTION 6 Page 14
Percentage
SECTION 7 Page 16

Unit XX
©Via Afrika Publishers » Mathematical Literacy Grade 10 4
Section 1
Number formats and conventions
The thousands separator●● In large numbers, we use spaces to separate thousands. For example:●● 2 876 950 is ‘2 million eight hundred and seventy six thousand nine hundred and
fifty’.●● In most overseas countries, commas are used to separate thousands. So, in the USA
for example, this number would be written as 2,876,950.●● Large numbers that you need to know include:●● 100 000 = one hundred thousand
1 000 000 = 1 million 1 000 000 000 = 1 billion.
Number conventions and decimals●● A decimal comma indicates that a number includes both a whole number and a part
of a whole. So, R25,95 means ‘25 rands and 95 parts of a rand’. ●● In South Africa we use the decimal comma (0,95) while on your calculator and in
most overseas countries the decimal point (0.95) is used.●● We read the numbers that occur after the comma as they occur. So 0,95 reads as ‘zero
comma nine five’ (or ‘ninety five cents’ in the context of money).
Different numbering conventions●● Different contexts sometimes have different numbering rules, e.g. in cricket 2.4 does
not mean ‘2 and 0,4’, but rather ‘2 overs and 4 balls’.●● 1524 in room numbering does not mean that the building has 1 524 rooms, but rather
that it is room 24 on the 15th floor (so, 15 - 24).
Negative and positive numbers as directional indicatorsNegative and positive numbers are used to indicate a ‘direction’ away from zero. Negative numbers are less than zero, while positive numbers are more than zero.
These numbers mean different things in different contexts:
Temperature:–10⁰C (‘minus 10’) means ‘10⁰C below 0⁰C’ Money: –R1 000 (Negative R1 000) as a bank balance means that you have
less than nothing (R0,00) in your bank account (So you owe the bank R1 000!). A positive balance (e.g. R5 000) would mean that the bank owes you money.
Percentage: –1,5% (Negative 1,5%) means that the stock has decreased in value by 1,5%, while +3,4% means that the stock has increased in value by 3,4%.

Unit XX
©Via Afrika Publishers » Mathematical Literacy Grade 10 5
Operations on numbers and calculator skills
Section 2
Order of operationsThe order of operations refers to the order in which we perform the operations in a problem in several steps (such as +, –, x, ÷, √, etc.). This order is given by BODMAS. This means:
Brackets (inside them)pOwers (or rOots or Of (which means multiply)) DivideMultiply AddSubtract
Example:Apply the rules to this example: 3 + 5 × (9 – 3)2
1st: Brackets (inside them): 3 + 5 × (9 – 3)2 = 3 + 5 × (6)2
2nd: Powers: 3 + 5 × (6)2 = 3 + 5 × (6 × 6) = 3 + 5 × 363rd: Multiplication: 3 + 5 × 36 = 3 + 1804th: Addition: 3 + 180 = 183
Powers and RootsA number raised to a power (e.g. 24), means that we need to multiply that number by itself as many times as the power indicates: 24 = 2 × 2 × 2 × 2 = 16
A root is the opposite of a power and is shown by the symbol√__
.
So 52 = 5 × 5 = 25, therefore √___
25 = 5 (a square root asks the question “what number multiplied by itself will give me 25?” and the answer is 5.)
Calculator SkillsFor more complex calculations, you can use a calculator. You do not need a scientific calculator in Mathematical Literacy. A basic one will be enough. You should familiarise yourself with the various operations that your calculator can perform.

Unit XX
©Via Afrika Publishers » Mathematical Literacy Grade 10 6
Section 2
Key Meaning Operation Basic Calculator Scientific Calculator
Operation Buttons 2 + 3
Change sign button – 200 + 150
Or
Square root button √
__ 9
Add / Subtract from memory
12 + 34 + 2 + 17 +…(adding any sequence of numbers)
…
…
Memory recall
Recalling number that is in the memory
2nd F M+(This function varies per calculator)
Cancel All button
Cancels all operations. (or AC ‘All Cancel’)
Delete current value
Deletes current value and leaves operations at current stage.
(or DEL)
Figure 1 Calculator skills
FractionsIn real life we often find a situation where we have a part of a whole. This is expressed using fractions.
Fraction Basics 5 __ 8 means ‘5 parts out of 8 total parts’. Parts of a whole can be represented as a proper fraction, a decimal fraction or a percentage. They are all ways of showing the same situation:
Proper fraction Decimal Fraction Percentage
Actual Parts ÷ = 0,625 = 0,625 × 100% = 62,5%
[Use your calculator: 5 ÷ 8]
5 __ 8

Unit XX
©Via Afrika Publishers » Mathematical Literacy Grade 10 7
Section 2
Equivalent fractions 10 __ 16 has the same value as 5 __ 8 . Fractions will be equivalent as long as we multiply both the
numerator and denominator (top and bottom numbers of the fraction) by the same factor:
5×2 ___ 8×2 = 10 __ 16
More than the totalOften we find that we have more than the total parts, like this: 12 __ 5
12 ÷ 5 = 2,4: This means that we have enough ‘parts’ to make up 2 wholes and some left over ‘bits’.
Thus, 2,4 means 2 + 0,4 = 2 + = 2 + = 2
Mixed fractions to decimal fractionsWhen converting mixed fractions to decimals, we look at the fraction part, convert it to a decimal fraction and then add it back, like this:
5 1 __ 4 = 5 + 1 __ 4 = 5 + (1 ÷ 4) = 5 + 0,25 = 5,25
Calculating with fractions
Multiplying with fractionsExample:
Convert a temperature of 27 ⁰C to ⁰F: 9 __ 5 × 27 + 32
Step 1: Convert the fraction to a decimal fraction: 9 ÷ 5 = 1,8
Step 2: Perform the calculation: 1,8 × 27 + 32 = 48,6 + 32 = 80,6
Addition or subtraction of fractionsExample:
A manufacturer offers a discount of a 1 _ 5 off the original price and because you are a preferred customer, he gives you a further 1 __ 10 off the original price. What is the total discount offered?
Step 1: Convert the fractions to decimal fractions: 1 _ 5 = 1 ÷ 5 = 0,2
1 __ 10 = 1 ÷ 10 = 0,1
Step 2: Add the given fractions: 0,2 + 0,1 = 0,3

Unit XX
©Via Afrika Publishers » Mathematical Literacy Grade 10 8
Section 2
We can leave the fraction as a decimal fraction or we can even convert it to a percentage by multiplying by 100%: 0,3 × 100% = 30%
Division of fractionsWhen we divide by a whole number, the answer is smaller than when we began (we are splitting up the original number). However, when we divide by a fraction, the number becomes larger than the original.
Example: 50 ÷ 2 = 25 (There are 25 twos in 50)
50 ÷ 1 _ 2 = 50 ÷ 0,5 = 100 (There are 100 halves in 50)
EstimationEstimation skills are useful in judging whether a calculated answer is correct. Although a calculator is a very powerful tool, you need to be able to estimate your calculator’s answer to judge whether it is correct. Also, you might want to keep track of your expenses as you shop, so that you can judge whether the amount payable to the cashier is correct. This would also need estimation skills.
We estimate by rounding off to numbers that are easy to calculate with, and then do our calculations with them.
Example: The answer of (282 + 634) ÷ 9 can be estimated as follows:
(300 + 600) ÷ 9 = (900) ÷ 9 = 100
So we can expect our answer to be approximately 100 (the answer is actually 101,78).
Dividing & multiplying by 10, 100, 1 000 without a calculatorMultiplying by 100 Dividing by 100Move the decimal comma to Move the decimal comma to the left
the right the same number of the same number of spaces as
spaces as the number of zeroes. the number of zeroes.
0,5 × 100 ==> 0, 5 0 ==>50 0,5 ÷ 100 ==> 0 0 0 ,5 ==>0,005
We add zeroes as we need them to accommodate the moved decimal.

Unit XX
©Via Afrika Publishers » Mathematical Literacy Grade 10 9
Rounding
Section 3
There are three types of rounding, namely rounding off, rounding up and rounding down.
Rounding offRounding off means we round to a specific number of decimal places, using the following principle:
●● Identify the rounding digit (e.g. the second decimal digit if we need to round off to two decimal places).
●● Look at the next digit in the number. If the next digit is: 0 to 4: Rounding digit stays the same.
5 to 9: Rounding digit increases by one.
Example: Rounding to a given position
Rounding digit Next digit is a 6, so rounding digit increases by one
Round 57,836 to 2 decimal places: 57,836 ≈ 57,84
Round 28,45 to the nearest whole number: 28 (The next digit is a 4)
Round 185 295 km to the nearest thousand: 185 000 km (the next digit is 2)
Rounding UpRounding up is where we round a number up to the nearest whole number. This occurs in situations where it would not be practical to have a “bit” of a number so we need to have another whole number.
Example:How many taxis will we need to transport 35 people if each taxi can carry 15 passengers?
Number of taxis = 35 ÷ 15 = 2,3333... ≈ 3 taxis

Unit XX
©Via Afrika Publishers » Mathematical Literacy Grade 10 10
Section 3
In this example, the answer must be:
●● rounded up to a whole number, since it is not possible to use 0,3333 of a taxi.●● rounded up, since an additional taxi is needed to carry the 5 people who could not
fit into the first 2 taxis.
Rounding DownRounding down is where we round a number down to the nearest whole number because we cannot have any “leftovers”.
Example:
How many movie tickets can you buy with R100,00 if each movie ticket costs R17,00?
Number of movie tickets = R100,00 ÷ R17,00
= 5,88235
≈ 5 tickets
In this example, the answer must be:
●● rounded to a whole number, since it is not possible to buy a part of a ticket.●● rounded down, since there is not enough money to buy 6 tickets.

Unit XX
©Via Afrika Publishers » Mathematical Literacy Grade 10 11
Ratio
Section 4
Basic principlesWe can use ratio to compare two or more quantities of the same kind and of the same unit with each other, for example, the ratio in which fruit juice concentrate and water is mixed is 1:3.
●● We do not write any units in a ratio. (A ratio simply compares relative sizes, e.g. amount of concentrate : amount of water. However it is important that the units must be the same, e.g. litres in this case.)
●● The order is important. In this example, Concentrate : Water = 1 : 3 (not 3 : 1).●● Ratios can be expressed side by side (1 : 3) or as a fraction ( 1 _ 3 ).●● Any multiplication or division on one side of the ratio must be repeated on the other
side of the ratio, e.g. 1 : 3 is equivalent to 3 : 9.
Example: Determine missing numbers in a ratioTo mix fruit juice, the ratio must be concentrate : water = 1 : 3. How much water is needed if I have 3 litres of concentrate?
Concentrate : Water
1 : 3
×3 ×3 as well
3 : 9
So, I will need 9 litres of water.
Calculating using ratio: The unit methodWhen working with ratio, you will often encounter situations similar to the example below:
Example:
When tiling a floor, the ratio of white tiles to brown tiles in the pattern must be 2 : 3. How many white tiles must be bought if 105 brown tiles were used?
Step 1: Write the down the ratio (with headings for each quantity) White : Brown 2 : 3

Unit XX
©Via Afrika Publishers » Mathematical Literacy Grade 10 12
Section 4
Step 2: Convert the given value to 1 (by dividing by the number itself). We are told that there will be 105 brown tiles, so we convert the number of brown tiles to 1:
White : Brown 2 : 3 ÷ 3 1
Step 3: Convert the 1 to the desired value and do the same two steps on the other side of the ratio.
White : Brown Same steps ÷ 3 2 : 3 as the other 1 side × 105 × 105 70 : 105
So, 70 white tiles must be bought.
Comparing ratiosThere is an effective way of comparing ratios. When comparing ratios, one of the two quantities in the two ratios must be the same. For example, if we want to compare a 500 g box of pasta that costs R5,95 with a 350 g box of pasta that costs R3,45 to decide which is the better value, we need to convert either the weight or the price to a common value.
Example:To compare the values of the two boxes of pasta, we will convert both ratios to have a weight of 1 kg (i.e. we are actually using the unit method).
500 g box 350 g box g : cents g : cents 500 : 595 350 : 345 ÷500 ÷ 500 ÷ 350 ÷ 350 1 : 1,19 1 : 0,986
So, for the 500 g box we pay 1,19 cents for every 1 g of pasta, while for the 350 g box we pay only 0,986 cents for every 1 g of pasta.
Therefore, the 350 g box offers better value.
Unit XX
©Via Afrika Publishers » Mathematical Literacy Grade 10 13
Section 4
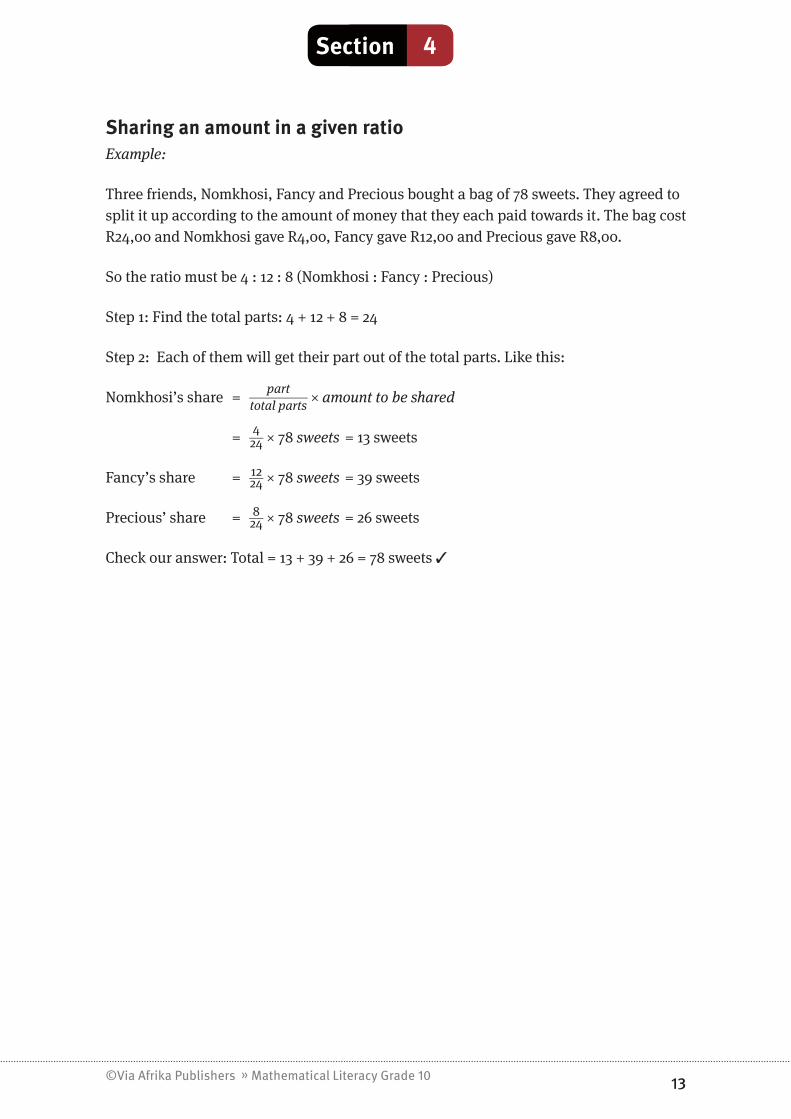
Sharing an amount in a given ratioExample:
Three friends, Nomkhosi, Fancy and Precious bought a bag of 78 sweets. They agreed to split it up according to the amount of money that they each paid towards it. The bag cost R24,00 and Nomkhosi gave R4,00, Fancy gave R12,00 and Precious gave R8,00.
So the ratio must be 4 : 12 : 8 (Nomkhosi : Fancy : Precious)
Step 1: Find the total parts: 4 + 12 + 8 = 24
Step 2: Each of them will get their part out of the total parts. Like this:
Nomkhosi’s share = part ________ total parts × amount to be shared
= 4 __ 24 × 78 sweets = 13 sweets
Fancy’s share = 12 __ 24 × 78 sweets = 39 sweets
Precious’ share = 8 __ 24 × 78 sweets = 26 sweets
Check our answer: Total = 13 + 39 + 26 = 78 sweets ✓

Unit XX
©Via Afrika Publishers » Mathematical Literacy Grade 10 14
Proportion
Section 5
Proportion refers to how two quantities are related to each other. There are two kinds of proportion: Direct Proportion and Inverse Proportion.
Direct ProportionTwo quantities are in direct proportion when the following applies: If one quantity increases (or decreases), the other quantity also increases (or decreases) bythesamefactor. The two quantities will therefore remain in the same ratio.
For example: × 5 1 loaf of bread costs R6,00 × 5
5 loaves of bread cost R30,00
Note:The ratio loaves of bread : cost remains the same: In the case of one loaf, we have loaves : cost = 1 : 6 In the case of 5 loaves, we have loaves : cost = 5 : 30 = 1 : 6
Indirect (Inverse) ProportionTwo quantities are in inverse proportion when the following applies: If one quantity increases by a certain factor the other quantity decreases by the same factor. This usually happens when some total is shared equally (e.g. sharing a cake or an amount of work).
For example: 6 postal workers deliver mail to 300 houses each. Two workers get sick. To how many houses do each of the remaining 4 workers have to deliver if they agree to share the total equally?
6 workers deliver to 300 houses ÷ 6 __ 4 × 6 __ 4 4 workers deliver to 450 houses
Note:
The total number of houses stayed the same
(6 × 300 = 1 800 houses and 4 × 450 = 1 800 houses)
Unit XX
©Via Afrika Publishers » Mathematical Literacy Grade 10 15
Section 6
Rate
In situations where two quantities are in direct proportion, we often express this relationship using the concept of rate, for example:
●● Tomatoes cost R5,25 per kg (also written as R5,25/kg).●● A small car uses 14 litres of petrol per km (also written as 14l/km).●● A train travels at an average speed of 85 kilometres per hour (also written as
85 km/h).
Note:The two quantities are linked by the word per per means “for every one” and is shown by the symbol “/”.
Example: a speed of 120 km/h is read as “120 kilometres per hour” and means “120 kilometres for every one hour travelled ”.
Rate uses directproportion (which means as one quantity changes the other quantity changes by the same factor).
There are two types of rate, namely constant rate and average rate.
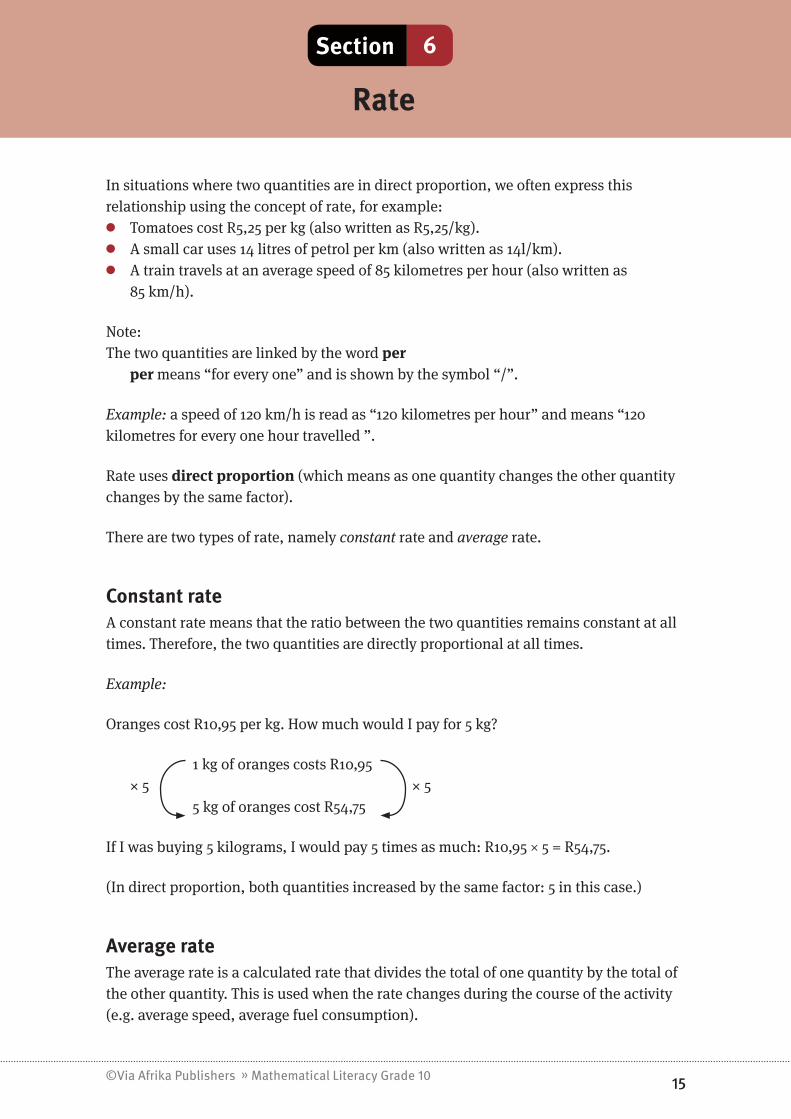
Constant rateA constant rate means that the ratio between the two quantities remains constant at all times. Therefore, the two quantities are directly proportional at all times.
Example:
Oranges cost R10,95 per kg. How much would I pay for 5 kg?
1 kg of oranges costs R10,95 × 5 × 5 5 kg of oranges cost R54,75
If I was buying 5 kilograms, I would pay 5 times as much: R10,95 × 5 = R54,75.
(In direct proportion, both quantities increased by the same factor: 5 in this case.)
Average rateThe average rate is a calculated rate that divides the total of one quantity by the total of the other quantity. This is used when the rate changes during the course of the activity (e.g. average speed, average fuel consumption).

Unit XX
©Via Afrika Publishers » Mathematical Literacy Grade 10 16
Section 6
Example:
Colin travelled a distance of 240 km in 3 hours. What was Colin’s average speed?
km : h 240 : 3 ÷ 3 ÷ 3 80 : 1
So in 1 hour Colin travelled 80 km. Therefore, his average speed was 80 kilometres per hour, i.e. 80 km/h.

Unit XX
©Via Afrika Publishers » Mathematical Literacy Grade 10 17
Percentage
Section 7
The word “percent” means “out of 100” (per =“out of ” and cent =100). So, 46% means 46 parts out of 100 total parts.
It is important to understand that, when you convert a value to a percentage, you are converting the value to a fraction that has a denominator of 100.
There are five types of percentage questions. Let’s consider each one.
1. Calculating a percentage of a value:
Example: 12% of 50 =12% × 50 = 12 ___ 100 × 50 = 6
2. Expressing a value out of another value as a percentage:
Example: Express 36 out of 60 as a percentage
= 36 ___ 60 of 100 = 36
___ 60 × 100 = 60%
3. Increasing or decreasing an amount by a percentage:
Example: Increase 360 by 20% 20% of 360 = 20 ___ 100 × 360 = 72 To increase means to make greater, so the new amount is 360 + 72 = 432
4. Percentage change (can also be used when calculating profit margin andinflation):
Example: By what percentage has a tyre’s pressure changed if it has decreased from 200 Pa to 170 Pa?
Decrease in pressure = 30 Pa The percentage decrease from what it was = × 100 = 15% The following formula can also be used to calculate percentage increase:
% increase _______ original × 10036 _____ 60

Unit XX
©Via Afrika Publishers » Mathematical Literacy Grade 10 18
Section 7
5. Determining the original amount after a percentage has been added or subtracted
Example: Find the original amount if the price of a shirt increases by 25% to R52,50. The original price represents 100%. So, an increase of 25% means that the
new price is 100% + 25% =125%.
% : Price (R) 125 : 52,50 (100 ÷ 125 = 0,8) 100 : 42 (52,50 × 0,8 = 42)
So, the original price was R42,00.

Unit XX
©Via Afrika Publishers » Mathematical Literacy Grade 10 19
Practice Exercises
Question 1: Decorative tiles 10 marks
A man is laying decorative tiles along the edge of a corridor. His design consists of the following pattern of 4 square tiles. He repeats this pattern all along the length of the corridor:
1.1 Write down the ratio of each of the coloured tiles as follows: Orange : Green : Blue = … (1)1.2 Write down the fraction of the pattern that is made up of blue tiles. (1)1.3 Each tile is 5 cm long. The man needs to tile a corridor that is 52 m long.
1.3.1 Convert 52 m into cm (remember that there are 100cm in 1 m). (1)1.3.2 How many tiles will be required to tile the corridor (using your
previous answer)? (2)1.4 How many orange tiles will the man need to purchase? (2)1.5 The orange tiles are sold in boxes of 50 per box. How many boxes will the
man need to buy? (3)
Question 2: Salaries 11 marks2.1 An area manager for a store earns R330 000 per year.
2.1.1 Write out R330 000 in words. (1)
2.1.2 When you write 330 000 on your calculator it sometimes comes out as 330,000. Explain the purpose of the comma. (1)
2.2 The area manager is going to get an increase of 8% this year. Calculate her new annual salary. (3)
2.3 She will be paying 30% of her total annual salary to the South African Revenue Service (SARS) in income tax.
2.3.1 Convert 30% to a decimal number. (1)
2.3.2 Calculate the amount of income tax she will be paying to SARS after her salary increase (using your answer to question 2.2). (2)
2.3.3 Calculate how much of her salary she will receive after tax. (2)
2.4 If she is paying 30% of her income to SARS as income tax, what percentage of her salary is left over? (1)
Question 3: Calculations involving fractions 11 marks3.1 After a party, there are quite a few unfinished bottles of cooldrink.
There are two bottles that are 3 __ 4 full, five bottles that are 1 _ 2 full and two bottles that are 1 __ 4 full.

Unit XX
©Via Afrika Publishers » Mathematical Literacy Grade 10 20
Practice Exercises
3.1.1 Write 3 __ 4 as a decimal number. (1)
3.1.2 All of the cooldrink is the same flavour, so it is decided to pour all of the remaining cooldrink together. We can show how much cooldrink we will have in total like this:
2 × 3 __ 4 + 5 × 1 _ 2 + 2 × 1 __ 4
a. Re-write the calculation and put brackets around the part of the calculation that will be done first. (1)
b. Now perform the calculation to work out how many whole bottles of cooldrink could be made from the leftover bottles. (3)
3.2 On the TV news you will occasionally hear that the stock market rose by “one-eighth of one percent”. This can be written like this: 1 __ 8 of 1%.
3.2.1 Write 1 __ 8 as a decimal number. (1)
3.2.2 Calculate 1 __ 8 of 1% (leave your answer in decimal form). (3)
3.2.3 Convert your answer in 3.2.2 to a percentage. (2)
Question 4: Fuel for a road trip 19 marks4.1 A 22-seater taxi uses petrol at an average rate of 11 ℓ/100 km.
4.1.1 Explain what of 11 ℓ/100 km means. (1)
4.1.2 Approximately how much fuel will be required for a journey of 540km? (Round your answer to 1 decimal place.) (3)
4.1.3 How many km could the taxi travel if it had 37ℓ of petrol in its tank? (Round your answer to the nearest km.) (3)
4.2 The taxi was hired by a group of 15 people for an outing, and they paid R4 200 in total.
4.2.1 How much did they each pay towards the hire of the taxi if they each paid the same amount? (2)
4.2.2 If another 5 people joined them, how much would they each have to pay then? (2)
4.2.3 What would happen to the price each person has to pay if the total number of people decreases (gets less)? (1)
4.3 The taxi operator offers them another deal. They can either hire the taxi for R4 200 or they can pay only R2 500, but then they will have to pay for the fuel themselves.
The journey is 630 km each way (there and back) and petrol costs R10,50/ℓ. The taxi uses petrol at an average rate of 11 ℓ/100 km.
Which option is cheaper? Show all your workings. (7)

Unit XX
©Via Afrika Publishers » Mathematical Literacy Grade 10 21
Thinking LevelsQuestion Working Marks Criteria TL1 TL2 TL3 TL41.1 1 : 2 : 1 1 1 mark: answer 1 1.2 1 __ 4 1 1 mark: answer 1
1.3.1 1 m = 100 cm 52 m = 5 200 cm 1 1 mark: answer 1
1.3.2 5 200 cm ÷ 5 cm = 1 040 tiles 2 1 mark: method 1 mark: answer 2
1.4 1 __ 4 of 1 040 tiles = 260 tiles 2 1 mark: method 1 mark: answer 2
1.5
260 tiles ÷ 50 tiles/box = 5,2 boxes Therefore he will need to buy at least 6 boxes (he needs a little more than 5 boxes)
3
1 mark: method 1 mark: answer 1 mark: correct rounding
3
Question 1: 10
2.1.1 Three hundred and thirty thousand Rand 1 1 mark: answer 1
2.1.2
The comma is a “thousands separator” (just like the space in 330 000). It is NOT a decimal comma.
1 1 mark: answer 1
2.2
Increase = 8% of R330 000 = 8 ___ 100 x 330 000 = R26 400 Therefore, her new salary is = R330 000 + R26 400 = R356 400
3
1 mark: 8% of amount method 1 mark: 8% answer correct 1 mark: final total correct (CA)
3
2.3.1 30% = 30 ÷ 100 = 0,3 1 1 mark: answer 1
2.3.2
30% of R356 400
= 30
___ 100 x R356 400
= R106 920
2 1 mark: method 1 mark: answer (CA) 2
2.3.3 After tax = R356 400 – R106 920 = R249 680 2 1 mark: method
1 mark: answer 2
2.4 70% will be left over (100% – 30% = 70%) 1 1 mark: answer 1
Question 2: 11
Answers to questions

Unit XX
©Via Afrika Publishers » Mathematical Literacy Grade 10 22
Answers to questions
Thinking LevelsQuestion Working Marks Criteria TL1 TL2 TL3 TL43.1.1
3 __ 4 = 3 ÷ 4 = 0,75 1 1 mark: answer 1
3.1.2
a. (2 × 3
__ 4 ) + (5 × 1 __ 2 ) + (2 × 1 __ 4 )(The learners could also simply have put brackets around each of the fractions because they could also be calculated first).
1 1 mark: answer 1
b. (2 x 3 ÷ 4) + (5 x 1 ÷ 2) + (2 × 1 ÷ 4) = 1,5 + 2,5 + 0,5 = 4,5 bottles Therefore, there will be 4 whole bottles of cooldrink that could be made up.
3
1 mark: working 1 mark: answer 1 mark: correct whole number of bottles
3
3.2.1 1 __ 8 = 1 ÷ 8 = 0,125 1 1 mark: answer 1
3.2.2 1 __ 8 of 1% = 0,125 × (1 ÷ 100) = 0,00125
3
1 mark: 1% correct as a decimal 1 mark: “of” used as “×”1 mark: answer
3
3.2.3 As a percentage: 0,00125 x 100 = 0,125% 2 1 mark: method
1 mark: answer (CA) 2
Question 3: 11
Thinking LevelsQuestion Working Marks Criteria TL1 TL2 TL3 TL41.1 1 : 2 : 1 1 1 mark: answer 1 1.2 1 __ 4 1 1 mark: answer 1
1.3.1 1 m = 100 cm 52 m = 5 200 cm 1 1 mark: answer 1
1.3.2 5 200 cm ÷ 5 cm = 1 040 tiles 2 1 mark: method 1 mark: answer 2
1.4 1 __ 4 of 1 040 tiles = 260 tiles 2 1 mark: method 1 mark: answer 2
1.5
260 tiles ÷ 50 tiles/box = 5,2 boxes Therefore, he will need to buy at least 6 boxes (he needs a little more than 5 boxes).
3
1 mark: method 1 mark: answer 1 mark: correct rounding
3
Question 1: 10

Unit XX
©Via Afrika Publishers » Mathematical Literacy Grade 10 23
Answers to questions
Thinking LevelsQuestion Working Marks Criteria TL1 TL2 TL3 TL4
2.1.1 Three hundred and thirty thousand Rand 1 1 mark: answer 1
2.1.2
The comma is a “thousands separator” (just like the space in 330 000). It is NOT a decimal comma.
1 1 mark: answer 1
2.2
Increase = 8% of R330 000 = 8 ___ 100 × 330 000 = R26 400 Therefore, her new salary = R330 000 + R26 400 = R356 400
3
1 mark: 8% of amount method 1 mark: 8% answer correct 1 mark: final total correct (CA)
3
2.3.1 30% = 30 ÷ 100 = 0,3 1 1 mark: answer 1
2.3.230% of R356 400 =
30 ___ 100 × R356 400
= R106 9202 1 mark: method
1 mark: answer (CA) 2
2.3.3 After tax = R356 400 – R106 920 = R249 680 2 1 mark: method
1 mark: answer 2
2.4 70% will be left over (100% – 30% = 70%) 1 1 mark: answer 1
Question 2: 11
Thinking LevelsQuestion Working Marks Criteria TL1 TL2 TL3 TL43.1.1
3 __ 4 = 3 ÷ 4 = 0,75 1 1 mark: answer 1
3.1.2
a. (2 × 3
__ 4 ) + (5 × 1 __ 2 ) + (2 × 1 __ 4 )(The learners could also simply have put brackets around each of the fractions because they could also be calculated first).
1 1 mark: answer 1
b. (2 × 3 ÷ 4) + (5 × 1 ÷ 2) + (2 × 1 ÷ 4) = 1,5 + 2,5 + 0,5 = 4,5 bottles Therefore, there will be 4 whole bottles of cooldrink that could be made up.
3
1 mark: working 1 mark: answer 1 mark: correct whole number of bottles
3
3.2.1 1 __ 8 = 1 ÷ 8 = 0,125 1 1 mark: answer 1
3.2.2 1 __ 8 of 1% = 0,125 × (1 ÷ 100) = 0,00125
3
1 mark: 1% correct as a decimal 1 mark: “of” used as “x” 1 mark: answer
3
3.2.3 As a percentage: 0,00125 × 100 = 0,125% 2 1 mark: method
1 mark: answer (CA) 2
Question 3: 11

Unit XX
©Via Afrika Publishers » Mathematical Literacy Grade 10 24
Answers to questions
Thinking LevelsQuestion Working Marks Criteria TL1 TL2 TL3 TL4
4.1.111ℓ/100km means “11 litres of fuel are used for every (per) 100 kilometres”
1 1 mark: answer 1
4.1.2
ℓ km 11 : 100 59,4 : 540 (litres: 540km ÷ 100 km × 11l = 59,4l)
3
1 mark: method 1 mark: working 1 mark: answer (rounded to 1 decimal point)
3
4.1.3
ℓ km 11 : 100 37 : 336 (km: 37 ℓ÷ 11ℓ × 100 km = 336 km)
3
1 mark: method 1 mark: working 1 mark: answer (rounded to 1 decimal point)
3
4.2.1 R4 200 ÷ 15 = R280 per person 2 1 mark: method 1 mark: answer 2
4.2.2 R4 200 ÷ 20 = R210 per person 21 mark: divide by 20 people 1 mark: answer
2
4.2.3 The amount per person would increase 1 1 mark: answer 1
4.3
Amount of fuel required: ℓ km 11 : 100 69,3 : 630(litres: 630km ÷ 100 km × 11ℓ = 69,3ℓ)Cost of petrol: R10,50 × 69,3ℓ = R727,65Total cost of hire= R2 500 + 2 × R727,65= R3 955,30So, the second option is cheaper than the original offer.
7
1 mark: method for working out fuel 1 mark: answer for amount of fuel 1 mark: total cost of petrol method 1 mark: total cost of petrol (CA) 1 mark: total cost of hire method 1 mark: total cost of hire 1 mark: analysis
6 1
Question 4: 19

©Via Afrika Publishers » Mathematical Literacy Grade 10 25
Section 1
Patterns, relationships and representations
Chapter 2
Overview
Patterns, relationships
and representations
CHAPTER 2 Page 25
Making sense of graphs
that tell a story
∙ Interpreting a graph
∙ Different ways of describing and representing
relationships
• Continuous and discrete variablesRelationships and
variables
SECTION 2 Page 27
• Direct proportion linear relationships
• Linear relationships with no direct proportionLinear relationships
SECTION 3 Page 28
• Non-linear inverse proportion relationships
Non-linear
relationships
SECTION 4 Page 31
Constant (fixed)
relationships
SECTION 5 Page 33
• Substituting into equations
• Solving equationsMore about equations
SECTION 6 Page 34
SECTION 1 Page 26

©Via Afrika Publishers » Mathematical Literacy Grade 10 26
Section 1Section 1
Making sense of graphs that tell a story
Interpreting a graphA very important skill you need to develop is the ability to explain what information a graph represents, and what the shape of a graph tells you about the information in the graph. The following table shows some of the important terms relating to graphs that you should know and understand.
Slope This is the steepness of the graphIncreasing Looking from left to right, the graph is risingDecreasing Looking from left to right, the graph is falling
Constant change The graph increases or decreases by a constant value. This type of graph is always a straight line (linear)
No change Looking from left to right, the graph is flatPoint A pair of corresponding independent and dependent variablesx-axis Horizontal axis that shows values for the independent variabley-axis Vertical axis that shows values for the dependent variable
Example:Consider the following graph. Let’s use the clues that we have and try to tell the story of the graph.
Thestory:
0
5
10
15
20
25
30
35
10
Time (hours)
Dist
ance
(km
)
Grace’s JourneyAunt’s Home
Grace’sHome
2 3 4 5 6 7
Figure 2 The time and distance of Grace’s journey
●● The title tells us that this is a picture of a journey by someone called Grace.●● The labels on the axes tell us that we are looking at a graph of distance travelled in
kilometres versus time in hours.●● Between hours 0 and 2, she travels at constant speed. We can see this because the
graph is a straight line.●● She then slows down between hours 2 and 3. Here, the graph is not as steep as it was
between hours 0 and 2.●● Then she stops between hours 3 and 5 (the graph is flat).●● She then travels at a constant speed (straight line = constant change) from hours 5 to 7.

©Via Afrika Publishers » Mathematical Literacy Grade 10 27
Section 1
Relationships and variables
Section 2
In life, we have many measurable quantities. Mostly these are simply measurements. For example, weight is a measure of how heavy an object is and cost is a measure of how much an item costs.
However, sometimes two quantities become linked, or related to each other. For example, we can link weight and cost if we think in terms of buying a bag of tomatoes. Let’s say the price is R4,95 per kg. The heavier the bag of tomatoes, the more you will pay. In this way, two unrelated quantities can form a relationship.
When quantities are related, a change to one quantity will cause a change in the other quantity. Because these quantities can change (or vary), we call them variables. Also, the value of one variable depends on the value of the other variable. For example, the cost of your tomatoes will depend on the weight of the tomatoes you buy. Therefore, one variable is called the dependent variable (the cost in this case), while the other variable is called the independent variable (the weight of the tomatoes in this case).
So, we can say that the cost of the tomatoes you buy depends on the weight of the tomatoes.
Different ways of describing and representing relationshipsWe can describe and represent any relationship in three ways:
●● A table of values●● A graph●● An equation
Remember that each representation still refers to the same relationship.
Continuous and discrete variablesIn our tomato scenario above, the two variables (weight and cost) could have any value. Such variables are called continuousvariables. However, in relationships where we work with people or objects as variables, these variables cannot have any value. They can only have whole values, such as 1, 2, 3, and so on. Such variables are called discretevariables.
When drawing a graph of continuous variables, we draw a solid graph. However, when we draw a graph of discrete variables, we only show the points on the graph with whole-valued numbers. We do not join these points with a solid line. However, we could join them with a dotted line.
Relationship
GraphTable
Equation
©Via Afrika Publishers » Mathematical Literacy Grade 10 28
Section 1
Linear relationships
Section 3
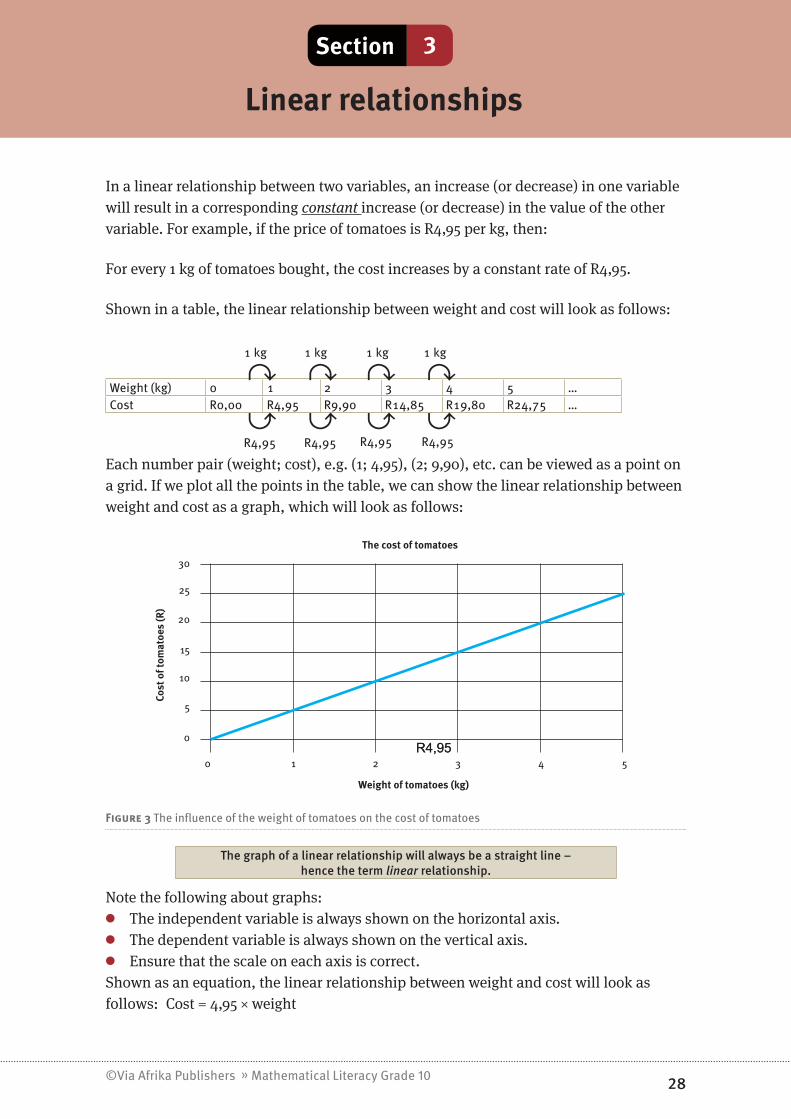
In a linear relationship between two variables, an increase (or decrease) in one variable will result in a corresponding constant increase (or decrease) in the value of the other variable. For example, if the price of tomatoes is R4,95 per kg, then:
For every 1 kg of tomatoes bought, the cost increases by a constant rate of R4,95.
Shown in a table, the linear relationship between weight and cost will look as follows:
Weight (kg) 0 1 2 3 4 5 …Cost R0,00 R4,95 R9,90 R14,85 R19,80 R24,75 …
Each number pair (weight; cost), e.g. (1; 4,95), (2; 9,90), etc. can be viewed as a point on a grid. If we plot all the points in the table, we can show the linear relationship between weight and cost as a graph, which will look as follows:
0
5
10
15
20
25
30
10
Weight of tomatoes (kg)
Cost
of t
omat
oes
(R)
The cost of tomatoes
2 3 4 5
Figure 3 The influence of the weight of tomatoes on the cost of tomatoes
The graph of a linear relationship will always be a straight line – hence the term linear relationship.
Note the following about graphs:●● The independent variable is always shown on the horizontal axis.●● The dependent variable is always shown on the vertical axis.●● Ensure that the scale on each axis is correct.
Shown as an equation, the linear relationship between weight and cost will look as follows: Cost = 4,95 × weight
R4,95R4,95
1 kg 1 kg 1 kg 1 kg
R4,95 R4,95 R4,95 R4,95

©Via Afrika Publishers » Mathematical Literacy Grade 10 29
Section 1Section 3
Using symbols: If x represents the weight and y represents the cost, then y = 4,95 × x
The equation of a linear relationship is always in the form y = mx + cIn our example above, the value of c is zero.
We work with two types of linear relationships:●● Direct proportion linear relationships●● Linear relationships with no direct proportion
Direct proportion linear relationshipsOur example above (cost of tomatoes) is an example of a direct proportion linear relationship. In this type of relationship:
●● The graph is a straight line, since this is a linear relationship.●● The graph passes through the origin, i.e. the point (0; 0). This means that if
one variable is 0, then the other variable is also 0. This is a property of a direct proportion situation. For example, if I buy no tomatoes (weight = 0 kg) then I pay nothing (cost = R0,00).
●● The equation is in the form y = m × x . (The value of y is 0).
Linear relationships with no direct proportionIn this type of relationship:
●● The graph is a straight line, since this is a linear relationship.●● The graph does not pass through the origin, but usually cuts the vertical axis at a
higher value.
The equation is in the form y = m × x + c. The value of c is ≠ 0. The value of c is where the line cuts the vertical axis.
Example:A plumber quotes as follows for work at a client’s home:A call-out fee of R100,00 plus R150,00 per hour for labour.Shown in a table, the linear relationship between time and cost will look as follows:
Time (h) 0 1 2 3 4 …Cost (R) R100,00 R250,00 R400,00 R550,00 R700,00 …
1h 1h 1h 1h
R150 R150 R150 R150

©Via Afrika Publishers » Mathematical Literacy Grade 10 30
Section 1Section 3
Note:●● The first pair of values in the table (time = 0 hours and cost = R100,00) tells us that,
even if the plumber have not done any work yet, he still charges a call-out fee of R100,00 to come to the client’s home.
●● Each of the other pairs of values include the R150,00 per hour for labour plus the R100,00 call-out fee.
If we plot all the points in the table, we can show the linear relationship between time and cost as a graph, which will look as follows:
Plumber’s cost
Time (hours
Cost
(R)
0
0
100
200
300
400
500
600
700
800
1 2 3 4
Figure 4 The impact of time on a plumber’s cost
Shown as an equation, the linear relationship between time and cost will look as follows: Cost = 150 × weight + 100
Using symbols: If x represents the time and y represents the cost, then y = 150 × x + 100.
Note:The graph cuts the vertical axis at 100, which is the value of c in the equation y = mx + c
©Via Afrika Publishers » Mathematical Literacy Grade 10 31
Section 1
Non-linear relationships
Section 4
In a non-linear relationship an increase/decrease in one of the variables will bring about a varying increase/decrease in the other variable.
Examples of non-linear relationships include:
●● the decrease (depreciation) in the value of a car over time;●● the change in the height of a soccer ball kicked into the air over time
We deal specifically with non-linear inverse proportion relationships.
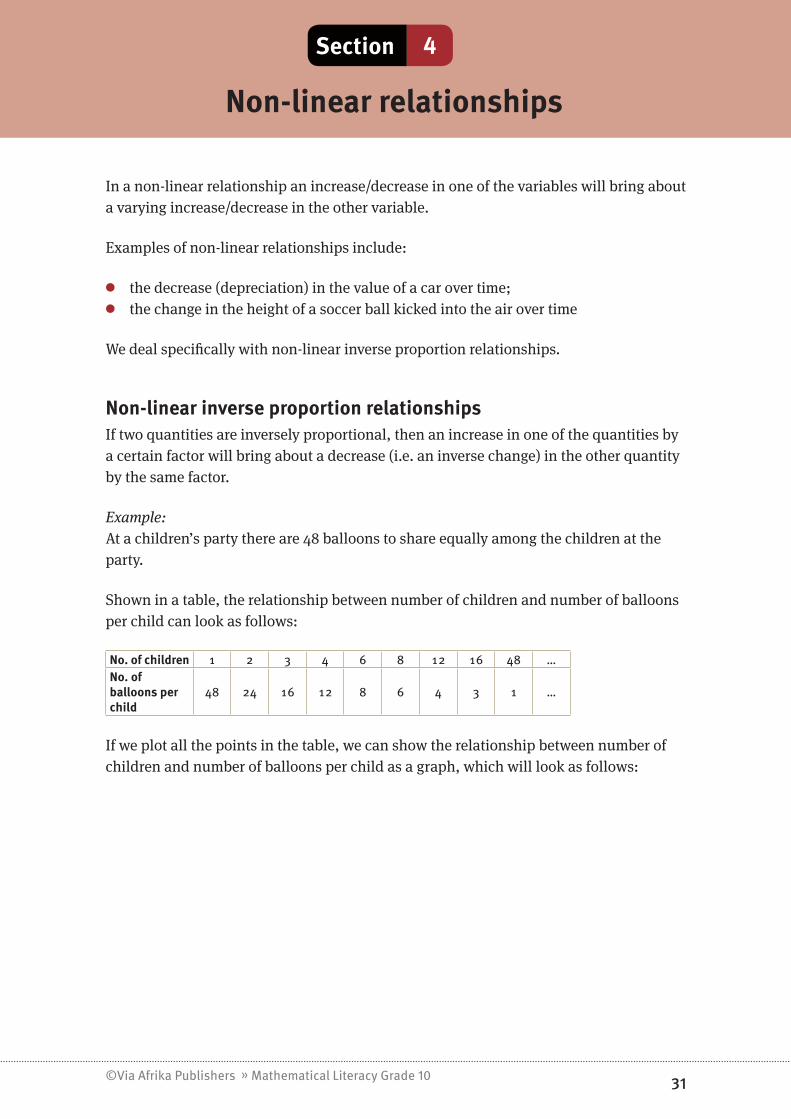
Non-linear inverse proportion relationshipsIf two quantities are inversely proportional, then an increase in one of the quantities by a certain factor will bring about a decrease (i.e. an inverse change) in the other quantity by the same factor.
Example:At a children’s party there are 48 balloons to share equally among the children at the party.
Shown in a table, the relationship between number of children and number of balloons per child can look as follows:
No. of children 1 2 3 4 6 8 12 16 48 …No. of balloons per child
48 24 16 12 8 6 4 3 1 …
If we plot all the points in the table, we can show the relationship between number of children and number of balloons per child as a graph, which will look as follows:

©Via Afrika Publishers » Mathematical Literacy Grade 10 32
Section 1
Non-linear relationships
Section 4
0
10
20
30
40
50
60
0 1 2 3 4 6 8 12 48
Figure 5 The relationship between number of children and number of balloons per child
Shown as an equation, the relationship between number of children and number of balloons per child will look as follows:
Number of balloons per child = 48 _______________ number of children
Using symbols: If x represents the number of children and y represents the number of balloons per child, then y = 48
___ x .

©Via Afrika Publishers » Mathematical Literacy Grade 10 33
Section 1
Constant (fixed) relationships
Section 5
A constant or fixed relationship is a relationship in which the value of one of the variables remains fixed (i.e. the same), irrespective of the value of the other variable.
Graphs of such relationships run straight (vertically) upwards or are flat (horizontal).
Example:A school wants to rent a bus to take learners to a sports day. The bus costs R450,00 for the day – irrespective of the number of children who travel on the bus.
We can construct the following table of value to represent this scenario:
Number of children travelling on the bus 0 1 2 … 10 … 100
Cost of the bus R450,00 R450,00 R450,00 R450,00 R450,00
If we plot the points in a table, we can show the relationship between the number of children and the cost of hiring the bus as a graph, which will look as follows:
0 10 20 30 40 50Number of children travelling on the bus
Cost of hiring a bus
Cost
of t
he b
us
60 70 80 90 100
R50R100R150R200R250R300R350R400R450R500
Figure 6 Cost of hiring a bus
Note:The graph is a horizontal line: this occurs because the value of the dependent variable (“Cost of the bus”) remains fixed no matter what the value of the independent variable (“Number of children travelling on the bus”).
Shown as an equation, the relationship between the number of children and the cost to hire the bus will look as follows: Bus hire cost = R450,00 or c = 450
When working with equations that represent the relationship between two variables, you need to have the following skills:
●● Substituting into equations●● Solving equations
©Via Afrika Publishers » Mathematical Literacy Grade 10 34
Section 1Section 6
More about equations
Substituting into equations
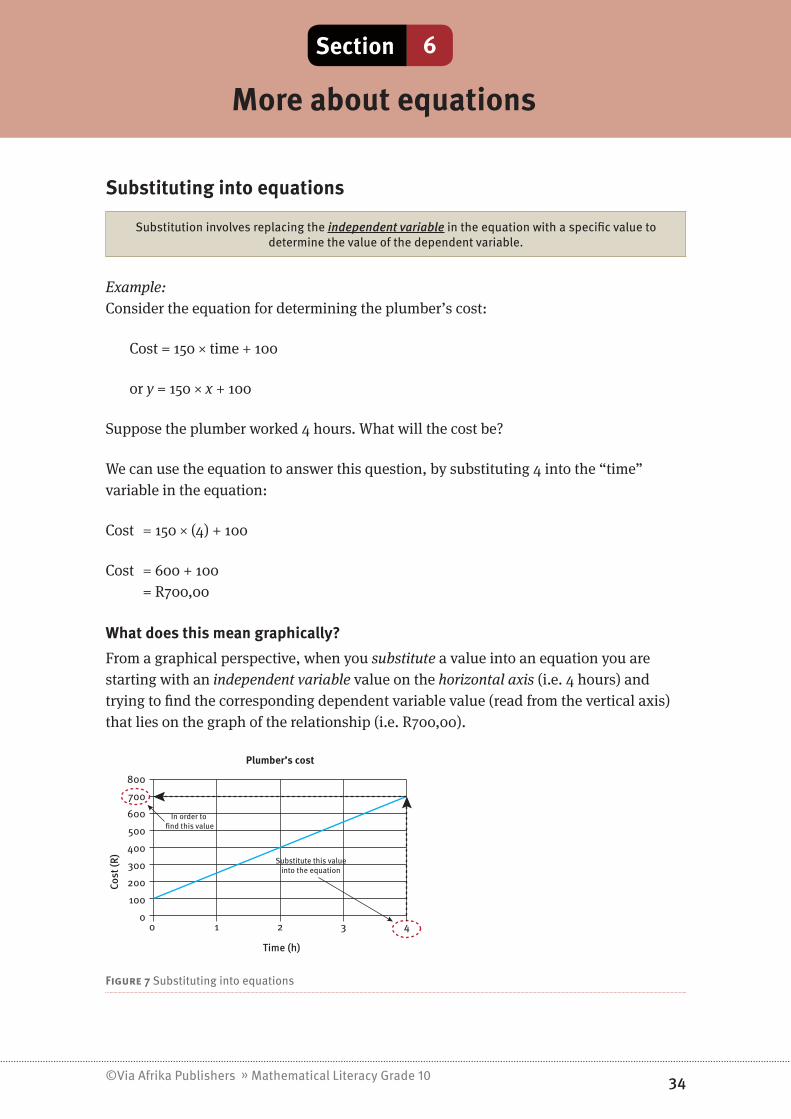
Substitution involves replacing the independent variable in the equation with a specific value to determine the value of the dependent variable.
Example:Consider the equation for determining the plumber’s cost:
Cost = 150 × time + 100
or y = 150 × x + 100
Suppose the plumber worked 4 hours. What will the cost be?
We can use the equation to answer this question, by substituting 4 into the “time” variable in the equation:
Cost = 150 × (4) + 100
Cost = 600 + 100 = R700,00
What does this mean graphically?From a graphical perspective, when you substitute a value into an equation you are starting with an independent variable value on the horizontal axis (i.e. 4 hours) and trying to find the corresponding dependent variable value (read from the vertical axis) that lies on the graph of the relationship (i.e. R700,00).
00
100
200
300
400
500
600
700
800
1
In order to �nd this value
Substitute this valueinto the equation
2 3 4
Plumber’s cost
Time (h)
Cost
(R)
Figure 7 Substituting into equations

©Via Afrika Publishers » Mathematical Literacy Grade 10 35
Section 1Section 6
Solving equations
To “solve” an equation means to replace the dependent variable with a value and then manipulate the remaining values and variable in the equation to find the value of the independent variable.
Example:Consider again the equation for determining the plumber’s cost: Cost = 150 × time + 100 or y = 150 × x + 100
Suppose the plumber sent an account for R400,00. For how long did he work?
We can use the equation to answer this question, by substituting R400,00 into the “cost” variable in the equation:
400 = 150 × time + 100
400 – 100 = 150 × time + 100 – 100 (Subtract 100 from both sides)
300 = 150 × time
300 ___ 150 = 150 × time
________ 150 (Divide both sides by 150) 2 = time
Therefore, the plumber worked 2 hours for the cost to be R400,00.
What does this mean graphically?Graphically, we are starting with the “Cost” (dependent variable) value of R400,00 on the vertical axis and are trying to find the corresponding “Time” (independent variable value) that lies on the graph of this relationship.
00
100
200
300
400
500
600
700
800
1
In order to �nd this value
Substitute this valueinto the equation
2 3 4
Plumber’s cost
Time (h)
Cost
(R)
Figure 8 Substituting into equations

©Via Afrika Publishers » Mathematical Literacy Grade 10 36
Section 1
Practice Exercises
Question 1: The bicycle journey 12 marksA boy decides to take a bicycle ride from his home to his friend’s house. The graph below shows his distance from his home.
0
5
10
15
20
25
30
0
0.50 1 1.5 2
Time (hrs)
The Bicycle Journey
Friend’shome
Dist
ance
(km
)
2.5 3 3.5 4
1.1 Approximately how far is his friend’s home from his own home? (1)
1.2 On the way he stops at the garage for refreshments.
1.2.1 How do we know from looking at the graph that he has stopped? (1)
1.2.2 If he leaves his home at 10:30 am, at what time did he arrive at the garage? (3)
1.3 After 1 hour of riding his bicycle, the graph changes.
1.3.1 In what way has the graph changed? (1)
1.3.2 What could be happening after 1 hour that caused the graph to change? (1)
1.4 Calculate his average speed for the entire journey using the following calculation (answer in km/h):
Average Speed = Total Distance ___________ Total Time (3)
1.5 His average speed for the first hour of the journey is 15 km/h. Explain why his average speed for the whole journey is slower than the average speed for the first hour. (2)
Question 2: Catering for a wedding 10 marks
The equation below is used to calculate the cost of catering for a wedding: Cost = R150 × No. of Guests + R2 500
2.1 Which is the independent variable in the equation? (Give a reason for your answer). (2)
2.2 Use the equation to fill in the following table:
No. of Guests 20 30 50 120 180Cost (Rands)
(2)2.3 Draw the graph of the values from the table in question 2.2. (6)
©Via Afrika Publishers » Mathematical Literacy Grade 10 37
Section 1
Practice Exercises
Question 3: Interpreting Graphs 9 marks
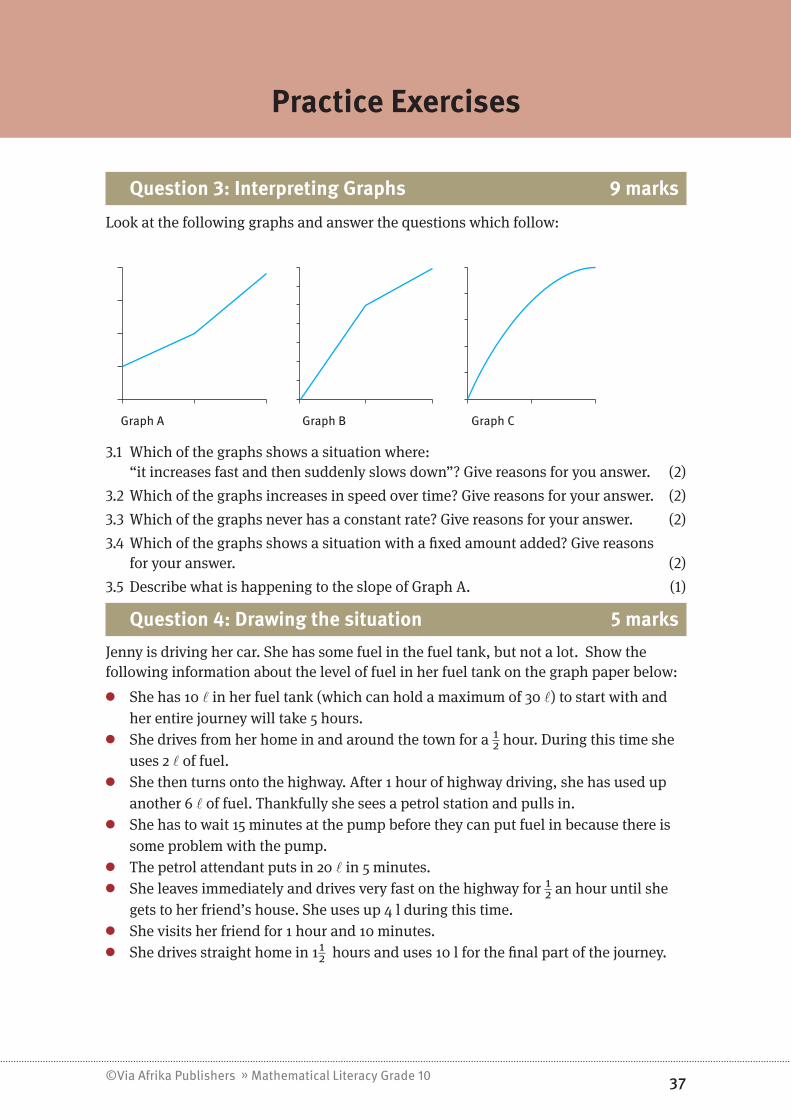
Look at the following graphs and answer the questions which follow:
Graph A Graph B Graph C
3.1 Which of the graphs shows a situation where: “it increases fast and then suddenly slows down”? Give reasons for you answer. (2)
3.2 Which of the graphs increases in speed over time? Give reasons for your answer. (2)
3.3 Which of the graphs never has a constant rate? Give reasons for your answer. (2)
3.4 Which of the graphs shows a situation with a fixed amount added? Give reasons for your answer. (2)
3.5 Describe what is happening to the slope of Graph A. (1)
Question 4: Drawing the situation 5 marksJenny is driving her car. She has some fuel in the fuel tank, but not a lot. Show the following information about the level of fuel in her fuel tank on the graph paper below:
●● She has 10 ℓ in her fuel tank (which can hold a maximum of 30 ℓ) to start with and her entire journey will take 5 hours.
●● She drives from her home in and around the town for a 1 _ 2 hour. During this time she uses 2 ℓ of fuel.
●● She then turns onto the highway. After 1 hour of highway driving, she has used up another 6 ℓ of fuel. Thankfully she sees a petrol station and pulls in.
●● She has to wait 15 minutes at the pump before they can put fuel in because there is some problem with the pump.
●● The petrol attendant puts in 20 ℓ in 5 minutes. ●● She leaves immediately and drives very fast on the highway for 1 _ 2 an hour until she
gets to her friend’s house. She uses up 4 l during this time.●● She visits her friend for 1 hour and 10 minutes.●● She drives straight home in 1 1 _ 2 hours and uses 10 l for the final part of the journey.

©Via Afrika Publishers » Mathematical Literacy Grade 10 38
Section 1
Practice Exercises
Time
Fuel
Tan
k (ℓ
)
(5)
Question 5: Reading values from the graph 6 marks
A large 150ℓ water tank has a constant leak at its base. A man fills the tank and then measures how much is left in the tank after 3 days and then on the 8th day.
He wants to estimate how much will be left after 15 days and which day will have only 70 litres remaining.
Plot the following information on a graph and then use the graph to fill in the blank spaces. You MUST show where you read off the values from your graph. (6)
Days 0 3 8 15Litres remaining 150 126 86 70
Question 6: Temperature 5 marks
The equation °C = °F ___ 1,8 – 17,8 allows us to convert a temperature from ˚F to ˚C.
6.1 Use the equation to convert 88˚F to ˚C. (2)
6.2 Use the equation to convert 12˚C to ˚F. (3)

©Via Afrika Publishers » Mathematical Literacy Grade 10 39
Section 1
Practice Exercises
Question 7: Straight-line depreciation 8 marksThe following equation is used to work out the value that a vehicle loses over a given number of years:
Value lost = Original Value × number of years × 0.12
7.1 Calculate the value lost over 4 years on a vehicle that had an original value of R350 000. (2)
7.2 Calculate the number of years it will take for a vehicle that originally cost R210 000 to lose R100 800 in value. (3)
7.3 Solly thinks that his R750 000 Range Rover is only going to be worth R270 000 in 3 years’ time. Is he correct? (Show all working.) (3)

©Via Afrika Publishers » Mathematical Literacy Grade 10 40
Section 1
Answers to questions
Thinking Levels
Question Working Marks Criteria TL1 TL2 TL3 TL4
1.1 Approximately 32 km 1 1 mark: answer 1
1.2.1The graph becomes a flat line (so his distance from home does not change, while time is increasing).
1 1 mark: reasonable explanation 1
1.2.2
He stops at the garage after 1,5 hours (1 hour & 30 mins) Therefore, he arrives at the garage at 10:30 + 1:30 = 12:00.
3
1 mark: reads off 1,5 hours from graph 1 mark: converts to 1 hour 30 mins 1 mark: final time
3
1.3.1 The graph becomes less steep. 1 1 mark: answer 1
1.3.2He slowed down because (any reasonable answer, e.g. he drove up a hill).
1 1 mark: answer 1
1.4
Total distance = 32 km (from Q 1.1) Total time = 3,5 hours Average speed = 32 ÷ 3,5 hours = 9,14 km/h
3
1 mark: reads off 3,5 hours from graph 1 mark: substitute into formula 1 mark: answer
3
1.5
Average speed is taken across his entire journey, including events like his stop at the garage which would bring down the average speed. This is unlike the first hour where the graph is rising with a constant slope (straight line).
2
1 mark: recognise changes in speed across the journey 1 mark: recognise that speed for first hour doesn’t seem to change.
2
Question 1: 12
Thinking Levels
Question Working Marks Criteria TL1 TL2 TL3 TL4
2.1No. of guests, because it is the variable that the cost (dependent variable) and answer depends on.
21 mark: no. of guests 1 mark: reasonable answer
2
2.2 R5 500; R7 000; R10 000; R20 500; R29 500 2 1 mark: at least 1 correct
1 mark: all correct 2
2.3
Cost for a number of guests
No. of guests
010 00020 00030 000
1000 200
Cost
(R)
6
1 mark: appropriate title for graph 1 mark: both axes correctly labelled 1 mark: scale on both axes sensible 1 mark: all points correctly plotted 1 mark: line joining all points 1 mark: dependent variable plotted on vertical axis
6
Question 2: 10

©Via Afrika Publishers » Mathematical Literacy Grade 10 41
Section 1
Thinking Levels
Question Working Marks Criteria TL1 TL2 TL3 TL4
3.1Graph B. The graph has a sudden change in slope and it decreases at that point.
2 1 mark: graph B 1 mark: valid reason 1 1
3.2 Graph C. The slope gets steeper. 2 1 mark: graph C 1 mark: valid reason 1 1
3.3 Graph A. Its slope is constantly changing. 2 1 mark: graph A
1 mark: valid reason 1 1
3.4 Graph C. It does not start at 0. 2 1 mark: graph C 1 mark: valid reason 1 1
3.5 The slope of the graph is getting steadily less steep. 1 1 mark: valid
description 1
Question 3: 9
Thinking Levels
Question Working Marks Criteria TL1 TL2 TL3 TL44 Jenny’s fuel usage over time
00
5
10
15
20
25
30
1 2 3 4 5Time
Fuel
Tan
k (ℓ
)
5 1 mark: sensible scale on both axes 1 mark: appropriate title 1 mark: start at 10 on vertical axis 1 mark: at least 3 points correct 1 mark: all correct
5
Question 4: 5
5
No. of litres vs no. of days
00
50
100
150
200
1 2No. of days
No.
of l
itres
rem
aini
ng
6
1 mark: axes are plotted correctly1 mark: graph and axes have title1 mark: all 3 given points are plotted correctly1 mark: line drawn1 mark: 30 Bags for 15 days correct (indicated as dotted line)1 mark: 10 days for 70 bags correct (indicated as thin line)
6
Question 5: 6
Answers to questions

©Via Afrika Publishers » Mathematical Literacy Grade 10 42
Section 1
Answers to questions
Thinking Levels
Question Working Marks Criteria TL1 TL2 TL3 TL4
6.1
C = F ÷ 1,8 – 17,8 = 88 ÷ 1,8 – 17,8 = 48,9 – 17,8 = 31,1 °C
2 1 mark: substitution 1 mark: answer 2
6.2
12 = F ÷ 1,8 – 17,8 12 + 17,8 = F ÷ 1,8 – 17,8 +17,8 29,8 × 1,8 = F ÷ 1,8 × 1,8 53,6°F = F
31 mark: substitution 1 mark: working 1 mark: answer
3
Question 6: 5
Thinking Levels
Question Working Marks Criteria TL1 TL2 TL3 TL4
7.1
Value lost = Orig. value × no. of years × 0,12 = R350 000 × 4 x 0,12 = R168 000
2 1 mark: substitution 1 mark: answer 2
7.2
Value lost = Orig. value × no. of years × 0,12 R100 800 = R210 000 × no. of years × 0,12 R100 800 ÷ R210 000 ÷ 0,12 = no. of years 4 years = no. of years
31 mark: substitution 1 mark: working 1 mark: answer
3
7.3
Value lost = Orig. value × no. of years × 0,12= R750 000 × 3 × 0,12 = R270 000 Value of Land Rover = R750 000 – R270 000 = R480 000 He confused the “value lost” with the final value.
31 mark: substitution 1 mark: answer 1 mark: interpretation
2 1
Question 7: 8
©Via Afrika Publishers » Mathematical Literacy Grade 10 43
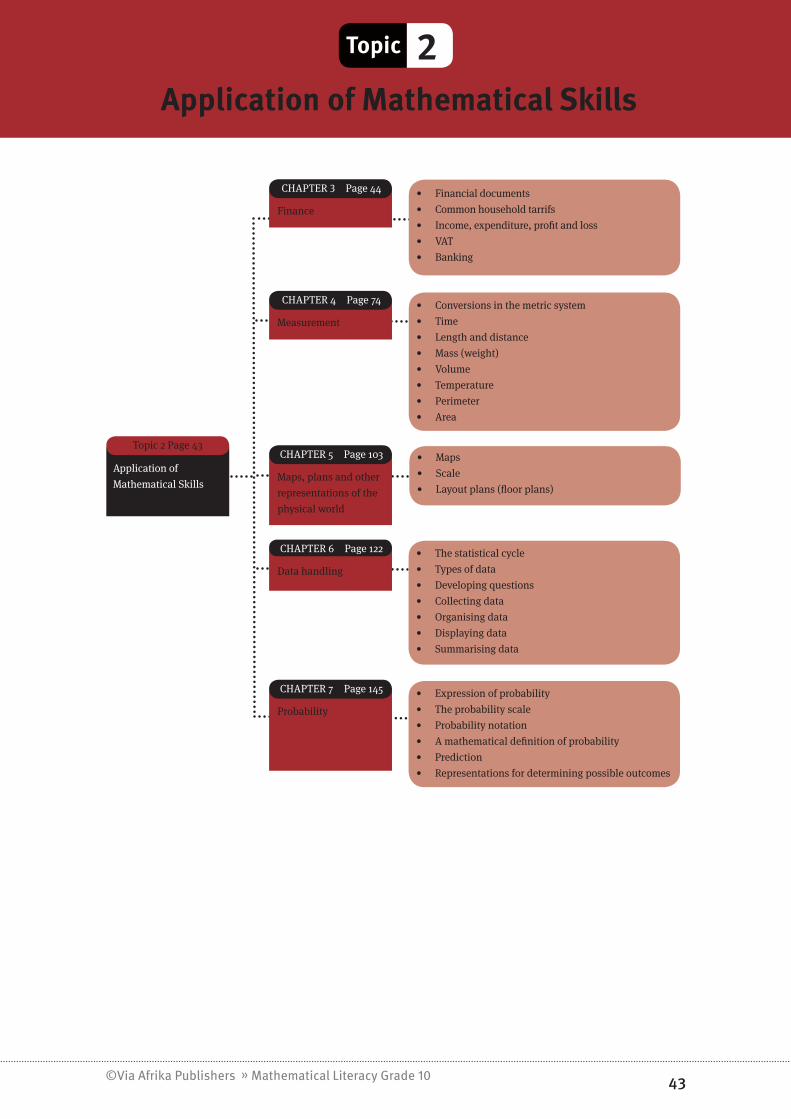
Section 1Topic 2Application of Mathematical Skills
Application of
Mathematical Skills
Topic 2 Page 43
Finance
• Financial documents
• Common household tarrifs
• Income, expenditure, profit and loss
• VAT
• Banking
• Conversions in the metric system
• Time
• Length and distance
• Mass (weight)
• Volume
• Temperature
• Perimeter
• Area
Measurement
CHAPTER 4 Page 74
• Maps
• Scale
• Layout plans (floor plans)Maps, plans and other
representations of the
physical world
CHAPTER 5 Page 103
• The statistical cycle
• Types of data
• Developing questions
• Collecting data
• Organising data
• Displaying data
• Summarising data
Data handling
CHAPTER 6 Page 122
• Expression of probability
• The probability scale
• Probability notation
• A mathematical definition of probability
• Prediction
• Representations for determining possible outcomes
Probability
CHAPTER 7 Page 145
CHAPTER 3 Page 44

©Via Afrika Publishers » Mathematical Literacy Grade 10 44
Section 1
Finance
Chapter 3
Overview
Finance
CHAPTER 3 Page 44
Financial documents
• Bills
• Statements
• Pre-paid cell phone tariffs
• Calculating the cost of a call on the pre-paid system
• Contract cell phone tariffs
• Calculating the cost of a call on this contract
• Calculating the monthly cost of making calls on
each contract
Common household
tariffs
• Income
• Expenditure
• Profit and loss
• Income-and-expenditure statements
• Budgets
Income, expenditure,
profit and loss
SECTION 3 Page 51
• Calculating VAT on a VAT exclusive price
• Calculating VAT on a VAT inclusive priceVAT
SECTION 4 Page 58
• Interest and interest rates
• Types of bank accounts
• Bank account transactions and fees
• Calculating bank fees
• Bank statements
Banking
SECTION 5 Page 60
SECTION 1 Page 45
SECTION 2 Page 46
©Via Afrika Publishers » Mathematical Literacy Grade 10 45
Section 1Section 1
Financial documents
You need to be able to work with the following household documents:
●● household bills (for example, electricity, water, telephone, cellphone)●● shopping documents (for example, till slips, account statements)●● banking documents (for example, bank statements and fee structures)●● household budgets.
Working with these financial documents, you must be able to:
●● Make sense of the terminology used in the documents, including:●● date or time period of the document●● opening and closing balance●● credit and debit●● payment due●● minimum payment●● tariff or charge●● income, expenditure, profit/loss●● VAT
●● Explain and demonstrate how the values appearing in the document have been determined.
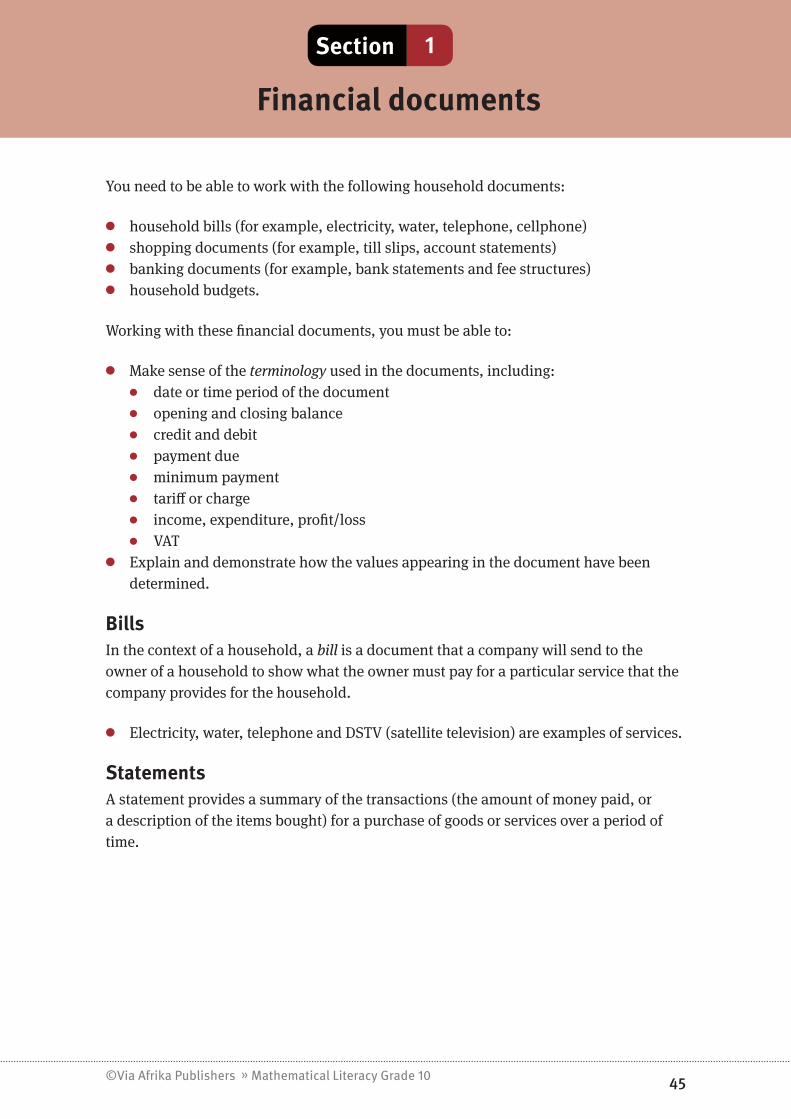
BillsIn the context of a household, a bill is a document that a company will send to the owner of a household to show what the owner must pay for a particular service that the company provides for the household.
●● Electricity, water, telephone and DSTV (satellite television) are examples of services.
StatementsA statement provides a summary of the transactions (the amount of money paid, or a description of the items bought) for a purchase of goods or services over a period of time.

©Via Afrika Publishers » Mathematical Literacy Grade 10 46
Section 1
Common household tariffs
Section 2
A tariff is a fee that is charged for using a particular service. We have telephone (cell phone and landline) tariffs, electricity tariffs, water tariffs, etc.
You need to be able to work with the following tariff structures:●● municipal tariffs (for example, electricity, water, sewage)●● telephone tariffs (for example, cell phone and fixed line)●● transport tariffs (for example, bus, taxi and train tariffs)●● bank fees.
Working with these tariffs, you must be able to:●● calculate costs using given tariffs and/or formulae●● draw and interpret graphs of various tariff systems.
There are two main tariff/charge structures available for cell phones and electricity: “pre-paid” and “contract”.
We explain pre-paid and contract tariffs for cell phones below; however, the same principles apply to electricity.
Pre-paid cell phone tariffsWith a pre-paid cell phone, you buy the phone and then buy “airtime” for the phone. The amount that you pay for the airtime is then converted into either minutes or seconds of talk time. On a pre-paid system, once you have paid for the phone and the starter pack, your only other cost is for the calls that you make.
Calls are charged at different rates, depending on whether they are during peak time (generally during business hours from Monday to Friday) or off-peak time (generally after business hours and on weekends). Calls also vary depending on whether you are calling “inside the network” (e.g. Vodacom to Vodacom) or to a “landline” (a traditional phone in a house – not a cell phone).
Here is a comparison of the five cell phone providers and their call rates (cost per minute) to landlines:
8ta Vodacom MTN Cell CVirgin
MoblilePrepaid 4U Prepaid Call Per
SecondEasychat
AlldayPrepay (Drop-
down)Calls to landlines (Peak) 65c R2.85 R2.89 R1.50 R0.99Calls to landlines (Off-peak) 65c R1.12 R1.19 R1.50 R0.99
Source: http://www.hellkom.co.za/8ta-vs-mtn-vs-vodacom-vs-cell-c-vs-virgin-mobile-call-charges/(sourced: 16 June 2011)
©Via Afrika Publishers » Mathematical Literacy Grade 10 47
Section 1Section 2
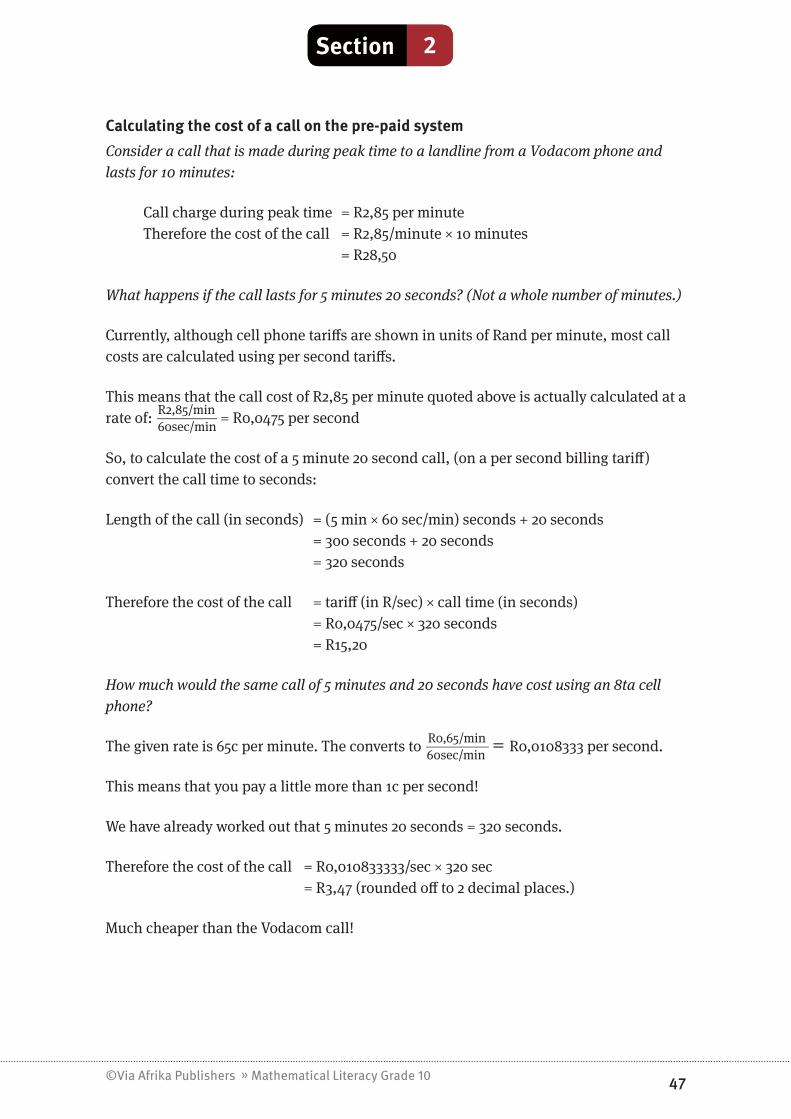
Calculating the cost of a call on the pre-paid systemConsider a call that is made during peak time to a landline from a Vodacom phone and lasts for 10 minutes:
Call charge during peak time = R2,85 per minuteTherefore the cost of the call = R2,85/minute × 10 minutes = R28,50
What happens if the call lasts for 5 minutes 20 seconds? (Not a whole number of minutes.)
Currently, although cell phone tariffs are shown in units of Rand per minute, most call costs are calculated using per second tariffs.
This means that the call cost of R2,85 per minute quoted above is actually calculated at a rate of: R2,85/min
________ 60sec/min
= R0,0475 per second
So, to calculate the cost of a 5 minute 20 second call, (on a per second billing tariff) convert the call time to seconds:
Length of the call (in seconds) = (5 min × 60 sec/min) seconds + 20 seconds = 300 seconds + 20 seconds = 320 seconds
Therefore the cost of the call = tariff (in R/sec) × call time (in seconds) = R0,0475/sec × 320 seconds = R15,20
How much would the same call of 5 minutes and 20 seconds have cost using an 8ta cell phone?
The given rate is 65c per minute. The converts to R0,65/min _________
60sec/min = R0,0108333 per second.
This means that you pay a little more than 1c per second!
We have already worked out that 5 minutes 20 seconds = 320 seconds.
Therefore the cost of the call = R0,010833333/sec × 320 sec = R3,47 (rounded off to 2 decimal places.)
Much cheaper than the Vodacom call!

©Via Afrika Publishers » Mathematical Literacy Grade 10 48
Section 1Section 2
Contract cell phone tariffs●● When you take out a cell phone contract, you effectively pay off the cost of the cell
phone over a period of 2 years (24 months) by paying a monthly “subscription fee” for the phone.
●● Over and above this subscription fee you still have to pay for the calls that you make on the phone.
●● On a contract system, you use the phone as much as you want during the month and then receive a bill stating how much you owe for that month, including both the subscription fee and the call costs.
Total monthly cost = fixed monthly subscription fee + monthly cost of calls − free airtime (or the cost value of free minutes)
●● On some contracts you also get “free airtime” that you can use for the month. Sometimes this airtime is given in minutes of talk time and sometimes is given in Rand value (e.g. R115 free talk time).
Examples of cell phone contract options are shown in the following advertisements:
Option
1Option
2
(Source: http://www.cellc.co.za/deals/all-deals. Sourced 16 June 2011)
In Option 1, you pay R129 and are given “100 off-peak minutes” using the CasualChat 100 package.
In Option 2, you pay R100 and are given “R115 airtime per month” using the ControlChat 100 package.

©Via Afrika Publishers » Mathematical Literacy Grade 10 49
Section 1Section 2
Calculating the cost of a call on this contract Although the advertisement did not contain call charges, the following table shows the charges/tariffs for these contracts to landlines:
CasualChat 100 ControlChat 100Peak time Off-Peak time Peak time Off-peak timeR2,30/min R0,75/min R1,50/min R 1,50/min
(Source: www.cellc.co.zaSourced 16 June 2011)
Notice that the rates for “peak” and “off-peak” times (as in the pre-paid option), are different for both contracts.
Consider a call during peak time that lasts for 7 minutes 39 seconds to a land line using the “ControlChat 100” contract:
Per second tariff = R1,50/min _________
60 sec/min = R0,025 per second
Length of the call in seconds = (7 min × 60 sec/min) + 39 seconds = 420 seconds + 39 seconds = 459 seconds
Cost of the call = R0,025/sec × 459 seconds = R11,48 (rounded off to the nearest cent)
Calculating the monthly cost of making calls on each contract The table below shows the various costs and features of the above contracts:
CasualChat 100 ControlChat 100Monthly Subscription R129 R100Free minutes/Airtime 100 off-peak mins R115Peak time R2,30/min R1,50/minOff-Peak time R0,75/min R1,50/min
(Source: www.cellc.co.za. Sourced 16 June 2011)
We want to compare the contracts to find the most economical one for a particular person’s needs.

©Via Afrika Publishers » Mathematical Literacy Grade 10 50
Section 1Section 2
Consider a person who makes a total of 230 minutes worth of calls to landlines on these contracts during the month (where 130 minutes are off-peak and 100 minutes are peak):
CasualChat 100 ControlChat 100Subscriptions R129,00 R100,00Peak minutes R2,30 ×100 = R230,00 R1,50 ×100 = R150,00
Off-peak minutesOnly charged for 130 – 100 mins = 30 minsR0,75/min × 30 mins = R22,50
R1,50 × 130 = R195,00
Total R129,00 + R230,00 + R22,50= R381,50
R100,00 + R150,00 + R195,00 – R115,00 (Free Airtime)= R445,00 – R115,00 = R330,00
Therefore, the ControlChat 100 option looks like the cheapest option for this person.However, they could still decide on the other contract because they prefer that phone!
It is useful to compare contracts to find the best option for you, but it is important to be aware of your normal cell phone usage before evaluating contracts like this, e.g. do you make more calls during peak or off-peak times?

©Via Afrika Publishers » Mathematical Literacy Grade 10 51
Section 1
Income, expenditure, profit and loss
Section 3
You need to be able to identify and perform calculations involving income, expenditure, profit and loss values, including:
●● Fixed, variable and occasional income values and fixed, variable, occasional, high-priority and low-priority expenditure values in the context of personal income, including:
●● salaries, wages and commission●● gifts and pocket money●● bursaries and loans●● savings●● interest●● inheritance.
●● Fixed, variable and occasional income values and fixed, variable, occasional, high-priority and low-priority expenditure values in the context of personal expenditure, including:
●● living expenses (for example, food, clothing, entertainment)●● accounts (for example, electricity and water)●● fees (for example, school fees and bank fees)●● insurance (for example, car, household and medical aid)●● personal taxes●● loan repayments (for example, store accounts)●● savings.
Working with these personal income and expenditure matters, you need to be able to manage finances by analysing and preparing income-and-expenditure statements and budgets, with an awareness of the difference between these two documents, for:
●● an individual and/or household●● a trip (for example, holiday)●● personal projects (for example, dinner party; significant purchases such as a
cellphone, television or furniture).
IncomeIn the context of the finances of an individual or a household, incomerefers to money that the individual receives or money coming into the household.
Examples:●● money earned in the form of a salary or a wage●● interest earned from money invested in bank accounts and other investments●● donations, gifts, inheritance, pocket money, money sourced from bursaries/loans.

©Via Afrika Publishers » Mathematical Literacy Grade 10 52
Section 1Section 3
Types of income In organising and planning personal or household finances, it is important to distinguish between fixed income, variable income and occasional income.
Fixed Income: Remains fixed or never changes.Example: A salary that is earned on a monthly basis because the salary will rarely change from one month to the next.
Variable Income: Changes or varies over a period of time.Example: People who earn commission based on the number of items that they sell during a month will have a variable income, since the amount of money that they earn will change form one month to the next.
Occasional Income: This is income earned occasionally or from time to time.Example: Overtime pay is occasional income, since the overtime pay is only earned when and if a person is required to work extra time.
ExpenditureIn the context of the finances of an individual or a household, expenditure refers to money that is spent by the individual and/or household in meeting the costs involved in daily living and/or running the household.
Examples:●● living expenses, for example rental, food, clothing, transport fees;●● accounts, for example telephone, electricity, water, television;●● payments towards loans or investments (e.g. car loans, funeral plan).
Types of expenditureHigh Priority (“needs”) are things that a person needs to spend money on because they are essential to running a household or to functioning in daily life.
Example: School fees are a high priority expenditure item as schooling is very important.
Low Priority (“wants”) are things that a person might want or like to have but are not essential to running a household or to functioning in daily life.
Example: For most people a television set should not be a high priority expenditure item.
Just as we did under income, we can further divide expenditure into fixed, variable and occasional expenditure.
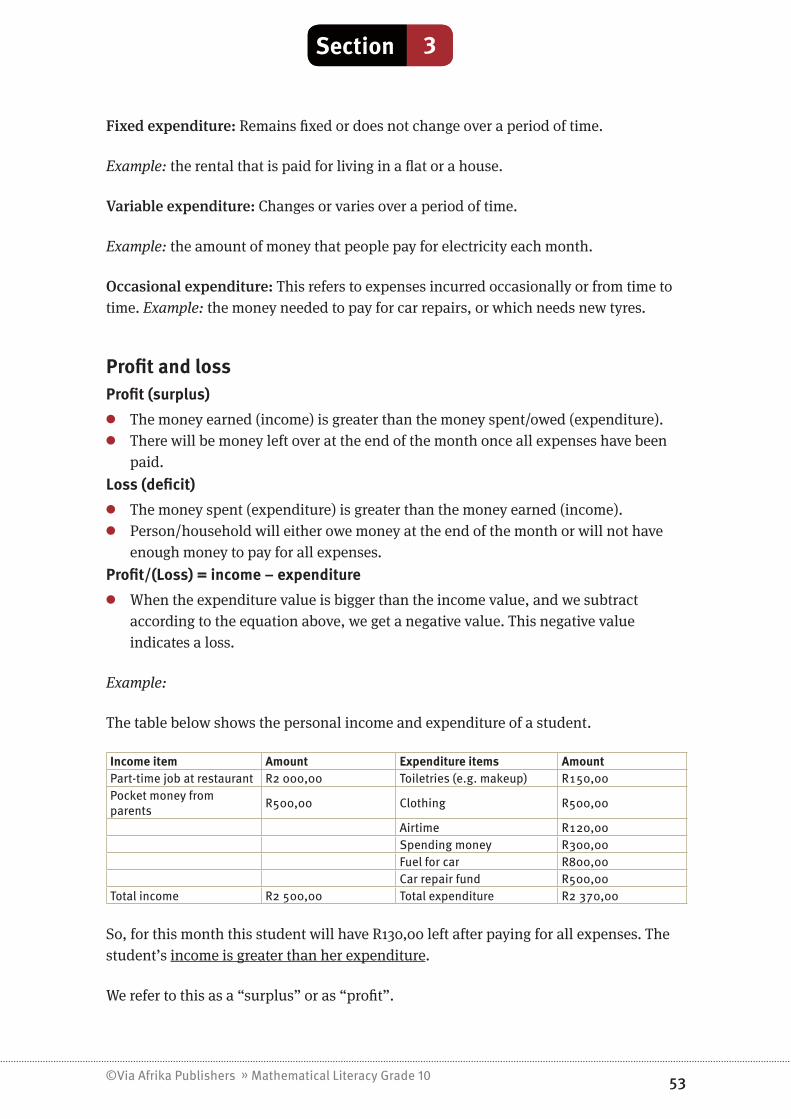
©Via Afrika Publishers » Mathematical Literacy Grade 10 53
Section 1Section 3
Fixed expenditure:Remains fixed or does not change over a period of time.
Example: the rental that is paid for living in a flat or a house.
Variable expenditure: Changes or varies over a period of time.
Example: the amount of money that people pay for electricity each month.
Occasional expenditure: This refers to expenses incurred occasionally or from time to time. Example: the money needed to pay for car repairs, or which needs new tyres.
Profit and lossProfit (surplus)
●● The money earned (income) is greater than the money spent/owed (expenditure).●● There will be money left over at the end of the month once all expenses have been
paid.Loss (deficit)
●● The money spent (expenditure) is greater than the money earned (income).●● Person/household will either owe money at the end of the month or will not have
enough money to pay for all expenses.Profit/(Loss) = income – expenditure
●● When the expenditure value is bigger than the income value, and we subtract according to the equation above, we get a negative value. This negative value indicates a loss.
Example:
The table below shows the personal income and expenditure of a student.
Income item Amount Expenditure items AmountPart-time job at restaurant R2 000,00 Toiletries (e.g. makeup) R150,00Pocket money from parents R500,00 Clothing R500,00
Airtime R120,00Spending money R300,00Fuel for car R800,00Car repair fund R500,00
Total income R2 500,00 Total expenditure R2 370,00
So, for this month this student will have R130,00 left after paying for all expenses. The student’s income is greater than her expenditure.
We refer to this as a “surplus” or as “profit”.

©Via Afrika Publishers » Mathematical Literacy Grade 10 54
Section 1Section 3
However, the fuel price might go up and she might have to pay R1 200 for fuel. Then she would not have enough money to pay for all of the items that she hoped to spend money on. She would be short of R270,00 (R2 500,00 – R2 770,00 = -R270,00).
In this situation, the student’s expenditure would be greater than her income. We refer to this as a “deficit” or as “loss”.
Income-and-expenditure statements An income-and-expenditure statement is a document that provides a summary and description of the money that a person or household earns over a period of time, and how or on what they spend that money.
Example: Below is an income-and-expenditure statement for a household for a particular month.
Income Items Amount (R) Expenditure items Amount (R)Fixed income Fixed expensesMarius’ salary 4 810,00 Rent 2 300,00Rentia’s salary 6 875,00 Car repayments 1 400,00Total fixed income 11 685,00 School fees 250,00
Medical aid 1 280,00Funeral plan 210,00Car insurance 380,00Savings deposit 150,00Newspaper subscription 120,00
Total fixed expenses 6 090,00Variable expensesFood (groceries) 2 500,00Electricity 320,00Water 180,00Household maintenance (lightbulbs, etc.) 80,00Petrol 430,00Marius’ cellphone 450,00Rentia’s cellphone 220,00Toiletries 500,00Clothing 300,00Entertainment 300,00Bank charges 60,00
Total variable expenses 5340,00Other expensesPossible car repairs 200,00
Total Income 11 685,00 Total Expenditure 11 630,00Profit/Loss

©Via Afrika Publishers » Mathematical Literacy Grade 10 55
Section 1Section 3
Note the following about the Income Statement:
●● Expenditure has been separated into “Fixed” and “Variable” items. It is important that the household do this so that they know which expenses may change from one month to the next and can plan for these changes.
●● Marius and Rentia are saving R200,00 every month towards future repairs and maintenance of their car. This shows that they are not living from day to day but planning for the possibility of future (occasional) expenses.
●● The values on the income-and-expenditure statement provide an approximation of the actual income and expenditure amounts because both income and expenditure will often change.
●● Most of the values on the statement have been deliberately rounded off to make the statement easier to work with.
Budgets A budget provides a description of planned, projected or expected income and expenditure values for an individual, household, business, organisation or project.
In planning for these future/estimated income and expenditure values, we have to look at trends in past and current income and expenditure. An income and expenditure statement as in the previous example would help a household to set up a budget for the future, as it clearly shows how money is currently spent or was spent in the past.
●● A budget only provides an estimated idea of future expenses and/or income. Often the actual income or expenditure turns out to be different from the budgeted values.
●● There is a difference between an income-and-expenditure statement and a budget. An income-and-expenditure statement is a summary of the actualor known income and expenditure values for an individual, household, business or organisation.
●● Budgets provide a means for planning by projecting and estimating what things might cost in the future and how much money we will need to cover those costs.
Example: A household recorded their expenditure for various items for three months:
3 MONTHS OF SPENDING
Description April May JuneFood R3 2 81,25 R2 956,12 R3 030,56Petrol R1 345,80 R1 728,40 R1 489,56Toiletries R405,00 R354,80 R386,23House cleaning R153,43 R174,89 R210,40Other R673,00 R810,67 R794,63Electricity R340,00 R365,00 R450,00Insurances R1 310,00 R1 310,00 R1 310,00Total spent R7 508,48 R7 699,88 R7 671,38

©Via Afrika Publishers » Mathematical Literacy Grade 10 56
Section 1Section 3
They will then use this to draw up a monthly budget. Here they will have to estimate amounts that are round numbers which are fairly close to the average amount spent per month:
Description AmountFood R3 000,00Petrol R1 700,00Toiletries R 400,00House cleaning R 200,00Other R 800,00Electricity R 400,00Insurances R1 310,00TOTAL R7 810,00
Notice that the insurances are a fixed amount per month as they do not change, while the other amounts are variable amounts. So the insurances can be exactly planned for, but the other expenses will need to be estimated. Also notice that the people have to earn at least R7 810,00 to afford their lifestyle. If they earn less, then they will either have to reduce their spending on some of the items (e.g. food) or they will have to find a way of earning more income.
Apart from planning household expenditure, a budget can also be used to plan for personal finances from one year to the next.
For example, the table below shows a list of current income and expenditure, and estimates of possible future income and expenditure, based on proposed increases for a particular individual.
Item Approximate Current
Estimated % increase Estimated new
Income Salary R7 910,00 7% R8 463,70
Expenditure
Food R3 000,00
10%
R3 300,00Petrol R1 700,00 R1 870,00House cleaning R200,00 R220,00Other R800,00 R880,00Insurances R1 310,00 R1 441,00Toiletries R400,00 R440,00Electricity R400,00 R440,00
Money left over R100,00 –R127,30
Let us answer some questions with regard to this table:
●● How have the “Estimated new” values been determined?Current salary = R7 910,00Expected increase in salary = 7%Estimated new salary = current salary + 7% increase
= R7 910,00 + (7% × R7 910,00) = R7 910,00 + R553,70 = R8 463,70

©Via Afrika Publishers » Mathematical Literacy Grade 10 57
Section 1Section 3
The same method has been used to calculate the rest of the “Estimated new” values in the table, using an increase of 10% in expenditure items.
●● Why has this person estimated a 10% increase in all of their expenses?Many people will often choose to increase the prices of the things that they sell or the services that they offer by 10%, because it is an easy figure to work with. As such, 10% gives a good estimation of what a potential increase might be from one year to the next. As all items will not increase by 10%, it remains only an estimation.
●● Where did the “Money left over” values come from?Consider the “Money left over” value of R100,00:
Income = R7 910,00Total current expenses = Sum of all expenses shown in the table = R7 810,00Money left over = R7 910,00 − R7 810,00 = R100,00
●● How can this person use the budget to plan finances?From the values in the table, it is obvious how important it is that the person’s salary does increase. If his/her salary does not increase and everything else increases, then there is the possibility that he/she will no longer be able to afford all of the expenses.
The person should also be able to see that if the expenses increase by the estimated 10%, there will be less money available at the end of the month than they currently have. As such, they may need to cut back on some of their expenses if their goal is to maintain the amount of money available at the end of every month.
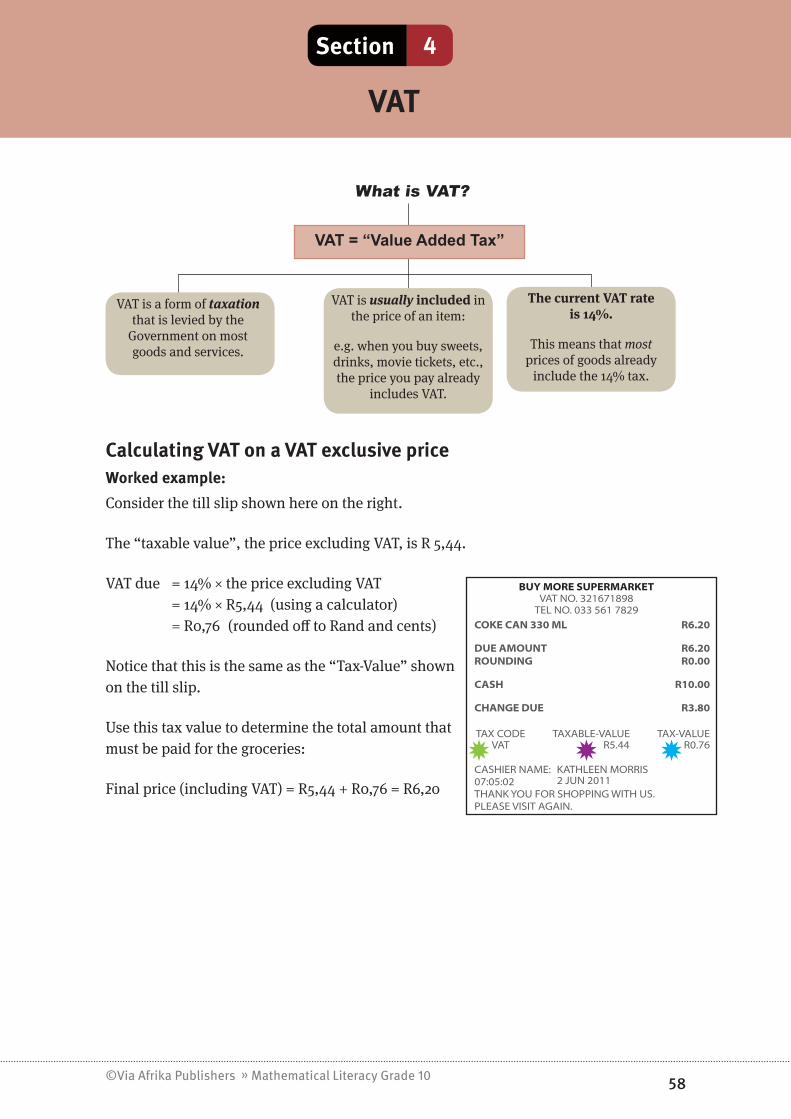
©Via Afrika Publishers » Mathematical Literacy Grade 10 58
Section 1
VAT
Section 4
What is VAT?
VAT = “Value Added Tax”
VAT is a form of taxation that is levied by the
Government on most goods and services.
ThecurrentVATrateis14%.
This means that most prices of goods already
include the 14% tax.
VAT is usuallyincluded in the price of an item:
e.g. when you buy sweets, drinks, movie tickets, etc., the price you pay already
includes VAT.
Calculating VAT on a VAT exclusive priceWorked example:Consider the till slip shown here on the right.
The “taxable value”, the price excluding VAT, is R 5,44.
VAT due = 14% × the price excluding VAT = 14% × R5,44 (using a calculator) = R0,76 (rounded off to Rand and cents)
Notice that this is the same as the “Tax-Value” shown on the till slip.
Use this tax value to determine the total amount that must be paid for the groceries:
Final price (including VAT) = R5,44 + R0,76 = R6,20
BUY MORE SUPERMARKETVAT NO. 321671898
TEL NO. 033 561 7829COKE CAN 330 ML R6.20
DUE AMOUNT R6.20ROUNDING R0.00
CASH R10.00
CHANGE DUE R3.80
TAX CODEVAT
TAXABLE-VALUER5.44
TAX-VALUER0.76
CASHIER NAME: KATHLEEN MORRIS07:05:02 2 JUN 2011THANK YOU FOR SHOPPING WITH US.PLEASE VISIT AGAIN.

©Via Afrika Publishers » Mathematical Literacy Grade 10 59
Section 1Section 4
Calculating the VAT on a VAT inclusive pricePrices in South Africa usually include VAT at 14%. Sometimes we need to know the price without VAT.
The price that includes VAT means that it represents 114% of the original price (100% + 14%). Therefore, to find the price without VAT, we need to divide by 114%.
Look at the advertisement on the right. Calculate the cost of the TV set without VAT.
Price without VAT = R2 699 ÷ 114% = R2 699 ÷ 1,14 = R2 367,54 (to the nearest cent)
Source: Game Promotional Brochure: 20 June 2011

©Via Afrika Publishers » Mathematical Literacy Grade 10 60
Section 1
Banking
Section 5
Most people need to have a bank account to receive and store their salary in a safe place every month and to pay for different expenses during the month, like their electricity bill.
Interest and interest rates Understanding the difference between the concepts of interest and interest rate is an essential starting point for making sense of situations involving banking.
Interest Interest rateInterest is money and may be a form of income or an expense. This money is commonly the reward that a bank or company will pay their clients for depositing or investing with them, or the fee that a person pays for borrowing money from a bank or company.
The interest rate is a rate which is expressed as a percentage.It is used to determine the amount of interest (i.e. money) that needs to be paid or earned.It is usually calculated as a percentage of the total.
To illustrate the difference more clearly, consider the following scenario:
Melo takes a R10 000,00 personal loan from a bank. The bank is charging him interest at a rate of 0,85% per month on the loan.
Interest Interest Rate
??? 0,85% is the interest rate and is used to determine how much interest Melo will owe to the bank every month for the loan.
We can calculate the interest that Melo will owe after the first month as follows:
Interest rate = 0,85% per month
So, interest owed at the end of the 1st month = 0,85% × R10 000,00 = R85,00
This monetary value of R85,00 is the interest that Melo now owes at the end of the first month in addition to the original R10 000,00 that he borrowed.
Types of bank accountsA bank account is an account that you open at a bank and use to store money. Money can be placed into or drawn from the account when needed, and direct payments can be made from one account to other accounts.

©Via Afrika Publishers » Mathematical Literacy Grade 10 61
Section 1Section 5
There are several different types of bank accounts available. Some of these include:
Type of account Description Example(s)
Transactional
Most common type of account and are used by people who need to make regular transactions (e.g. withdrawals, deposits, payments) from their accounts.
Cheque (also known as current) accountCredit card accountDebit card account
Investment These accounts used for saving/growing money.
Savings accountFixed deposit account
Credit
These accounts come with a “credit facility”, which is almost like a small loan from the bank, which makes it possible to buy things during the month and only pay for them at the end of the month.
Credit card account
Bank account transactions and feesBanks almost always charge fees for any transaction that takes place on an account.
Some of the most common account transactions on which fees are charged include:
Account transactions
Withdrawal
Debit order
Deposit
Stop order
This is an instruction to the bank to deduct a varying amount of money from the account every month. (e.g. to pay for a monthly cell phone bill that varies from one month to the next).
This is an instruction to the bank to deduct a fixed amount of money from the account every month (e.g. to pay a fixed amount of R150,00 to a school for school fees).
Taking money out of an account (e.g. drawing R250,00 from an ATM).
Putting money into an account (e.g. depositing a salary into a bank account)

©Via Afrika Publishers » Mathematical Literacy Grade 10 62
Section 1Section 5
Calculating bank feesWe are now going to explore some of the different fees that are charged on different types of bank accounts and the methods used for calculating those fees.
Worked example:Here is some information for Sum1 account from Standard Bank:
(source: http://www.standardbank.co.za/pdfs/pricing2010/Sum1_Student_Achiever.pdf as at: 20 June 2010)
What do I get FREE per month?– Yourfirstfourelectronicdebittransactions
– YourfirstfourATMcashdeposits
– Onein-branchcashdeposituptothevalueofR100
– MyUpdatesLite(12SMSnotifications)
– Unlimitedelectronicbalanceenquiries
– Unlimitedinter-accounttransferstoanyStandardBankSavingsandInvestmentaccount
– PrepaidairtimerechargesatanyStandardBankself-servicechannel
– Internetandcellphonebankingsubscriptions
– Chequedeposits
Overandabovethis,youwillbechargedasfollows:

©Via Afrika Publishers » Mathematical Literacy Grade 10 63
Section 1Section 5
Consider the following questions relating to the table of bank charges:
1. What is the fee for a “Debit card purchase”?
2. 2.1 How many cash deposits can be made at an ATM without a fee being charged?2.2 How many cash deposits can be made at a branch without a fee being charged?2.3 What is the method that will be used to determine the fee payable on a deposit of
more than R100,00 into the account (if no free transactions apply)?2.4 How much would be charged in fees for depositing R5 000,00 into this type of
account?
3. How much would be charged in fees if R2 500 cash is withdrawn from the account at a branch using the debit card?
Answers:1. R2,30 per transaction (or R5,20 if cash has been drawn at the same time).
2. 2.1 4 cash deposits at an ATM (this is in the details about what is free per month).2.2 One (but only if it is R100,00 or less).2.3 The fee is made up of two parts:
1. A “Base fee” of R3,75 → this is a fee that must be paid irrespective of how much money is being deposited into the account;
2. A “Fee based on transaction value” of 1,10% → this means that the fee will be 1,10% of the amount that is being deposited.
2.4 We can combine these two parts of this fee calculation into the following formula:Fee = R3,75 + 1,10% of the deposit amount = R3,75 + (1,10% × deposit amount) = R3,75 + (1,10% × R5 000,00) = R3,75 + R55,00 = R58,75
(So, if a deposit of R5 000,00 is made into this account, the actual amount that will end up in the account is R5 000,00 − R58,75 = R4 941,25!)
3. Bank charge = R22,00 + 1,10% × R2 500 = R22,00 + R27,50 = R49,50

©Via Afrika Publishers » Mathematical Literacy Grade 10 64
Section 1Section 5
Bank statementsIf you have an account with a bank, then every month you will receive a bankstatement. This is a summary of the transactions on the account during the month.
2 34 5
1 1 The “Date” column shows the dates on which transactions were made.
2 The “Description” column shows who money was paid to or where it came from.
3 The “Fees” column shows any bank fees charged for transactions on the account. This may also be shown as a negative amount to indicate that it was deducted.
4 The “Debits” column shows money withdrawn from the account in cash or payments. The “Credits” column shows money deposited into the account.
5 The “Balance” column shows the amount in the account at the end of every day.
Now that you have read through the bank statement, here are some questions for you to consider relating to the statement. See if you can correctly identify the following:
1. 1.1 What is the name of the person whose account this is?1.2 With which bank does this person have the account?1.3 What type of bank account does this person have?1.4 For which month is this bank statement?
2. 2.1 What transaction occurred on the bank account on 17/06/2011?2.2 How much money was withdrawn from the account on 08/06/2011?2.3 What was the balance in the account at the end of the day on 04/06/2011?2.4 What is the name of the shop from which this person bought their groceries on
05/06/2011?2.5 What fee does this person pay every time they draw money from an ATM
machine?

©Via Afrika Publishers » Mathematical Literacy Grade 10 65
Section 1
Practice Exercises
Question 1: The electricity bill 17 marks1. Mr Jonas receives his electricity bill. Unfortunately, some glue seems to have
dribbled onto the page and as he opens the bill, it rips some of the figures away. Use it to answer the following questions:
1.1 What date was this electricity bill issued? (1)
1.2 What date is the final date for payment of this bill? (1)
1.3 What is the total owed by Mr Jonas on this bill? (1)
1.4 Mr Jonas had to pay a deposit to get his electricity connected for the first time. What was the amount of the deposit? (1)

©Via Afrika Publishers » Mathematical Literacy Grade 10 66
Section 1
Practice Exercises
1.5 Each month Mr Jonas is charged an “accounting fee”. This is a fixed charge that does not change from month to month.
1.5.1 What is the amount of the accounting fee before VAT is added? (1)
1.5.2 What is the amount of the accounting fee after VAT is added? (1)
1.6 Calculate the amount for his Basic Electricity charge before the VAT is added (marked 1A on the bill). (2)
1.7 Electricity is measured in units of kilowatt-hours (kWh). For how many units of electricity is Mr Jonas being billed? (1)
1.8 Electricity is charged at R0,346230 per unit of electricity. Use your answer to question 1.7 to calculate the amount that he was charged for his electricity consumption before VAT was added. (marked by 1B on the bill). (2)
1.9 Calculate the percentage that his electricity consumption (including VAT) represents of his total bill. (3)
1.10 For the next month, his fixed costs (Accounting Fee and Basic Electricity Charge) made up 40% of his bill. What did he pay for his electricity consumption in the next month? The fixed costs always total R329,25. (3)
Question 2: Cell phone 19 marks
A man is trying to decide between two cellphone packages to use for making his work calls. He only works from Monday to Friday and has his own private phone for use after hours and during weekends.
Prepaid Option
6c per second (during work hours)
Contract Option
R381,90 per month, which includes 200 minutes (charged per minute or part thereof). Thereafter, calls are charged at R1,37 per minute (during work hours).
Here is a list of the calls that he made in a day:
2.1 For how many seconds did he talk in total during the day? (2)
2.2 Using the prepaid option, he would pay per second. Using your answer to question 2.1, calculate how much he would have to pay for the calls that he made. (Express your answer in Rands.) (3)
2.3 How many minutes does he get as part of the Contract option? (1)
2.4 The Contract option bills him “per minute or part thereof”. This means that a call lasting 2 min 12 seconds is charged as a 3 minute call.
How many minutes would he use up on his contract to make the above calls? (3)
Length of call3 min 15 secs4 min 30 secs0 min 45 secs 0 min 24 secs12 min 10 secs0 min 40 secs

©Via Afrika Publishers » Mathematical Literacy Grade 10 67
Section 1
Practice Exercises
2.5 He calculates that he will use up all of his “free” minutes on the Contract option in 8 working days. This means that he has to pay for the extra 14 working days per month.
2.5.1 Why does he say that he only has 22 working days in a month (14 + 8 days = 22 days)? (1)
2.5.2 He calculates that he will have to pay for an extra 350 minutes of calls per month. How much extra will he have to pay for calls? (2)
2.5.3 Using your answer from question 2.5.2, calculate the total that he would pay per month for the Contract option. (2)
2.6 Using your answer to question 2.2, how much would he pay per month for his calls if he used the Prepaid option for his work calls? (3)
2.7 Using your previous answers, which option would you advise him to choose? Give a reason for your answer. (2)
Question 3: Bank account charges 22 marks
The following bank charge pricing guide applies to Standard Bank’s current accounts (as at June 2011). Use it to answer the questions which follow:
Source: http://www.standardbank.co.za/pdfs/pricing2011/Personal_Current_Account.pdf

©Via Afrika Publishers » Mathematical Literacy Grade 10 68
Section 1
Practice Exercises
3.1 What amount is charged per cheque deposit into a current account? (1)
3.2 Each cash deposit at a Standard Bank ATM costs “R3,90 + 1,15% of value of the deposit”, so a cash deposit of R230, will mean a bank charge of:
R3,90 + 1,15% of R230 = R3,90 + 1,15÷ 100 × R230 = R3,90 + R2,65 = R6,55
Calculate the following:
3.2.1 The bank charges on a cash deposit of R650 at a Standard Bank ATM. (3)
3.2.2 The bank charges on a cash deposit of R870 at a Standard Bank branch. (4)
3.2.3 The deposit that was made at a Standard Bank ATM that had a bank charge of R8,50. (3)
3.3 The bank charges for cash withdrawals are also listed in the above table.
3.3.1 Calculate the bank charges for a withdrawal of R100 from a Standard Bank ATM. (4)
3.3.2 A bank customer has a bank balance of R1 200 and makes a cash withdrawal of R800 at the branch (not from the ATM) using a cheque card. How much will be left in the account after the withdrawal and bank charge? (5)
3.4 If you needed to pay a business, would it be cheaper to draw the cash and then pay them or to perform an electronic account payment? Give full reasoning for your answer. (2)
Question 4: The Holiday 21 marksThe Gumede family are planning a holiday at the sea. They want to drive down to the coast. They make a list of their possible expenditures:
Expenditure AmountHoliday cottage R3 920Petrol R0,74 per kmFood R120 per person per dayOther expenses (entrance fees to aquarium, etc.) Approximately R1 400
4.1 Why is it important for the Gumede family to plan before going on holiday? (1)
4.2 They always stay for 7 nights when they go on holiday. How much is the Holiday Cottage costing them per night? (2)
4.3 They live in Johannesburg and they plan to spend their holiday at Pennington on the KwaZulu-Natal South Coast. This is a distance of 526 km.
4.3.1 How much should petrol cost them to travel from their home to Pennington? (2)
4.3.2 If Mr. Gumede estimates that he would use R500 worth of petrol while they are at the coast for driving, how many kilometres would he be able to

©Via Afrika Publishers » Mathematical Literacy Grade 10 69
Section 1
Practice Exercises
drive with that amount of money? Round your answer to the nearest 100 km. (3)
4.3.3 Using your answers to the two previous questions, approximately how much will be spent on petrol during the Gumede family holiday at the coast? (2)
4.4 They always stay for 7 nights when they go on holiday.
4.4.1 For how many days will they be on holiday? (1)
4.4.2 The Gumede family consists of Mom, Dad and 3 children. Using your answer to question 4.4.1, calculate how much money they will spend on food during their holiday. (3)
4.5 Using your previous answers, calculate the total amount that the Gumede family will need to save for their holiday. (2)
4.6 Mr Gumede works out that he can save R1 500 of his salary every month.
4.6.1 If he starts saving in June, will he have saved enough for his family to go on holiday in December (using your answer to question 4.5)? (3)
4.6.2 If they do not save enough money, give TWO suggestions of what can they do to still be able to go on holiday. (2)

©Via Afrika Publishers » Mathematical Literacy Grade 10 70
Section 1
Answers to questions
Thinking Levels
Question Working Marks Criteria TL1 TL2 TL3 TL4
1.1 29 October 2009 1 1 mark: answer 1
1.2 30 November 2009 1 1 mark: answer 1
1.3 R519,18 1 1 mark: answer 1
1.4 R800 1 1 mark: answer 1
1.5.1 R103,88 1 1 mark: answer 1
1.5.2 R118,42 1 1 mark: answer 1
1.6 R201,83 – R24,79 = R177,04 or: 40 Amps x 4,426 = R177,04 2 1 mark: method
1 mark: answer 2
1.7 504 kWh 1 1 mark: answer 1
1.8Total = 504 × 0,346230 = R174,50 or: final total ÷ 1,14 = R198,93 ÷ 1,14 = R174,50
2 1 mark: method 1 mark: answer 2
1.9% of total = R198,93 ÷ R519,18 x 100 = 38,32%
3
1 mark: consumption amount 1 mark: method 1 mark: answer
3
1.10
R % 329,25 : 40 493,88 : 60 Consumption cost = R493,88
3
1 mark: method 1 mark: 40% linked to R329,25 1 mark: answer
3
Question 1: 17

©Via Afrika Publishers » Mathematical Literacy Grade 10 71
Section 1
Answers to questions
Thinking Levels
Question Working Marks Criteria TL1 TL2 TL3 TL4
2.1Total seconds = 195 + 270 + 45 + 24 + 730 + 40 = 1 304 seconds
2 1 mark: method 1 mark: answer 2
2.2 Total cost = R0,06 x 1 304 = R78,24 3
1 mark: convert to rands 1 mark: correct rate 1 mark: answer
3
2.3 200 minutes 1 1 mark: answer 1
2.4 Total = 4 + 5 + 1 + 1 + 13 + 1 = 25 mins 3
1 mark: at least 1 call correctly converted to minutes 1 mark: all calls correctly converted to minutes 1 mark: Total
3
2.5.1
He only works Monday to Friday and not on weekends and there are approximately that many workdays in each month.
1 1 mark: answer 1
2.5.2 350 minutes x R1,37 = R479,50 2 1 mark: correct rate 1 mark: answer 2
2.5.3 R381,90 + R479,50 = R861,40 2 1 mark: method 1 mark: answer 2
2.6 22 work days x R78,24 = R1 721,28 3
1 mark: 22 days 1 mark: method (CA) 1 mark: answer (CA)
3
2.7
The best option for him would seem to be the Contract option, because it is cheaper (if he makes approximately the same amount of calls every day as was given in the example).
2 1 mark: contract option 1 mark: valid reasoning 2
Question 2: 19
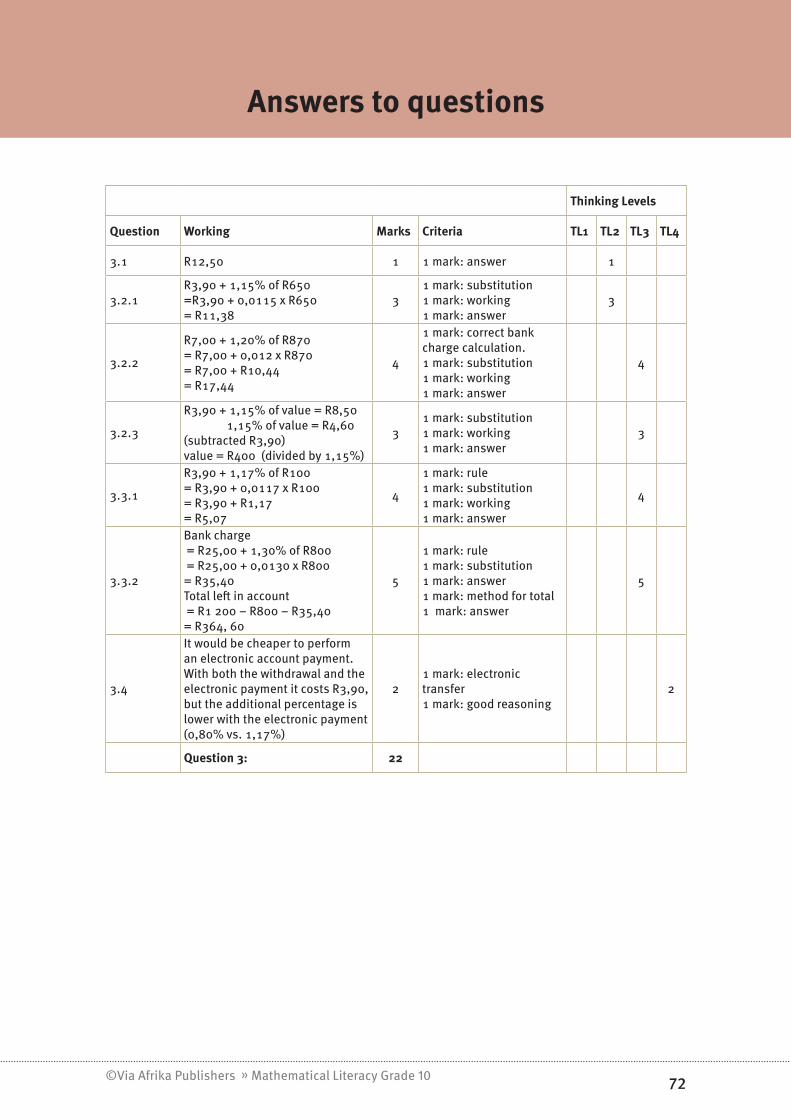
©Via Afrika Publishers » Mathematical Literacy Grade 10 72
Section 1
Answers to questions
Thinking Levels
Question Working Marks Criteria TL1 TL2 TL3 TL4
3.1 R12,50 1 1 mark: answer 1
3.2.1R3,90 + 1,15% of R650 =R3,90 + 0,0115 x R650 = R11,38
31 mark: substitution 1 mark: working 1 mark: answer
3
3.2.2
R7,00 + 1,20% of R870 = R7,00 + 0,012 x R870 = R7,00 + R10,44 = R17,44
4
1 mark: correct bank charge calculation. 1 mark: substitution 1 mark: working 1 mark: answer
4
3.2.3
R3,90 + 1,15% of value = R8,50 1,15% of value = R4,60 (subtracted R3,90) value = R400 (divided by 1,15%)
31 mark: substitution 1 mark: working 1 mark: answer
3
3.3.1
R3,90 + 1,17% of R100 = R3,90 + 0,0117 x R100 = R3,90 + R1,17 = R5,07
4
1 mark: rule 1 mark: substitution 1 mark: working 1 mark: answer
4
3.3.2
Bank charge = R25,00 + 1,30% of R800 = R25,00 + 0,0130 x R800 = R35,40 Total left in account = R1 200 – R800 – R35,40 = R364, 60
5
1 mark: rule 1 mark: substitution 1 mark: answer 1 mark: method for total 1 mark: answer
5
3.4
It would be cheaper to perform an electronic account payment. With both the withdrawal and the electronic payment it costs R3,90, but the additional percentage is lower with the electronic payment (0,80% vs. 1,17%)
21 mark: electronic transfer 1 mark: good reasoning
2
Question 3: 22

©Via Afrika Publishers » Mathematical Literacy Grade 10 73
Section 1
Answers to questions
Thinking Levels
Question Working Marks Criteria TL1 TL2 TL3 TL4
4.1 Without planning, they would not know if they had enough money. 1 1 mark: answer 1
4.2 R3 920 ÷ 7 = R560/night 2 1 mark: method 1 mark: answer 2
4.3.1 526 km x R0,74/km = R389,24 2 1 mark: method 1 mark: answer 2
4.3.2 R500 ÷ R0,74/km = 675,68/700 km 31 mark: method 1 mark: answer 1 mark: rounding
3
4.3.3 Total = R500 + 2 × R389,24 = R1 278,48 2 1 mark: method
1 mark: answer (CA) 2
4.4.1 8 days (the nights occur between the days) 1 1 mark: answer 1
4.4.2 8 days x R120/day × 5 people = R4 800 3
1 mark: correct value from table 1 mark: method 1 mark: answer
3
4.5
Total = R3 920 + R1 278,48 + R4 800 + R1 400 = R11 398,48
2 1 mark: method 1 mark: answer (CA) 2
4.6.1
Total months saving: 7 months (June to Dec) Total saved = R1 500 × 7 = R10 500 So, no he will not have enough
3
1 mark: no. of months (could also be 6 months if they only went to Nov.) 1 mark: calculation 1 mark: interpretation
3
4.6.2
Any two reasonable suggestions (e.g. the children can do little side jobs, the mom can put some of her salary away, etc.)
2 1 mark: (each) reasonable answer 2
Question 4: 21

©Via Afrika Publishers » Mathematical Literacy Grade 10 74
Section 1
Measurement
Chapter 4
Overview
Measurement
CHAPTER 4 Page 74
Conversions in the
metric system
• The metric system
• Convert units of measurement from memory
• Converting units of measurement from conversion
factors and tables
• Analogue and digital display
• Conversions with time
• Calculating elapsed time
• Calendars and timetables
Time
SECTION 2 Page 76
• Measuring length and distance
• Calculations involving length and distanceLength and Distance
SECTION 3 Page 81
• Measuring mass
• Calculations involving massMass (weight)
SECTION 4 Page 84
• Measuring volume
• Calculations involving volumeVolume
SECTION 5 Page 85
• Measuring temperature
• Calculations involving temperatureTemperature
SECTION 6 Page 86
• Perimeter of shapes with straight sides
• Perimeter of circlesPerimeter
SECTION 7 Page 87
• Areas of rectangles and squares
• Areas of triangles
• Areas of circlesArea
SECTION 8 Page 91
SECTION 1 Page 75
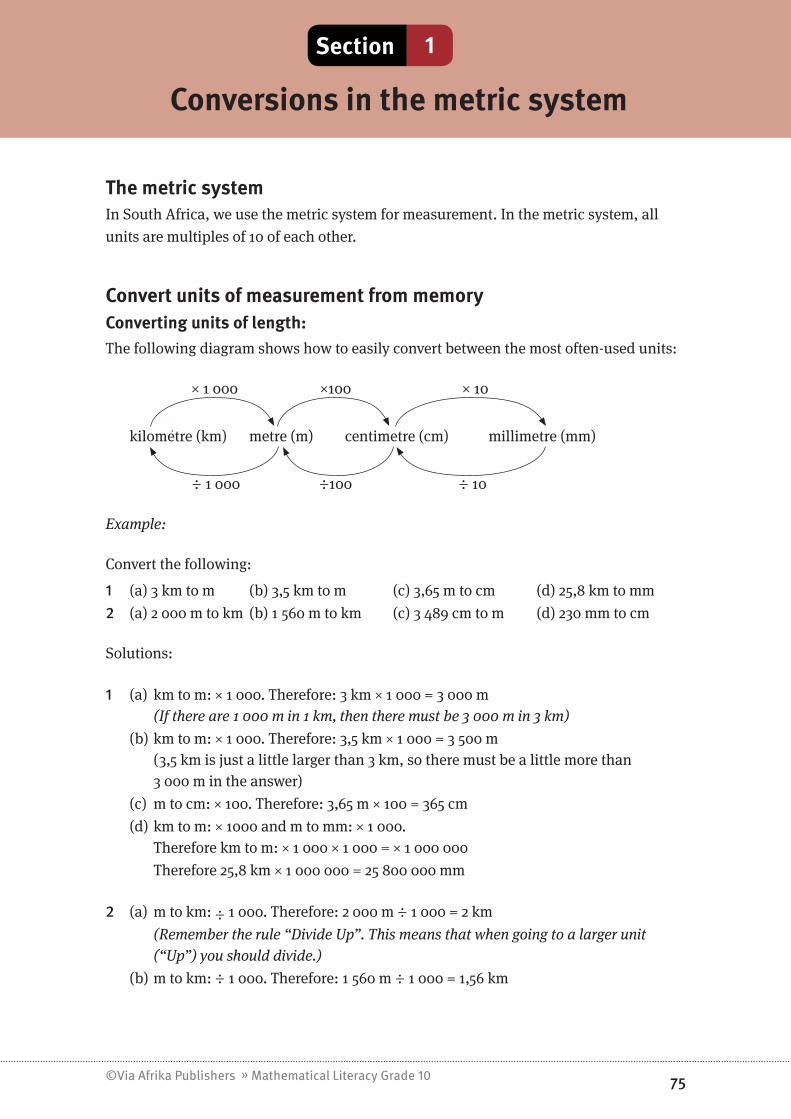
©Via Afrika Publishers » Mathematical Literacy Grade 10 75
Section 1Section 1
Conversions in the metric system
The metric systemIn South Africa, we use the metric system for measurement. In the metric system, all units are multiples of 10 of each other.
Convert units of measurement from memoryConverting units of length:The following diagram shows how to easily convert between the most often-used units:
× 1 000 ×100 × 10
kilometre (km) metre (m) centimetre (cm) millimetre (mm)
÷ 1 000 ÷100 ÷ 10
Example:
Convert the following:
1 (a) 3 km to m (b) 3,5 km to m (c) 3,65 m to cm (d) 25,8 km to mm2 (a) 2 000 m to km (b) 1 560 m to km (c) 3 489 cm to m (d) 230 mm to cm
Solutions:
1 (a) km to m: × 1 000. Therefore: 3 km × 1 000 = 3 000 m (If there are 1 000 m in 1 km, then there must be 3 000 m in 3 km)
(b) km to m: × 1 000. Therefore: 3,5 km × 1 000 = 3 500 m (3,5 km is just a little larger than 3 km, so there must be a little more than
3 000 m in the answer)(c) m to cm: × 100. Therefore: 3,65 m × 100 = 365 cm(d) km to m: × 1000 and m to mm: × 1 000. Therefore km to m: × 1 000 × 1 000 = × 1 000 000 Therefore 25,8 km × 1 000 000 = 25 800 000 mm
2 (a) m to km: ÷ 1 000. Therefore: 2 000 m ÷ 1 000 = 2 km (Remember the rule “Divide Up”. This means that when going to a larger unit
(“Up”) you should divide.) (b) m to km: ÷ 1 000. Therefore: 1 560 m ÷ 1 000 = 1,56 km

©Via Afrika Publishers » Mathematical Literacy Grade 10 76
Section 1
(c) cm to m: ÷ 100. Therefore: 3 489 cm ÷ 100 = 34,89 cm (d) mm to cm: ÷ 10. Therefore: 230 mm ÷ 10 = 23 cm
Converting units of volume: × 1 000
liter (l) milliliter (ml)
÷ 1 000
Converting units of mass: × 1 000 × 1 000
Ton kilogram (kg) gram (g)
÷ 1 000 ÷ 1 000
Converting units of measurement from conversion factors and tablesWe use conversion factors, such as the following, to do conversions when preparing food: 1 cup (c) = 250 ml 1 tablespoon (tbsp) = 15 ml 1 teaspoon (tsp) = 5 ml
Sometimes, these conversion factors are given in a table such as the following:
Unit of measurement ml tbsp tspCup (c) 250 17 50Tablespoon (tbsp) 15 1 3
Teaspoon (tsp) 5 1 __ 3 1

©Via Afrika Publishers » Mathematical Literacy Grade 10 77
Section 1
Time
Section 2
Analogue and digital displayTime can be displayed in analogue form or digitally: 4:10
a.m. and p.m. formatTime from midnight to midday (or noon) is called “a.m.”. Therefore, 8 o’clock in the morning can be expressed as 8 a.m., and noon can be expressed as 12 a.m.
Time from noon to midnight is called “p.m.”. Therefore, 2 o’clock in the afternoon can be expressed as 2 p.m. – 7 o’clock in the evening as 7 p.m. and midnight as 12 p.m.
Note: Midnight can be expressed either as 12 p.m. or 0 a.m.
12 hour and 24 hour time formatsIt is common these days to express time in a 24 hour format. This simply means that at noon, we don’t start at 0 again, but continue with 13 (for 1 p.m.), 14 (for 2 p.m.) until 24 (for 12 p.m., that is midnight). In fact, we usually write 13:00 (for 1 p.m.), 14:00 (for 2 p.m.), etc.
So, if the clock above shows the time in the morning, it can be expressed as 4:10 a.m. or 04:10.
However, if it shows the time in the afternoon, it can be expressed as 4:10 p.m. or 16:10.
Conversions with time
1 year = 365 days or ≈ 52 weeks
1 month ≈ 4 weeks 1 week = 7 days 1 day = 24 hours 1 hour = 60
minutes1 minute = 60 seconds
Unlike the metric system, which is based on the number 10, time is based on a totally different number system, making it much harder to convert between units of time.
Example: Smaller unit to larger unit (multiply)Convert 3 hours to minutes.In 1 hour there are 60 minutes, so in 3 hours: 3 × 60 = 180 minutes.
Example: Larger unit to smaller unit (divide)Convert 15 400 seconds to hours.3 600 seconds make 1 hour (60 seconds in a minute x 60 minutes in an hour).So 15 400 ÷ 3 600 ≈ 4,2778 hours
Therefore, we have 4 whole hours and some left overs.
4:10

©Via Afrika Publishers » Mathematical Literacy Grade 10 78
Section 1Section 2
What about the left overs?Time is not a decimal system, so the decimal is not meaningful.Therefore, we will never talk of 0,27778 hours! Left overs = 15 400 seconds – 4 hours × 3 600 seconds = 15 400 seconds – 14 400 seconds = 1 000 seconds = 1 000 seconds ÷ 60 seconds in a minute = 16,6667 minutes = 16 mins + [(0,66667 × 60) = 40 seconds]So there are 4 hours, 16 minutes and 40 seconds in 15 400 seconds.
Calculating elapsed timeIn order to plan activities, or to interpret events, we often need to add or subtract with time.
Example During an athletics meeting, Maria finished the 800 m event in 3 minutes and 48 seconds, while her friend Thandi finished in 4 minutes and 6 seconds.
1 Who finished the event first? Answer: Maria (her time was shorter than Thandi’s time)
2 What was the difference in their times? Answer: Instead of subtracting their times as we would normally (e.g. 7 – 5 = 2), we
take the shortest time and add time to it until you get to the longest time. Time that passed from 3 min 48 sec to 4 min = 12 seconds Time that passed from 4 min to 4 min 6 sec = 6 seconds Therefore, the total time difference = 12 seconds + 6 seconds = 18 seconds

©Via Afrika Publishers » Mathematical Literacy Grade 10 79
Section 1Section 2
Calendars and timetables
Source: http://www.kwathabeng.co.za
1 Shown here is a calendar of 2012. Use the calendar to find:1.1 how many days there are:
1.1.1 from 1 Feb 2012 to 29 Feb 2012.1.1.2 from 5 Mar 2012 to 30 Apr 2012.
1.2 how many weeks there are from 12 February 2012 to 29 April 2012.1.3 how many weeks and days left over there are from 8 Jul 2012 to 10 Oct 2012.
Answers:
When working with time it is important to work in jumps.1.1.1. This does not need a “jump” to another month, so we simply subtract the
numbers: 29 – 1 = 28 days1.1.2 This does require a “jump”. We can either subtract from 30 April until we get to 5
March or we can add days to the earlier date (i.e. start at 5 March and add days). 30 April = 30 days to 31 March. Then in March: 31 – 5 = 26 days Therefore the total number of days = 30 + 26 = 56 days.
1.2 Both 12 February and 29 April fall on the same day of the week (they both fall on a Sunday), so we simply use the calendar to count the number of weeks between them: 11 weeks.
1.3 8 July and 10 October do not fall on the same day, therefore we have to work out the weeks first: 8 July and 7 October both fall on a Sunday, so counting the weeks between them we get 13 weeks. Then from 7 to 10 October is 3 days. Therefore the final answer is 13 weeks and 3 days.

©Via Afrika Publishers » Mathematical Literacy Grade 10 80
Section 1Section 2
Planning a TimetableWhen studying for your exams, it is important to plan your time well. You will have a limited amount of time to cover all of your subjects. It is useful to cover two learning subjects per day and mix that in with a practical subject (e.g. Mathematical Literacy practice exercises).
Here is the study timetable for one day for a learner who takes Life Science, History and Mathematical Literacy. She included time to take breaks as well as time to exercise. This will help her to focus and keep the brain supplied with oxygen. Use it to answer the questions which follow.
Day Time Activity Length of activityFriday 07:00 Wake up, shower, eat breakfast 45 mins
07:45 Study session 1: Life Science 45 mins08:30 Break 15 mins08:45 Study Session 2: Life Science 45 minsA Break 15 minsB Exercise: Push-ups and stretches 30 mins10:15 Practical Session 1: Math Literacy C11:45 Lunch 45 minsD Study Session 3: History 45 mins13:15 E 15 mins13:30 Study Session 4: History FG Break 15 mins14:30 Outdoor exercise: Walk 60 mins15:30 Nap 30 mins16:00 Practical Session 2: Math Literacy 1 hour17:00 Supper & TV 2 hoursH Study Session 5: History 45 minsI Get ready for bed.
Questions:
1 Fill in the information that is missing (marked with the letters A to I).2 Why are the practical sessions longer than the study sessions?3 During the study sessions, this learner uses the time to make notes instead of just
trying to cram facts into her head. Why is this a clever idea?4 Why is it important to take breaks during your study times?5. Why is it important to be very disciplined and keep to the study times in a study
timetable?
Answers:
1 A: 08:45 + 0:45 = 09:30B: 09:30 + 0:15 = 09:45C: 11:45 - 10:15 = 1:30 = 90 minsD: 11:45 + 0:45 = 11:45 + 0:15 + 0:30 = 12:00 + 0:30 = 12:30E: Break (she always has a break after a study session)

©Via Afrika Publishers » Mathematical Literacy Grade 10 81
Section 1Section 2
F: 45 mins (as usual)G: 14:15H: 19:00I: 19:45
2 Study sessions require more concentration, while practical sessions can be used to stimulate other parts of the brain while still doing useful studying.
3 Notes allow you to learn facts at the same time as condensing the work.4 To allow the brain to relax again and allow it to process the information.5 If you don’t keep to the study timetable you could run out of time and be ill-prepared
for your examinations.
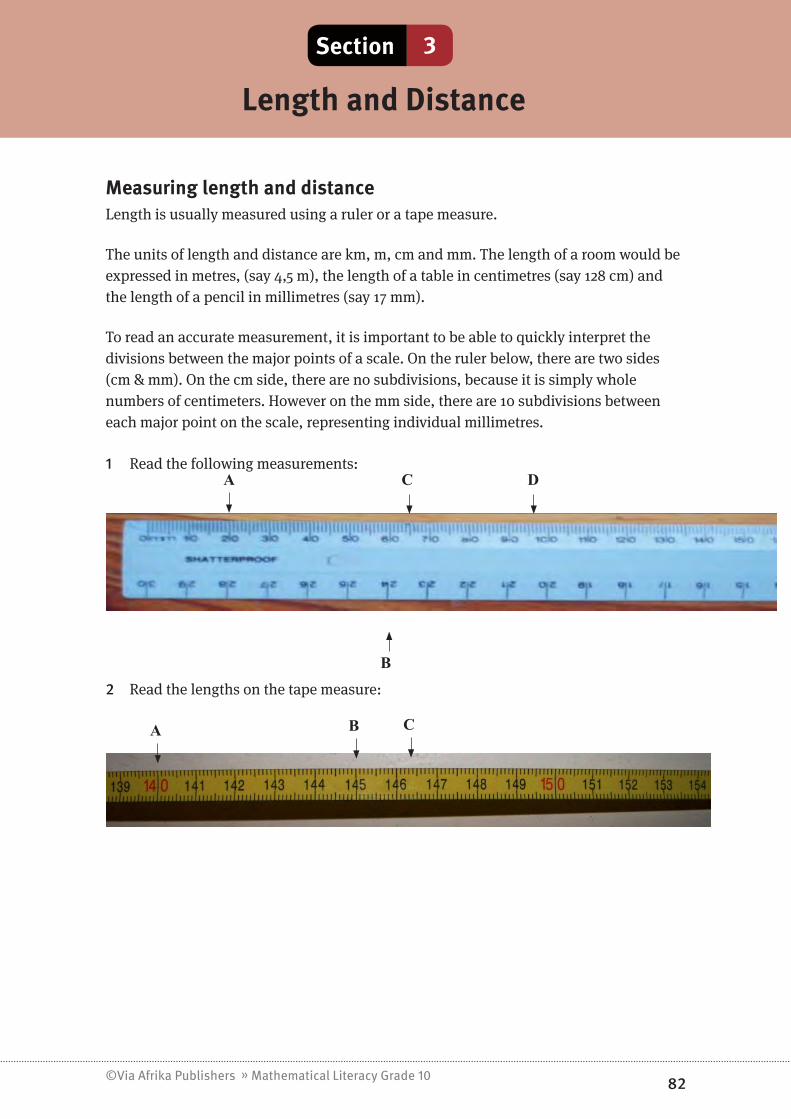
©Via Afrika Publishers » Mathematical Literacy Grade 10 82
Section 1Section 3
Length and Distance
Measuring length and distanceLength is usually measured using a ruler or a tape measure.
The units of length and distance are km, m, cm and mm. The length of a room would be expressed in metres, (say 4,5 m), the length of a table in centimetres (say 128 cm) and the length of a pencil in millimetres (say 17 mm).
To read an accurate measurement, it is important to be able to quickly interpret the divisions between the major points of a scale. On the ruler below, there are two sides (cm & mm). On the cm side, there are no subdivisions, because it is simply whole numbers of centimeters. However on the mm side, there are 10 subdivisions between each major point on the scale, representing individual millimetres.
1 Read the following measurements:
B
A C D
2 Read the lengths on the tape measure:
A B C
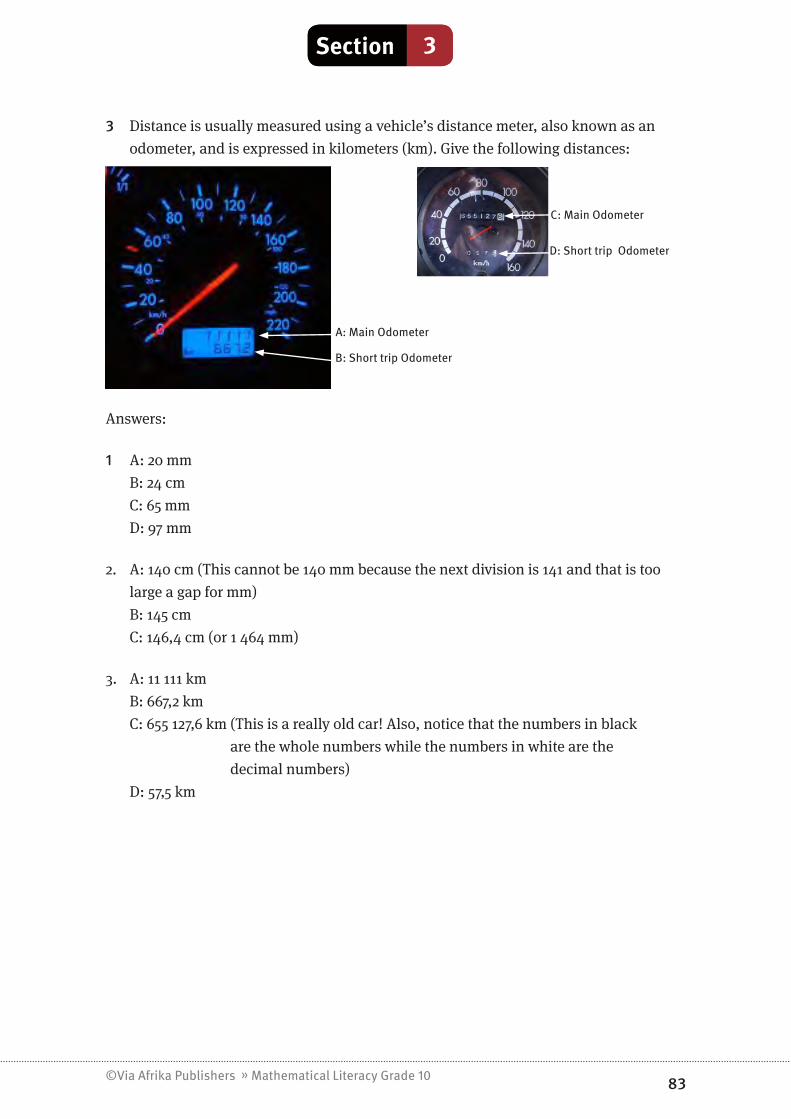
©Via Afrika Publishers » Mathematical Literacy Grade 10 83
Section 1Section 3
3 Distance is usually measured using a vehicle’s distance meter, also known as an odometer, and is expressed in kilometers (km). Give the following distances:
D: Short trip Odometer
C: Main Odometer
A: Main Odometer
B: Short trip Odometer
Answers:
1 A: 20 mmB: 24 cmC: 65 mmD: 97 mm
2. A: 140 cm (This cannot be 140 mm because the next division is 141 and that is too large a gap for mm)B: 145 cmC: 146,4 cm (or 1 464 mm)
3. A: 11 111 kmB: 667,2 kmC: 655 127,6 km (This is a really old car! Also, notice that the numbers in black
are the whole numbers while the numbers in white are the decimal numbers)
D: 57,5 km

©Via Afrika Publishers » Mathematical Literacy Grade 10 84
Section 1Section 3
Calculations involving length and distanceWhen calculating with length and distance, it is important to convert both measurements to the same units before attempting the calculation.
Example
A person would like to see whether a single bed and a desk will fit into their room.
The bed is 1,1 m wide and the desk is 980 mm wide.
What will their total width be when placed side-by-side?
Answer:
Convert both measurements to the smallest unit. This will limit the number of decimal places that have to be handled in the calculation.
The smallest unit is mm, so convert the width of the bed to mm: 1,1 m × 1 000 = 1 100 mm.
Therefore, the total width side-by-side = 1 100 mm + 980 mm = 2 080 mm

©Via Afrika Publishers » Mathematical Literacy Grade 10 85
Section 1
Mass (weight)
Section 4
Measuring massMass and weight are often taken to mean the same thing.
Mass is usually measured using a scale, for example a kitchen scale and a bathroom scale.
The units of mass are ton, kg and gram. The mass of a vehicle could be expressed in kg or ton, for example 1,6 ton or 1 600 kg; the mass of a bag of potatoes in kg, for example 5 kg; and the mass of margarine in gram, for example 500 g.
You need to be able to read a mass from a scale.
Read the values on these scales:
2. Kitchen scale (analogue)
A
B
1. Bathroom scale (analogue)
D
C
Answers:A: 230 kg (Bathroom scales usually measure in kg. This subdivision occurs exactly half
way between 220 and 240, so therefore it is 230 kg)B: 237 kg C: 2,0 kgD: 2,6 kg
Calculations involving massExampleIn a certain shop the price of onions is R6,95 per kg. What would be the cost of: (a) 5 kg onions (b) 7,25 kg onions
Answers:(a) 1 kg onions cost R6,95 × 5 × 5 Therefore 5 kg onions cost R43,75
(b) 1 kg onions cost R6,95 × 7,25 × 7,25 Therefore 7,25 kg onions cost R50,39

©Via Afrika Publishers » Mathematical Literacy Grade 10 86
Section 1
Volume
Section 5
Measuring volumeVolume is usually measured using measuring jugs, cups and spoons, but also bottles, buckets and even wheelbarrows.
The units of mass are litre (ℓ) and millilitre (mℓ). The volume of a bucket could be 10ℓ, while the volume of a cup is about 250 mℓ.You need to be able to read values from a measuring jug.The values on this measuring jug are:
BA
A: 350 mℓ (It is half way between 300 and 400)B: 300 mℓ (It is a quarter of the way between 250 and 350)
Calculations involving volumeExample:If one litre of milk costs R7,99, what would be the price of 2,5 litres? 1 ℓof milk cost R7,99 × 2,5 × 2,5 Therefore 2,5 ℓof milk cost R19,98

©Via Afrika Publishers » Mathematical Literacy Grade 10 87
Section 1Section 6
Temperature
Measuring temperatureVolume is usually measured using thermometers. Dials on stoves and fridges are used to set the thermometer of these appliances. Temperature values are also shown on weather maps.
The unit of temperature is degrees Celsius (°C). In some countries, such as Great Britain, temperature is measured in degrees Fahrenheit (°F). 0°C is the freezing point of water. A day temperature of 25 °C is considered to be moderate, while a temperature of –5 °C is considered to be cold.
You need to be able to read temperature values from a thermometer, for example: A: 106 °F (There are 5 divisions from 100 to 110, therefore
each division is 2 degrees: (110 – 100) ÷ 5 = 2)B: 38 °C (There are 10 divisions between 30 and 40)
Calculations involving temperatureYou need to be able to convert between °C and °F, using the following formulas (which will be given in the exam):
●● °F = (1,8 × °C) + 32°●● °C = (°F − 32°) ÷ 1,8
Example:Use the correct formula and convert:(a) 365 °F to °C(b) -10°C to °F
Answers:a) °C = (°F – 32) ÷ 1,8 = (365 – 32) ÷ 1,8 = (333) ÷ 1,8 = 185 °Cb) °F = (1,8 × °C) + 32 = (1,8 × (–10)) + 32 = (–18) + 32 = 14 °F
A
B

©Via Afrika Publishers » Mathematical Literacy Grade 10 88
Section 1
Perimeter
Section 7
The perimeter of a two dimensional (2-D) shape is the distance along the outer edge of the shape.
A 2-dimensional (2-D) shape is a shape with length and width, but no height.
Examples are:●● a page of a book●● a floor of a room●● a circle.
Perimeter of shapes with straight sidesRectangles:Perimeter = 2 × length + 2 × width
= 2 × (length + width)
Remember: in a rectangle the opposite sides are equal.
Squares:Perimeter = 4 x side
Remember: in a square all the sides are equal.
Triangles:Perimeter = side 1 + side 2 + side 3
ExampleCalculate the perimeter of each shape:
a)
30 m
m
11 mm
24 mm
12 mm
b) 20 mm
25 mm
12 mm
Width
Length
Side
Side
Side 1 Side 2
Side 3

©Via Afrika Publishers » Mathematical Literacy Grade 10 89
Section 1Section 7
Answers:a) Perimeter = 30 + 24 + 12 + 11 + 18 + 13 = 108 mm (The last two measurements were calculated: 24 – 11 = 13 mm and 30 - 12 = 18 mm)
b) With perimeter we only add the outside measurements. So we ignore the line between the rectangle and the triangle.However, before we start adding the lengths together, we will need to calculate the remaining side of the triangle using the Theorem of Pythagoras:
(Short side 1)2 = (Long side)2 – (Short side 2)2 (Pythagoras) = (25 mm)2 – (20 mm)2
= 625 mm2 – 400 mm2
= 225 mm2
Short side 1 = √____
225 mm2
= 15 mm Perimeter = 25 mm + 12 mm + 15 mm + 20 mm + 12 mm = 84 mm
Perimeter of circlesThe perimeter of a circle is known as the circumference.Circumference = π × diameter of the circle or C = π × d = 2 π × radius of the circle or C = 2 π × r
= RadiusA semi-circle is a half circle A quarter circle A three-quarter circle
The formulas below give the length of the curved part of the circle only.
Circumference
= 1 _ 2 × 2 × π × r
Circumference
= 1 __ 4 × 2 × π × r = 1 _ 2 × π × r
Circumference
= 3 __ 4 × 2 × π × r = 3 _ 2 × π × r
radius
diameter
centre of circle

©Via Afrika Publishers » Mathematical Literacy Grade 10 90
Section 1Section 7
ExampleCalculate the circumference of each of the following:
a) 8 cm b)
44 mm
c) 10 cm
Answers: a) Perimeter = Semi-circle + diameter = 1 _ 2 × 2 × π × r + 2 × r = (0,5)(2)(3,14)(8)+ 2(8) = 25,12 + 16 = 41,12 cm
b) Perimeter = 3 __ 4 circle + 2 × radius
= 3 __ 4 × 2 × π × r + 2 × r
= (0,75)(2)(3,14)(44)+ 2(44) = 207,24 + 88 = 295,24 mm
c) Perimeter = 3 × sides of square + radius + 1 __ 4 circle = 3 × 10 + 10 + 1 __ 4 × 2 × π × r = 30 + 10 + (0,25)(2)(3,14)(10) = 40 + 15,7 = 55,7 cm

©Via Afrika Publishers » Mathematical Literacy Grade 10 91
Section 1Section 8
Area
Area is the amount of two-dimensional (or surface) space occupied by a shape.
Area of rectangles and squaresArea of a rectangle: Area = length × width
= l × b
Remember: in a rectangle, the opposite sides are equal.
From this formula follows the area of a square:
Area = side × side = s × s = s2
Remember: in a square all sides are equal.
Areas of trianglesThe area of a triangle is given by:Area = 1 _ 2 × base × perpendicular height = 1 _ 2 × b × ⊥ h
Remember: the base can be any side on which we have a perpendicular height.
Example
Calculate the area of each of the
triangles shown.
Answer:
Triangle A: Area = 1 _ 2 × b × ⊥h Triangle B: Area = 1 _ 2 × b × ⊥h = 1 _ 2 × 16 cm × 9 cm = 1 _ 2 × 19cm × 7 cm = 72 cm2 = 66,5 cm2
Width
Length
Side
Side
9 cm
A:
7 cm
19 cm
B:
16 cm

©Via Afrika Publishers » Mathematical Literacy Grade 10 92
Section 1Section 8
Examples
a) b)
Answers
a) Total area = Rectangle 1 + Rectangle 2 (We can “chop up” the area into two rectangles 12 mm × 24 mm and 18 mm × 13 mm) = 12 mm × 24 mm + 18 mm × 13 mm = 288 mm2 + 234 mm2
= 522 mm2 (Note that area will always have squared units)
b) Total area = Rectangle + Triangle = 12 mm × 25 mm + ½ × 20 mm × 15 mm (from previous working) = 300 mm2 + 300 mm2
= 600 mm2
Areas of circlesWe calculate the area of a circle using the following formula:
Area = π × (radius of the circle)2
= π × r2
For a semi circle, we have: Area = 1 _ 2 × π × r2
For a quarter circle, we have: Area = 1 __ 4 × π × r2
For a three-quarter circle, we have: Area = 3 __ 4 × π × r2
30 m
m
11 mm
24 mm
12 mm
20 mm
25 mm
12 mm
Radius

©Via Afrika Publishers » Mathematical Literacy Grade 10 93
Section 1Section 8
ExampleCalculate the area of each of the following to the nearest cm2:
10mm 25mm 8 mm
A B C
Answer:A: Area =π × r2 A: Area =π × r2 Area = 1 _ 2 π × r2
= 3,142 × (10 cm)2 = 3,142 × (12,5 cm)2 = 1/2 × 3,142 × (8 cm)2
= 314 cm2 = 491 cm2 = 101 cm2
ExampleCalculate to 1 decimal place the area of each of the following:
a)
36 cm
b)
44 mm
c) 10 cm
Answers: a) Area = 1 _ 2 π r2
= (0,5)(3,142)(18 cm)2
= 509,0 cm2
b) Area = 3 __ 4 π r2
= (0,75)(3,142)(44 mm)2
= 4 562,2 mm2
c) Area = Area of Square + Area of ¼ circle = side2 + 1 __ 4 π r2
= (10 cm)2 + (0,25)(3,142)(10 cm)2
= 100 + 78,55 = 178,6 cm2

©Via Afrika Publishers » Mathematical Literacy Grade 10 94
Section 1
Practice Exercises
Question 1: Recycling 22 marks
Recycling is important to preserve and protect our planet’s resources. It can also be very profitable for a school to have a recycling program. Here are some questions that relate to recycling:
1.1 Newspapers can be recycled. They are sold to recyclers by the kg.
1.1.1 The average daily newspaper weighs approximately 800 g. Convert 800 g to kg. (2)
1.1.2 Recyclers can pay 3c per kg. Using your answer to question 1.1.1, how much money will you get for each newspaper that you recycle? Answer in Rands. (2)
1.1.3 Each child in a local school of 600 learners brings in 5 newspapers per week. Use your answer in question 1.1.2 to calculate how much money a school will be able to make in a month (which has 4 weeks). Answer in Rands. (4)
1.1.4 It is not accurate to assume that each newspaper weighs 800 g. Give a reason for this statement. (1)
1.2 Cardboard is also a very good recyclable material. Collected cardboard is flattened first and then tied in bundles that are 15 cm thick.
1.2.1 Convert 15 cm into mm. (2)
1.2.2 The average packing box is approximately 8 mm thick when it is flattened. Use your answer in question 1.2.1 to work out the maximum number of boxes that can be tied together to form a bundle. (3)
1.2.3 These bundles are then stacked together and tied into blocks that are 1,2 m high. How many bundles are used to make one block of cardboard? (3)
1.3 Used engine oil can be re-used by refining it again. A mechanic has a large drum that can hold 200 ℓ of used oil.
1.3.1 Convert 200 ℓ into mℓ. (2)
1.3.2 Each mℓ of used oil has an approximate weight of 0,828 g. Calculate the total weight of the oil in the 200 ℓ barrel. Give your answer in kg. (3)

©Via Afrika Publishers » Mathematical Literacy Grade 10 95
Section 1
Practice Exercises
Question 2: Train timetable 19 marksThe following shortened train timetable is for local Metrorail trains travelling to Cape Town. Use it to answer the questions which follow:
(source: http://www.capemetrorail.co.za/_timetables/timetable_index.htm)
2.1 At what time does train number 3508 arrive in Cape Town? (1)
2.2 Train number 3508 from Wellington does not have an arrival time listed for Somerset West. Explain why this is so. (1)
2.3 A passenger got onto train number 2512 at Kraaifontein, wanting to go directly to Cape Town. What would be the problem with that plan? (1)
2.4 If a passenger who lives in Kraaifontein needs to be in Bellville by 07:20, what time is the latest train that he or she can catch? (1)
2.5 Why might it be a good idea for the passenger in question 2.4 to catch an earlier train? (1)
2.6 Calculate the journey time for train number 3508 from Brackenfell to Cape Town. (2)

©Via Afrika Publishers » Mathematical Literacy Grade 10 96
Section 1
Practice Exercises
2.7 Now calculate the journey time for train number 3510 from Brackenfell to Cape Town. Explain the difference in times between this answer and your answer in question 2.6. (3)
2.8 A passenger is leaving Stikland on the train that leaves at 07:12 and he would like to get to Salt River. Explain what he should do. (2)
2.9 The approximate distance from Wellington to Cape Town is 72 km.
2.9.1 Calculate the time it takes to travel by train, using train number 3508 from Wellington to Cape Town (answer in minutes). (3)
2.9.2 Convert your answer to a decimal number of hours. (2)
2.9.3 Calculate the average speed of someone travelling by train number 3508 from Wellington to Cape Town. Answer in km/h. (2)
Question 3: Baking Muffins 18 marksThe Grade 10 class is going to bake muffins for a HUGE charity muffin sale.
The recipe that they are going to use requires the following ingredients:
2 Eggs
125 mℓ Cooking oil
375 mℓ Brown sugar (300 g)
500 mℓ Milk
300 g Whole wheat flour
375 mℓ Cake flour (210 g)
5 mℓ Salt
5 mℓ Vanilla essence
10 mℓ Bicarbonate of soda
250 mℓ Raisins (150 g)
3.1 The weight of the whole wheat flour is given in grams. The volume of 150 g of whole wheat flour is 250 mℓ. Calculate the volume of the whole wheat flour in the recipe. (2)
3.2 When they are all mixed together, all of the above ingredients make up 2 ℓ of mixture (because some parts dissolve into other parts).
3.2.1 Convert 2 ℓ into mℓ. (2)
3.2.2 How many muffins can the above recipe make, if 60 mℓ is required for each muffin? (3)
3.2.3 Using your answer to question 3.2.2, how many eggs will the class need to buy to make 500 muffins? (3)

©Via Afrika Publishers » Mathematical Literacy Grade 10 97
Section 1
Practice Exercises
3.3 The learners will need to make a total of 500 muffins.
3.3.1 They are going to use muffin trays that hold 6 muffins per tray and plan to put 4 trays at a time into the ovens.
Each batch of muffins takes 30 minutes to bake. How long will they take to make all 500 muffins if they will be using 9 ovens in the Consumer Studies lab? (The other ovens are being repaired.) (5)
3.3.2 The recipe gives the baking temperature as 320 ⁰F. However, the ovens in the Consumer Studies lab are in ⁰C. Use the following formula to convert this to ⁰C:
°C = 5 __ 9 (°F –32°) (3)
Question 4: Play Area 13 marksA children’s play area at a restaurant has an interesting design in the floor. It consists of a large rectangular area with some other shapes cut into it. All the shapes (A, B, C) are made of yellow rubber, while the rest of the space is made of green rubber. (Note that the drawing is not to scale.)
3,8m
13m
1,8m
6m
4,5m
2,25m2
B
A
C
13 m
6 m
4,5 m
3,8 m1,8 m
22 m
A
B
C2,25 m2
4.1 Calculate the area of the circle (Shape A). Give your answer to one decimal place. (3)
4.2 Calculate the area of the triangle (Shape B). (3)
4.3 Calculate the side length of the square (Shape C). (2)
4.4 Calculate the area of the green rubber (using your previous answers to help you). Give your answer to one decimal place. (5)

©Via Afrika Publishers » Mathematical Literacy Grade 10 98
Section 1
Practice Exercises
Question 5: The White House 11 marksThe president of the United States of America’s official residence is the White House in Washington D.C.
17 m
17 m 17 m
51 m
12 m
26 m
Railing
Balcony
Source: http://money.howstuffworks.com/white-house-job.htm & papertoys.com
http://www.whitehousehistory.org/whha_history/history_facts-01.html
5.1 All along the roof of the white house is a decorative railing.
5.1.1 The measurement for the right hand side of the roof is given as 26 m. What is the length of the left hand side of the roof? Give a reason for your answer. (2)
5.1.2 Calculate the length of the semi-circular portion of the railing on the roof. Give your answer to two decimal places. (3)
5.1.3 Using your answer to question 5.1.2, calculate the total length of the railing along the entire roof. Give your answer to two decimal places. (3)
5.2 The semi-circular part of roof covers a large balcony. Calculate the area under the semi-circular part of the roof. Give your answer to two decimal places. (3)

©Via Afrika Publishers » Mathematical Literacy Grade 10 99
Section 1
Practice Exercises
Thinking Levels
Question Working Marks Criteria TL1 TL2 TL3 TL4
1.1.1 800 g ÷ 1 000 = 0,8kg 2 1 mark: conversion 1 mark: answer 2
1.1.23c × 0,8 kg = 2,4c per newspaper R0,024 per newspaper
2 1 mark: × 0,8kg 1 mark: answer in Rands 2
1.1.3
Total newspapers = 600 × 5 × 4 = 12 000 Total money = 12 000 × R0,024 = R288/month
4
1 mark: method for total newspapers 1 mark: total newspapers 1 mark: x rate 1 mark: total (in rands)
4
1.1.4 Some newspapers are larger than others (more pages) 1 1 mark: reasonable
answer 1
1.2.1 10 mm = 1 cm, therefore 15 cm = 150 mm 2 1 mark: conversion
1 mark: answer 2
1.2.2Total boxes = 150 mm ÷ 8 mm = 18,75 boxes Therefore max. no of boxes = 18
31 mark: method 1 mark: answer 1 mark: rounded answer
3
1.2.3
1 m = 100 cm, therefore 1,2 m = 120c m Total bundles = 120 cm ÷ 15 cm = 8 bundles
3
1 mark: conversion for m to cm 1 mark: method for no of bundles 1 mark: no of bundles (CA)
3
1.3.1 1 ℓ = 1 000 mℓ, therefore 200 ℓ = 200 000 mℓ
2 1 mark: conversion 1 mark: answer 2
1.3.2
1 mℓ weighs 0,828 g, 200 000 mℓ weighs 165 600 g1 000g = 1 kg, therefore 165 600 g = 165,6 kg
3
1 mark: conversion method 1 mark: total grams 1 mark: converted to kg
3
Question 1: 22
Answers to questions

©Via Afrika Publishers » Mathematical Literacy Grade 10 100
Section 1
Answers to questions
Thinking Levels
Question Working Marks Criteria TL1 TL2 TL3 TL4
2.1 07:35 1 1 mark: answer 1
2.2 It does not stop there. 1 1 mark: answer 1
2.3That train does not go to Cape Town. Instead, it stops in Bellville.
1 1 mark: answer 1
2.4 07:00 1 1 mark: answer 1
2.5 The train might be full, etc. 1 1 mark: reasonable answer 1
2.6 7:35 – 6:49 = 46 minutes 21 mark: both times correct 1 mark: answer (CA)
2
2.7
8:00 – 7:19 = 41 minutes Train no. 3510 takes a different route and stops at fewer stations than train no. 3508.
3
1 mark: both times correct 1 mark: answer (CA) 1 mark: reasonable answer
2 1
2.8
The train leaving at 07:12 does not go to Salt River, so the passenger will have to change at Bellville. The earliest train going to Salt River will leave at 07:20 from Bellville. However, it will be very difficult to change trains in such a short time. He should try the next train.
2
1 mark: recognise that the 7:12 does not go to Salt River 1 mark: solves the problem
2
2.9.1 Time = 7:35 – 5:55 = 1:40 1 hr 40 mins = 100 minutes 3
1 mark: both times correct 1 mark: answer (CA) 1 mark: convert to minutes
3
2.9.2 100 ÷ 60 = 1,66666 hours 2 1 mark: method 1 mark: answer 2
2.9.3Average speed = 72 km ÷ 1,6666 hrs = 43,2 km/h
2 1 mark: method 1 mark: answer 2
Question 2: 19
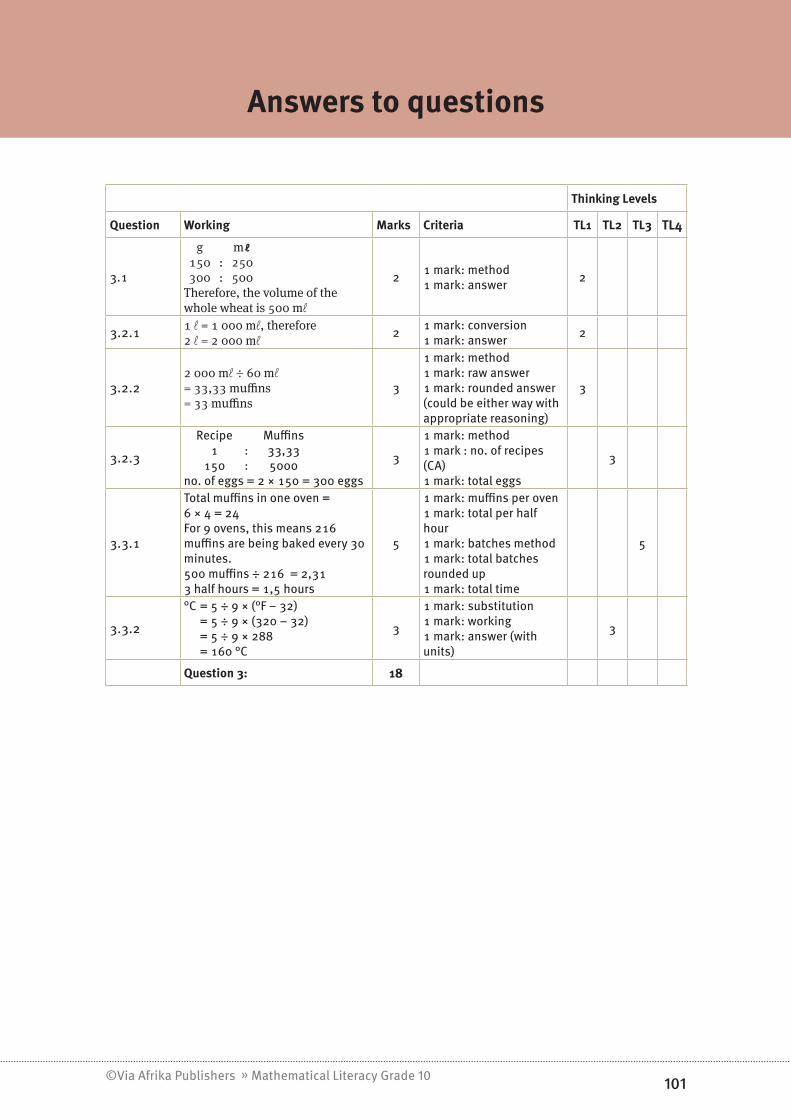
©Via Afrika Publishers » Mathematical Literacy Grade 10 101
Section 1
Answers to questions
Thinking Levels
Question Working Marks Criteria TL1 TL2 TL3 TL4
3.1
g mℓ 150 : 250 300 : 500 Therefore, the volume of the whole wheat is 500 mℓ
2 1 mark: method 1 mark: answer 2
3.2.1 1 ℓ = 1 000 mℓ, therefore2 ℓ = 2 000 mℓ
2 1 mark: conversion 1 mark: answer 2
3.2.22 000 mℓ ÷ 60 mℓ = 33,33 muffins = 33 muffins
3
1 mark: method 1 mark: raw answer 1 mark: rounded answer (could be either way with appropriate reasoning)
3
3.2.3
Recipe Muffins 1 : 33,33 150 : 5000no. of eggs = 2 × 150 = 300 eggs
3
1 mark: method 1 mark : no. of recipes (CA) 1 mark: total eggs
3
3.3.1
Total muffins in one oven = 6 × 4 = 24 For 9 ovens, this means 216 muffins are being baked every 30 minutes. 500 muffins ÷ 216 = 2,31 3 half hours = 1,5 hours
5
1 mark: muffins per oven 1 mark: total per half hour 1 mark: batches method 1 mark: total batches rounded up 1 mark: total time
5
3.3.2
°C = 5 ÷ 9 × (°F – 32) = 5 ÷ 9 × (320 – 32) = 5 ÷ 9 × 288 = 160 °C
3
1 mark: substitution 1 mark: working 1 mark: answer (with units)
3
Question 3: 18

©Via Afrika Publishers » Mathematical Literacy Grade 10 102
Section 1
Answers to questions
Thinking Levels
Question Working Marks Criteria TL1 TL2 TL3 TL4
4.1Area = π × r2
= (3,142) × (1,8 m)2
= 10,2 m23
1 mark: substitution 1 mark: working 1 mark: answer (with units)
3
4.2
Area = 1 __ 2 b × h = 0,5 × 6 m × 4,5 m (we use the two measurements that are at right angles to each other) = 13,5 m2
3
1 mark: substitution 1 mark: working 1 mark: answer (with units)
3
4.3
Area = side2
2,25 m2 = side2
1,5 m = side (we find the square root)
21 mark: substitution 1 mark: answer (with units)
2
4.4
Total area = l × b = 13 m × 22 m = 286 m2
Green area = total area – area of shapes = 286 m2 – (10,2 m2 + 13,5 m2 +
2,25 m2)= 286 m2 – (25,95 m2)= 260,1 m2
5
1 mark: substitution for total area 1 mark: answer for total area 1 mark: method for remaining area 1 mark: correct substitution of areas 1 mark: final answer (with units)
5
Question 4: 13
Thinking Levels
Question Working Marks Criteria TL1 TL2 TL3 TL4
5.1.1
Also 26 m. The building is symmetrical and so the length on the left is the same as the length on the right.
21 mark: 26 m 1 mark: reasonable reasoning
1 1
5.1.2
Edge of semi-circle = 1 __ 2 × π × Diameter= 0,5 × 3,142 × 17 = 26,71m
3
1 mark: correct formula 1 mark: correct substitution 1 mark: answer (with correct units)
3
5.1.3
Total length = 2 front + 2 sides + curved + 3 back horizontal + 2 back vertical = 2 × 17 m + 2 × 26 m + 26,71 m + 3 × 17 m + 2 × 12 m = 187,71 m
3
1 mark: adding all lengths 1 mark: at least 6 lengths present and correct 1 mark: Correct final answer (CA)
3
5.2
Area of semi-circle = 1 __ 2 × π × r2
= 0,5 × 3,142 × (8,5)2
= 113,50 m2
3
1 mark: correct formula 1 mark: correct substitution 1 mark: answer (with correct units)
3
Question 5: 11

©Via Afrika Publishers » Mathematical Literacy Grade 10 103
Section 1
Maps, plans and other representations of the physical world
Chapter 5
Overview
Maps, plans and other
representations of the
physical world
CHAPTER 5 Page 103
Maps
• Relative position on a layout map
• Following and developing directions
• Number scale
• Bar scale Scale
SECTION 2 Page 109
SECTION 1 Page 104
Layout plans (floor
plans)
SECTION 3 Page 112

©Via Afrika Publishers » Mathematical Literacy Grade 10 104
Section 1Section 1
Maps
You need to be able to work with the following layout maps:
●● seating plan and/or layout for a classroom●● layout of buildings and/or sports fields at a school●● layout of the stores in a shopping centre●● seating plans for cinemas and/or sports fields.
Working with these maps, you need to be able to:●● describe the position of an object in relation to surrounding objects●● describe the position of a building in relation to surrounding buildings●● find locations, follow directions and develop directions for travelling between two
or more locations●● estimate distances using measurement and a given scale.
Figure 9 Map of South Africa
A map is a picture that shows a shrunken image of an area of land; for example, the map above shows a picture of the whole of South Africa. A map always shows the image as seen from above, that is, as seen from the sky.
Examples of types of maps:●● street maps, showing the names and positions of the streets ●● road maps, which show the national roads of a country, including directions to
travel from one city to the next●● layout maps, showing the layout of a country, including the different provinces and
the surrounding countries ●● layout maps, showing the position of buildings, entrances and exits and other
features of a venue.

©Via Afrika Publishers » Mathematical Literacy Grade 10 105
Section 1
Relative position on a layout mapWhen working with layout maps you must be able to describe the position or location of a building or venue in relation to surrounding buildings or venues. This is known as describing the “relative position” of the object.
When describing the position of an object, venue or building in relation to other objects, we commonly use the words:next to right hand side above next door to/fromin between left hand side behind directly across from
ExampleConsider the layout map of the grounds for a school (Map 1).
m 25m 50m
http://www.covenant.nsw.edu.au/contact-groundsmap.html
Using Map 1 (above), answer the following questions:
1 How many classrooms are there for the Year 7 (Yr 7) students?2 Which Year groups have classrooms near the Art room?3 If someone drives into the car park, explain to them how got get to the
basketball court.
Answers1 3 classrooms (They are located in the lower right hand corner of the map)2 Years 5 & 6 have classrooms near the Art room (near the middle of the map)

©Via Afrika Publishers » Mathematical Literacy Grade 10 106
Section 1
3 Any reasonable set of instructions, for example: There is a set of stairs in the corner of the car park. Go up the stairs. Walk under the triangular shade netting and through the gap between two
classroom blocks. Walk straight towards the large building in front of you. This is the hall and the
basketball court is next to it.
Following and developing directionsPeople often need to travel to places that they have never been to before. They may have to rely on “directions”, which explain the routes they have to follow to reach their destination.
Directions are a set of written or verbal instructions that explain how to travel from one place to another.
How to follow and give directionsDirections will commonly make use of two different types of referencing systems or tools to describe a travel route:
●● directional indicators such as “left”, “right”, “along”, “up”, “down”, “backwards”, and “forwards”.
●● street names and numbers, such as no. 10 Hussein Street and no. 75 Crescent Drive●● landmarks (e.g. “dirt road”) ●● a sense of distance (e.g. “continue until you get to another intersection”).
Example A visitor to the school uses the layout map of the school (Map 1) and the following set of directions to try to find a location on the school grounds. What is that location?
As you enter the main entrance of the school, turn immediately to your right (do not enter the car park).
Drive straight for about 80 meters until you see a ramp to your left. Drive up the ramp.
Park directly in front of the large building in front of you.
Walk towards the left of the large building and you will see a smaller separate building directly in front of you. Go half way around this building and you will see the entrance to the … directly in front of you.
Answer:The directions took the person to the library.

©Via Afrika Publishers » Mathematical Literacy Grade 10 107
Section 1
Stadium or cinema seating plan
http://www.theatreroyalwakefield.co.uk/_images/maps/mps_seatingplan.jpg
Answer the following questions with reference to the above theatre seating plan:1 Which is closer to the stage: Dress circle or Stalls?2 Some of the seats do not have numbers on them. They are instead marked with a
“W” and are located on the ground floor in the stalls. What are they used for?3 Tickets will firstly state which area you are in and then the seat number (e.g. UC-B17,
which means “Upper Circle seat B17”). Give the full seat numbers of the circled seats in the seating plan.
4 Sometimes celebrities come to watch a stage performance and they will sit in one of the two boxes. It can be quite exciting to sit in front of a celebrity. Which seats should you pick if you wanted to sit directly in front of the boxes?

©Via Afrika Publishers » Mathematical Literacy Grade 10 108
Section 1
Answers:1 Stalls2 Wheelchairs (They are on the ground floor so that patrons do not need to use the
stairs)3 S-H9, DC-C5, UC-C234 DC-B5 to 8; DC-B30 to 33

©Via Afrika Publishers » Mathematical Literacy Grade 10 109
Section 1
Scale
Section 2
The “scale” of a map describes how many times smaller an object shown on a map or plan is than its actual size; or how many times bigger the actual size of the object is compared to the picture of the object shown on the map or plan.
There are two main scales that we work with on maps, namely number scales and bar scales.
Number scale ●● A number scale is written in ratio format, for example 1 : 200. This means the picture
on the map or plan is 200 times smaller than the actual size of the object.●● No units (mm, cm, etc.) are included on the number scale because the relationship
in size between the original and the scaled objects remains the same. This means that every 1 mm measured on the map or plan is equal to 200 mm in actual length, or every 1 cm on the plan is equal to 200 cm in actual length.
Estimating distance using number scalesScales are included on maps to give a person using the map a means for estimating distances on the map.
ExampleSuppose a map of a school has been drawn on the scale 1 : 1500.
If you measure 12,5 cm on the map, how far will this be in actual distance in the school?
Answer:According to the scale, every length on the map is 1 500 times smaller than its actual length.The length measured on the map = 12,5 cm.The actual length = 1 500 times bigger than measured length = (12,5 × 1 500) cm = 18 750 cm = 187,50 m (we convert to metres).
Disadvantage of a number scaleIf the size of the map is changed (for example, through photocopying), then the scale of the map is no longer accurate. For this reason, some maps contain a bar scale.

©Via Afrika Publishers » Mathematical Literacy Grade 10 110
Section 1Section 2
Bar scale A bar scale is a picture that shows how far an actual distance will be when we take some measurements on a map.
In the diagram alongside, 3 cm measured on the bar scale represents 1 km in actual distance (or 1,5 cm represents 500 m in actual distance).
Units are included on a bar scale.
Estimating distance using a bar scaleExample Suppose the following scale was given with Map 1:
According to the measurement on the bar scale: ●● 25 mm (2,5 cm) measured on the map = 50 m
in actual distance.or:
●● 12,5 mm (1,25 cm) on the map = 25 m actual distance.
So, 2,5 cm measured on the map = 50 m in actual distance.Therefore 1 cm measured on the map = (50 ÷ 2,5) m actual distance = 20 m in actual distance.Every 1 cm measured on the map is thus approximately 60 m in actual distance.
ExampleIf we wanted to find out the width of the basketball court (the shortest side) according to the map, we would first measure the width on the map. The width on the map along the short side of the basketball court is approximately 9 mm.
According to the bar scale: 25 mm on map = 50 m actual distance.
So 9 mm measured on map = (50 m × 9 ÷ 25) in actual distance.
Actual distance = 18 m.
The advantage and disadvantage of a bar scaleAdvantage: if the size of the map/plan is changed, then the picture of the bar scale will change in the same proportion and so the scale will still be accurate.
Disadvantage: it requires more work than a number scale: i.e. you first have to determine the relationship between a length measured on the bar and actual distance before you can use the scale to estimate actual distances on the map.
0 m
500 m
1 km
0 m 25 m 50 m
0 m 25 m 50 m

©Via Afrika Publishers » Mathematical Literacy Grade 10 111
Section 1Section 2
Exercises:1. If the scale on a map shows that it is 1 : 50 000, then how far is a measured length (on
the map) of 43 cm in actual distance? (Answer in km if 1 km = 100 000 cm)
2. Using the bar scale below, what is the actual distance for a measurement of 23,8 cm on a map that uses this bar scale?
1k m 0k m
Answers1 1 cm on the map is 50 000 cm in real life. Therefore the actual distance = 43 cm × 50 000 = 2 150 000 cm 1 km = 100 000 cm, therefore actual distance = 2 150 000 ÷ 100 000 = 21,5 km.
2 According to the bar scale: 4 cm = 1 km. Therefore the actual distance = 23,8 ÷ 4 × 1 km = 5,95 km.

©Via Afrika Publishers » Mathematical Literacy Grade 10 112
Section 1
Layout plans (floor plans)
Section 3
You need to be able to work with layout plans showing a top view, that is, floor plans, of a familiar structure, for example, a classroom or a room in a house.
While working with floor plans, you need to be able to:
●● understand the symbols and notation used on plans●● describe what is being shown on the plan●● analyse the layout and suggest alternative layout options●● determine actual lengths of objects shown on the plan using measurement and a
given scale (number or bar scale)●● determine quantities of materials needed by using the plans together with perimeter
and area.
ExerciseThe picture below shows the layout plan for a house. This plan was drawn when the house was built.
0 m 1 m 2 m
1 How many rooms are in the house?
2 What is the section called that runs right through the house?
3 How many entrances are there into this house? Describe where these entrances are.
4 How many windows are there in this house?

©Via Afrika Publishers » Mathematical Literacy Grade 10 113
Section 1Section 3
5 How many interior doors are there in this house?
6 Which bedroom do you think a child sleeps in and which room would an adult sleep in?
Give reasons for your answers.
7 Write down labels/descriptions for each of the objects shown in the bathroom.
8 Write down possible descriptions for each of the objects shown in the lounge.
9 Do you think this house is well designed? Give a reason for your answer.
10 Use the given bar-scale to determine the dimensions of the house to the nearest meter.
Answers:1 5 rooms (lounge, kitchen, bathroom and two bedrooms)2 The passage3 2 entrances. At the front (entry into the passage) and at the kitchen.4 6 windows5 5 doors6 A child will sleep in the smaller bedroom and an adult in the larger bedroom. Adults
usually have more clothes and shoes and other personal belongings than children, and therefore need more space.
7 Bath, toilet and wash basin.8 Couch, chair, TV set, flower decoration, dining table and three chairs.9 No. There is no window in the smaller room, the door from the passage to the lounge
should be between the sitting area and the dining area and not so close to the table (in fact, there need not be a wall between the passage and the lounge), and space is wasted at the end of the passage.
10 1,8 cm = 2 m on the bar scale. Length of house on plan = 8,6 cm. Actual length = 2 m × 8,6 ÷ 1,8 ≈ 10 m
Width of house on plan = 6,5 cm. Actual width = 2 m × 6,5 ÷ 1,8 ≈ 7 m

©Via Afrika Publishers » Mathematical Literacy Grade 10 114
Section 1
Practice Exercises
Question 1: The school map 14 marksThe map below is for a Santa Monica High School in California, USA. Use it to answer the questions which follow:
http://www.smmusd.org/samohi/About/campus.htm
1.1 Write down the names of the 4 streets that are on the borders of the school. (2)1.2 How many gyms does the school have? (1)1.3 How many tennis courts does the school have? (1)1.4 Barnum Hall is next to which teaching department in the school? (1)1.5 Which sports field is nearest to the Science department? (1)1.6 Write down a set of directions that will take someone from the baseball field to
the softball field. (2)
North

©Via Afrika Publishers » Mathematical Literacy Grade 10 115
Section 1
Practice Exercises
1.7 Someone looks at the map and guesses that the scale is approximately 1 : 1000. Let us check to see if they are correct:1.7.1 Measure the straight portion of the athletics track (marked with a dotted
line) in cm. (1)1.7.2 Use the scale of 1 : 1000 to convert your measurement in question 1.7.1 to
a real-life measurement. (Answer in cm.) (2)1.7.3 Convert your answer from question 1.7.2 to metres. (2)1.7.4 Was the person’s estimate of the scale correct? Give a reason for your answer. (1)
Question 2: House Plan 13 marks
Lounge/Dining Room
Study
Kitchen
Spare Bedroom
MainBedroom
Bathroom
Outsidewidth:
800
length
420
330
Ke y:
: W indow
: Door .
Above is the floor plan of a house with some measurements shown (all measurements are in cm).
2.1 How many bedrooms does the house have? (1)
2.2 How many windows does the house have? (1)
2.3 What is the total width of the house (when measured from the outside)? Express your answer in metres. (2)
2.4 Looking at the Kitchen and the Study, their width measurements do not add up to the width of the house. Give a reason for this. (1)
2.5 To avoid a fire risk, every house should have two entrance/exits to the outside. Besides the front door (near the study), which room also has an entrance/exit to the outside? (1)

©Via Afrika Publishers » Mathematical Literacy Grade 10 116
Section 1
Practice Exercises
2.6 There is no door between the study and the lounge. Is this a good idea? Give a reason for your answer. (1)
2.7 A person is sitting in the lounge/dining room of the house and they need to go to the bathroom. Write down a set of directions to get from the lounge/dining room to the bathroom. (2)
2.8 Use measurements and the bar scale at the bottom right hand corner of the plan to calculate the length of the Main Bedroom. (4)
Question 3: The Bucket Loader 11 marks
The picture below shows the operator of a bucket loader standing next to his machine. They are to scale. The operator in the picture is 1,7m tall.
Height of the bucket loader
1,7m
3.1 Using your ruler, measure the height of the operator (answer in mm). (1)3.2 Using your ruler, measure the height of the bucket loader (the big machine)
(answer in mm). (1)3.3 Using your answers from questions 3.1 and 3.2 and the man’s height of 1,7m,
work out the real height of the bucket loader. (2)3.4 Using the same method as the previous questions, work out the diameter of
one of the wheels (marked with the white arrows). (3)3.5 Using your answer from question 3.4, calculate the circumference of the tyre.
Circumference = π × diameter (2)3.6 Use your answer from question 3.5 to answer this question: How far will the bucket loader have driven if the wheels have turned 30 times? (2)

©Via Afrika Publishers » Mathematical Literacy Grade 10 117
Section 1
Practice Exercises
Question 4: Scale calculations 15 marks
4.1 Using a scale of 1 : 200, calculate:4.1.1 the real-life measurement if the measurement on the map was 8,2 cm
(answer in cm) (2)4.1.2 a real-life measurement if the measurement on the map was 15 cm (answer in m) (3)4.1.3 a measurement on the map if the real-life measurement was 1 400 cm
(answer in cm). (2)4.2 A topographical map uses a scale of 1 : 50 000.
4.2.1 Explain what a scale of “1 : 50 000” means. (1)4.2.2 Convert 4 km into cm. (2)4.2.3 Use the scale to work out what the distance in question 4.2.2 will be on a
topographical map. (Answer in cm). (2)4.2.4 How many km in real life will a measurement of 17 cm on a topographical
map be equal to? (3)
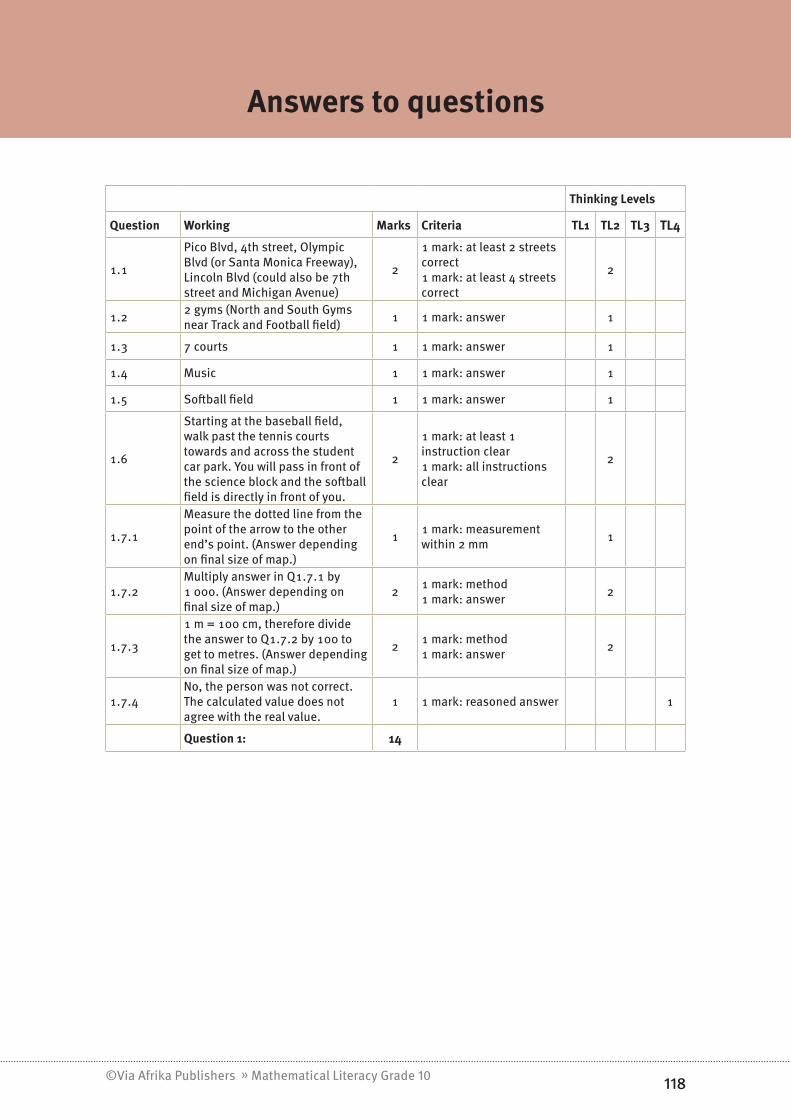
©Via Afrika Publishers » Mathematical Literacy Grade 10 118
Section 1
Practice Exercises
Thinking Levels
Question Working Marks Criteria TL1 TL2 TL3 TL4
1.1
Pico Blvd, 4th street, Olympic Blvd (or Santa Monica Freeway), Lincoln Blvd (could also be 7th street and Michigan Avenue)
2
1 mark: at least 2 streets correct 1 mark: at least 4 streets correct
2
1.2 2 gyms (North and South Gyms near Track and Football field) 1 1 mark: answer 1
1.3 7 courts 1 1 mark: answer 1
1.4 Music 1 1 mark: answer 1
1.5 Softball field 1 1 mark: answer 1
1.6
Starting at the baseball field, walk past the tennis courts towards and across the student car park. You will pass in front of the science block and the softball field is directly in front of you.
2
1 mark: at least 1 instruction clear 1 mark: all instructions clear
2
1.7.1
Measure the dotted line from the point of the arrow to the other end’s point. (Answer depending on final size of map.)
1 1 mark: measurement within 2 mm 1
1.7.2Multiply answer in Q1.7.1 by 1 000. (Answer depending on final size of map.)
2 1 mark: method 1 mark: answer 2
1.7.3
1 m = 100 cm, therefore divide the answer to Q1.7.2 by 100 to get to metres. (Answer depending on final size of map.)
2 1 mark: method 1 mark: answer 2
1.7.4No, the person was not correct. The calculated value does not agree with the real value.
1 1 mark: reasoned answer 1
Question 1: 14
Answers to questions

©Via Afrika Publishers » Mathematical Literacy Grade 10 119
Section 1
Answers to questions
Thinking Levels
Question Working Marks Criteria TL1 TL2 TL3 TL4
2.1 2 1 1 mark: answer 1
2.2 6 1 1 mark: answer 1
2.3 800 cm = 8 m 21 mark: measurement 1 mark: conversion correct
2
2.4 The wall also has thickness 1 1 mark: answer 1
2.5 The lounge/dining room 1 1 mark: answer 1
2.6 Answer with valid reasoning 1 1 mark: reasoning 1
2.7Go through the kitchen, down the passage and it is the last door on your right.
2
1 mark: at least one part of the directions correct 1 mark: clear and complete directions
2
2.8
Measure on the map = approx. 5 cm Measure bar scale: 3 cm = 4 m Real length: 5 cm = 4 m x 5 / 3 = 6,7 m
4
1 mark: measure on map correct (within 2mm) 1 mark: measure on bar scale correct (within 2mm) 1 mark: method 1 mark: answer
4
Question 2: 13

©Via Afrika Publishers » Mathematical Literacy Grade 10 120
Section 1
Answers to questions
Thinking Levels
Question Working Marks Criteria TL1 TL2 TL3 TL4
3.1
Measure the length of the man at the arrows measuring from the tip of the end arrow to the tip of the other end arrow. (Answer depending on final size of the drawing.)
1 1 mark: answer 1
3.2
Measure the height of the machine at the arrows measuring from the tip of the end arrow to the tip of the other end arrow.(Answer depending on final size of the drawing.)
1 1 mark: answer 1
3.3
1,7 m ÷ man’s measurement x machine’s measure (Answer depending on final size of drawing.)
2 1 mark: method 1 mark: answer 2
3.4
Measure tyre diameter in picture, then perform the calculation: 1,7 m ÷ man’s measurement x tyre’s measure (Answer depending on final size of drawing.)
3
1 mark: tyre measurement 1 mark: method 1 mark: answer
3
3.5Circumference = 3,142 x (answer to Q3.4)(Answer depending on final size of drawing.)
2 1 mark: substitution 1 mark: answer 2
3.6
30 x (answer to question 3.4) This is the answer because the rear wheel will roll as the machine moves and the tyre’s circumference will roll out the same distance as the machine moves. (Answer depending on final size of drawing.)
2 1 mark: method 1 mark: answer 2
Question 3: 11

©Via Afrika Publishers » Mathematical Literacy Grade 10 121
Section 1
Answers to questions
Thinking Levels
Question Working Marks Criteria TL1 TL2 TL3 TL4
4.1.1 8,2 cm × 200 = 1 640 cm 2 1 mark: method 1 mark: answer 2
4.1.2 15 cm × 200 = 3 000 cm 3 000 cm ÷ 100 = 30 m 3
1 mark: scale method 1 mark: cm answer 1 mark: conversion to m
3
4.1.3 1 400 cm ÷ 200 = 7 cm 2 1 mark: method 1 mark: answer 2
4.2.1
1 unit on the map is 50 000 units in real life (so if I measure 1 cm on the map, it represents 50 000 cm in real life)
1 1 mark: answer 1
4.2.2 1 km = 100 000 cm so,4 km = 400 000 cm 2 1 mark: conversion
1 mark: answer in cm 2
4.2.3 400 000 cm ÷ 50 000 = 8 cm 2 1 mark: method 1 mark: answer 2
4.2.4
17 cm x 50 000 = 850 000 cm (in real life) to km: 850 000 ÷ 100 000 = 8,5 km
31 mark: scale method 1 mark: cm answer 1 mark: conversion to m
3
Question 4: 15

©Via Afrika Publishers » Mathematical Literacy Grade 10 122
Section 1
Data handling
Chapter 6
Overview
Data handling
CHAPTER 6 Page 122
∙ Numerical data
• Categorical data
• Populations and samples
• Data collection instruments
o Questionnaires
o Interviews
o Observations
• Sorting and arranging data
• Frequency tables and tallies
• Grouping data: class intervals
• Bar graphs
• Pie charts
• Line and broken-line graphs
• Histograms
• Measures of central tendency
o Mean
o Median
o Mode
• Measures of spread
o Range
Types of data
SECTION 2 Page 124
Developing questions
SECTION 3 Page 125
Collecting data
Organising data
Displaying data
Summarising data
SECTION 4 Page 126
SECTION 5 Page 130
SECTION 6 Page 133
SECTION 7 Page 135
The statistical cycle
SECTION 1 Page 121

©Via Afrika Publishers » Mathematical Literacy Grade 10 123
Section 1Section 1
The statistical cycle
We collect information (called “data”) to answer questions that arise in our daily lives, such as:
●● What is the class average for a test?●● How many children in our school use Mxit?●● What is the number of homes in our community that has running water?●● What is the most popular colour for cars?●● What is the average height of learners in my class?
The process of collecting, organising and analysing data in order to make conclusions is called the statistical process. The various stages involved in this statistical process are shown below.
Posequestions/problems
1
Collect data• Populations and samples• Data collection tools,
questionnaire, survey, recording sheets
23Summarise data• Measures of central tendency
(mean, median, mode)• Measures of spread (range)
5Organise data• Sort data• Frequency tables and tallies
Represent data• Pie charts• Histograms• Bar graphs• Line graphs
4
Analyse and interpret data
The stage “analyse and interpret data” has been included in the middle of the diagram to show that this stage occurs at every point in the statistical cycle.
In Grade 10, you will be required to apply the statistical cycle to single sets of data.
©Via Afrika Publishers » Mathematical Literacy Grade 10 124
Section 1
Types of data
Section 2
There are two types of data; numerical and categorical.
Numerical dataThe items in this type of data are numbers.
Examples are:●● the marks obtained by learners in a test, or ●● the number of cars sold over 6 months.
Numerical data can be subdivided into continuous numerical data and discrete numerical data.
Continuous numerical data is obtained from measurements. These include decimal values or fractional values. For example, the height of a learner in a class (e.g. 1,22 m), the weight of a baby born on a particular day (e.g. 3,56 kg).Discrete numerical data can only be fixed whole numbers. For example,the number of people in a household or the shoe sizes of learners in a class.
Categorical dataThe items in this type of data are not numbers.
Examples could include:●● favourite car colours (e.g. white, black, silver), or●● different modes of transport (e.g. train, bus, car, taxi, bicycle).

©Via Afrika Publishers » Mathematical Literacy Grade 10 125
Section 1
Developing questions
Section 3
The first step in every statistical process is to pose a question. The question that you pose will determine the type of data that you need to collect and the way in which the data must be collected, organised and represented.
ExampleThe ages (in years) of the teachers in Morningside High School are as follows:
1 34, 58, 28, 36, 44, 29, 51, 36, 49, 54, 43, 59, 45, 37, 29, 48, 57, 29, 35, 43, 53, 47, 31
We could ask the following questions about the teachers’ ages:●● What is the youngest age?●● What is the oldest age?●● What is the age difference between the oldest and the youngest teacher?●● What is the average (or mean) age?
Exercise: The statistical cycle1. In each case, state whether the data is numerical or categorical. If you think it is
numerical, then say whether it is continuous or discrete.
a. The favourite brand of learner cell phone.
b. The time spent listening to music on a cell phone in a day.
c. The number of text messages sent by learners in a day.
Answers1. a. Categorical data (the data involves descriptions in words and not numbers.)
b. Continuous numerical data (although most respondents will report their answer to this question in hours, it can be reported in minutes or even seconds, so it can be split up into several smaller packages – continuous data.)
c. Discrete numerical data (you can only send a whole number of text messages, so the numerical data cannot be split into smaller sub-divisions.)

©Via Afrika Publishers » Mathematical Literacy Grade 10 126
Section 1
Collecting data
Section 4
Populations and samplesData may be obtained from a number of sources, including people, animals, plants, databases, etc. When collecting data from any of these sources we need to distinguish between the population and the sample.
The population is the entire group about which data is being collected.In the example of the teachers’ ages above, the population will be all the teachers in the school.
If a population is very large, it is often costly, impractical, and sometimes impossible to collect data from the entire population. Rather, a collection of people are chosen from this population to represent the population. This collection is called the sample.
It is important that the sample represents the population. For example, if you select a sample of teachers to determine their ages, the sample could not only be the female teachers, or the Grade 8 and 9 teachers.
To ensure that a sample selected is representative of the population:●● the sample must reflect the same features and characteristics of the population. ●● the sample chosen must be large enough.
If a sample is not accurately representative of the population, then that sample will provide a skewed or biased impression of the features or characteristics of the population.
ExampleSuppose data is to be collected on smoking among high school learners at a school. The population of the data is all the learners in the school.A representative sample of this population will have to include:
●● both female and male students●● students from every grade in the school●● students from all the different racial backgrounds in the school●● correct proportions in relation to the whole population, i.e. if the school consists
primarily of black students then interviewing mostly white students will result in a skewed impression of the population.
The sample will also need to be big enough so that the information that is gathered is reliable and can be applied to the larger population. For example, in a school of 1 000 students, a sample of 150 or 200 students should be a big enough sample.

©Via Afrika Publishers » Mathematical Literacy Grade 10 127
Section 1Section 4
Exercise
The following game count was taken in one camp in the Kruger National Park over the course of one day:
Type of animal CountElephant 240Lion 30Red buck 500Rhino 12Water buffalo 130
1 This is a sample of a population. What is the population that it represents?2 Is this a representative sample of the animal population of the Kruger National Park?
Give at least 2 reasons for your answer.
Answers
1 The population would be the animals in the Kruger National Park, but it could also simply be the animal population in that camp in the park.
2 No, it is not. This is one camp in the Kruger National Park and a much broader survey would need to be done (e.g. there are cheetahs in the park, but none appeared on the survey). Also, this was taken over one day and the animal movement in one day is vast in the national park. A longer survey would be required.
Data collection instrumentsWe can use questionnaires, interviews and observations to collect data from our sample or population.
1 QuestionnairesA questionnaire contains a list of questions given to a group of people to gather information about the group, or about the opinions of the group.
Here is an example of a questionnaire given to learners in a school, to find out more about learners and their favourite sport.

©Via Afrika Publishers » Mathematical Literacy Grade 10 128
Section 1Section 4
WHICH SPORT DO YOU PREFER? Place a ü in the appropriate block.
1. What is your gender?
¨ male ¨ female
2. How old are you?
¨ under 10 ¨ 10 – 20
¨ 21 – 30 ¨ 31 – 50
¨ over 50
3. Which of the following sports do you watch on TV?
¨ soccer ¨ rugby ¨ hockey ¨ boxing
4. If you had to choose only one sport to watch, which one would it be?
¨ soccer ¨ rugby ¨ hockey ¨ boxing
5. Do you think your favourite sport gets enough viewing time on TV?
¨ Yes ¨ No
6. Please explain your answer to question 5.
....................................................................................................................
....................................................................................................................
....................................................................................................................
Note the following about the questionnaire:●● Questions 1 to 5 contains only “choice” questions where learners have to tick the
most appropriate option from a list of given choices. These types of “choice” questions limit the answers that the person filling out the questionnaire can provide and direct their answers in a particular direction. These types of questions make it easier to fill out the questionnaire in a short period of time, as well as to analyse and interpret the data later in the statistical cycle.

©Via Afrika Publishers » Mathematical Literacy Grade 10 129
Section 1Section 4
●● Question 6 is an open-ended question where an opinion is asked. These types of questions take longer to answer and are more difficult to analyse and interpret later in the statistical cycle.
When designing questionnaires, it is essential that the questions are clear, easy to understand and answer, and will provide the information that is needed.
2 InterviewsWe can also collect information by interviewing people. This usually takes much longer than completing questionnaires.
3 ObservationsWe can also gather information by observing events or people. A recording sheet can be used to record how often a particular event occurs, how much time different events take, or the particular features of different events.

©Via Afrika Publishers » Mathematical Literacy Grade 10 130
Section 1
Organising Data
Section 5
The next stage in the statistical cycle involves organising collected data into a more manageable form. This involves sorting, categories, tables and tallies.
Sorting and arranging dataTo “sort” data means to put the data in a particular order.
●● Categorical data can be sorted into categories such as males/females, fruit/vegetables, or in alphabetical order from A to Z and/or Z to A.
●● Numerical data can be arranged in ascending order (from the smallest value to the largest) or in descending order (from the largest value to the smallest).
Example:Here are the ages (in years) of the teachers at Morningside High School:34, 58, 28, 36, 44, 29, 51, 36, 49, 54, 43, 59, 45, 37, 29, 48, 57, 29, 35, 43, 53, 47, 31
We can sort them from low to high (youngest to oldest):28, 29, 29, 29, 31, 34, 35, 36, 36, 37, 43, 43, 44, 45, 47, 48, 49, 51, 53, 54, 57, 58, 59
Frequency tables and talliesOnce data has been sorted, we organise the sorted data into frequency tables.A frequency table shows a record of how often each value (or set of values) occurs in a set of data: i.e. the frequency of the values in the data.
We make use of tallies.to help us count the frequency of each value in a set of data.A frequency table of the teachers’ ages can look as follows:
Age Frequency Age Frequency28 1 44 129 3 45 130 0 46 031 1 47 132 0 48 133 0 49 134 1 50 035 1 51 136 2 52 037 1 53 138 0 54 139 0 55 040 0 56 041 0 57 142 0 58 143 2 59 1

©Via Afrika Publishers » Mathematical Literacy Grade 10 131
Section 1Section 5
Grouping data: class intervals It sometimes becomes impractical to construct a frequency table that includes every possible value, such as the ages of the teachers above. In such a case, we group the data by making use of class intervals to help us to organise the data more efficiently.
For example, we use the following class intervals for summarising the ages: 20–29 ; 30–39 ; 40–49 ; 50–59 ; 60–69
The interval “20-29” contains all possible ages from 20 years to 29,9 years, and the same principle applies for each of the marked intervals.
Example:Grouping the teachers’ ages into the class intervals suggested below, gives us the following frequency distribution table:
Age Frequency20 – 29 430 – 39 640 – 49 750 – 59 660 - 69 0
Analysing the grouped data ●● It is now easy to see that the age interval “40 to 49” has the highest frequency of 7
teachers. This suggests that most teachers in the school are between 40 and 49,9 years old.
●● The age interval “60 to 69” has a frequency of 0. This tells us that no teacher is between 60 and 69,9 years old.
Example:1. The following test results were achieved by a student:
56% 63% 45% 34% 78%
1.1 Should this data be sorted using a frequency table? Give a reason for your answer.
1.2 How could this data be sorted to enable a meaningful interpretation?
2. The following test results were achieved by a class of learners:
70% 50% 76% 75% 55% 84% 67% 67% 74% 63% 74% 70% 69% 78% 81% 47% 66%
2.1 Is it necessary to start the frequency table at 0%? Give a reason for your answer.
2.2 What is the highest grouping that your frequency table should go up to?
2.3 Draw up a frequency table with appropriate class intervals and summarise this information.

©Via Afrika Publishers » Mathematical Literacy Grade 10 132
Section 1Section 5
Answers:1.1 No. There is not enough information to sort into a frequency table with class
intervals.1.2 It could be arranged smallest to biggest so that the person could see the difference
between their lowest and highest mark.2.1 Not really. The lowest mark is 47%, so the lowest interval could simply start at 40%.
However, you could choose to start it at 0% for completeness.2.2 The frequency table could go up to 100% (as that would be the maximum for a test).
However, you could also take it up to 90% (as the highest mark is 84%). 2.3
Class Interval Tally Frequency40% to 49% | 150% to 59% || 260% to 69% |||| 570% to 79% |||| || 780% to 89% || 2
TOTAL 17

©Via Afrika Publishers » Mathematical Literacy Grade 10 133
Section 1Section 6
Displaying data
We often choose to draw graphs of organised data to provide us with visual pictures of the data in order to identify trends in the data.
We use the following types of graphs to display data:●● bar graphs●● pie charts●● histograms●● line and broken line graphs.
Bar graphsBar graphs are useful to show how often something occurs (in other words, the frequency) and for comparing frequencies between different categories. Bar graphs display data that contains discrete values: the gaps between bars indicate that each bar represents a separate category of data.
ExampleIn a survey conducted at a school to determine how learners travel to school, the following data was collected:
Means of transport Bus Car Foot BicycleNumber of people using this type of transport 24 6 18 12
We can draw the following bar graph to represent this data:
0Bus Car
Means of transport
Num
ber o
f pup
ils
How pupils travel to school
Foot Bicycle
10
20
30
Notice that each means of transport is represented on a different and separate bar and that there are gaps between each of the bars.

©Via Afrika Publishers » Mathematical Literacy Grade 10 134
Section 1Section 6
Analysing the data shown on the bar graphFrom the graph we can see that:
●● most learners (24 learners) travel to school by bus●● the smallest category of learners travel to school by car.
Pie chartsPie charts are useful in displaying data that shows the size of a part of a whole in relation to the larger whole and so assist us to make comparisons.
In Mathematical Literacy you do not have to be able to draw pie charts. However, you must be able to read values from a pie chart, explain how the size of each segment has been determined and interpret pie charts to explain trends.
ExampleIf the data on how learners travel to school is displayed using a pie chart, we would get the following:
Bus40%
24
18
12
6
Foot
Bicycle
Car
You need to be able to answer the following questions pertaining to this pie chart:a How many learners took part in the survey?b What percentage of learners travel by bus? And by bicycle?c How is the size of each segment (for example the segment showing “Bus”)
determined?
Solution:a Total number of learners in the survey = 6 + 24 + 18 + 12 = 60b Percentage of learners who travel by bus = 24
___ 60 × 100 ≈ 40% Percentage of learners who travel by bicycle = 12 ___ 60 × 100 ≈ 20%c A full circle contains 360° (degrees). So, the size of each sector will then be a certain percentage of the whole (i.e. of 360°):
% of the learners who travel by bus = 24 ___ 60 × 100 = 40%
So, size of the “Bus” sector (on the pie chart) = 40% × 360° = 144°
% of the learners who travel by bicycle = 12 ___ 60 × 100 ≈ 20% So, size of the “Bicycle” sector (on the pie chart) = 20% × 360° = 72°

©Via Afrika Publishers » Mathematical Literacy Grade 10 135
Section 1Section 6
Analysing the data shown on the pie chartAs in the case of the bar graph, we can see that:
●● the greatest number of learners (24 learners) travel to school by bus●● the lowest number of learners travel to school by car.
Line and broken-line graphs Both line and broken-line graphs are made up of a collection of points joined by lines.
Line graphA line graph shows a consistent trend in the data i.e. that the data is increasing (or decreasing) over a period of time.
The line graph to the right shows the electricity consumption in a household from March to September.
Broken-line graphA broken-line graph is used when there is no specific predictable trend in the data, but rather fluctuating changes.
The broken-line graph to the right shows the number of Grade 12 learners who studied Mathematics in the years 2004 to 2009.
In general, line and broken-line graphs can be used for both continuous and discrete data:●● for continuous data, solid lines are drawn between each of the points on the graph●● for discrete data, dotted lines are drawn between each of the points on the graph.
Analysinglineandbroken-linegraphstoidentify“trends”“Identifying a trend” in a set of data means trying to see if there are any patterns in the data. Sometimes drawing line or broken-line graphs helps us to see if there are any patterns that exist in the data.
Consider the line graph above showing the monthly water meter readings for a household from April to September:
●● According to the data shown in the graph, there is a general trend that the electricity increases as winter approaches, reaches a maximum during the winter, and then gradually decreases as summer approaches.
●● A sub-trend is that electricity consumption is fairly constant from April to July with only minor fluctuations (ups and downs) during that time.
●● There is a sudden increase in August, perhaps due to an especially cold spell.
0
763
644
781709
995
860
200
400
600
800
1000
1200Electricity consumption
MayApril June July August September
2500002003 2004 2005 2006 2007 2008 2009 2010
276000
303000
318000
348000
298821 290630
270000
280000
310000
330000
350000
370000Grade 12 Maths entrants

©Via Afrika Publishers » Mathematical Literacy Grade 10 136
Section 1Section 6
Histograms Histograms are different to bar graphs in that there are no gaps between the bars on a histogram. This is because histograms are used to represent data that has been grouped into class intervals, using continuous data.
Example Here is a breakdown of the half-year marks of a class of Grade 10 Mathematical Literacy learners:
Analysing the data shown on the histogramFrom the graph we can see that:
●● The greatest number of learners achieved a result of 70 to 79%. This means that they have done fairly well.
●● The majority of students in the class (9 out of 17 learners in total) achieved a result in excess of 70%, which is very good for a class.
●● Because the data is grouped, we cannot see how well any specific learner achieved or even if the results in the 70 – 79% group were in the high 70’s or at the lower end of the interval. So there could be a distortion in this picture.
Percentages
012345678
4030 50 60 70 80 90 100
Test results
Freq
uenc
y

©Via Afrika Publishers » Mathematical Literacy Grade 10 137
Section 1
Summarising data
Section 7
Measures of central tendencyA measure of central tendency is a single value that provides an indication of the “middle”, “centre” or “average” of the data set. This single value is representative of the other values in the data set and the other values can be compared against it.
There are three different measures of central tendency:●● mean●● median●● mode.
MeanThe mean is commonly referred to as the “average” of a set of data.
Mean = sum of all the values in a data set ____________________________ total number of values in the data set
Note the following:●● It is only possible to calculate the mean for numerical data (i.e. data that contains
numbers).●● It is not possible to calculate the mean for categorical data.
MedianThe median is the middle-most value in a set of data when the values are arranged in ascending or descending order. This means that 50% of the values are less than the median, and 50% of the values are more than the median.
The median applies only to numerical data (i.e. data that contains numbers).
To determine the median for a data set with an even number of values:
6 values
Median mark = half way between 9 and 10: = 9 ½ marks (47,5%)
Number of marks = 12
2 ; 3 ; 5 ; 5 ; 7 ; 9 ; 10 ; 10 ; 12 ; 16 ; 18 ; 19

©Via Afrika Publishers » Mathematical Literacy Grade 10 138
Section 1Section 7
ModeThe mode is the value or object that occurs the most in a set of data.
If there are two items that appear more than any of the other items and appear an equal number of times, such a data set is called bi-modal (two modes).
It is possible to determine the mode (or modal value) for both numerical data (e.g. test marks) and categorical data (e.g. the most popular cell phone brand).
Measures of spreadThe spread of a set of data provides us with information about whether the values in a data set are grouped closely together or spread far apart. In Grade 10 we will use the range as a measure of spread.
RangeThe range is the difference between the highest and lowest values in a set of data.
Range = highest value – lowest value
Example:Here are the ages (in years) of the teachers at Morningside High School:34, 58, 28, 36, 44, 29, 51, 36, 49, 54, 43, 59, 45, 37, 29, 48, 57, 29, 35, 43, 53, 47, 31For this data, determine:a the meanb the medianc the moded the range.
Solution:a Mean = sum of all the values in a data set ____________________________ total number of values in the data set =
975 ___ 23 ≈ 42
Therefore, the mean (or average) age of the teachers is 42 years.
b Before we can determine the median, we first have to sort or arrange the values, for example from low to high (that is, in ascending order):
28, 29, 29, 29, 31, 34, 35, 36, 36, 37, 43, 43, 44, 45, 47, 48, 49, 51, 53, 54, 57, 58, 59
Since there are 23 values, the median is the 12th value from the bottom (or the top), so that there are 11 values below the median, and 11 values above the median. So:28, 29, 29, 29, 31, 34, 35, 36, 36, 37, 43, 43, 44, 45, 47, 48, 49, 51, 53, 54, 57, 58, 59
50% of the values are median 50% of the values are less than the median more than the median
Therefore, the median of the teachers’ ages is 43 years.

©Via Afrika Publishers » Mathematical Literacy Grade 10 139
Section 1Section 7
c 28, 29, 29, 29, 31, 34, 35, 36, 36, 37, 43, 43, 44, 45, 47, 48, 49, 51, 53, 54, 57, 58, 59 The mode is 29 years. Note that it is easier to see the mode once the data is sorted (arranged).
d The range is the highest value – the lowest value Therefore: Range = 59 – 28 = 31 years. Note that it is easier to calculate the range once the data is sorted (arranged).
Analysing the measures of central tendency and of spreadThe mean
●● The mean mark tells us that the average age of the teachers at this school is 42 years. Some teachers will be younger than 42 years and some older, but this value still provides us with an indication of the general age of the teachers.
●● This mean age also provides us with a single age against which to compare the ages of individual teachers, i.e. whether they are older or younger or of average age.
●● However, this mean age of 42 tells us nothing about how the age of the teachers are spread, in other words, whether there are teachers who are much younger than 42 years and whether there are teachers who are much older than 42 years.
The median●● The median of 43 tells us that half (50%) of the teachers are younger than 43 years,
while the other half of the teachers are older than 43 years.●● However, this median value tells us nothing about the spread of the teachers’ ages.●● The mean (42 years) and the median (43 years) are very close. Therefore, both the
mean and median are appropriate measures to summarise the data.
The mode●● The mode of 29 tells us that 29 years is the age that appears most often.●● However, in this case the mode will not be an appropriate measure to summarise the
data, since with the exception of one teacher, all teachers are older than 29 years.
The range:●● The range of 31 tells us that the difference between the youngest and the oldest
teacher is 31 years.●● This value, along with the mean and median, gives us a very good understanding of
the nature of this data set.

©Via Afrika Publishers » Mathematical Literacy Grade 10 140
Section 1
Practice Exercises
Question 1: Census at School 10 marksIn 2001, the government launched the Census at School project. They surveyed a sample of schools across the country. They repeated the survey in 2009. One of the pieces of information surveyed was the distance of learners from their school. Here are the results from the two surveys.
CS2009
Less than 1 km
1 to 5 km
6 to 10 km
11 km or more36%42%
9%13%
Perc
enta
ge
05
101520253035404550
Less than 1 km 1 to 5 km 6 to 10 km 11 km or more
CS2001
Source: Census at school 2009 report (StatsSA)
1.1 What percentage of learners lived 11 km or more away from their school in 2009? (1)
1.2 Approximately what percentage of learners lived less than 1 km from their school in 2001? (1)
1.3 What percentage of learners lived less than 5 km from their school in 2009? (2)
1.4 Are learners closer to their schools or further away in 2009 (when compared to 2001)? Give a reason for your answer. (3)
1.5 Calculate the size of the pie chart segment (in degrees) for the “1 to 5 km” seg-ment on the CS2009 pie chart. (3)
Question 2: The end of term results 16 marksThe following percentages were obtained for a test by a class of learners:
65 72 40 21 93 45 64 7440 54 56 38 75 74 72 6935 83 89 78 40 56 80 73
2.1 Calculate the mean (average) mark for the class (3)
2.2 How many of the learners in the class obtained a mark that was below the average? (1)
2.3 Calculate the median mark for the class. (3)
2.4 Calculate the mode for the data. (1)
2.5 Why is the mode not a good measure for the average of the class? (1)

©Via Afrika Publishers » Mathematical Literacy Grade 10 141
Section 1
Practice Exercises
2.6 Is this data numerical or categorical? Give a reason for your answer (2)
2.7 The median is higher than the mean. What caused the mean to be lower? (1)
2.8 Calculate the range of the data. (2)
2.9 Is this a weak or a strong class? Give at least two reasons to support your opinion. (2)
Question 3: It’s just not cricket 21 marks
Joseph’s Batting Runs per match21 28 19 35 22 18 26 2933 18 42 37 20 23 25 1940 38 43 50 38 25 32 27
Joseph is a batsman and these are his scores this season:
3.1 Use the data to complete the following frequency table:
Runs (r) Tally Frequency0 ≤ r < 1010 ≤ r < 2020 ≤ r < 3030 ≤ r < 4040 ≤ r < 5050 ≤ r < 6060 ≤ r < 70
Total:
(3)3.2 Plot the data from the table in question 3.1 as a histogram. (6)
3.3 Calculate the mean of Joseph’s data. (3)
3.4 Joseph’s median score was 27,5.
3.4.1 Give the method of how to work out the median. (2)
3.4.2 Why is the median a decimal number when none of the scores are decimals? (2)
3.5 Write down his modal score. (1)
3.6 How many scores of 50 or more did Joseph get? (1)
3.6 His friend, Peter, is also a batsman. His averages are as follows:
Mean: 20,88 Median: 15 Scores of 50 or more: 3
Who is the better batsman? (Give reasons for your answer.) (3)
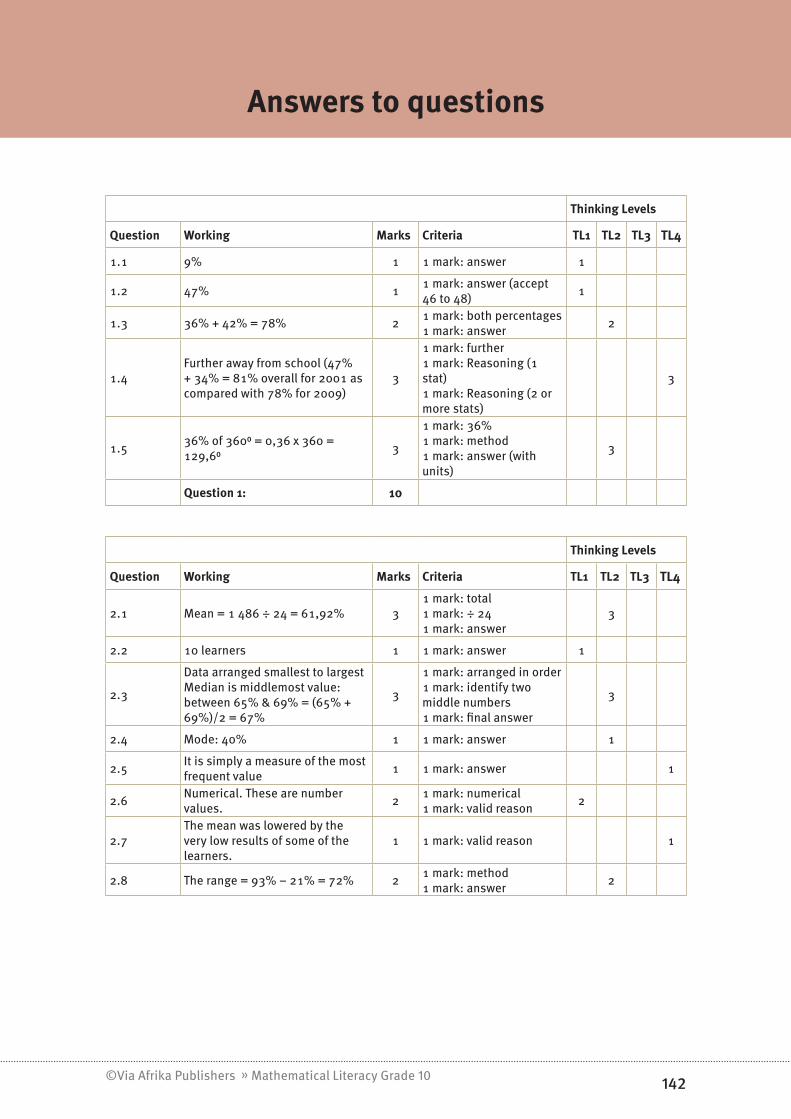
©Via Afrika Publishers » Mathematical Literacy Grade 10 142
Section 1Section 6
Thinking Levels
Question Working Marks Criteria TL1 TL2 TL3 TL4
1.1 9% 1 1 mark: answer 1
1.2 47% 1 1 mark: answer (accept 46 to 48) 1
1.3 36% + 42% = 78% 2 1 mark: both percentages 1 mark: answer 2
1.4Further away from school (47% + 34% = 81% overall for 2001 as compared with 78% for 2009)
3
1 mark: further 1 mark: Reasoning (1 stat) 1 mark: Reasoning (2 or more stats)
3
1.5 36% of 360⁰ = 0,36 x 360 = 129,6⁰ 3
1 mark: 36% 1 mark: method 1 mark: answer (with units)
3
Question 1: 10
Thinking Levels
Question Working Marks Criteria TL1 TL2 TL3 TL4
2.1 Mean = 1 486 ÷ 24 = 61,92% 31 mark: total 1 mark: ÷ 24 1 mark: answer
3
2.2 10 learners 1 1 mark: answer 1
2.3
Data arranged smallest to largest Median is middlemost value: between 65% & 69% = (65% + 69%)/2 = 67%
3
1 mark: arranged in order 1 mark: identify two middle numbers 1 mark: final answer
3
2.4 Mode: 40% 1 1 mark: answer 1
2.5 It is simply a measure of the most frequent value 1 1 mark: answer 1
2.6 Numerical. These are number values. 2 1 mark: numerical
1 mark: valid reason 2
2.7The mean was lowered by the very low results of some of the learners.
1 1 mark: valid reason 1
2.8 The range = 93% – 21% = 72% 2 1 mark: method 1 mark: answer 2
Answers to questions
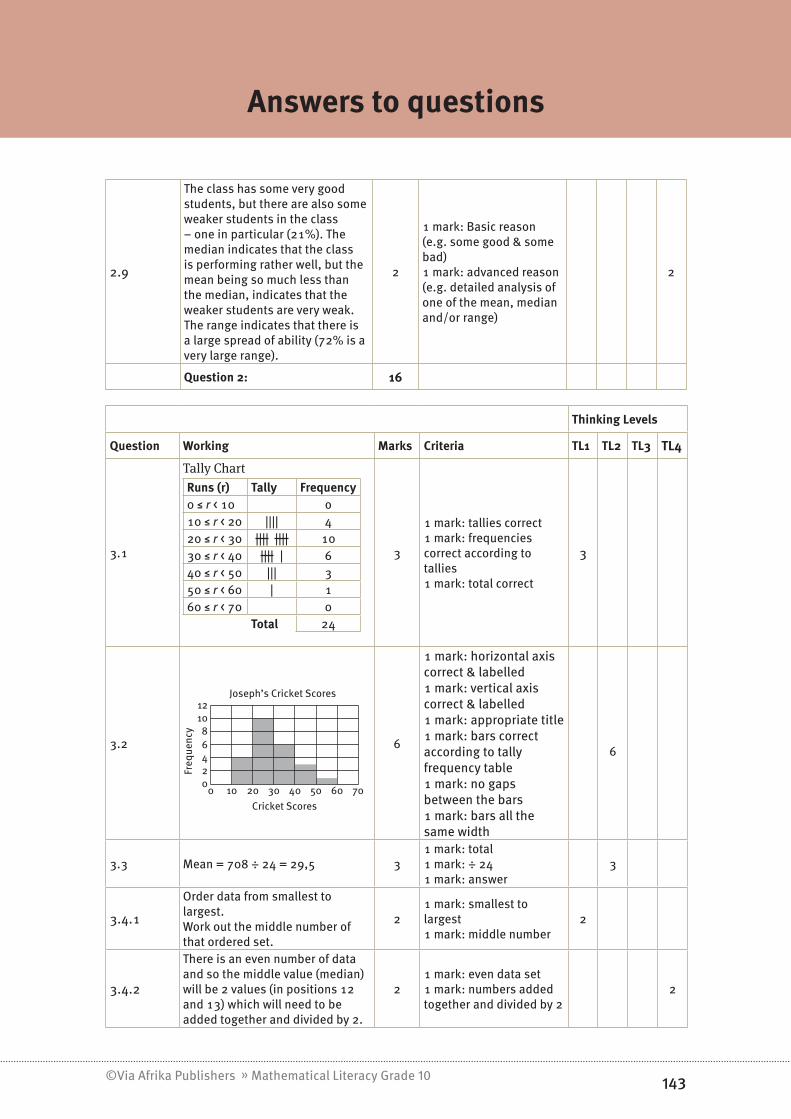
©Via Afrika Publishers » Mathematical Literacy Grade 10 143
Section 1
Answers to questions
2.9
The class has some very good students, but there are also some weaker students in the class – one in particular (21%). The median indicates that the class is performing rather well, but the mean being so much less than the median, indicates that the weaker students are very weak. The range indicates that there is a large spread of ability (72% is a very large range).
2
1 mark: Basic reason (e.g. some good & some bad) 1 mark: advanced reason (e.g. detailed analysis of one of the mean, median and/or range)
2
Question 2: 16
Thinking Levels
Question Working Marks Criteria TL1 TL2 TL3 TL4
3.1
Tally ChartRuns (r) Tally Frequency0 ≤ r < 10 o10 ≤ r < 20 |||| 420 ≤ r < 30 |||| |||| 1030 ≤ r < 40 |||| | 640 ≤ r < 50 ||| 350 ≤ r < 60 | 160 ≤ r < 70 0
Total 24
3
1 mark: tallies correct 1 mark: frequencies correct according to tallies 1 mark: total correct
3
3.2
Cricket Scores
Freq
uenc
y
002468
1012
10 20 30 40 50 60 70
Joseph’s Cricket Scores
6
1 mark: horizontal axis correct & labelled 1 mark: vertical axis correct & labelled 1 mark: appropriate title 1 mark: bars correct according to tally frequency table 1 mark: no gaps between the bars 1 mark: bars all the same width
6
3.3 Mean = 708 ÷ 24 = 29,5 31 mark: total 1 mark: ÷ 24 1 mark: answer
3
3.4.1
Order data from smallest to largest. Work out the middle number of that ordered set.
21 mark: smallest to largest 1 mark: middle number
2
3.4.2
There is an even number of data and so the middle value (median) will be 2 values (in positions 12 and 13) which will need to be added together and divided by 2.
21 mark: even data set 1 mark: numbers added together and divided by 2
2

©Via Afrika Publishers » Mathematical Literacy Grade 10 144
Section 1
Answers to questions
3.5 No mode (18, 19, 25, 37, 38 all have a frequency of 2) 1 1 mark: answer 1
3.6 One 1 1 mark: answer 1
3.7
Joseph is better batsman overall. He has higher mean and higher median. However, he scores less results over 50.
31 mark: answer 1 mark: look at 1 stat 1 mark: look at a 2nd stat
3
Question 3: 21

©Via Afrika Publishers » Mathematical Literacy Grade 10 145
Section 1
Probability
Chapter 7
Overview
Probability
Expressions of
probability
CHAPTER 7 pagr 145
SECTION 1 Page 146
• Ways of expressing/describing possibilities
• Tree diagrams
• Two-way tables
• Certain, Impossible and Uncertain eventsThe probability scale
SECTION 2 Page 147
Probability notation
SECTION 3 Page 148
A mathematical
definition of probability
Prediction
Representations for
determining possible
outcomes
SECTION 4 Page 149
SECTION 5 Page 150
SECTION 6 Page 151

©Via Afrika Publishers » Mathematical Literacy Grade 10 146
Section 1Section 1
Expressions of probability
Probability deals with the theory of chance, and is a measure of the chance or likelihood that something will happen.
Let us illustrate this by the following example:Problem: A spinner has four equal sectors coloured yellow, blue,
red and green. What is the probability of landing on blue after spinning the spinner once?
Solution: The chances of landing on blue are 1 in 4, or one fourth. Therefore, the probability of landing on blue is one fourth, which we can also write as ¼, 0,25 or 25%.
Here are some definitions and examples from the problem above.
Definition ExampleAn experiment is a situation involving chance or probability that leads to results called outcomes.
In the problem above, the experiment is spinning the spinner. Other examples are: flipping a coin, or rolling a dice.
An outcome is the result of a single trial of an experiment, such as spinning the spinner once.
The possible outcomes are landing on yellow, blue, green or red. In the problem above, we were interested in the “landing on blue” outcome.
An event is one or more outcomes of an experiment. One event of this experiment is landing on blue.
Probability is the measure of how likely an event is. The probability of landing on blue is one fourth (that is, ¼, 0,25 or 25%).

©Via Afrika Publishers » Mathematical Literacy Grade 10 147
Section 1
The probability scale
Section 2
Certain, impossible and uncertain events The probability of any event can be expressed as a fraction or a percentage lying between 0 (0% – impossible) and 1 (100% – certain).
The higher the chance of a certain outcome, the closer the probability value will lie to 1.
Event that might happen(lies between 0 and 1 or 0% and 100%)
0% 100%
0 1
Impossible event
Not very likely Very likelyUnsure(i.e. might happen butalso might not happen) Certain event
The less the chance that the event may occur, the closer the probability of that event will lie to 0.
ExampleSuppose a dice is rolled. The diagram below shows the probability of the dice landing on either the number 10, the number 5, any odd number, or any number from 1 to 6.
0% 50% 100%
0 1
P(10) P(any number from 1 to 6)P(odd number)(i.e. 1, 3 or 5)
1⁄6
P(5)
©Via Afrika Publishers » Mathematical Literacy Grade 10 148
Section 1
Probability notation
Section 3
We use the notation P(A) to describe the probability that an event “A” will happen.
For example,the probability of a tossed coin landing on heads can be described as:P(heads) = 50%.

©Via Afrika Publishers » Mathematical Literacy Grade 10 149
Section 1
A mathematical definition of probability
Section 4
The following calculation can be used to determine the fractional value between 0 and 1 that describes the chance that an event will happen or end with a particular outcome:
P(event) = number of possible ways an event can happen
___________________________________ total possible outcomes for the event
Example :Suppose a dice is rolled. What is the probability that the dice will land on the number 4?
→ P(dice landing on 4) = 1 __ 6
What is the probability that the dice will land on an even number?
→ P(dice landing on an even number) = 3 __ 6
Ways of expressing/describing probabilitiesProbability can be expressed as:
●● a fraction (for example the probability that the dice will land on number 4 is 1 __ 6 )●● a decimal fraction (for example the probability that the dice will land on number 4 is
0,167 (to 3 decimal places))●● a percentage (for example the probability that the dice will land on number 4 is
16,7%)
Number of ways the dice can land on the number 4 = only 1.There are ‘6’ possible outcomes (i.e. 1, 2, 3, 4, 5 or 6)
Number of ways to land on an even number = 3 (i.e. 2, 4 and 6).

©Via Afrika Publishers » Mathematical Literacy Grade 10 150
Section 1
Prediction
Section 5
The probability of an event is a value that we use to predict what might happen, but there is no guarantee that this will definitely happen.
For example:●● we can predict that 50% of the time a flipped coin will land on heads, but when we
actually carry out the experiment (that is, start tossing the coin) it might not land on heads 50% of the time
●● a prediction of a 30% chance of rain means it might rain, but there is no guarantee that it will rain.
We use the term relative frequency to describe the number of times a specific outcome occurs in an experiment or event relative to the total number of times the experiment/event occurs.
For example, if we flip a coin 15 times, and 12 of the 15 times it landed on heads, we say that:
●● the relative frequency of the coin landing on heads is “12 times out of 15” or 12 __ 15 ●● the relative frequency of the coin landing on tails is “3 times out of 15” or 3 __ 15 .
It is important to realise that the more times an event is repeated (for example, flipping a coin), the closer the value of the relative frequency comes to the value of the probability. In other words it will come closer to what we predicted, such as that the coin should land 50% of the time on heads.

©Via Afrika Publishers » Mathematical Literacy Grade 10 151
Section 1Section 6
Representations for determining possible outcomes
Sometimes when working with situations involving more than one event it can become difficult to identify all possible outcomes for the event. We can make use of tree diagrams and two-way tables to identify the outcomes for a combination of events.
Tree diagramsA tree diagram shows all the possible outcomes of an event or combination of events. It is drawn in the shape of a tree, with each branch of the diagram representing (showing) a different possible outcome for the event or combination of events.
Example The tree diagram alongside shows the possible outcomes when flipping a coin twice.
●● With the first flip of the coin there are two possibilities – heads (H) or tails (T). We represent each of these possibilities on separate branches of a tree.
●● For every possible outcome of the first flip, there are two possible outcomes for the second flip – heads (H) or tails (T).
●● We then use the tree diagram to read all the possible outcomes for the two flips and list those outcomes next to the branches of the tree (for example, heads with the first flip and heads with the second flip (HH)).
Using tree diagrams to determine possible outcomes and probabilitiesWe can use the tree diagram to determine probabilities of each outcome:Total possible outcomes = 4
What is the probability that the coin will land on heads both times (that is, HH)?Reading from the tree diagram:
Number of ways in which the coin can land on “heads & heads”(i.e. HH) = 1 → P(coin landing both times on heads) = 1 __ 4
What is the probability that the coin will land on heads and on tails (that is, HT or TH)? Reading from the tree diagram:
Number of ways in which the coin can land on either heads or tails (i.e. HT or TH) = 2 → P(coin landing on heads and on tails) = 2 __ 4
1st 2nd Outcomes
H HH
H
T HT
Start
H TH
T
T TT

©Via Afrika Publishers » Mathematical Literacy Grade 10 152
Section 1Section 6
Two-way tablesTwo-way tables provide an alternative to tree diagrams for describing and comparing all possible outcomes for two or more events, especially since tree diagrams can only show a limited amount of information. It is called a “two-way” table because it can be read in two different directions: down the columns or along the rows of the table.
Example During a survey to determine how learners get to school, the following data was collected:
Ride Walk Row TotalBoys 37 64 101Girls 45 54 99ColumnTotal 82 118 200
Using the two-way table to determine possible outcomes and probabilitiesWe can use the table to identify that there are four possible outcomes for this scenario:
Boys 37 64 101Girls 45 54 99ColumnTotal 82 118 200
Boys who ride to school (37)Girls who ride to school (45)Boys who walk to school (64)Girls who walk to school (54)
In addition, we can see that 82 learners (37 boys and 45 girls) ride to school, and that 101 boys and 99 girls took part in the survey.
Since we can see from the two-way table that 200 learners took part in the survey, we can calculate probabilities, as follows:If we select a learner at random,
the probability that this learner is a boy who rides to school = 37 ___ 200 = 0,185 or 18,5%
the probability that this learner is a girl who rides to school = 45 ___ 200 = 0,225 or 22,5%
the probability that this learner is a boy who walks to school = 64 ___ 200 = 0,32 or 32%
the probability that this learner is a girl who walks to school = 54 ___ 200 = 0,27 or 27%
Note that the four probabilities add up to one.

©Via Afrika Publishers » Mathematical Literacy Grade 10 153
Section 1
Practice Exercises
Question 1: Games of chance 6 marksThe Grade 10 Mathematical Literacy learners are asked to organise games of chance for the school carnival. They organise a number of games that depend on probability.
1 The first game gives a prize if you can pick a black bead from a bag containing a mixture of 1 000 black beads and white beads.
1.1 If 322 of the beads are black, what is the probability of John getting a black bead with his first draw? (2)
1.2 If they expect 30 people to play the game, use probability to estimate how many prizes they will need to buy. (2)
1.3 What would the probability of getting a black bead be if they took out 300 black beads? (2)
Question 2: The spinner 5 marksAmy is using the spinner, shown below, for her game.
2 She says that the chance of getting white is 1 _ 5 , since there are 5 possible colours.
2.1 Do you think that Amy is right? Explain your answer. (2)
2.2 What, would you estimate, is the probability of getting blue? (2)
2.3 Draw a spinner, that could be used for another game, that would give a choice of green, pink or black in the following probabilities: (1)
green: 1 _ 2 pink: 1 __ 4 black: 1 __ 4

©Via Afrika Publishers » Mathematical Literacy Grade 10 154
Section 1Section 6
Thinking Levels
Question Working Marks Criteria TL1 TL2 TL3 TL4
4.1P(black) = 322 ÷ 1 000 = 0,322 or 32,2%
21 mark: using the definition of probability 1 mark: answer
2
4.2Number of possible prizes = 0,322 x 30 = 9,66 Therefore, possibly 10 prizes
21 mark: probability x number of people 1 mark: answer
2
4.3P(black) = 22 ÷ 1 000 = 0,22 or 22%
21 mark: working with 322 – 300 = 22 black beads 1 mark: answer
2
Question 4: 6
5.1 No. The chance is 1 __ 6 (there are 6 equal-sized segments) 2 1 mark: answer
1 mark: reason 1 1
5.2 P(Blue) = 2 __ 6 = 1 __ 3 = 0,33 or 33,3% 2 1 mark: answer 1 mark: method 2
5.3
Green = 1 __ 2 = 2 __ 4 So spinner needs to have 4 equally sized segments: 2 green, 1 pink and 1 black
1 1 mark: answer 1
Question 5: 5
Answers to questions

©Via Afrika Publishers » Mathematical Literacy Grade 10 155
Section 1
Exam Papers
How question papers are drawn up
This section contains an end-of-year examination Mathematical Literacy Paper 1 and Paper 2, as well as the memoranda (solutions). Included in each memorandum is an “exam analysis” that highlights key information and comments about each question.
It is important to understand that the memorandum is only a guideline and that you may find a way to answer a question correctly that is not reflected in the memorandum. As you work through the solutions in the memoranda, you will notice that tick marks (ü) are included at different places in the solutions. These tick marks show you what steps or calculations will earn marks.
How is Exam Paper 1 different from Exam Paper 2?Paper 1 is a “skills” paper working with familiar contexts.
This means that Paper 1 assesses basic mathematical skills and competency, and contains primarily questions at the knowing level (Level 1) and routine procedures level (Level 2). The examination also contains a small number of multi-step procedures (Level 3) questions. The contexts included in this paper are limited to those that have been prescribed in the official curriculum, and which you should have dealt with in your Mathematical Literacy classes.
Paper 2 is an “applications” paper working with both familiar and unfamiliar contexts.
This examination paper contains primarily questions at the multi-step procedures level (Level 3) and reasoning and reflecting level (Level 4), and a small number of routine procedures (Level 2) questions.
The four levelsAssessment can be pitched at various levels of difficulty. In Mathematical Literacy, assessment takes place on the following difficulty levels:
●● Level 1: Knowing●● Level 2: Applying routine procedures in familiar contexts●● Level 3: Applying multi-step procedures in a variety of contexts●● Level 4: Reasoning and reflecting
Level 1 (knowing) questions are the easiest, while Level 4 (reasoning and reflecting) questions are the hardest. Here are examples of the types of tasks at each level:

©Via Afrika Publishers » Mathematical Literacy Grade 10 156
Section 1
Exam Papers
Level 1: Knowing
Inanutshell: Level 1 questions require little work, and are often easy to answer.
●● Reading information directly from a table (for example, the date on a bank statement; the time that a bus leaves the bus terminal).
●● Performing basic operations on numbers (for example, subtracting income and expenditure values to determine the profit/loss for a business; adding values to show how the “Amount due” value on an electricity bill has been determined).
●● Measuring accurately (for example, measuring the dimensions of a room on a given plan accurately using a ruler).
●● Rounding answers appropriately as per a given instruction (for example, rounding off an answer to one decimal place when instructed to do so).
●● Identifying the appropriate formula to be used in a given calculation (for example, identifying the formula for the area of a circle as area = π × radius2 from a given list of area formulae).
●● Recognising and explaining vocabulary appropriate to a particular scenario (for example, “discrete” and “continuous” in the context of data; “event” and “outcome” in the context of probability; “dependent” and “independent” variables; “debit” and “credit” in the context of finance).
●● Reading values directly from the values provided on a graph or table (for example, reading off the cost of talking for 60 minutes on a cellphone from a graph showing the contract cost of calls over time).
●● Performing conversions within the metric system (for example, from mm to cm to m to km; from ml to ℓ; from g to kg; from seconds to minutes to hours).
Level 2: Applying routine procedures in familiar contexts
Inanutshell: Level 2 questions require more work, but often involve very familiar calculations. For example, calculating a percentage.
Tasks at this level require you to perform well-known procedures and complete common tasks in familiar contexts. You should know what procedure/task is required from the way the problem is posed and all the necessary information to solve the problem is immediately available to you. Questions about routine procedures commonly involve single-step calculations, repeating the same calculation several times, or the completion of a task that you are familiar with (for example, constructing an income-and-expenditure statement to reflect an individual’s finances).

©Via Afrika Publishers » Mathematical Literacy Grade 10 157
Section 1
Exam Papers
Examples of routine procedures tasks include:
●● Substituting values into given equations (for example, determining the bank charge for depositing money into an account using a given formula).
●● Solving equations by means of trial and improvement or algebraic processes.●● Drawing graphs from given tables of values (for example, drawing a graph to show
the cost of a call on a cellphone contract over time from a given table of time and cost values).
●● Constructing a budget for a small household project.●● Using tax deduction tables to determine the amount of tax to be deducted from an
employee’s salary.●● Measuring the dimensions of the floor of a room and using the dimensions to
determine how many running metres of carpeting to buy to cover the floor of the room.
●● Calculating the mean, median and/or modal averages of a set of data.●● Increasing or decreasing an amount by a percentage (for example, determining how
much a person will pay for a television set if a 5% discount is given).●● Estimating values from the values provided on a graph or in a table (for example, on
a graph showing population statistics in millions for the different provinces in South Africa, estimate the population of KwaZulu-Natal).
●● Using a given scale to determine actual length or distance (for example, using a scale of 1:100 on a plan to determine the actual length and width of the walls of a room).
Level 3: Applying multi-step procedures in a variety of contexts
Inanutshell: Level 3 questions are often the longest and most difficult in the exam paper.
Tasks at this level require you to solve problems or complete tasks using well-known procedures and methods, but where the procedure or method is not immediately obvious from the way the problem is posed. As such, you may have to decide on the most appropriate procedure or method to find the solution to the question or to complete a task, and you may have to perform one or more preliminary calculations or complete one or more preliminary tasks before determining a solution.
At this level, there are also situations in which a variety of mathematical and non-mathematical content, skills and/or considerations must be utilised from different topics in the curriculum in order to make sense of a problem.

©Via Afrika Publishers » Mathematical Literacy Grade 10 158
Section 1
Exam Papers
Examples of multi-step procedures tasks include:
●● Deciding on the most appropriate graph and an appropriate means of constructing that graph to represent a particular scenario (for example, constructing a table of values to represent a tariff structure for a particular electricity system and then using the table of values to draw a graph to represent that tariff structure).
●● Determining the most appropriate scale in which to draw a plan, determining dimensions according to that scale, and then drawing the plan according to those scaled dimensions.
●● Determining the quantity of paint needed to paint the walls of a building by determining the surface area of the walls of a building, using a conversion ratio to convert the surface area value from m2 to litres, rounding the litres value up to the nearest whole litre and then making a decision about the most appropriate quantity of paint to be bought based on available tin sizes.
●● Using maps, a distance chart, weather report information and other travel resources to plan a trip, giving consideration to where to stop for petrol, estimated travelling distance and time, and estimated travel costs.
●● Researching the costs involved in a fund-raising activity and preparing a budget for the activity.
●● Using given inflation rates to investigate the estimated value of an item over a multiple time period. (For example, if a car is currently worth R90 000, what would the car be worth in two years’ time if the value of the car depreciated by approximately 15% in the first year and 10% in the second year?)
Level 4: Reasoning and reflecting
Inanutshell: Level 4 questions involve reasoning. For example, you might need to provide an opinion, or compare two options and decide which is better.
Tasks at this level can be divided into two groups of questions:
1 Questions that require a decision, opinion or prediction about a particular scenario based on calculations in a previous question or on given information (for example, analysing calculations performed in a previous question on two different electricity costing options and making a decision about the most suitable option for a person with particular needs; or analysing a statement regarding crime statistics reported in a newspaper article; or making a prediction about the projected income for a business based on current financial data).

©Via Afrika Publishers » Mathematical Literacy Grade 10 159
Section 1
Exam Papers
Examples of these types of reasoning and reflecting questions include:
●● Comparing provided data on the performance of two groups of learners in an examination and explaining which group performed better based on the available data.
●● Providing an opinion on how a particular government minister might react to a particular set of statistics.
●● Analysing a completed income-and-expenditure statement for a household and making suggestions on how the members of the household could change their expenditure to improve their financial position.
2 Questions that require you to pose and answer questions about what mathematics you require to solve a problem, select and use that mathematical content, recognise the limitations of using mathematics to solve the problem, and consider other non-mathematical techniques and factors that may define or determine a solution to the problem. (For example, when presented with adverts for two different cellphone contracts, you must decide what method will be the most appropriate for comparing the costs involved in the contracts. You may decide to construct tables of values, or draw graphs, or use equations. Having chosen a suitable method, you will need to perform the necessary calculations and then make sense of your calculations in order to make a decision regarding the most affordable contract for an individual with particular needs. You will also need to recognise that irrespecitve of the mathematical solution to the problem, the individual may choose a cellphone based on personal preference, for example, colour or cellphone model).
Examples of these types of reasoning and reflection questions include:
●● Comparing the bank charges on two different types of accounts for various transactions and making a decision about the most suitable account for an individual with particular needs.
●● Constructing a table to model a loan scenario, taking into account the interest calculated on the loan, the monthly repayment and the closing balance on the loan every month.
●● Using this model of the loan scenario to investigate the effect of changes in the interest rate on the loan and the impact of increasing the monthly repayment on the real cost of the loan.
●● Building two different types of boxes for packaging an item, comparing the boxes in terms of wasted space (volume) and materials (surface area), and making a decision about the most cost-effective box for packaging the item.
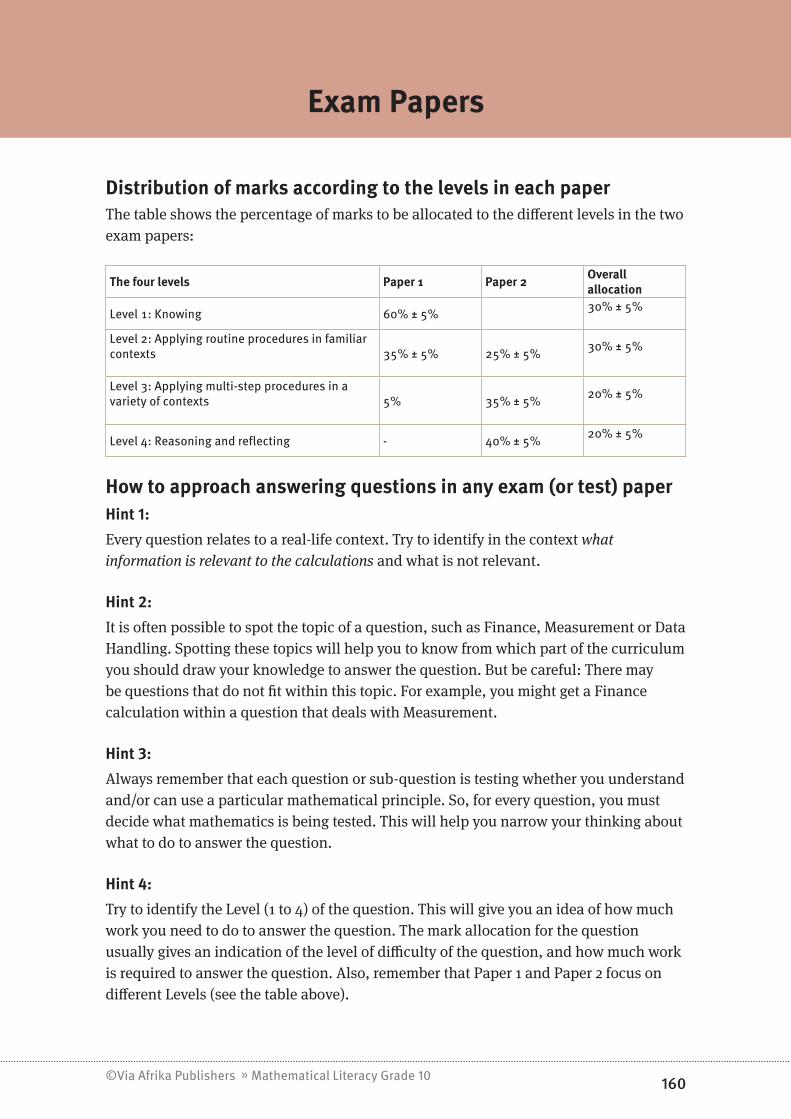
©Via Afrika Publishers » Mathematical Literacy Grade 10 160
Section 1
Exam Papers
Distribution of marks according to the levels in each paperThe table shows the percentage of marks to be allocated to the different levels in the two exam papers:
The four levels Paper 1 Paper 2 Overallallocation
Level 1: Knowing 60% ± 5% 30% ± 5%
Level 2: Applying routine procedures in familiar contexts 35% ± 5% 25% ± 5% 30% ± 5%
Level 3: Applying multi-step procedures in a variety of contexts 5% 35% ± 5% 20% ± 5%
Level 4: Reasoning and reflecting - 40% ± 5% 20% ± 5%
How to approach answering questions in any exam (or test) paperHint 1:Every question relates to a real-life context. Try to identify in the context what information is relevant to the calculations and what is not relevant.
Hint 2:It is often possible to spot the topic of a question, such as Finance, Measurement or Data Handling. Spotting these topics will help you to know from which part of the curriculum you should draw your knowledge to answer the question. But be careful: There may be questions that do not fit within this topic. For example, you might get a Finance calculation within a question that deals with Measurement.
Hint 3:Always remember that each question or sub-question is testing whether you understand and/or can use a particular mathematical principle. So, for every question, you must decide what mathematics is being tested. This will help you narrow your thinking about what to do to answer the question.
Hint 4:Try to identify the Level (1 to 4) of the question. This will give you an idea of how much work you need to do to answer the question. The mark allocation for the question usually gives an indication of the level of difficulty of the question, and how much work is required to answer the question. Also, remember that Paper 1 and Paper 2 focus on different Levels (see the table above).

©Via Afrika Publishers » Mathematical Literacy Grade 10 161
Section 1
Exam Papers
In Paper 1:
●● Level 1 questions usually count 1 or 2 marks.●● Level 2 questions usually count more than 2 marks.●● Level 3 questions usually count 5 marks or more.
In Paper 2:
●● Level 2 questions usually count 2 and 4 marks.●● Level 3 questions usually count 5 marks or more.●● Level 4 questions with no calculations are usually worth 2 or 3 marks.●● Level 4 questions with calculations are usually worth 5 marks or more.
Hint 5:There may be instructions (either at the front of the Paper, or at the question itself) indicating to how many places you must round off your answer. However, always consider whether your answer should be rounded up or down. For example, when calculating how many taxis are needed to transport a certain number of people, the answer always needs to be rounded up.
Hint 6:It is important to always show how you work out the answer to a question – even if the question does not ask you to show your working. Showing your working will help you to structure your thinking about the problem and how to answer it, and will help you to get the marks for the method used.
Hint 7:If a question asks you for an opinion and to explain or justify your opinion, always explain or justify your opinion by using mathematical calculations, or by referring to information given to you in the question. Do not try to explain an answer using your own personal opinion if it is not related to the information given to you in the question.
Hint 8:Don’t panic! If you have prepared properly, you WILL be able to answer most of the questions.

©Via Afrika Publishers » Mathematical Literacy Grade 10 162
Section 1
Exam Papers
Paper 1
GRADE 10 MATHEMATICAL LITERACY
NOVEMBER END-OF-YEAR EXAMINATIONS
PAPER 1
75 Marks 1,5 HoursRead these instructions carefully.
●● Answer all of the questions.●● It is advisable to show all working and to work neatly.●● You may use a calculator for all of the questions.●● Drawings are NOT to scale (unless otherwise stated).
QUESTION1: PERSONALFINANCE
The table given alongside shows a rough statement of the income-and-expenditure items for an individual. 1.1 Identify one fixed and one variable
expenditure item. (2)
1.2 Write the number R7 820,00 in words. (1)
1.3 Calculate the total expenditure for this person. (1)
1.4 Calculate how much money this person has left over at the end of the month. (2)
1.5 If this person were to receive a 10% increase in salary, what would their new salary be? (3)
1.6 The table given alongside shows the tariffs payable for electricity on the electricity system that is attached to this person’s house.
(Source: Ethekwini Electricity: Tariffs 2010/2011. www.durban.gov.za. Sourced 13 August 2010)
1.6.1 In what units is the electricity tariff shown on the table quoted? (1)1.6.2 Write down the tariff in Rand and cents format. (1)1.6.3 Show by calculation how much it will cost to use 150,5 units (kWh) of electricity
per month on this system. (2)1.6.4 The expenses table (in question 1.1) shows that the person spends approximately
R450,00 on electricity every month. Use substitution and the method of trial and improvement (or any other method) to
determine approximately how many units of electricity the person must be using every month to have to pay this cost.
Income Amount Expenditure items AmountSalary R7 820,00 Petrol R750,00
Food R2 500,00Electricity R450,00Car repayment R1 770,00Clothing R400,00Toiletries R300,00Car insurance R580,00Entertainment R500,00Bank fees R120,00Cell phone R240,00
Domestic systems(small to medium size house) Energy charge (c/kWh)
Prepaid meter 90,16Flat Rate system (40A) 90,16

©Via Afrika Publishers » Mathematical Literacy Grade 10 163
Section 1
Exam Papers
Note: Your answer does not have to be accurate. Rather, you must provide an estimated or approximated amount that is close to the accurate answer. (3)
1.6.5 The electricity department publishes the following graph on their website to show how the cost of electricity on this system changes with electricity usage.
According to the graph:a. Approximately how much will it cost to use 900 units of electricity per month on this
system? (1)b. Approximately how many units of electricity have been used during the month if the
monthly cost of that electricity is R350,00? (2) [19]
QUESTION2: BAKINGMUFFINS(MEASUREMENT)
A group of students are planning to bake muffins to sell at a Saturday market. The picture given below shows the recipe for the muffins.
2 Eggs125 ml Cooking oil375 ml Brown sugar (33 g)500 ml Milk300 g Whole wheat flour375 ml Cake flour (210 g)5 ml Salt5 ml Vanilla essence10 ml Bicarbonate of soda250 ml Raisins (150 g)
2.12.1.1 How many eggs are needed for the muffins? (1)2.1.2 How many grams of cake flour are needed for the muffins? (1)

©Via Afrika Publishers » Mathematical Literacy Grade 10 164
Section 1
Exam Papers
2.2 The students will be using cup and spoon measuring instruments to measure out the ingredients. The picture given alongside shows the millilitre measurements for different sizes of cups and spoons. Use the values shown on the picture to complete the following table for the ingredients shown in the recipe: (4)
1 cup(250 ml)
1 __ 2 teaspoon
1 teaspoon(5 ml)
1 __ 2 cup
1 __ 2 tablespoon
1 Tablespoon
(15 ml)
1 __ 4 cup
1 __ 3 cup
Ingredients Measurement on recipe Cup, tablespoon or teaspoon measureCooking oil 125 mℓBrown sugar 375 mℓMilk 500 mℓ 2 cupsWhole wheat flour 300 gCake flour 375 mℓSalt 5 mℓ 1 teaspoonVanilla essence 5 mℓ 1 teaspoonBicarbonate of soda 10 mℓRaisins 250 mℓ 1 cup
2.3 The picture alongside shows the measurements that appear on the side of a measuring jug. If the students were to measure out the quantity of cake flour required in this jug, indicate on the picture up to what mark they would need to fill the flour in the jug. (2)
2.4 The recipe above makes 30 muffins. If the students want to make 150 muffins: 2.4.1 How many full litres of milk will they need to buy? (4)2.4.2 If milk costs R18,99 for 2ℓ and R9,49 for 1ℓ, how much will they spend buying
the milk? (2)2.4.3 The raisins are sold in 200 g bags. Approximately how many bags of raisins will
they need to buy to make 150 muffins? Note: You do not need to calculate the answer accurately; rather, you must estimate the answer and must show your method in estimating the answer. (3)
[17]

©Via Afrika Publishers » Mathematical Literacy Grade 10 165
Section 1
Exam Papers
QUESTION3: THELOFTUSVERSFELDSPORTSSTADIUM(MAPWORK)
The picture given alongside shows a seating layout map for Loftus Versfeld sports stadium in Pretoria.3.1
3.1.1 How many gates are there leading into the stadium? (1)
3.1.2 If you were sitting in Stand D, would you be in the lower or upper level of the stadium? (1)
3.1.3 If you were sitting in seating Stand VV, would you be in the lower or upper level of the stadium? (1)
3.2 3.2.1 If you are sitting in Stand 6, write down the level and name of the stand in which
you are positioned. (2)3.2.2 If you are sitting in Stand 6, which gate will give you the easiest access to your seat? (1)
3.3 Letters and numbers have been used to label the seating stands in the stadium. Which letters have not been used in the labelling system? (2)
3.4 The picture shows a ticket for a soccer match played at the Loftus Versfeld Stadium during the 2010 Soccer World Cup in South Africa. (Ticket supplied by Adrian Hards.)3.4.1 What two teams were playing
in this match? (2)3.4.2 What time did the match
start? (1)3.4.3 In which stand (seating area)
is the seat shown on this ticket positioned? (1)
3.4.4 What gate would the ticket holder of this ticket have used to enter the stadium? (1)
3.4.5 Once the ticket holder of this ticket has located the stand in which the seat is positioned, describe how they will locate their seat. (2)
[15]

©Via Afrika Publishers » Mathematical Literacy Grade 10 166
Section 1
Exam Papers
QUESTION4: TESTSMARKS(DATAHANDLINGANDPROBABILITY)
The table below shows an extract from a Mathematical Literacy teacher’s mark book for a test.
Name Surname Mark (/50) % Name Surname Mark (/50) %John Abrahams 36 72% Hendrik Potgieter 15 30%Thuli Aphane 12 24% Themba Radebe 41 82%Ishmael Chetty 40 80% Sophia Ramaphosa 38 76%Damon Donovan 24 48% Bongani Simelani 26 52%Gugu Hlatswayo 35 70% Jerome Simmonds 35 70%Thandi Hlela 39 78% Xolile Taba 18 36%Muneeb Kahn 25 50% Jillian Thomas 22 44%Thembi Malevu 48 96% Gabriel Thomson 43 86%Khosi Ndaba 30 60% Janine van Breda 27 54%Mthandeni Ndawonde 39 78% Cornelius Vermeulen 12 24%Elizabeth North 29 58% Rebecca Welsford 35 70%Thomas O’Brien 35 70% Sara West 35 70%Arusha Patel 7 14%
4.14.1.1 What total mark was the test out of? (1)4.1.2 How many learners are there in this class? (1)4.1.3 Which learner scored the highest mark in the class? (1)4.1.4 Which learner scored the lowest mark in the class? (1)4.1.5 Give the names of the two students who both scored 24% for the test. (2)
4.2 Show how the percentage value of 72% for John Abrahams was calculated. (3)
4.34.3.1 According to what criteria have the marks been sorted in the table? (1)4.3.2 Sort the marks (and corresponding percentage values) from smallest to biggest. (2)
4.4 Use the sorted list of marks to complete the following frequency table: (2)
Mark interval No. of learners who scored marks in this interval Mark interval No. of learners who scored
marks in this interval0–9% 50–59%10–19% 60–69%20–29% 70–79%30–39% 80–89%40–49% 90–100%

©Via Afrika Publishers » Mathematical Literacy Grade 10 167
Section 1
Exam Papers
4.5 Now use the set of axes given alongside to draw a bar graph to represent the information in the table. You must label each axis with an appropriate label and provide a title for the chart. (3)
4.6 Use an appropriate measure of central tendency to calculate the class average for the test scores. Use the actual test scores and not the % values. (3)
4.7 One of the questions on the test looked as follows:
Imagine that you are tossing two coins. The pictures below show all of the different ways in which the two coins might land:
1 Use the pictures above to help you to write down all of the possible outcomes which could occur when two coins are tossed. (2)
2 Now determine the following: P(one of the coins landing on heads and the other on tails, in any order) (2)
Show how you would answer these questions. (4) [24]
---ENDOFPAPER1---

©Via Afrika Publishers » Mathematical Literacy Grade 10 168
Section 1
Exam Papers
Paper 2
GRADE 10 MATHEMATICAL LITERACY
NOVEMBER END-OF-YEAR EXAMINATIONS
PAPER 2 – APPLICATION PAPER
75 Marks 1,5 HoursRead these instructions carefully.
●● Answer all of the questions.●● It is advisable to show all working and to work neatly.●● You may use a calculator for all of the questions.●● Drawings are NOT to scale (unless otherwise stated).
QUESTION1: MAKINGSENSEOFACELLPHONEBILL
The picture below shows a section of a cell phone bill for a cell phone contract.
Summary of ChangesCell No Name Description Amount VAT 14% TotalAIRTIME0836718901 M North Airtime 237.26 33.22 270.48Subscription0836718901 M North Subscription – Anytime 200 175.44 24.56 200.00Other0836718901 M North COMPULSORY CLIP 7.46 1.04 8.50
COMPULSORY SIMSURE 3.68 0.52 4.20ITEMISED BILLING 19.30 2.70 22.00TOTAL 30.44 4.26 34.70
Invoice Total (ZAR) 443.14 62.04 505.18
1.1 Show by calculation which values on the bill have been used to make up the INVOICE TOTAL of R505,18. (2)
1.2 Show by calculation how the VAT value of R33,22 has been determined. (2)
1.3 The picture alongside shows a section of the Itemised Billing portion of the cell phone bill that provides information on each call made during the month.1.3.1 The second call of the day started at 11:54.
At what time did the call end? The answer need only include hours and minutes. (2)1.3.2 The “Units” values show the length of the each call in seconds.
Show by calculation how the unit value of 567 has been determined. (2)1.3.3 Show by calculation that the cost of a call on this cell phone is charged at a tariff
of R2,50 per minute (but calculated per second). (4)

©Via Afrika Publishers » Mathematical Literacy Grade 10 169
Section 1
Exam Papers
1.3.4 Now use this tariff to show how the cost value of R11,83 has been determined. (3)
1.4 The following pie chart appears on the cell phone bill.1.4.1 According to the pie chart,
Airtime amounts to 53,5% of the total monthly cost. Show how this value of 53,5% has been determined. (3)
1.4.2 What information do the three rectangular blocks next to the pie chart contain? (2)
1.4.3 Talktime amounts to 83% of the Airtime cost. Determine how much of the total Airtime cost the Talktime cost amounts to. (3)
1.5 The graph given below is also included on the cell phone bill.1.5.1 In which month(s) was the
amount spent on the cell phone the lowest? (2)
1.5.2 In which month(s) was the amount spent on the cell phone the highest? (1)
1.5.3 Explain why the graph has been drawn with a dotted line. (2)
1.5.4 Describe the trend shown in the graph in relation to how the monthly cell phone cost has changed over the six month period. (2)
1.5.5 Why do you think the cell phone company includes this graph on the cell phone bill? (2)
1.61.6.1 Included on the graph above is an Average cost value of R368,28. Show by calculation
whether this cost value represents the mean or median cost. You must calculate both to make sure which average it represents. (7)
1.6.2 Determine the modal monthly cost value. (1)1.6.3 Explain why the modal cost value does not provide a realistic idea of the average
monthly cell phone cost over this six month period. (2)1.6.4 Why do you think it is useful for the owner of this cell phone to know their average
monthly cost? (2) [44]

©Via Afrika Publishers » Mathematical Literacy Grade 10 170
Section 1
Exam Papers
QUESTION2: PAINTINGPROJECT
A homeowner is preparing to varnish the wooden floor of the lounge in their house. The picture alongside shows the dimensions of the floor.2.1 One of the dimensions of the rectangular
portion (PART A) of the floor is missing. Use measurement and the given bar scale to show that this dimension is 4,75 m. (3)
2.2 Use a calculation to determine the diameter of the semi-circular portion of the floor (PART B). (2)
2.3 Now determine the area of the whole floor (PART A and PART B) that will need to be varnished. Round off the final answer to one decimal place.
Make sure to show all working and to set your work out clearly and carefully. (8)
Relevant formulae:
Area of a rectangle = length × breadth
Area of a semi-circle = ∂ × (radius of circle)2
________________ 2
2.4 For the varnish that the homeowner is going to use, 1 litre of varnish will cover approximately 10 m2 of the floor. 2.4.1 Why do you think the varnish tin states that 1 litre of varnish will cover
“approximately” 10 m2 rather than “exactly” 10 m2? (1)2.4.2 Determine how many full litres of varnish the homeowner will need for the floor. (3)2.4.3 In 2.4.2 you should have rounded the answer up to a full litre.
Explain why this is the case. (1)2.4.4 The varnish is available in the following tin sizes:
Tin Size Cost500 ml R45,50750 ml R65,00
What combination of the different tin sizes will give the cheapest option for buying the quantity of varnish needed? You must show all working and explain why this combination is the cheapest option. (4)
6 m
PART A
PART B
0.5 m
0 m 1 m 2 m

©Via Afrika Publishers » Mathematical Literacy Grade 10 171
Section 1
Exam Papers
2.5 The homeowner also wants to replace the skirting boards on the outside of the floor. 2.5.1 Calculate the perimeter of the floor to work out how many metres of skirting board
the builder will need. Round off your answer to the nearest full metre. (5)
Relevant formula:
Perimeter/circumference of a semi-circle = ∂ × diameter of a circle _________________ 2
2.5.2 The skirting board is sold in half-metre lengths that cost R22,50 per half-metre. Calculate how much the homeowner will have to pay to buy enough skirting board for the edges of the floor. (4)
[31]
---ENDOFPAPER2---

©Via Afrika Publishers » Mathematical Literacy Grade 10 172
Section 1
Exam Papers
PAPER 1 MEMORANDUM
QUESTION 1: PERSONAL FINANCE COMMENTS
1.1 Possible fixed expenses: Electricity; car repayment; car insurance Possible variable expenses: Petrol; food; clothing; toiletries;
entertainment; bank fees; cell phone. (2)
This is a level 1 question.The question is testing whether you can read expenditure items from a budget or income and expenditure statement, and whether you can distinguish between fixed and variable expenditure items.Content:– Topic: Finance– Section: Income, expenditure, profit/loss, income-and-expenditure statements and budgets.
1.2 Seven thousand eight hundred and twenty Randü (1)
This is a level 1 question.The question is testing whether you can express the number in word format.Content:– Topic: Numbers and calculations with numbers– Section: Number formats and conventions
1.3 Total expenditure = R7 610,00ü (1) This is a level 1 question.The question is testing whether you can add all the expenditure items correctly.Content:– Topic: Finance– Section: Income, expenditure, profit/loss, income-and-expenditure statements and budgets.
1.4 Money left over = income − expenditureü = R7 820,00 − R7 610,00 = R210,00ü (2)
This is a level 1 question.The question is testing whether you know that you need to subtract the total expenditure from the income, and whether you can do this correctly.Content:– Topic: Finance– Section: Income, expenditure, profit/loss, income-and-expenditure statements and budgets.
1.5 New salary = R7 820,00 + (10% ×R7 820,00)ü
= R7 820,00 +ü R782,00 = R8 602,00ü (3)
This is a level 2 question.The question is testing whether you can correctly increase a number by a certain percentage.Content:– Topic: Numbers and calculations with numbers– Section: Percentages

©Via Afrika Publishers » Mathematical Literacy Grade 10 173
Section 1
Exam Papers
1.61.6.1 Cents per kWh or cents per unit of
electricityü (1)
This is a level 1 question.The question is testing whether you can identify the units of the electricity tariff on the table.Content:– Topic: Finance– Section: Tariff systems
1.6.2 R0,9016/unit or R0,9016/kWhü (1) This is a level 1 question.The question is testing whether you can correctly convert the tariff from cent per kWh to Rand and cent per kWh.Content:– Topic: Numbers and calculations with numbers– Section: Number formats and conventions
1.6.3 Cost = R0,9016/unit ×ü 150,5 units ≈ R135,69ü (rounded off to two decimal places) (2)
This is a level 2 question.The question is testing whether you know how to find the cost correctly, and to give the answer to the nearest cent.Content:– Topic: Finance– Section: Tariff systems (calculate costs using given tariffs).
1.6.4 100 units ≈ R90,00ü 500 units ≈ R90,00 × 5ü = R450,00ü (Accurate answer is R450,00 ÷ R0,9016/
unit ≈ 499,1 units) (3)
This is a level 2 question.The question is testing whether you can use any appropriate method correctly to find the approximate number of electricity units used.Content:– Topic: Finance– Section: Tariff systems (“calculate costs using given tariffs”)
1.6.5 a. ≈ R800,00ü (accurate answer is R811,44) (1)
This is a level 1 question.The question is testing whether you can read the approximate value on the vertical axis of the graph, given a value on the horizontal axis.Content:– Topic: Patterns, relationships and representations– Section: Representations of relationships in tables, equations and graphs (“identify dependent variable values for given independent variable values”)

©Via Afrika Publishers » Mathematical Literacy Grade 10 174
Section 1
Exam Papers
b. ≈ 395 unitsüü (accurate answer is 388,2) (2)
This is a level 2 question.The question is testing whether you can read the approximate value on the horizontal axis of the graph, given a value on the vertical axis. In this case you have to use the scale of the horizontal axis effectively to closely approximate the correct value.Content:– Topic: Patterns, relationships and representations– Section: Representations of relationships in tables, equations and graphs (“identify independent variable values for given dependent variable values”)
[19]
QUESTION 2: BAKING MUFFINS (MEASUREMENT)
2.1.1 2 eggsü (1)2.1.2 210 gü (1)
These are level 1 questions.The questions are testing whether you can read the correct value from the recipe.Content:– Topic: Measurement
2.2
Ingredients Measurement on recipe
Cup, table-spoon or teaspoon measure
Cooking oil 125 ml 1 __ 2 cupü
Brown sugar 375 ml 1 + 1 __ 2 cupsü
Milk 500 ml 2 cups
Whole wheat flour 300 g
(500 ml - from 2.1 above) 2 cupsü
Cake flour 375 ml 1 + 1 __ 2 cups
Salt 5 ml 1 teaspoon
Vanilla Essence 5 ml 1 teaspoon
Bicarbonate of soda 10 ml 2 teaspoonsü
Raisins 250 ml 1 cup
(4)
This is a level 1 question.The question is testing whether you can convert between different units of measurement.Content:– Topic: Measurement– Section: Conversions

©Via Afrika Publishers » Mathematical Literacy Grade 10 175
Section 1
Exam Papers
2.3 (2)
375 mℓ
This is a level 1 question.The question is testing whether you can read a value on a measuring instrument.Content:– Topic: Measurement– Section: Measuring volume
2.4 The students want to make 150 muffins. 2.4.1 Milk needed for 1 batch (30 muffins)
= 500 mℓ
→ Milk needed for 1 muffin = 500 mℓ ÷ 30ü
→ Milk needed for 150 muffins = 500 mℓ ÷ 30 × 150ü
= 3 000 mℓ ü = 3 full litres ü (4)
This is a level 2 question.The question first requires you to calculate how much mℓ of milk they need for 150 muffins, and then to convert the mℓ to ℓ.Content:– Topic: Numbers and calculations with numbers– Section: Direct proportion– Topic: Measurement– Section: Conversions
2.4.2 Cost of buying 3 litres of milk = R18,99 + R9,49ü = R28,48ü (2)
This is a level 1 question.The question tests whether you know that you have to add the prices of 1 ℓ and 2 ℓ of milk, and if you can do that correctly.Content:– Topic: Numbers and calculations with numbers– Section: Operations on numbers and calculator skills
2.4.3 Quantity of raisins needed for 1 batch (30 muffins) = 250 ml (150 g)
150 g for 30 muffins → 300 g for 60 muffins → 450 g for 90 muffins → 600 g for 120 muffins → 750 g for 150 muffinsüü Since the raisins are sold in 200 g bags, the
number of bags needed is 4.ü (i.e. 200 g × 4 = 800 g) (3)
This is a level 3 question.The question tests three things: (1) whether you know you need to work with the 150 g of raisins and not the 250 ml, (2) whether, using any appropriate method, you can find or estimate how many gram of raisins are needed, and (3) to determine how many bags of raisins are needed.Content:– Topic: Numbers and calculations with numbers– Section: Operations on numbers and calculator skills
[17]

©Via Afrika Publishers » Mathematical Literacy Grade 10 176
Section 1
Exam Papers
QUESTION 3: THE LOFTUS VERSFELD SPORTS STADIUM (MAPWORK)3.13.1.1 12 gatesü (1)3.1.2 Upper levelü (1)3.1.3 Lower levelü (1)
3.2 3.2.1 Northern Standü, Upper Level.ü (2)3.2.2 Gate 4.ü (1)
3.1 and 3.2 are level 1 questions.The questions test whether you understand the symbols and notation used on the plan, and whether you can analyse the layout of the plan. Content:– Topic: Maps, plans and other representations of the physical world– Section: Maps
3.3 I (as well as II)ü and Z (as well as ZZ).ü (2) This is a level 2 question.The question requires you to compare the letters used to the alphabet, and find the letters that were not used. Content:– Topic: Maps, plans and other representations of the physical world– Section: Maps
3.43.4.1 Chile vs. Spainüü (2)3.4.2 20:30 (8:30 pm or half past 8 o’clock
in the evening)ü (1)3.4.3 Seating Stand (Block) J.ü (1)3.4.4 Gate 1ü (1)
3.4.1 to 3.4.4 are level 1 questions.The questions test whether you can read information from the ticket. Content:– Topic: Maps, plans and other representations of the physical world– Section: Maps
3.4.5 The seat is seat number (#) 13 in row M.ü To find this seat they will probably have
to locate Row M first and then walk along that row until they get to seat 13.ü (2)
This is a level 2 question.The question requires you to give directions to get to the seat. Content:– Topic: Maps, plans and other representations of the physical world– Section: Maps
[15]

©Via Afrika Publishers » Mathematical Literacy Grade 10 177
Section 1
Exam Papers
QUESTION 4: TESTS MARKS (DATA HANDLING AND PROBABILITY)
4.14.1.1 50 marksü (1)4.1.2 25ü (1)4.1.3 Thembi Malevuü (48 marks or 96%) (1)4.1.4 Arusha Patelü (7 marks or 14%) (1)4.1.5 Thuli Aphaneü and
Cornelius Vermeulenü (2)
4.1.1 to 4.1.5 are level 1 questions.The questions test whether you can read information from the table. Content:– Topic: Data Handling– Section: Interpreting and analysing data
4.2 John Abrahams’ mark as a % = 36ü ÷ 50ü × 100ü = 72% (3)
This is a level 2 question.The question tests whether you can read information from the table, and then convert the value to a percentage. Content:– Topic: Numbers and calculations with numbers– Section: Percentages
4.34.3.1 The list is sorted alphabetically according
to the surnames of the learners.ü (1)
This is a level 1 question.The question tests whether you can interpret the data and determine how it is sorted. Content:– Topic: Data Handling– Section: Classifying and organising data
4.3.2 üü (2)
Name Surname Mark (/50) %Arusha Patel 7 14
Thomas O’Brien 35 70
Thuli Aphane 12 24
Jerome Simmonds 35 70
Cornelius Vermeulen 12 24
Rebecca Welsford 35 70
Hendrik Potgieter 15 30
Sara West 35 70
Xolile Taba 18 36
John Abrahams 36 72
Jillian Thomas 22 44
Sophia Ramaphosa 38 76
Damon Donovan 24 48
Thandi Hlela 39 78
Muneeb Kahn 25 50
Mthandeni Ndawonde 39 78
Bongani Simelani 26 52
Ishmael Chetty 40 80
Janine van Breda 27 54
Themba Radebe 41 82
This is a level 2 question.The question tests whether you can sort (arrange) the data from smallest to biggest. Content:– Topic: Data Handling– Section: Classifying and organising data

©Via Afrika Publishers » Mathematical Literacy Grade 10 178
Section 1
Exam Papers
Elizabeth North 29 58
Gabriel Thomson 43 86
Khosi Ndaba 30 60
Thembi Malevu 48 96
Gugu Hlatswayo 35 70
4.4 üü (2)
Mark interval
No. of learners who scored marks in this interval
Mark interval
No. of learners who scored marks in this interval
0–9% 0 50–59% 4
10–19% 1 60–69% 1
20–29% 2 70–79% 9
30–39% 2 80–89% 3
40–49% 2 90–100% 1
This is a level 1 question.The question tests whether you can group the data, using given class intervals. Content:– Topic: Data Handling– Section: Classifying and organising data
4.5 (3)
üü plotting the bars accuratelyü labels on the axis and title for the chart (3)
This is a level 2 question.The question tests whether you can represent the data on a bar graph. Note that a mark is allocated for labels and title.Content:– Topic: Data Handling– Section: Representing data
4.6 Average (mean) = sum of all of the marks ÷ no. of learners in the class = 746ü ÷ 25 = 29,84 marksü (out of 50) (≈ 60%) (3)
This is a level 2 question.You must first decide on using the mean as an appropriate measure, and then calculate the mean, giving the value rounded off to 2 dec. places. Content:– Topic: Data Handling– Section: Summarising data

©Via Afrika Publishers » Mathematical Literacy Grade 10 179
Section 1
Exam Papers
4.7 4.7.1 Possible outcomes: (Heads ; Heads)
(Heads ; Tails) (Tails ; Heads) (Tails ; Tails)üü (2)
This is a level 1 question.The question tests whether you can express the possible outcomes. Content:– Topic: Probability– Section: Expressions of probability
4.7.2 Possible ways in which the coins can land on heads and tails (any order)
= (Heads ; Tails) & (Tails ; Heads) = 2 __ 4 üü (50%) (2)
This is a level 2 question.The question tests whether you can calculate a probability. Content:– Topic: Probability– Section: Prediction
[24]

©Via Afrika Publishers » Mathematical Literacy Grade 10 180
Section 1
Exam Papers
PAPER 2 MEMORANDUM
QUESTION 1: MAKING SENSE OF A CELL PHONE BILL COMMENTS
1.1 Invoice Total = Airtime + Subscription + Total of Otherü
= R270,48 + R200,00 + R34,70ü= R505,18 (2)
This is a level 2 question.The question tests whether you make sense of the cell phone bill, and can identify which items are added to give the total amount. Content:– Topic: Finance– Section: Financial documents
1.2 VAT (on Airtime amount) = 14%ü × R237,26ü = R33,22 (2)
This is a level 2 question.The question tests whether you know that VAT is 14%, and can calculate the value of VAT for a given amount. Content:– Topic: Numbers and calculations with numbers– Section: Percentages
1.31.3.1 Start time = 11:54 Call length = 9 min 27 sec → End time = 12ü:03ü (i.e. approximately
9 minutes after the call started) (2)
This is a level 2 question.The question requires you to add the duration of the call to the start time. Content:– Topic: Measurement– Section: Time
1.3.2 Call length = 9 min 27 sec = (9 × 60 seconds)ü + 27 seconds= 540 seconds + 27 seconds = 567 secü (2)
This is a level 2 question.The question requires you to convert the duration of the call into seconds. Content:– Topic: Measurement– Section: Time
1.3.3 Call length = 284 sec Call cost = R11,83
→ Call cost per second = R11,83 ÷ 284/secü= R0,041655ü (to 6 decimal places)
Call cost per minute = R0,041655/sec × 60 sec/minü≈ R2,50 (rounded off to Rand and cents) (4)
This is a level 3 question.The question requires you to use any call’s information, calculate the call cost per second, convert it to the call cost per minute, and then round it off to the nearest cent. Note: do all the calculations with the full value displayed on your calculator screen, and only round off the final answer. Content:– Topic: Measurement and Finance– Section: Time, Financial documents and Tariff systems

©Via Afrika Publishers » Mathematical Literacy Grade 10 181
Section 1
Exam Papers
1.3.4 Per second tariff ≈ R0,041655/sec → Cost of a call lasting for 284 sec = R0,041655/sec ×ü 284 secü = R11,83ü (rounded off to Rand and cents) (3)
This is a level 2 question.The question tests whether you can use the calculated tariff to calculate the cost. Content:– Topic: Finance– Section: Tariff systems
1.41.4.1 Total monthly cost =
R505,18 (from the bill; or found by adding together all of the values on the pie chart) % of total that Airtime represents = R270,48 ÷ü R505,18ü × 100ü= 53,541% ≈ 53,5% (rounded off to one decimal place) (3)
This is a level 3 question.The question tests whether you can calculate a percentage, by using the appropriate amounts. Content:– Topic: Finance and Numbers and calculations with numbers– Section: Financial documents and percentages
1.4.2 The information in the rectangular blocks shows the percentage of the Airtime cost only that is made up of talk time (i.e. calls), SMS’s and Internet transactions üü (2)
This is a level 4 question.The question goes beyond the information given on the bill and the pie chart, and tests whether you can interpret the information on the rectangular blocks in the context of a cell phone contract. Content:– Topic: Finance – Section: Financial documents
1.4.3 Talktime = 83% × Airtime = 83% × R270,48üü≈ R224,50ü (rounded off to Rand and cents) (3)
This is a level 2 question.The question tests whether you can calculate a percentage of a correctly chosen value. Content:– Topic: Finance and Numbers and calculations with numbers– Section: Financial documents and percentages
1.51.5.1 August and Septemberüü (2)1.5.2 Januaryü (1)
1.5.1 and 1.5.2 are level 2 questions.The questions test whether you can recognise maximum and minimum points on the graph. Content:– Topic: Patterns, relationships and representations– Section: Making sense of graphs that tell a story
1.5.3 The values are discrete data values.ü The monthly cost value for each month are discrete values showing the total cost for the month. As such, it is not possible to use the values on the graph to estimate costs during the month.ü (2)
This is a level 4 question.The question tests whether you recognise that the data is discrete, and whether you know that discrete data is represented with a dotted line. Content:– Topic: Patterns, relationships and representations– Section: Representations of relationships in tables, equations and graphs

©Via Afrika Publishers » Mathematical Literacy Grade 10 182
Section 1
Exam Papers
1.5.4 Although cell phone costs remained steady (the same) for the first two monthsü, the general trend shows an increase in cell phone costs.ü These costs increased slowly at first, but then quite rapidly, so that by January the costs have more than doubled since August. (2)
This is a level 4 question.The question tests whether you recognise that the data is discrete, and whether you know that discrete data is represented with a dotted line.Content:– Topic: Patterns, relationships and representations– Section: Making sense of graphs that tell a story
1.5.5 The graph provides the cell phone user with an idea of how the amount that they are spending on their cell phone per month is changing over time.üü (2)
This is a level 4 question.The question tests whether you can form and express a suitable opinion. Content:– Topic: Patterns, relationships and representations– Section: Representations of relationships in tables, equations and graphs
1.61.6.1 Mean cost
= (R243,70 + R243,70 + R303,45 + R478,14 + R435,52 + R505,18)ü÷ 6= R2 209,69 ÷ 6 ≈ R368,28ü (which is the same as the average cost on the graph)ü
Median cost: R243,70 R243,70 R303,45 R435,52
R478,14 R505,18ü
(7)
This is a level 3 question.The question tests whether you can calculate both the mean and the median values of the appropriate amounts. Content:– Topic: Data handling– Section: Summarising data
1.6.2 Modal cost = cost that occurs most often = R243,70ü. (1)
This is a level 2 question.The question tests whether you can determine the modal value.Content:– Topic: Data handling– Section: Summarising data
1.6.3 Clearly the modal cost does not represent an average for the six months. This is because the modal cost is much lower than all of the other costs and gives the impression that the monthly cost value is quite low, when in reality the monthly cost is commonly much higher than this modal cost.üü (2)
This is a level 4 question.The question tests whether you can compare the modal value with the data, and explain why this measure of central tendency does not give an accurate picture of the data.Content:– Topic: Data handling– Section: Interpreting and analysing data
Median = (R303,45 + R435,52) ÷ 2ü = R369,49ü
©Via Afrika Publishers » Mathematical Literacy Grade 10 183
Section 1
Exam Papers
1.6.4 As with the graph, the average cost gives the user an idea of how much they are spending on average over a period of time. This is especially useful because of how much the monthly cost changes and varies over time.üü (2)
This is a level 4 question.The question tests whether you can form and express a suitable opinion. Content:– Topic: Data handling– Section: Summarising data
[44]

©Via Afrika Publishers » Mathematical Literacy Grade 10 184
Section 1
Exam Papers
QUESTION2:PAINTINGPROJECT
2.1 Measuring on the bar scale: 1,6 cm = 2 m → 1 cm = 1,25 mü Length measured on plan (cm) = 3,8 cmü Actual length (m) = (3,8 × 1,25) mü = 4,75
m (3)
This is a level 3 question.The question requires you to identify that the width of Part A is missing, then to measure it using a ruler, and then to use the given bar scale to determine the actual width. Content:– Topic: Maps, plans and other representations of the physical world– Section: Scale
2.2 Diameter = 6 m − 0,5 m − 0,5 mü = 5 mü (2) This is a level 2 question.The question tests whether you can make sense of the drawing and use the given measurements to find the diameter. Content:– Topic: Maps, plans and other representations of the physical world– Section: Plans (floor plans)
2.3 Area Part A = length × breadth = 6 m × 4,75 mü = 28,5ü m2ü (units)
Area Part B = ∂ × (radius of circle)2
________________ 2
= π × (5 m ÷ 2)2
__________ 2 ü = π × (2,5 m)2
_________ 2 ü
= 3,42 × 6,25 m2
___________ 2
= 9,819 m2ü (rounded off to three decimal places)
Total area = 28,5 m2 + 9,819 m2ü ≈ 38,3 m2ü (8)
This is a level 4 question.The question tests whether you can use the appropriate formulas and correctly calculate the area of a combined shape, and round off the final answer correctly to one decimal place. Content:– Topic: Measurement– Section: Perimeter, area and volume
2.42.4.1 This is a guideline, but there is no
guarantee that precisely 1 litre of varnish will cover 10 m2 of floor. This depends on the type of wood that the floor is made out of, how rough or smooth the floor is, and even how hot the air temperature is.ü (1)
This is a level 4 question.The question requires you to express an informed opinion. Content:– Topic: Measurement– Section: Perimeter, area and volume
2.4.2 Total area ≈ 38,3 m2
Paint coverage guideline: 1 litre covers 10 m2
→ For 30 m2, 3 litres would be needed.ü→ For 40 m2, 4 litres would be needed.ü
So, for 38,3 m2, 4 full litres will be needed. (3)
This is a level 2 question.The solution method offered in the memorandum is one of a number of possible methods.Content:– Topic: Measurement– Section: Perimeter, area and volume

©Via Afrika Publishers » Mathematical Literacy Grade 10 185
Section 1
Exam Papers
2.4.3 It is always a good idea to buy more paint than the precise quantity needed because there is always wastage and spillage which occurs when painting and so extra paint is often needed.ü (1)
This is a level 4 question.The question requires you to express an informed opinion. Content:– Topic: Measurement – Section: Perimeter, area and volume
2.4.4 Possible combinations to give 4 litres:
500 ml tins
750 ml tins Cost
8 --- R45,50/tin × 8 tins = R364,00
2 4
Cost = R45,50/tin × 2 tins + R65,00/tin × 4 tins
= R91,00 + R260,00 = R351,00üü
--- 6 (4,5 litres)
Cost = R65,00/tin × 6 tins = R390,00
5 2
Cost = R45,50/tin × 5 tins + R65,00/tin × 2 tins
= R227,50 + R130,00 = R357,50
üü showing other combinations So, the cheapest combination is four
750 mℓ tins & two 500 mℓ tins. (4)
This is a level 4 question.The question requires you to consider various options, and to decide which option is best. Content:– Topic: Measurement – Section: Perimeter, area and volume
2.52.5.1 Perimeter of Part A = 6 m + 4,75 m + 0,5 m + 0,5 mü = 11,75 mü Perimeter of Part B = circumference of semi circle
= ∂ × diameter of circle ________________ 2
∂ × 5 m ______ 2 ü = 3,142 × 5 m
_________ 2
= 7,855 mü Total perimeter = 11,75 m + 7,855 m = 19,605 m ≈ 20 full metresü (5)
This is a level 3 question.The question requires you to calculate the perimeter of the room, using the given formula, and the values you were given as well as those you calculated earlier, and to round off the final answer to the nearest meter.Content:– Topic: Measurement – Section: Perimeter, area and volume
2.5.2 No. of half-metre lengths needed = 40üü(i.e. 20 × 0,5 = 40)
Cost = R22,50/half-metre × 40 half-metresü
= R900,00ü (4)
This is a level 3 question.The question requires you to convert the number of metres to half-metres, and to use this value to calculate the cost. Content:– Topic: Measurement– Section: Perimeter, area and volume
[31]

©Via Afrika Publishers » Mathematical Literacy Grade 10 186
Section 1
Glossary
This Glossary is made up of key terms in the Study Guide, as well as important and useful terms for studying Mathematical Literacy
A
analogue An analogue measuring instrument, such as an analogue clock or scale, displays values by the position of a needle or hands on a dial
approximating To round a value to the nearest convenient value
area The amount of two-dimensional (2-D) space occupied by a 2-D shape
ascending order From low to high
assembly diagrams Diagrams showing you how to assemble (put together) something
assembly instructions Instructions telling you how to assemble (put together) something
average See: “mean”
average rate Rate is the result of comparing one variable quantity (such as distance) by another variable quantity (such as time) through division (e.g. to produce speed). Average rate (such as average speed) is obtained by dividing the total distance travelled by the total time taken (even though the speed may have been slower or faster during the journey) (see also: constant rate)
B
bank fees Fees charged by banks on transactions that take place on an account
bank statement A document, compiled by the bank, that provides a summary of the transactions that have occurred on an account during a specific period.
bank transactions Withdrawals from and deposits into an account, and payments from one account to another.
bar graph A diagram that displays data, which contain discrete values, using vertical or horisontal bars
bar scale A picture that shows how far the actual distance of a measurement on a map will be
bias Bias is when the data collected gives a result that is different to the actual situation. Bias occurs when data is not collected properly, e.g. from a non-representative sample.
bi-modal A bi-modal data set has two modes (see also: mode)
broken line graph A diagram used to display data with no specific predictable trend in the data (as opposed to “line graph”)
budget A description of planned, projected or expected income and expenditure values

©Via Afrika Publishers » Mathematical Literacy Grade 10 187
Section 1
Glossary
C
capacity A value that indicates how much liquid a container can hold. It is the same as the volume of a container
categorical data Data that are not numbers, e.g. car colours or types of transport
chance The chance or likelihood of something happening can be expressed as a value or percentage (see also: probability)
circumference The distance along the outer edge of a circle
class intervals Class intervals groups data into different categories or groups
constant rate Rate is the result of comparing one variable quantity by another variable quantity through division. A constant rate does not change during the activity (see also: average rate)
constant relationship A constant or fixed relationship is a relationship in which the value of one variable remains the same irrespective of the value of the other variable (see also: fixed relationship)
context A real-life situation
continuous data Data obtained through measurement. These include decimal or fractional values (as opposed to “discrete data” that can only have whole-numbered values)
continuous variable A variable that can have any value (as opposed to “discrete variables” that can only have whole-numbered values)
contract tariff The cost at which a service is provided in a contract (see also: tariff)
conversion factors Values used to convert (switch) quantities from one measuring system to another
credit Money that has been paid
current expenditure Expenses that are presently made (as opposed to “estimated future expenditure”)
current income Income that is presently earned (as opposed to “estimated future income”)
D
data Information that can be described numerically
debit Money that is owed
debit order An instruction to the bank to deduct a varying amount from an account every month

©Via Afrika Publishers » Mathematical Literacy Grade 10 188
Section 1
Glossary
decimal marker A comma or point to separate whole number values and decimal values
deficit Money spent is more than the money earned (see also: loss)
degrees Celsius Units in which temperature is measured in most countries
dependent variable The variable in a relationship of which the values depend on the values of the other variable
deposit Money that is being put into an account
descending order From high to low
design plans Plans that show the different parts of an item that is to be manufactured, e.g. a dress
diameter The distance from the edge of a circle, through the centre of the circle, to the opposite edge of the circle
digital A digital measuring instrument, such as a digital clock or scale, displays values by means of numbers (digits)
direct proportion Two quantities that are in direct proportion increase or decrease by the same factor
directions A set of written or verbal instructions that explain how to travel from one place to another
discrete data Values that can only be whole numbers (as opposed to “continuous data” that may include decimal or fractional values)
discrete variable A variable that can only have whole-numbered values (as opposed to “continuous” variables that can have any value)
distance How far it is from one place to another, e.g. from one town to another. Usually measured in kilometers, and does not have to be in a straight line
E
elapsed time Time that has passed since the start of an event
Elevation plans Diagrams that show how objects or structures (e.g. a house) look like from the side
equivalent fractions Fractions that look different, but which have the same value, e.g. 1 _ 2 and 4 __ 8
equivalent ratios Ratios that look different, but which have the same value, e.g. 1:2 and 4:8

©Via Afrika Publishers » Mathematical Literacy Grade 10 189
Section 1
Glossary
estimate To make an educated guess what the answer of a calculation will be without actually calculating accurately, or what the value of a measurement (e.g. length) will be without actually measuring
estimated costs The values of future expenses which are obtained by means of an educated guess
expenditure Money that is spent in order to meet certain costs
F
financial documents Documents showing financial information, such as till slips and account statements
fixed income/expense Income or expense that does not change from one month to the next, e.g. salary or rent
fixed relationship A constant or fixed relationship is a relationship in which the value of one variable remains the same irrespective of the value of the other variable (see also: constant relationship)
frequency The number of values of a particular size or items of a particular type in a data set
G
general trend A regularity in the data, e.g. the values are generally increasing (or decreasing) over time
H
histogram A diagram that displays continuous data, which has been grouped into class intervals, using vertical bars with no gaps between them
I
income Money earned, e.g. a salary or a wage
independent variable The variable in a relationship of which the values do not depend on the values of the other variable
interest Money that is earned by depositing or investing money, e.g. at a bank, or money that is paid for borrowing money, e.g. from a bank
interest rate A value, expressed as a percentage, that is used to calculate the interest to be paid or earned
interviews When data is collected personally and verbally from one person by another person
inverse proportion If two quantities are in inverse proportion, then the one quantity decreases by the same factor by which the other quantity increases

©Via Afrika Publishers » Mathematical Literacy Grade 10 190
Section 1
Glossary
L
layout map A map that shows the position and/or layout of a venue or building as seen from above
layout plans A plan that shows the layout of a building or structure as seen from above. Also known as a floor plan
length The measurement between two points, in a straight line, e.g. the length of a room
likelihood The likelihood or chance of something happening can be expressed as a value or percentage (see also: probability)
line graph A diagram used to display data with a consistent trend, i.e. the data is generally increasing or decreasing (as opposed to “broken line graph”)
linear relationship In a linear relationship, a constant increase in one variable results in a corresponding constant increase in the other variable
loss Money spent is more than the money earned (see also: deficit)
M
mass The mass of an object is an indication of how heavy the object is. Also known as weight
mean A value of central tendency. Determined as follows: Mean = sum of all the values in a data set ____________________________ total number of values in the data set
measures of central tendency Mean, median and mode. These are single values that give an indication of the “middle”, “centre” or “average” of the data set
measures of spread Range. This is a single value that gives an indication of how spread out or closely grouped the values in a data set are
measuring Determining the value of a quantity directly, e.g. reading the length of an object from a ruler or the mass of an object from a scale
median A value of central tendency. This is the middle-most value in a data set which is arranged in ascending or descending order
metric system A measuring system for distance, mass and volume used in most countries. Units are multiples of 10 of each other
mode A value of central tendency. This is the value that occurs the most in a data set
N
needs Things a person needs to spend money on because they are essential to running a household or to function in daily life (as opposed to “wants”)
©Via Afrika Publishers » Mathematical Literacy Grade 10 191
Section 1
Glossary
non-linear relationship A relationship where a constant change in one variable will result in a varying change in the other variable
number format Ways in which numbers can be written, e.g. whole numbers, decimals, fractions, in words or as percentage
number scale A scale, used with maps and plans, that is written in ratio format, e.g. 1:200
numerical data Data (information) that consists of numbers
O
observations A method through which data can be collected by observing (watching), often accompanied by a recording sheet
occasional income Money not earned regularly, but only occasionally, e.g. overtime payment
operations Addition, subtraction, multiplication and division
outcomes The ending or conclusion of an event, e.g. tossing a coin has two possible outcomes, namely heads or tails
P
packaging Fitting a certain quantity of an item into a particular space, e.g. cans into a box
packaging patterns A technique used to determine how many of an item can fit into a particular space, by thinking of the items in terms of rows, columns and levels
per Used when dealing with rates. It means: “for every one”. E.g. kilometers per hour
percentage change The percentage by which a particular value has increased or decreased from an original value
percentage discount The discount on an item, expressed as a percentage
perimeter (circles) The distance along the outer edge of a circle. (See also: circumference)
perimeter (rectangles, squares, triangles) The distance along the outer edge of the shape. Also: the sum of the lengths of the sides of the shape
pi The value obtained when dividing the circumference of a circle by its diameter
pie chart A diagram that displays data in the form of a circle. Useful to show the size of a part of the whole
population The entire group about which data is collected

©Via Afrika Publishers » Mathematical Literacy Grade 10 192
Section 1
Glossary
prediction A prediction in the context of probability indicates the likelihood of something happening; however, it does not mean that it will actually happen
prepaid tariff The cost at which a service is provided for which payment is made in advance (see also: tariff)
probability The value that describes the chance or likelihood that something will happen
profit Money earned (i.e. income) is more than the money spent or owed (i.e. expenditure)
Q
questionnaires An instrument, containing questions, used to collect information
R
radius The distance from the centre of a circle to the edge of the circle. Equal to half the diameter
random events Activities for which there are a number of different possible endings, e.g. tossing a coin
range The difference between the highest value and the lowest value in a data set
relationship The link between two variables. Can be shown by means of a table, graph or equation
relative frequency The value of number of times the desired outcome occurs _________________________________ number of times the event is repeated , which is calculated by actually carrying out an experiment
relative position A description of an object on a layout map in relation (relative) to other objects
S
sample A collection of people or items chosen from the population to represent the population
scale An instrument that is used to measure the mass (weight) of an object. Also: an indication of how measurements on a map or plan relates to the actual corresponding measurements
simulation To carry out something without physically doing it, e.g. by using a computer
skewed data Data is skewed if the sample from which the data is collected is not representative of the population
solve In general, solving an equation means to find the value of the unknown that will satisfy the equation. In the context of a relationship between two variables, solving

©Via Afrika Publishers » Mathematical Literacy Grade 10 193
Section 1
Glossary
an equation means to replace the dependent variable with a value and then find the value of the independent variable
sort Put data in a particular order, e.g. into categories or from low to high
statement A document that provides a summary of the transactions (amount of money paid and/or a description of the items bought) for purchases or services over a period of time
statement of income and expenditure A document that provides a summary and description of the money earned and spent over a period of time
stop order An instruction to the bank to deduct a fixed amount from an account every month
substitution To replace a variable by a specific value. In the context of a relationship between two variables, substitution means to replace the independent variable with a specific value to determine the value of the dependent variable
surplus See: profit
survey The process of collecting data from a population or a sample
T
tallies Counting marks, which are used to keep count of how many times a particular item or value appears in a data set
tariff A fee that is charged for using a particular service, e.g. to phone using a cell phone
theoretical probability The theoretical probability of an event is determined by repeating the event a large number of times and observing what value the relative frequency of the event approaches. (See also: relative frequency)
thermometer An instrument used to measure temperature
thousand separator Spaces between the digits of a number to indicate groupings of thousands, e.g. 1 362 957
tree diagrams A picture, drawn in the shape of a tree, that shows all possible outcomes of an event or a combination of events.
two-way tables A diagram used for describing and comparing all possible outcomes for two or more events
U
unit form A ratio is written in unit form if one of the values in the ratio is expressed as a unit, that is, as 1, e.g. 1:200

©Via Afrika Publishers » Mathematical Literacy Grade 10 194
Section 1
Glossary
unit rate A unit rate is a rate where one of the quantities in the rate is written as a unit, that is, as 1
V
variable income/expense Income or expense that changes (or varies) over a period of time
VAT Value added tax. A tax that is levied by government on most goods and services
VAT-inclusive The price of goods or services is VAT-inclusive if it includes the VAT
volume The amount of three dimensional (3-D) space occupied by a 3-D object
W
wants Things that a person might want or like to have, but which are not essential to function in daily life or to run a household (as opposed to “needs”)
withdrawal Taking money out of an account