Non-hydrostatic Numerical Model Study on Tropical Mesoscale System During SCOUT DARWIN Campaign
Annales Geophysicae, 23, 1673–1683, 2005SRef-ID: 1432-0576/ag/2005-23-1673© European Geosciences Union 2005
AnnalesGeophysicae
VHF/UHF radar observations of tropical mesoscale convectivesystems over southern India
Karanam Kishore Kumar 1, A. R. Jain2, and D. Narayana Rao3
1Space Physics Laboratory, Vikram Sarabhai Space Center, Trivandrum 695022, India2National Physical Laboratory, New Delhi, India3National MST Radar Facility, P.B. 123, Tirupati-517502, India
Received: 9 December 2003 – Revised: 4 January 2005 – Accepted: 10 May 2005 – Published: 28 July 2005
Abstract. Several campaigns have been carried out to studythe convective systems over Gadanki (13.5◦ N, 79.2◦ E), atropical station in India, using VHF and UHF radars. Theheight-time sections of several convective systems are inves-tigated in detail to study reflectivity, turbulence and verticalvelocity structure. Structure and dynamics of the convectivesystems are the main objectives of these campaigns. The ob-served systems are classified into single- and multi-cell sys-tems. It has been observed that most of the convective sys-tems at this latitude are multi-cellular in nature. Simultane-ous VHF and UHF radar observations are used to classify theobserved precipitating systems as convective, intermediaryand stratiform regions. Composite height profiles of verticalvelocities in these regions were obtained and the same werecompared with the profiles obtained at other geographical lo-cations. These composite profiles of vertical velocity in theconvective regions have shown their peaks in the mid tropo-sphere, indicating that the maximum latent heat is being re-leased at those heights. These profiles are very important fornumerical simulations of the convective systems, which varysignificantly from one geographical location to the other.
Keywords. Meteorology and atmospheric dynamics(Mesoscale meteorology; Convective processes) – Radioscience (Remote sensing)
1 Introduction
A vast majority of recent observational studies of mesoscalesystems have been signifying a renewed interest in tropicalmesoscale convective systems (TMCS) and their impact ongeneral atmospheric circulation and hence the global climate.Tropical convection transports and redistributes the large-scale fields of heat, moisture, mass and momentum through-out the atmosphere. The redistribution of various quanti-ties affects the troposphere composition and its chemistry,
Correspondence to:Karanam Kishore Kumar([email protected])
especially the tropospheric air quality. They also alter theflow fields and thermodynamic stratification within the atmo-sphere, such that they affect subsequent convective activity.
The energy transformations associated with the change inphase of water in these systems, as well as the strong updraftsand down drafts, which often extend throughout the tropo-sphere, can have an important effect on the dynamics andenergetics of large-scale atmospheric systems. Hartmann etal. (1984) showed that the walker circulation is sensitive tothe vertical distribution of latent heat release in the TMCS.The latent heat released from precipitation gives rise to as-cending motion in the tropical atmosphere. In fact, virtuallyall ascents in the tropics are associated with deep convec-tion. Such an ascent is closely tied to horizontal flows inthe tropics by mass continuity. So, deep convective flowsaffect the atmosphere far from the convection itself. Heat re-leased in these systems plays a fundamental role in heating ofthe large-scale environment (Houze, 1989) and can generatemesoscale circulations (De Maria, 1985; Hack and Schubert,1990; Johnson, 1992) which are very important from a cli-matological standpoint. Houze (1982, 1989) showed that thenet heating produced by a mature TMCS is predominantlyin the upper troposphere, with little net heating below 4 km.The stratiform region and cumulus towers within a TMCSboth contribute to the heating profile. In addition, the cloudcover associated with convection strongly affects both sur-face heating and other radiative processes. Mapes (1993)studied the linear transient response of a stratified fluid layerto a localized heat source. He idealized the vertical profileof diabatic heating as the sum of a convective componentmaximum in the mid troposphere and a stratiform compo-nent with heating in the upper troposphere and cooling inthe lower troposphere. He suggested that this would fa-vor additional convection in the vicinity of old convectiondue to increased column-integrated Convective Available Po-tential Energy (CAPE) and decreased convective inhibition.Nicholls et al. (1991) reported on thermally forced gravitywaves, which are of prime interest to the atmospheric com-munity. To the present day, the exact representation of the
1674 K. Kishore Kumar et al.: VHF/UHF radar observations
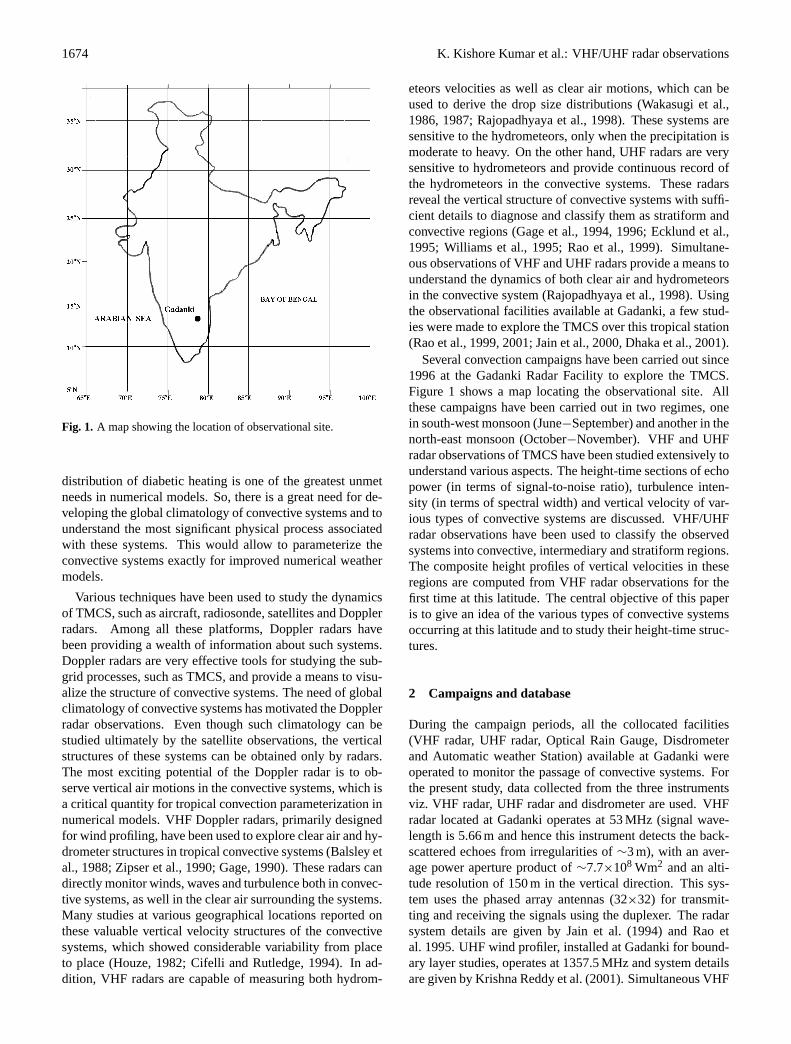
Fig. 1. A map showing the location of observational site.
distribution of diabetic heating is one of the greatest unmetneeds in numerical models. So, there is a great need for de-veloping the global climatology of convective systems and tounderstand the most significant physical process associatedwith these systems. This would allow to parameterize theconvective systems exactly for improved numerical weathermodels.
Various techniques have been used to study the dynamicsof TMCS, such as aircraft, radiosonde, satellites and Dopplerradars. Among all these platforms, Doppler radars havebeen providing a wealth of information about such systems.Doppler radars are very effective tools for studying the sub-grid processes, such as TMCS, and provide a means to visu-alize the structure of convective systems. The need of globalclimatology of convective systems has motivated the Dopplerradar observations. Even though such climatology can bestudied ultimately by the satellite observations, the verticalstructures of these systems can be obtained only by radars.The most exciting potential of the Doppler radar is to ob-serve vertical air motions in the convective systems, which isa critical quantity for tropical convection parameterization innumerical models. VHF Doppler radars, primarily designedfor wind profiling, have been used to explore clear air and hy-drometer structures in tropical convective systems (Balsley etal., 1988; Zipser et al., 1990; Gage, 1990). These radars candirectly monitor winds, waves and turbulence both in convec-tive systems, as well in the clear air surrounding the systems.Many studies at various geographical locations reported onthese valuable vertical velocity structures of the convectivesystems, which showed considerable variability from placeto place (Houze, 1982; Cifelli and Rutledge, 1994). In ad-dition, VHF radars are capable of measuring both hydrom-
eteors velocities as well as clear air motions, which can beused to derive the drop size distributions (Wakasugi et al.,1986, 1987; Rajopadhyaya et al., 1998). These systems aresensitive to the hydrometeors, only when the precipitation ismoderate to heavy. On the other hand, UHF radars are verysensitive to hydrometeors and provide continuous record ofthe hydrometeors in the convective systems. These radarsreveal the vertical structure of convective systems with suffi-cient details to diagnose and classify them as stratiform andconvective regions (Gage et al., 1994, 1996; Ecklund et al.,1995; Williams et al., 1995; Rao et al., 1999). Simultane-ous observations of VHF and UHF radars provide a means tounderstand the dynamics of both clear air and hydrometeorsin the convective system (Rajopadhyaya et al., 1998). Usingthe observational facilities available at Gadanki, a few stud-ies were made to explore the TMCS over this tropical station(Rao et al., 1999, 2001; Jain et al., 2000, Dhaka et al., 2001).
Several convection campaigns have been carried out since1996 at the Gadanki Radar Facility to explore the TMCS.Figure 1 shows a map locating the observational site. Allthese campaigns have been carried out in two regimes, onein south-west monsoon (June−September) and another in thenorth-east monsoon (October−November). VHF and UHFradar observations of TMCS have been studied extensively tounderstand various aspects. The height-time sections of echopower (in terms of signal-to-noise ratio), turbulence inten-sity (in terms of spectral width) and vertical velocity of var-ious types of convective systems are discussed. VHF/UHFradar observations have been used to classify the observedsystems into convective, intermediary and stratiform regions.The composite height profiles of vertical velocities in theseregions are computed from VHF radar observations for thefirst time at this latitude. The central objective of this paperis to give an idea of the various types of convective systemsoccurring at this latitude and to study their height-time struc-tures.
2 Campaigns and database
During the campaign periods, all the collocated facilities(VHF radar, UHF radar, Optical Rain Gauge, Disdrometerand Automatic weather Station) available at Gadanki wereoperated to monitor the passage of convective systems. Forthe present study, data collected from the three instrumentsviz. VHF radar, UHF radar and disdrometer are used. VHFradar located at Gadanki operates at 53 MHz (signal wave-length is 5.66 m and hence this instrument detects the back-scattered echoes from irregularities of∼3 m), with an aver-age power aperture product of∼7.7×10⁸ Wm2 and an alti-tude resolution of 150 m in the vertical direction. This sys-tem uses the phased array antennas (32×32) for transmit-ting and receiving the signals using the duplexer. The radarsystem details are given by Jain et al. (1994) and Rao etal. 1995. UHF wind profiler, installed at Gadanki for bound-ary layer studies, operates at 1357.5 MHz and system detailsare given by Krishna Reddy et al. (2001). Simultaneous VHF
K. Kishore Kumar et al.: VHF/UHF radar observations 1675
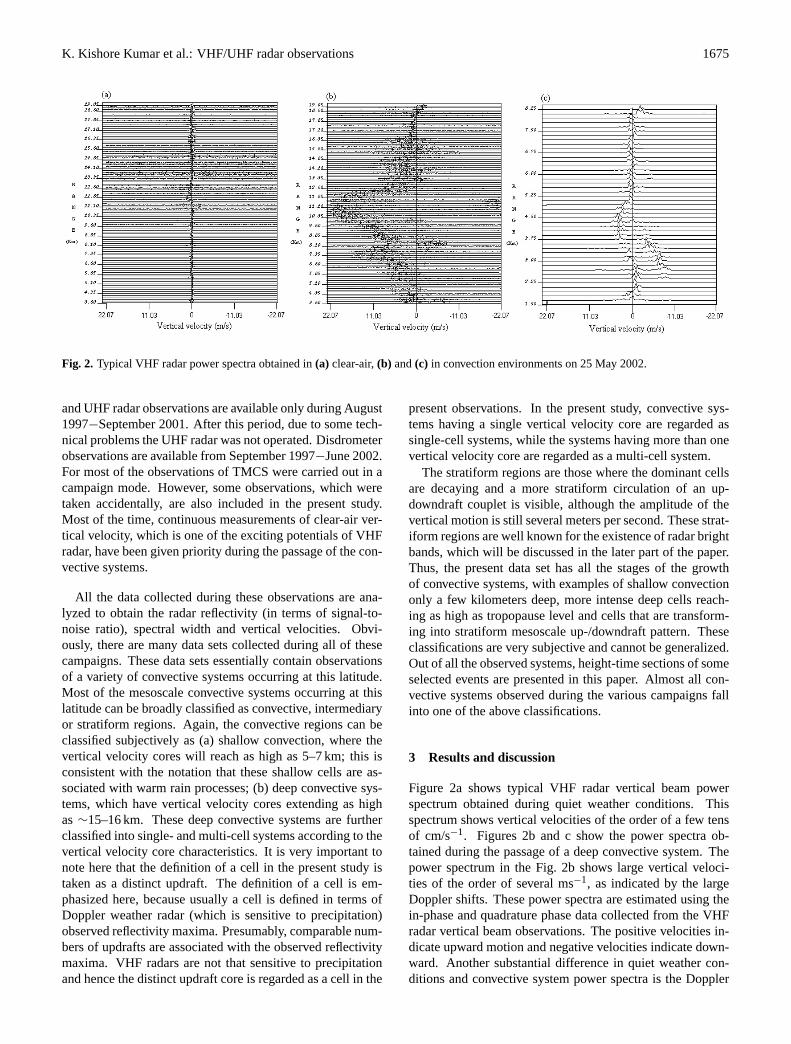
Fig. 2. Typical VHF radar power spectra obtained in(a) clear-air,(b) and(c) in convection environments on 25 May 2002.
and UHF radar observations are available only during August1997−September 2001. After this period, due to some tech-nical problems the UHF radar was not operated. Disdrometerobservations are available from September 1997−June 2002.For most of the observations of TMCS were carried out in acampaign mode. However, some observations, which weretaken accidentally, are also included in the present study.Most of the time, continuous measurements of clear-air ver-tical velocity, which is one of the exciting potentials of VHFradar, have been given priority during the passage of the con-vective systems.
All the data collected during these observations are ana-lyzed to obtain the radar reflectivity (in terms of signal-to-noise ratio), spectral width and vertical velocities. Obvi-ously, there are many data sets collected during all of thesecampaigns. These data sets essentially contain observationsof a variety of convective systems occurring at this latitude.Most of the mesoscale convective systems occurring at thislatitude can be broadly classified as convective, intermediaryor stratiform regions. Again, the convective regions can beclassified subjectively as (a) shallow convection, where thevertical velocity cores will reach as high as 5–7 km; this isconsistent with the notation that these shallow cells are as-sociated with warm rain processes; (b) deep convective sys-tems, which have vertical velocity cores extending as highas∼15–16 km. These deep convective systems are furtherclassified into single- and multi-cell systems according to thevertical velocity core characteristics. It is very important tonote here that the definition of a cell in the present study istaken as a distinct updraft. The definition of a cell is em-phasized here, because usually a cell is defined in terms ofDoppler weather radar (which is sensitive to precipitation)observed reflectivity maxima. Presumably, comparable num-bers of updrafts are associated with the observed reflectivitymaxima. VHF radars are not that sensitive to precipitationand hence the distinct updraft core is regarded as a cell in the
present observations. In the present study, convective sys-tems having a single vertical velocity core are regarded assingle-cell systems, while the systems having more than onevertical velocity core are regarded as a multi-cell system.
The stratiform regions are those where the dominant cellsare decaying and a more stratiform circulation of an up-downdraft couplet is visible, although the amplitude of thevertical motion is still several meters per second. These strat-iform regions are well known for the existence of radar brightbands, which will be discussed in the later part of the paper.Thus, the present data set has all the stages of the growthof convective systems, with examples of shallow convectiononly a few kilometers deep, more intense deep cells reach-ing as high as tropopause level and cells that are transform-ing into stratiform mesoscale up-/downdraft pattern. Theseclassifications are very subjective and cannot be generalized.Out of all the observed systems, height-time sections of someselected events are presented in this paper. Almost all con-vective systems observed during the various campaigns fallinto one of the above classifications.
3 Results and discussion
Figure 2a shows typical VHF radar vertical beam powerspectrum obtained during quiet weather conditions. Thisspectrum shows vertical velocities of the order of a few tensof cm/s−1. Figures 2b and c show the power spectra ob-tained during the passage of a deep convective system. Thepower spectrum in the Fig. 2b shows large vertical veloci-ties of the order of several ms−1, as indicated by the largeDoppler shifts. These power spectra are estimated using thein-phase and quadrature phase data collected from the VHFradar vertical beam observations. The positive velocities in-dicate upward motion and negative velocities indicate down-ward. Another substantial difference in quiet weather con-ditions and convective system power spectra is the Doppler
1676 K. Kishore Kumar et al.: VHF/UHF radar observations
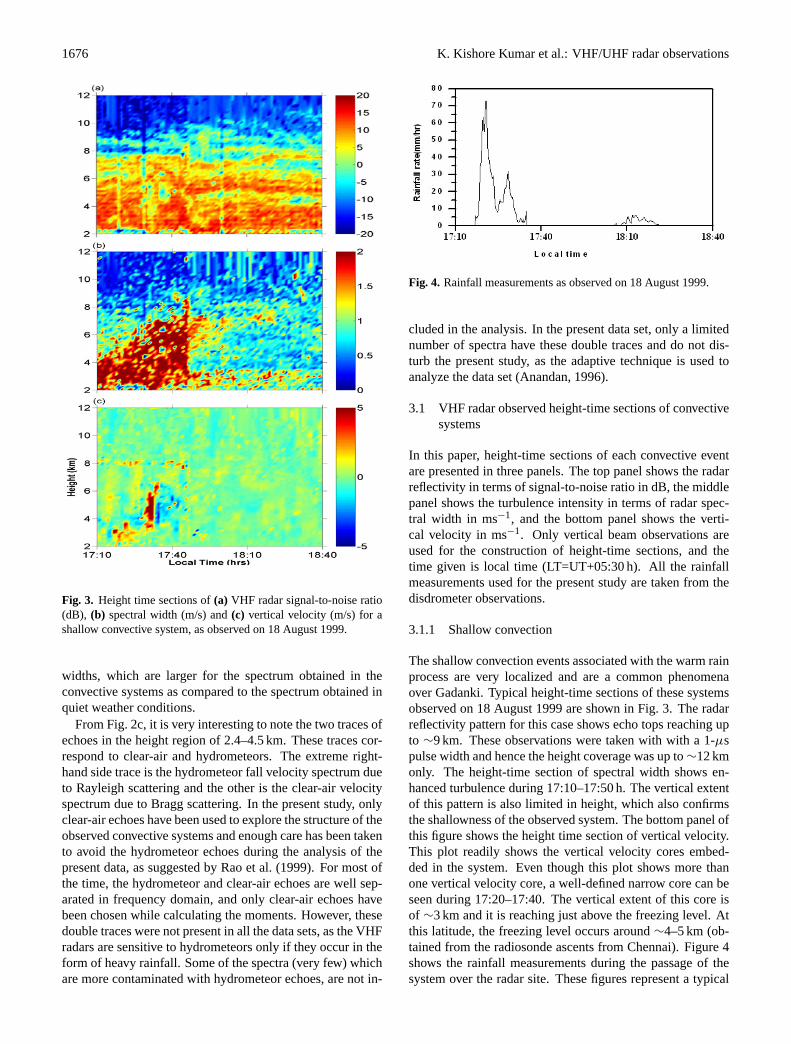
Fig. 3. Height time sections of(a) VHF radar signal-to-noise ratio(dB), (b) spectral width (m/s) and(c) vertical velocity (m/s) for ashallow convective system, as observed on 18 August 1999.
widths, which are larger for the spectrum obtained in theconvective systems as compared to the spectrum obtained inquiet weather conditions.
From Fig. 2c, it is very interesting to note the two traces ofechoes in the height region of 2.4–4.5 km. These traces cor-respond to clear-air and hydrometeors. The extreme right-hand side trace is the hydrometeor fall velocity spectrum dueto Rayleigh scattering and the other is the clear-air velocityspectrum due to Bragg scattering. In the present study, onlyclear-air echoes have been used to explore the structure of theobserved convective systems and enough care has been takento avoid the hydrometeor echoes during the analysis of thepresent data, as suggested by Rao et al. (1999). For most ofthe time, the hydrometeor and clear-air echoes are well sep-arated in frequency domain, and only clear-air echoes havebeen chosen while calculating the moments. However, thesedouble traces were not present in all the data sets, as the VHFradars are sensitive to hydrometeors only if they occur in theform of heavy rainfall. Some of the spectra (very few) whichare more contaminated with hydrometeor echoes, are not in-
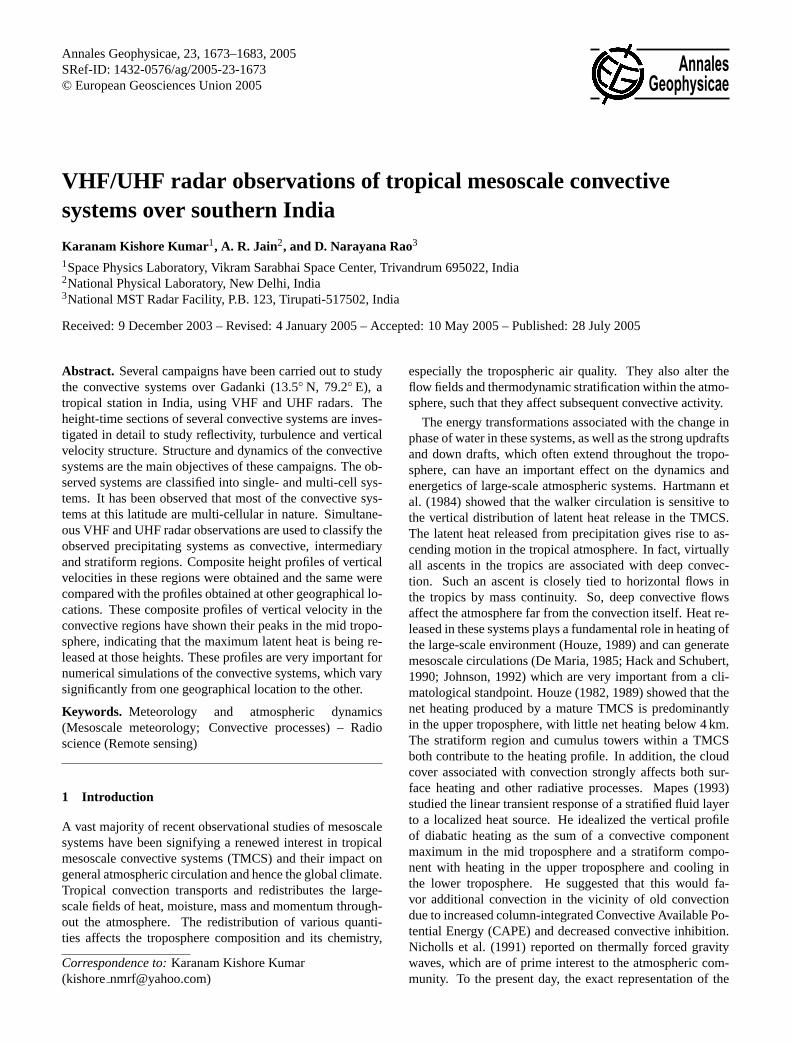
Fig. 4. Rainfall measurements as observed on 18 August 1999.
cluded in the analysis. In the present data set, only a limitednumber of spectra have these double traces and do not dis-turb the present study, as the adaptive technique is used toanalyze the data set (Anandan, 1996).
3.1 VHF radar observed height-time sections of convectivesystems
In this paper, height-time sections of each convective eventare presented in three panels. The top panel shows the radarreflectivity in terms of signal-to-noise ratio in dB, the middlepanel shows the turbulence intensity in terms of radar spec-tral width in ms−1, and the bottom panel shows the verti-cal velocity in ms−1. Only vertical beam observations areused for the construction of height-time sections, and thetime given is local time (LT=UT+05:30 h). All the rainfallmeasurements used for the present study are taken from thedisdrometer observations.
3.1.1 Shallow convection
The shallow convection events associated with the warm rainprocess are very localized and are a common phenomenaover Gadanki. Typical height-time sections of these systemsobserved on 18 August 1999 are shown in Fig. 3. The radarreflectivity pattern for this case shows echo tops reaching upto ∼9 km. These observations were taken with with a 1-µspulse width and hence the height coverage was up to∼12 kmonly. The height-time section of spectral width shows en-hanced turbulence during 17:10–17:50 h. The vertical extentof this pattern is also limited in height, which also confirmsthe shallowness of the observed system. The bottom panel ofthis figure shows the height time section of vertical velocity.This plot readily shows the vertical velocity cores embed-ded in the system. Even though this plot shows more thanone vertical velocity core, a well-defined narrow core can beseen during 17:20–17:40. The vertical extent of this core isof ∼3 km and it is reaching just above the freezing level. Atthis latitude, the freezing level occurs around∼4–5 km (ob-tained from the radiosonde ascents from Chennai). Figure 4shows the rainfall measurements during the passage of thesystem over the radar site. These figures represent a typical
K. Kishore Kumar et al.: VHF/UHF radar observations 1677
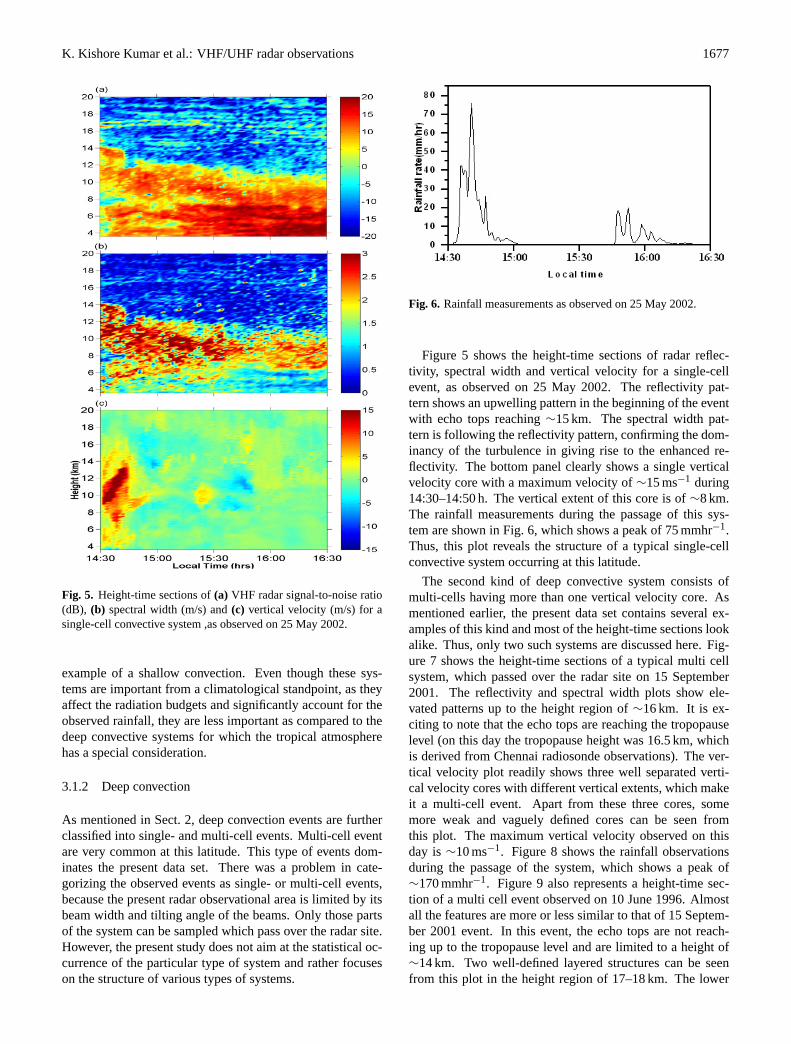
Fig. 5. Height-time sections of(a) VHF radar signal-to-noise ratio(dB), (b) spectral width (m/s) and(c) vertical velocity (m/s) for asingle-cell convective system ,as observed on 25 May 2002.
example of a shallow convection. Even though these sys-tems are important from a climatological standpoint, as theyaffect the radiation budgets and significantly account for theobserved rainfall, they are less important as compared to thedeep convective systems for which the tropical atmospherehas a special consideration.
3.1.2 Deep convection
As mentioned in Sect. 2, deep convection events are furtherclassified into single- and multi-cell events. Multi-cell eventare very common at this latitude. This type of events dom-inates the present data set. There was a problem in cate-gorizing the observed events as single- or multi-cell events,because the present radar observational area is limited by itsbeam width and tilting angle of the beams. Only those partsof the system can be sampled which pass over the radar site.However, the present study does not aim at the statistical oc-currence of the particular type of system and rather focuseson the structure of various types of systems.
Fig. 6. Rainfall measurements as observed on 25 May 2002.
Figure 5 shows the height-time sections of radar reflec-tivity, spectral width and vertical velocity for a single-cellevent, as observed on 25 May 2002. The reflectivity pat-tern shows an upwelling pattern in the beginning of the eventwith echo tops reaching∼15 km. The spectral width pat-tern is following the reflectivity pattern, confirming the dom-inancy of the turbulence in giving rise to the enhanced re-flectivity. The bottom panel clearly shows a single verticalvelocity core with a maximum velocity of∼15 ms−1 during14:30–14:50 h. The vertical extent of this core is of∼8 km.The rainfall measurements during the passage of this sys-tem are shown in Fig. 6, which shows a peak of 75 mmhr−1.Thus, this plot reveals the structure of a typical single-cellconvective system occurring at this latitude.
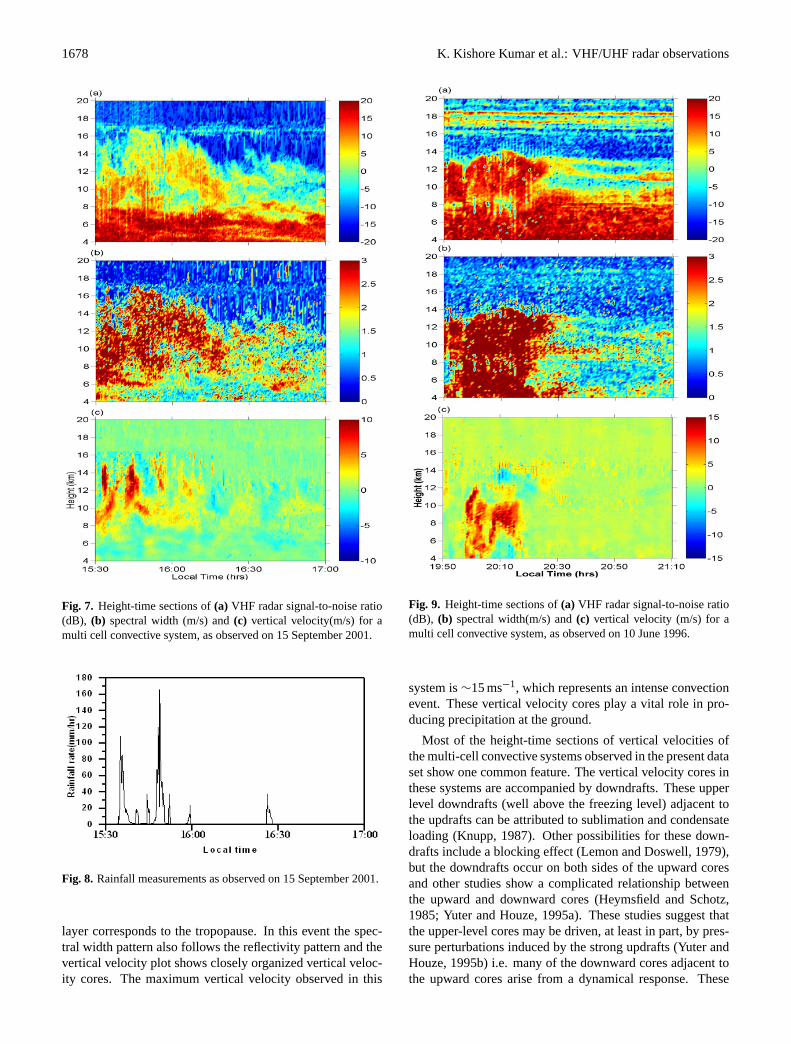
The second kind of deep convective system consists ofmulti-cells having more than one vertical velocity core. Asmentioned earlier, the present data set contains several ex-amples of this kind and most of the height-time sections lookalike. Thus, only two such systems are discussed here. Fig-ure 7 shows the height-time sections of a typical multi cellsystem, which passed over the radar site on 15 September2001. The reflectivity and spectral width plots show ele-vated patterns up to the height region of∼16 km. It is ex-citing to note that the echo tops are reaching the tropopauselevel (on this day the tropopause height was 16.5 km, whichis derived from Chennai radiosonde observations). The ver-tical velocity plot readily shows three well separated verti-cal velocity cores with different vertical extents, which makeit a multi-cell event. Apart from these three cores, somemore weak and vaguely defined cores can be seen fromthis plot. The maximum vertical velocity observed on thisday is∼10 ms−1. Figure 8 shows the rainfall observationsduring the passage of the system, which shows a peak of∼170 mmhr−1. Figure 9 also represents a height-time sec-tion of a multi cell event observed on 10 June 1996. Almostall the features are more or less similar to that of 15 Septem-ber 2001 event. In this event, the echo tops are not reach-ing up to the tropopause level and are limited to a height of∼14 km. Two well-defined layered structures can be seenfrom this plot in the height region of 17–18 km. The lower
1678 K. Kishore Kumar et al.: VHF/UHF radar observations
Fig. 7. Height-time sections of(a) VHF radar signal-to-noise ratio(dB), (b) spectral width (m/s) and(c) vertical velocity(m/s) for amulti cell convective system, as observed on 15 September 2001.
Fig. 8. Rainfall measurements as observed on 15 September 2001.
layer corresponds to the tropopause. In this event the spec-tral width pattern also follows the reflectivity pattern and thevertical velocity plot shows closely organized vertical veloc-ity cores. The maximum vertical velocity observed in this
Fig. 9. Height-time sections of(a) VHF radar signal-to-noise ratio(dB), (b) spectral width(m/s) and(c) vertical velocity (m/s) for amulti cell convective system, as observed on 10 June 1996.
system is∼15 ms−1, which represents an intense convectionevent. These vertical velocity cores play a vital role in pro-ducing precipitation at the ground.
Most of the height-time sections of vertical velocities ofthe multi-cell convective systems observed in the present dataset show one common feature. The vertical velocity cores inthese systems are accompanied by downdrafts. These upperlevel downdrafts (well above the freezing level) adjacent tothe updrafts can be attributed to sublimation and condensateloading (Knupp, 1987). Other possibilities for these down-drafts include a blocking effect (Lemon and Doswell, 1979),but the downdrafts occur on both sides of the upward coresand other studies show a complicated relationship betweenthe upward and downward cores (Heymsfield and Schotz,1985; Yuter and Houze, 1995a). These studies suggest thatthe upper-level cores may be driven, at least in part, by pres-sure perturbations induced by the strong updrafts (Yuter andHouze, 1995b) i.e. many of the downward cores adjacent tothe upward cores arise from a dynamical response. These
K. Kishore Kumar et al.: VHF/UHF radar observations 1679
Fig. 10. Typical VHF radar power spectra observed in stratiform regions of a mesoscale convective system at two different times on 4November 1997.
deep downward cores also provide indirect support for theobservation of thermally buoyant downdrafts observed byaircraft (Jorgensen and LeMone, 1989; Lucas et al., 1994).These pressure perturbations also affect the updrafts them-selves (Trier et al., 1997). The other category of downdraft,which is occurring below the freezing level (low level down-draft), is mainly precipitation/evaporatively driven.
3.2 Height-time sections of stratiform regions
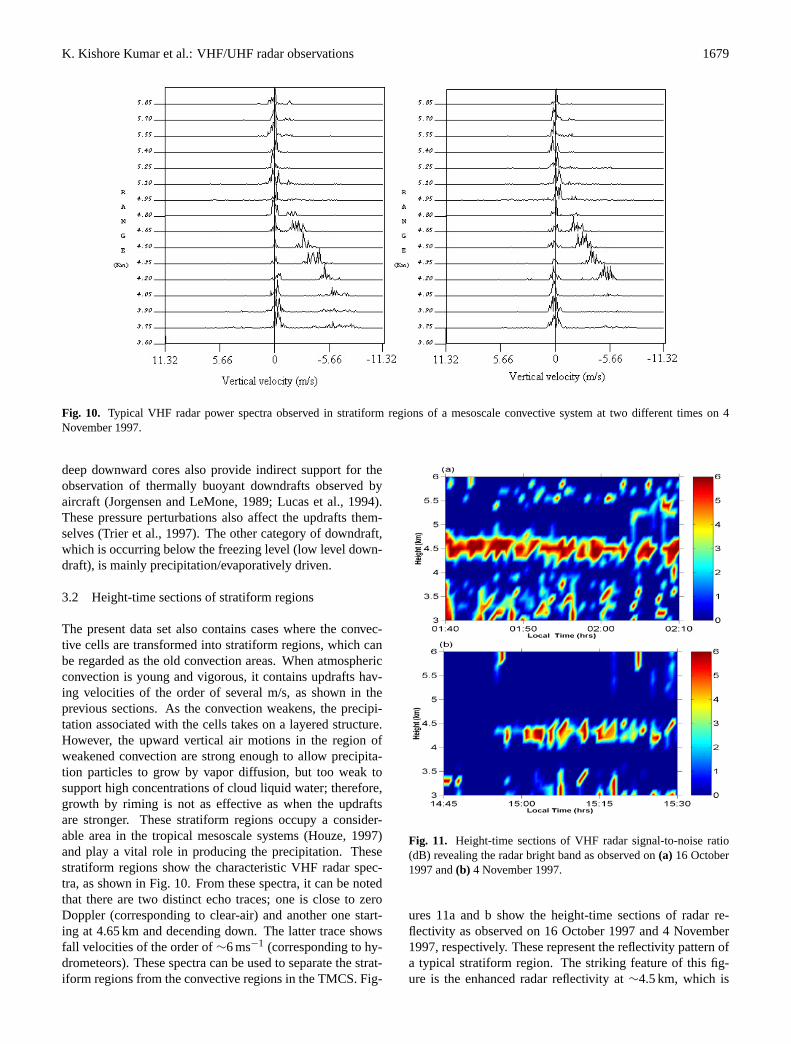
The present data set also contains cases where the convec-tive cells are transformed into stratiform regions, which canbe regarded as the old convection areas. When atmosphericconvection is young and vigorous, it contains updrafts hav-ing velocities of the order of several m/s, as shown in theprevious sections. As the convection weakens, the precipi-tation associated with the cells takes on a layered structure.However, the upward vertical air motions in the region ofweakened convection are strong enough to allow precipita-tion particles to grow by vapor diffusion, but too weak tosupport high concentrations of cloud liquid water; therefore,growth by riming is not as effective as when the updraftsare stronger. These stratiform regions occupy a consider-able area in the tropical mesoscale systems (Houze, 1997)and play a vital role in producing the precipitation. Thesestratiform regions show the characteristic VHF radar spec-tra, as shown in Fig. 10. From these spectra, it can be notedthat there are two distinct echo traces; one is close to zeroDoppler (corresponding to clear-air) and another one start-ing at 4.65 km and decending down. The latter trace showsfall velocities of the order of∼6 ms−1 (corresponding to hy-drometeors). These spectra can be used to separate the strat-iform regions from the convective regions in the TMCS. Fig-
Fig. 11. Height-time sections of VHF radar signal-to-noise ratio(dB) revealing the radar bright band as observed on(a) 16 October1997 and(b) 4 November 1997.
ures 11a and b show the height-time sections of radar re-flectivity as observed on 16 October 1997 and 4 November1997, respectively. These represent the reflectivity pattern ofa typical stratiform region. The striking feature of this fig-ure is the enhanced radar reflectivity at∼4.5 km, which is
1680 K. Kishore Kumar et al.: VHF/UHF radar observations
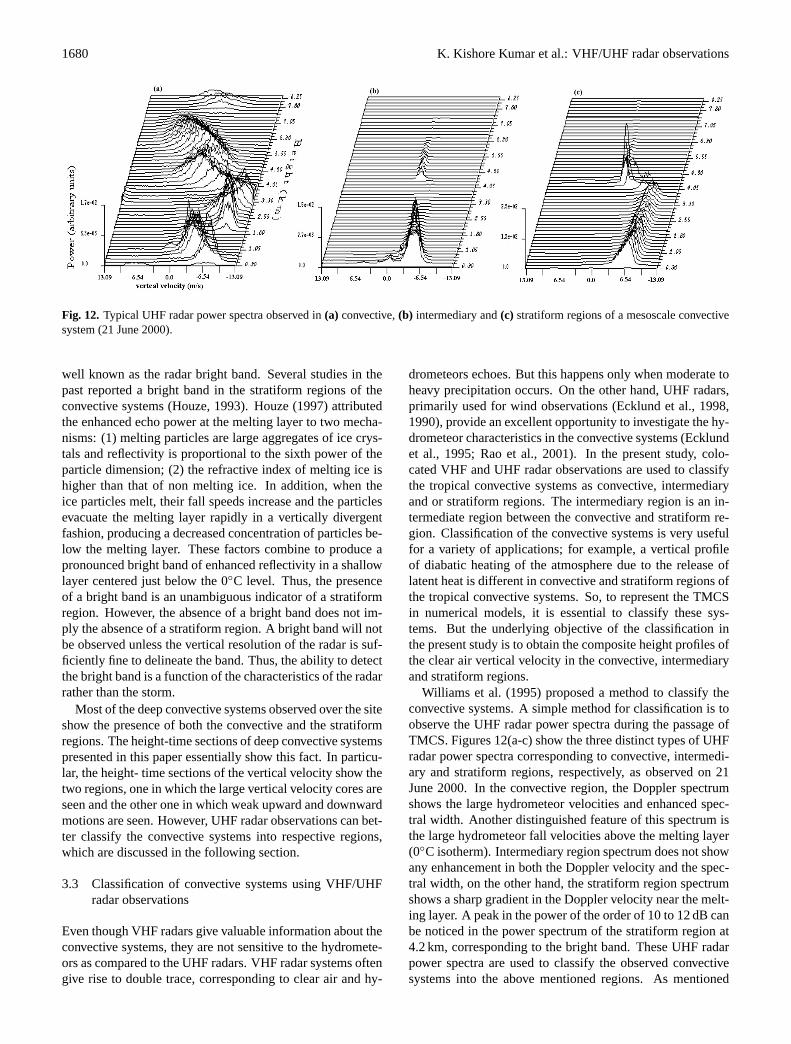
Fig. 12. Typical UHF radar power spectra observed in(a) convective,(b) intermediary and(c) stratiform regions of a mesoscale convectivesystem (21 June 2000).
well known as the radar bright band. Several studies in thepast reported a bright band in the stratiform regions of theconvective systems (Houze, 1993). Houze (1997) attributedthe enhanced echo power at the melting layer to two mecha-nisms: (1) melting particles are large aggregates of ice crys-tals and reflectivity is proportional to the sixth power of theparticle dimension; (2) the refractive index of melting ice ishigher than that of non melting ice. In addition, when theice particles melt, their fall speeds increase and the particlesevacuate the melting layer rapidly in a vertically divergentfashion, producing a decreased concentration of particles be-low the melting layer. These factors combine to produce apronounced bright band of enhanced reflectivity in a shallowlayer centered just below the 0◦C level. Thus, the presenceof a bright band is an unambiguous indicator of a stratiformregion. However, the absence of a bright band does not im-ply the absence of a stratiform region. A bright band will notbe observed unless the vertical resolution of the radar is suf-ficiently fine to delineate the band. Thus, the ability to detectthe bright band is a function of the characteristics of the radarrather than the storm.
Most of the deep convective systems observed over the siteshow the presence of both the convective and the stratiformregions. The height-time sections of deep convective systemspresented in this paper essentially show this fact. In particu-lar, the height- time sections of the vertical velocity show thetwo regions, one in which the large vertical velocity cores areseen and the other one in which weak upward and downwardmotions are seen. However, UHF radar observations can bet-ter classify the convective systems into respective regions,which are discussed in the following section.
3.3 Classification of convective systems using VHF/UHFradar observations
Even though VHF radars give valuable information about theconvective systems, they are not sensitive to the hydromete-ors as compared to the UHF radars. VHF radar systems oftengive rise to double trace, corresponding to clear air and hy-
drometeors echoes. But this happens only when moderate toheavy precipitation occurs. On the other hand, UHF radars,primarily used for wind observations (Ecklund et al., 1998,1990), provide an excellent opportunity to investigate the hy-drometeor characteristics in the convective systems (Ecklundet al., 1995; Rao et al., 2001). In the present study, colo-cated VHF and UHF radar observations are used to classifythe tropical convective systems as convective, intermediaryand or stratiform regions. The intermediary region is an in-termediate region between the convective and stratiform re-gion. Classification of the convective systems is very usefulfor a variety of applications; for example, a vertical profileof diabatic heating of the atmosphere due to the release oflatent heat is different in convective and stratiform regions ofthe tropical convective systems. So, to represent the TMCSin numerical models, it is essential to classify these sys-tems. But the underlying objective of the classification inthe present study is to obtain the composite height profiles ofthe clear air vertical velocity in the convective, intermediaryand stratiform regions.
Williams et al. (1995) proposed a method to classify theconvective systems. A simple method for classification is toobserve the UHF radar power spectra during the passage ofTMCS. Figures 12(a-c) show the three distinct types of UHFradar power spectra corresponding to convective, intermedi-ary and stratiform regions, respectively, as observed on 21June 2000. In the convective region, the Doppler spectrumshows the large hydrometeor velocities and enhanced spec-tral width. Another distinguished feature of this spectrum isthe large hydrometeor fall velocities above the melting layer(0◦C isotherm). Intermediary region spectrum does not showany enhancement in both the Doppler velocity and the spec-tral width, on the other hand, the stratiform region spectrumshows a sharp gradient in the Doppler velocity near the melt-ing layer. A peak in the power of the order of 10 to 12 dB canbe noticed in the power spectrum of the stratiform region at4.2 km, corresponding to the bright band. These UHF radarpower spectra are used to classify the observed convectivesystems into the above mentioned regions. As mentioned
K. Kishore Kumar et al.: VHF/UHF radar observations 1681
earlier, the UHF radar observations are available only duringAugust 1997−September 2001; the events observed outsideof this period are classified using VHF radar vertical velocityobservations (height-time sections). But it is very difficultto exactly identify the intermediary regions from the VHFradar observations. For the present study, the regions appear-ing immediately after the convective regions have been takento be the intermediary region. As convective cells go throughtheir natural lifecycles they evolve into a stratiform structurewith a bright band. A region of deteriorating convective cellswould have an appearance somewhere between that of an ac-tive convection and a completely stratiform precipitation, andthis region is regarded as intermediary region. Thus, in thepresent study the intermediary region refers to the transitionin time rather than the transition in space. Most of the deepconvective systems are classified using this procedure and ul-timately the average vertical velocity profiles in these regionsare obtained.
3.4 Composite height profiles of vertical velocities
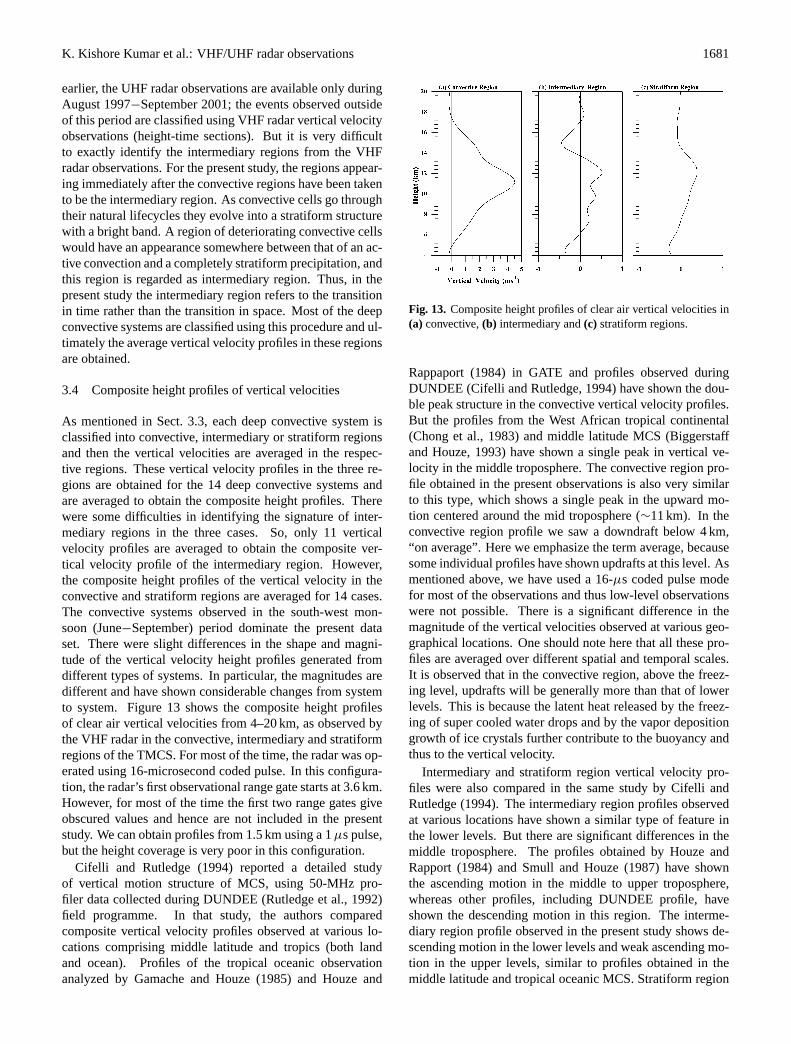
As mentioned in Sect. 3.3, each deep convective system isclassified into convective, intermediary or stratiform regionsand then the vertical velocities are averaged in the respec-tive regions. These vertical velocity profiles in the three re-gions are obtained for the 14 deep convective systems andare averaged to obtain the composite height profiles. Therewere some difficulties in identifying the signature of inter-mediary regions in the three cases. So, only 11 verticalvelocity profiles are averaged to obtain the composite ver-tical velocity profile of the intermediary region. However,the composite height profiles of the vertical velocity in theconvective and stratiform regions are averaged for 14 cases.The convective systems observed in the south-west mon-soon (June−September) period dominate the present dataset. There were slight differences in the shape and magni-tude of the vertical velocity height profiles generated fromdifferent types of systems. In particular, the magnitudes aredifferent and have shown considerable changes from systemto system. Figure 13 shows the composite height profilesof clear air vertical velocities from 4–20 km, as observed bythe VHF radar in the convective, intermediary and stratiformregions of the TMCS. For most of the time, the radar was op-erated using 16-microsecond coded pulse. In this configura-tion, the radar’s first observational range gate starts at 3.6 km.However, for most of the time the first two range gates giveobscured values and hence are not included in the presentstudy. We can obtain profiles from 1.5 km using a 1µs pulse,but the height coverage is very poor in this configuration.
Cifelli and Rutledge (1994) reported a detailed studyof vertical motion structure of MCS, using 50-MHz pro-filer data collected during DUNDEE (Rutledge et al., 1992)field programme. In that study, the authors comparedcomposite vertical velocity profiles observed at various lo-cations comprising middle latitude and tropics (both landand ocean). Profiles of the tropical oceanic observationanalyzed by Gamache and Houze (1985) and Houze and
Fig. 13. Composite height profiles of clear air vertical velocities in(a) convective,(b) intermediary and(c) stratiform regions.
Rappaport (1984) in GATE and profiles observed duringDUNDEE (Cifelli and Rutledge, 1994) have shown the dou-ble peak structure in the convective vertical velocity profiles.But the profiles from the West African tropical continental(Chong et al., 1983) and middle latitude MCS (Biggerstaffand Houze, 1993) have shown a single peak in vertical ve-locity in the middle troposphere. The convective region pro-file obtained in the present observations is also very similarto this type, which shows a single peak in the upward mo-tion centered around the mid troposphere (∼11 km). In theconvective region profile we saw a downdraft below 4 km,“on average”. Here we emphasize the term average, becausesome individual profiles have shown updrafts at this level. Asmentioned above, we have used a 16-µs coded pulse modefor most of the observations and thus low-level observationswere not possible. There is a significant difference in themagnitude of the vertical velocities observed at various geo-graphical locations. One should note here that all these pro-files are averaged over different spatial and temporal scales.It is observed that in the convective region, above the freez-ing level, updrafts will be generally more than that of lowerlevels. This is because the latent heat released by the freez-ing of super cooled water drops and by the vapor depositiongrowth of ice crystals further contribute to the buoyancy andthus to the vertical velocity.
Intermediary and stratiform region vertical velocity pro-files were also compared in the same study by Cifelli andRutledge (1994). The intermediary region profiles observedat various locations have shown a similar type of feature inthe lower levels. But there are significant differences in themiddle troposphere. The profiles obtained by Houze andRapport (1984) and Smull and Houze (1987) have shownthe ascending motion in the middle to upper troposphere,whereas other profiles, including DUNDEE profile, haveshown the descending motion in this region. The interme-diary region profile observed in the present study shows de-scending motion in the lower levels and weak ascending mo-tion in the upper levels, similar to profiles obtained in themiddle latitude and tropical oceanic MCS. Stratiform region
1682 K. Kishore Kumar et al.: VHF/UHF radar observations
profiles obtained at various locations, including the presentprofile, have shown more or less similar features, downdraftsin the lower troposphere and weak updrafts in the upper tro-posphere. In the present study, there is a similarity betweenthe intermediary and stratiform profiles. The stratiform pro-file looks like a weaker version of the intermedieary profile.The intermediary profile can be interpreted as an early-stagestratiform profile. However, the downdraft at the top of theintermediary profile has yet to be explored in further studies.
In the present study, the composite vertical velocity profileof convective regions shows a peak in the mid troposphere.The altitude of the maximum updraft velocity is quite high.This indicates that the release of latent heat is more at thoseheight regions. These profiles do give us an idea of heat-ing within the convective systems. These vertical velocityprofiles are very useful in determining the vertical distribu-tion of diabatic heating in the convective and stratiform re-gions. These composite vertical velocity height profiles ofthe convective, intermediary and stratiform regions, whichvary from one geographical location to other, have very spe-cial implications in the mesoscale modeling and in the con-vective system simulation studies.
4 Summary
The height-time sections of several convective systems arestudied to explore their reflectivity, turbulence and verti-cal velocity structures. The observed systems are classifiedbroadly into convective, intermediary and stratiform regions.Furthermore, the convective parts of the systems are classi-fied into single- and multi-cell systems. It is observed thatmost of the convective systems are multi-cell systems at thislatitude. In the vertical velocity structure of these systems, itis noted that upward velocity cores are separated by narrowdownward velocity cores. The downdrafts observed abovethe freezing level are attributed to the dynamical response,while the downdrafts below this level are mainly due to theprecipitation drag and evaporative cooling.
Height-time sections of stratiform regions have showna characteristic radar bright band at the melting layer.VHF/UHF radar data are used to classify the observed pre-cipitating systems as convective, intermediary or stratiformregions, using a method introduced by Williams et al. (1995).Composite height profiles of vertical velocities in convec-tive, intermediary and stratiform regions are obtained and thesame are compared with the profiles obtained at other geo-graphical locations. The convective region composite verti-cal velocity profile of this location is found to have similar-ities with both middle latitude and other tropical continentalMCS. The present stratiform region profile is consistent withother geographical location profiles, and the intermediary re-gion profiles have shown some dissimilarity in the mid tro-posphere. These composite height profiles are very useful tounderstand the latent heat released in the convective systems,to which GCM models are very sensitive. Future work at this
latitude will be addressing these problems and will focus at-tention on simulations and modeling aspects of TMCS.
Acknowledgements.The National MST Radar Facility (NMRF) isoperated as an autonomous facility under Department of Space withpartial support from Council of Scientific and Industrial Research.The authors are grateful to the NMRF technical staff whose ded-icated efforts made possible the observations reported here. UHFradar is setup and being operated at NMRF under joint collaborateprogramme between India and Japan.
Topical Editor U.-P. Hoppe thanks R. Houze and another refereefor their help in evaluating this paper.
References
Anandan, V. K., Balmuralidhar, P., Rao, P. B., and Jain, A. R.: Amethod for adaptive moments estimation technique applied toMST radar echoes, Progress in electromagnetic research sym-posium, Telecommunication research center, City university ofHong Kong, 1996.
Balsley, B. B., Ecklund, W. L., Carter, D. A., Riddle, A. C., andGage, K. S.: Average vertical motions in the tropical atmosphereobserved by a radar wind profiler on Pohnpei (7◦ N latitude,157◦ E longitude), J. Atmos. Sci., 45, 396–405, 1988.
Biggerstaff, M. I. and Houze, R. A. Jr.: Kinematics and micro-physics of the transition zone of the 10-11 June 1985 squall line,J. Atmos. Sci., 50, 3091–3110, 1993.
Chong, M., Testud, J., and Roux, F.: Three-Dimensional wind fieldanalysis from dual-Doppler radar data. Part : Minimizing theerror due to temporal variation, J. Climate Appl. Meteor., 22,1216–1226, 1983.
Cifelli R. and Rutledge, S. A.: Vertical motion structure in maritimecontinent mesoscale, convective systems: Results from 50-MHzprofiler, J. Atmos. Sci., 51, 2631–2652, 1994.
DeMaria, M.: Linear response of a stratified tropical atmosphere toconvective forcing, J. Atmos. Sci., 42, 113–121, 1985.
Dhaka, S. K., Devarajan, P. K., Shibagaki, Y., Choudhary, R. K., andFukao, S.: Indian MST radar observations of gravity wave activ-ities associated with tropical convection. J. Atoms. Solar Terr.Phys, 63, 1631–1642, 2001.
Ecklund, W. L., Carter, D. A., Balsley, B. B., Currier, P. E., Green,J. L., Weber, B. L., and Gage, K. S.: Field tests of a lower tropo-spheric wind profiler, Radio Sci., 25, 899–906, 1990.
Ecklund, W. L., Gage, K. S., and Williams, C. R.: Tropical pre-cipitation studies using 915 MHz wind profiler, Radio Sci., 52,838–851, 1995.
Ecklund W. L., Carter, D. A., and Balsley, B. B.: A UHF wind pro-filer for the boundary layer studies: Brief description and initialresults, J. Atmos. Oceanic. Technol., 5, 432–441, 1998.
Gage, K. S.: Radar observations of the free atmosphere: Structureand dynamics, Radar in Meteorology, D. Atlas, Ed., Amer. Me-teor. Soc., 534–574, 1990.
Gage K. S., Williams, C. R., and Ecklund, W. L.: UHF wind profil-ers: A new tool for diagnosing tropical convective cloud systems,Bull. Am. Meteorol. Soc., 75, 2289–2294, 1994.
Gage K. S., Williams, C. R., and Ecklund, W. L.: Application of the915MHz profiler for diagnosing and classifying tropical precipi-tating cloud systems, Meteor. Atmos. Phys., 59, 141–151, 1996.
Gamache, J. F. and Houze, R. A. Jr.: Further analysis of the com-posite wind and thermodynamic structure of the 12 SeptemberGATE squall line, Mon. Wea. Rev., 113, 1241–1259, 1985.
K. Kishore Kumar et al.: VHF/UHF radar observations 1683
Hack, J. J. and Schubert, W. H.: Some dynamical properties ofidealized thermally forced meridional circulations in the tropics,Meteor. Atmos. Phys., 44, 101–117, 1990.
Heymsfield, G. M. and Schotz, S.: Structure and evolution of a seversquall line over Oklahoma, Mon. Wea. Rev., 113, 1563–1589,1985.
Hartmann, D. L., Hendon, H. H., and Houze, R. A., Jr.: Some impli-cations of the mesoscale circulations in tropical cloud clusters forlarge-scale dynamics and climate, J. Atmos. Sci., 41, 113–121,1984.
Houze, R. A., Jr.: Cloud clusters and large-scale vertical motions inthe tropics, J. Meteor. Soc. Japan, 60, 396–410, 1982.
Houze, R. A., Jr. and Rappaport, E. N.: Air motions and precipi-tating structure of an early summer squall line over the easterntropical Atlantic, J. Atmos. Sci., 41, 553–574, 1984.
Houze, R. A., Jr.: Observed structure of mesoscale convective sys-tems and their implications for large-scale heating, Q.J.R. Mete-orol. Soc., 115, 425–461, 1989.
Houze, R. A., Jr.: Cloud dynamics, Academic Press, 1993.Houze, R. A., Jr.: Stratiform precipitation in regions of convection:
A meteorological paradox?, Bull. Am. Meteorol. Soc., 78, 2179–2196, 1997.
Jain, A. R., Jaya Rao, Y., Anandan, V. K., Rao, P. B., Viswanathan,G., Damle, S. H., Balamuralidhar, P., and Anil Kulakarni: Pre-liminary observations using ST mode of Indian MST radar: De-tection of signature of tropopause, J. Atmos. Terr. Phys., 56,1157–1162, 1994.
Jain, A. R, Jayarao, Y., Patra, A. K., Rao, P. B., Viswanathan, G.,and Subramanian, S. K.: Observations of Tropical convectionevents using Indian MST Radar: First results Quarterly, J. RoyalMet. Soc., 126, 3097–3115, 2000.
Johnson, R. H.: Heat and moisture sources and sinks of Asian mon-soon convection, J. Meteor. Soc. Japan, 70, 353–372, 1992.
Jorgensen, D. P. and LeMone, M. A.: Vertical velocity characteris-tics of oceanic convection, J. Atmos. Sci., 46, 621–640, 1989.
Knupp, K. R.: Downdrafts within high plains cumulonimbi. Part I:General kinematic structure, J. Atmos. Sci., 44, 987–1008, 1987.
Krishna Reddy, K., Kozu, T., Ohno, Y, Nakamura, K., Sriniva-sulu, P., Anandan, V. K., Jain, A. R., Rao, P. B., Ranga Rao,R., Viswanathan, G., and Rao, D. N.: Lower atmospheric windprofiler at Gadanki, Tropical India: initial result, MeterologischeZeitschrift, 10, 457–466, 2001.
Lemon, L. R. and Doswell C. A. III.: Sever thunderstorm evolutionand mesocyclone structure as related to tornadogenesis, Mon.Wea. Rev., 107, 1184–1197, 1979.
Lucas, C., Zipser, E. J., and LeMone, M. A.: Vertical velocityin oceanic convection off tropical Australia, J. Atmos. Sci., 51,3183–3193, 1994.
Mapes, B. E.: Gregarious tropical convection, J. Atmos. Sci., 50,2026–2037, 1993.
Mapes, B. E. and Houze, R. A. Jr.: An integrated view of the 1987Australian monsoon and its mesoscale convective systems. II:Vertical structure, Q. J. R. Meteorol. Soc., 119, 733–754, 1993.
Nicholls, M. E., Pielke, R. A., and Cotton, W. R.: Thermally forcedgravity waves in an atmosphere at rest. J. Atmos. Sci., 48, 1869–1884, 1991.
Rao, T. N., Rao, D. N., and Raghavan, S.: Tropical precipitat-ing systems observed with Indian MST Radar, Radio Sci., Vol.,34(5), 1125–1139, 1999.
Rao, T. N., Rao, D. N., Mohan, K., and Raghavan, S.: Classificationof tropical precipitating system and associated Z-R relationships,J. Geophys. Res., 106(D16), 17 699–17 711, 2001.
Rajopadhyaya, D. K., May, P. T., Cifelli, R., Avery, S. K., Williams,C. R., Ecklumd, W. L., and Gage, K. S.: The effect of vertical airmotions on rain rates and median volume diameter determinedfrom combined UHF and VHF wind profiler measurements andcomparison with rain gauge measurements, J. Atmos. OceanicTechnol., 15, 1306–1319, 1998.
Rao, P. B., Jain, A. R., Kishore, P., Balamuralidhar, P., Damle, S. H.,and Viswanathan, G.: Indian MST radar 1, System descriptionand sample vector wind measurements using ST mode, RadioSci., 30, 1125–1138, 1995.
Rutledge, S. A., Williams, E. R., and Keenan, T. D.: The Down Un-der Doppler and Electricity Experiment (DUNDEE): Overviewand preliminary results, Bull. Am. Meteorol. Soc., 73, 3–16,1992.
Smull, B. F. and Houze, R. A. Jr.: Dual-Doppler radar analysis of amidlatitude squalline with a trailing region of stratiform rain, J.Atmos. Sci., 44, 2128–2148, 1987.
Trier, S. B., Skamarock, W. C., and LeMone, M. A.: Structure andevolution of the 22 February 1993 TOGA COARE squall line:Organization mechanisms inferred from numerical simulation, J.Atmos. Sci., 54, 386–407, 1997.
Wakasugi, K., Mizutani, A., Matsuo, M., Fukao, S., and Kato, S.: Adirect method for deriving drop-size distribution and vertical airvelocities from VHF Doppler radar spectra, J. Atmos. Oceanic.Technol., 3, 623–629, 1986.
Wakasugi, K., Mizutani, A., Matsuo, M., Fukao, S., and Kato, S.:Further discussion on deriving drop-size distribution and verticalair velocities directly from VHF Doppler radar spectra, J. Atmos.Oceanic. Technol., 4, 170–179, 1987.
Weisman, M. L. and Klemp, J. B.: The structure and classificationof numerically simulated convective storms in directionally vary-ing wind shears, Mon. Weather Rev., 112, 2479–2498, 1984.
Williams, C. R., Ecklund, W. L., and Gage, K. S.: Classification ofprecipitating clouds in the tropics using 915-MHz wind profilers,J. Atmos. Oceanic. Technol., 12, 996–1012, 1995.
Yuter, S. E. and Houze, R. A. Jr.: Three-dimensional kinematics andmicrophysical evolution of Florida cumulonimbus. Part I: spatialdistribution of updrafts, downdrafts and precipitation, Mon. Wea.Rev., 123, 1921–1940, 1995a.
Yuter, S. E. and Houze, R. A. Jr.: Three-dimensional kinematic andmicrophysical evolution of Florida cumulonimbus. Part : Fre-quency distribution of vertical velocity, reflectivity, and differen-tial reflectivity, Mon. Wea. Rev., 123, 1941–1963, 1995b.
Zipser, E. J., Betts, A., Ruggiero, F., and Hinton, B.: Tropical me-teorology: Panel report, Radar in Meteorology, D.Atlas, Ed.,Amer. Meteor. Soc., 426–434, 1990.