VHE g -ray observations of the AGN 1ES1959+650 with the HEGRA CT1 Cherenkov Telescope
9
VHE -ray observations of the AGN 1ES1959+650 with the HEGRA CT1 Cherenkov Telescope Nadia Tonello Max Planck Institute for Physics (Werner- Heisenberg-Institut), Munich, Germany for the HEGRA Collaboration 28 th ICRC, Tsukuba • 1ES1959+650 • CT1 • Data, obs.time • ALPHA distr. • Light Curve • Spectrum • Summary Overview
-
Upload
jermaine-aguilar -
Category
Documents
-
view
50 -
download
0
description
VHE g -ray observations of the AGN 1ES1959+650 with the HEGRA CT1 Cherenkov Telescope. Overview. 1ES1959+650 CT1 Data, obs.time ALPHA distr. Light Curve Spectrum Summary. Nadia Tonello Max Planck Institute for Physics (Werner-Heisenberg-Institut), Munich, Germany - PowerPoint PPT Presentation
Transcript of VHE g -ray observations of the AGN 1ES1959+650 with the HEGRA CT1 Cherenkov Telescope

VHE -ray observations of theAGN 1ES1959+650with the HEGRA CT1Cherenkov Telescope
Nadia TonelloMax Planck Institute for Physics (Werner-Heisenberg-
Institut),Munich, Germany
for the HEGRA Collaboration
28th ICRC, Tsukuba
•1ES1959+650 •CT1•Data, obs.time•ALPHA distr.•Light Curve•Spectrum•Summary
Overview

The AGN 1ES1959 +650
Nadia Tonello MPI for Physics, Munich
28th ICRC, Tsukuba
HEGRA CT1 observations of 1ES1959+650
1ES1959+650CT1Data, obs.timeALPHA distrib.Light curveEn. SpectrumSummary
Elliptical galaxyActive Galactic NucleusBL Lac objectz = 0.047RA =19h59m59.8sDec = +65d08'54''
1993: identified from the radio, optical and X-ray emissions(Einstein IPC Slew Survey) .
1998: First -ray emissionSeven Telescope Array in Utah (Nishiyama et al., 26th ICRC, OG.2.1)
2000: observations by the HEGRA Cherenkov Telescopes
2002: Short flare seen by the VERITAS collaboration(Dowdall et al., IAU Circ. 7903)
1

HEGRA CT1 Cherenkov Telescope for -ray detection
Nadia Tonello MPI for Physics, Munich
28th ICRC, Tsukuba
Camera
Reflecting surface
ORM, La Palma, .Canary Islands
10.3 m2 areaaluminum mirrors
127 pixels FOV 3° diam.
Energy threshold 750 GeV at small ZA
Sensitivity3.3 x
for a Crab-like source
28.75°N17.89°W2200 asl
2
HEGRA CT1 observations of 1ES1959+650
1ES1959+650CT1Data, obs.timeALPHA distrib.Light curveEn. SpectrumSummary
t h

Data and observation time
Nadia Tonello MPI for Physics, Munich
28th ICRC, Tsukuba
2000 2001 2002Good dark nights, nom hv 58 h 86 h 174.2 hWeak moonlight no hv red. 24 h 8.1 hMoonlight 4%hv reduction 12 h 16.1 hMoonlight 8%hv reduction 8 h 6.1 hMoonlight 12%hv reduction 7 h 2.9 h
Dynamical cuts applied on the image parameter distributions of the showers: ZA, SIZE and DIST dependent
3
HEGRA CT1 observations of 1ES1959+650
1ES1959+650CT1Data, obs.timeALPHA distrib.Light curveEn. SpectrumSummary

ALPHA distribution
Nadia Tonello MPI for Physics, Munich
28th ICRC, Tsukuba
MJD: 52412 - 52584ZA range: 36.4°- 54.2°obs.time: 174.2 hnom data
Cut in ALPHA= 13.1 degSignificance: 11.1
Excess: 691 ± 42off: 1826 ± 38
Comparison of the fit result with a normalized sample of off-data
4
HEGRA CT1 observations of 1ES1959+650
1ES1959+650CT1Data, obs.timeALPHA distrib.Light curveEn. SpectrumSummary

Light curve
Nadia Tonello MPI for Physics, Munich
28th ICRC, Tsukuba
Periods of high activity: 20 May (MJD52414) 2 June(MJD52427)14-15 July (MJD52469-70)
5
HEGRA CT1 observations of 1ES1959+650
1ES1959+650CT1Data, obs.timeALPHA distrib.Light curveEn. SpectrumSummary
May June July Aug. Sept. Nov.
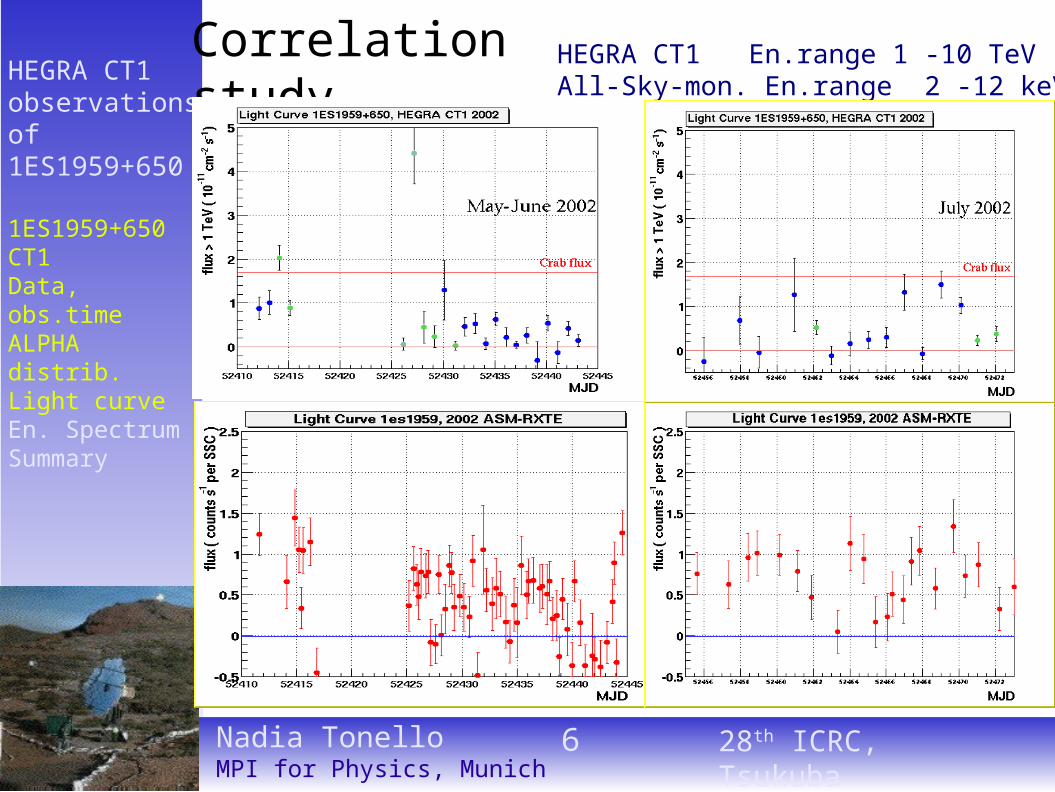
Correlation study
Nadia Tonello MPI for Physics, Munich
28th ICRC, Tsukuba
HEGRA CT1 En.range 1 -10 TeVAll-Sky-mon. En.range 2 -12 keV
6
HEGRA CT1 observations of 1ES1959+650
1ES1959+650CT1Data, obs.timeALPHA distrib.Light curveEn. SpectrumSummary

Energy spectrum
Nadia Tonello MPI for Physics, Munich
28th ICRC, Tsukuba
MJD: 52412 - 52584ZA range: 36.4°- 54.2° obs.time: 174.2 hnom data
/d.o.f. = 6.3 / 5f0 = (1.17± 0.27) 10 -11 cm -2 s-1 TeV-1
= 2.3 (fixed)E0 = (1.79 ± 0.31) TeV
Fit: power law function and exponential cut-off (solid line)
Fit: pure power law(dashed line)
/d.o.f. = 9.9 / 5f0 = (0.78± 0.13) 10 -11 cm -2 s-1 TeV-1
= 3.52 ± 0.18
7
HEGRA CT1 observations of 1ES1959+650
1ES1959+650CT1Data, obs.timeALPHA distrib.Light curveEn. SpectrumSummary
dF/dE = f0 (E/TeV) -
dF/dE = f0 (E/TeV) -e -(E/E0)

Summary and Conclusions
Nadia Tonello MPI for Physics, Munich
28th ICRC, Tsukuba8
We observed 1ES1959+650 in 2000, 2001 and 2002. Low flux recorded in 2000, 2001 (no significant signal in CT1).
In 2002, three periods of increased flux have been seen, one of them recorded during moonlight conditions.
No clear correlation between flares in the X-ray and -ray regions. Study in progress.
Spectrum compatible with a power law, well described also adding a cut-off. Due to lack of statistics, no decisive discrimination possible.
HEGRA CT1 observations of 1ES1959+650
1ES1959+650CT1Data, obs.timeALPHA distrib.Light curveEn. SpectrumSummary