Very Large Power System Operators in the World
80
Very Large Power System Operators in the World S.P.Kumar Chief Manager Power System Operation Corporation Ltd. NLDC 1
-
Upload
lareina-strong -
Category
Documents
-
view
29 -
download
2
description
Very Large Power System Operators in the World. S.P.Kumar Chief Manager Power System Operation Corporation Ltd. Indian Power System : Amongst the Largest in the World. National Grid (UK) 68GW Capita: 65m. SO - UPS (Russia) 146 GW Capita: 144 m. PJM (USA) 165GW Capita: 51m. - PowerPoint PPT Presentation
Transcript of Very Large Power System Operators in the World

Very Large Power System Operators in the World
S.P.Kumar
Chief Manager
Power System Operation Corporation Ltd.
NLDC 1

Indian Power System : Amongst the Largest in the World
National Grid (UK)
68GW
Capita: 65m
MidWest ISO (USA)159GW
Capita: 40m
RTE (France)93GW
Capita: 65m
PJM (USA)165GW
Capita: 51m
Red Electrica (Spain)93GW
Capita: 47m
ONS (Brazil)100GW
Capita: 170m
SO - UPS (Russia)146 GW
Capita: 144m
Tepco (Japan)64GW
Capita: 45m
KPX (South Korea)70GW
Capita: 49m
Terna (Italy)57GW
Capita: 60m
SGCC (China)900GW
Capita: 1000m
PGCIL (India)163GW
Capita: 1200mEskom
(South Africa)43.5GW
Capita: 49m
Source: VLPGO, 2010
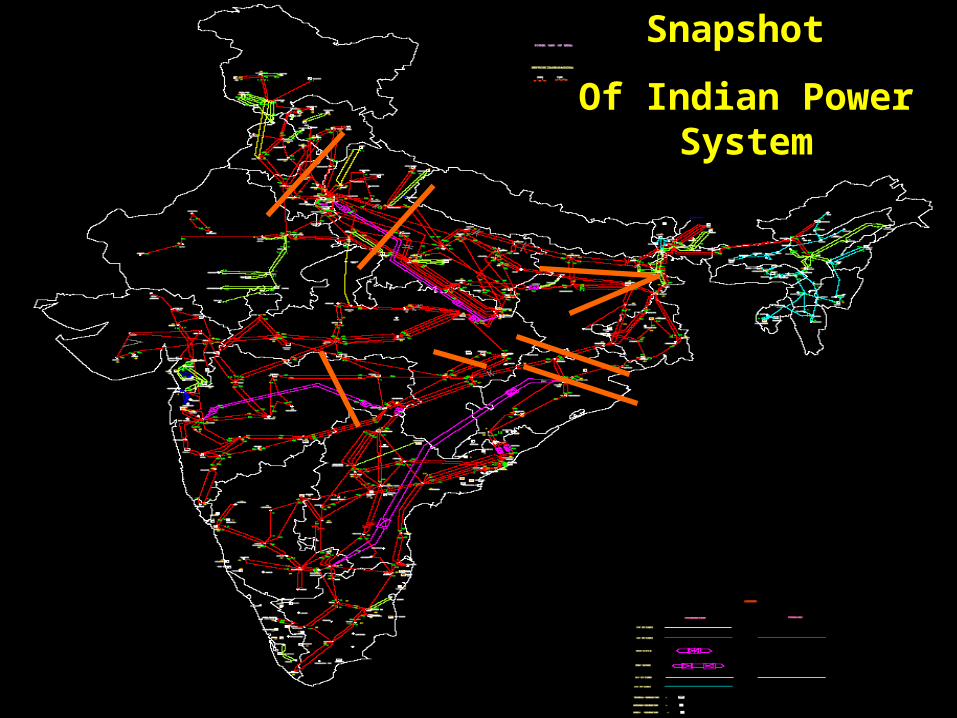
Snapshot
Of Indian Power System

Typical Numbers for Indian Power System…
Demand :~ 110 GW
Generating Units :~ 1600
400kV & above Trans. Line :~ 700
Transformers :~ 2000
Busses :~ 5000
Control Areas :~ 100
Inter-State Metering Points :~ 3000
Schedule Matrix Elements :~ 96 X 100 X (~10)
~=100000
Open Access transactions typical daily :~ 100
Captives participating in market :~ 125
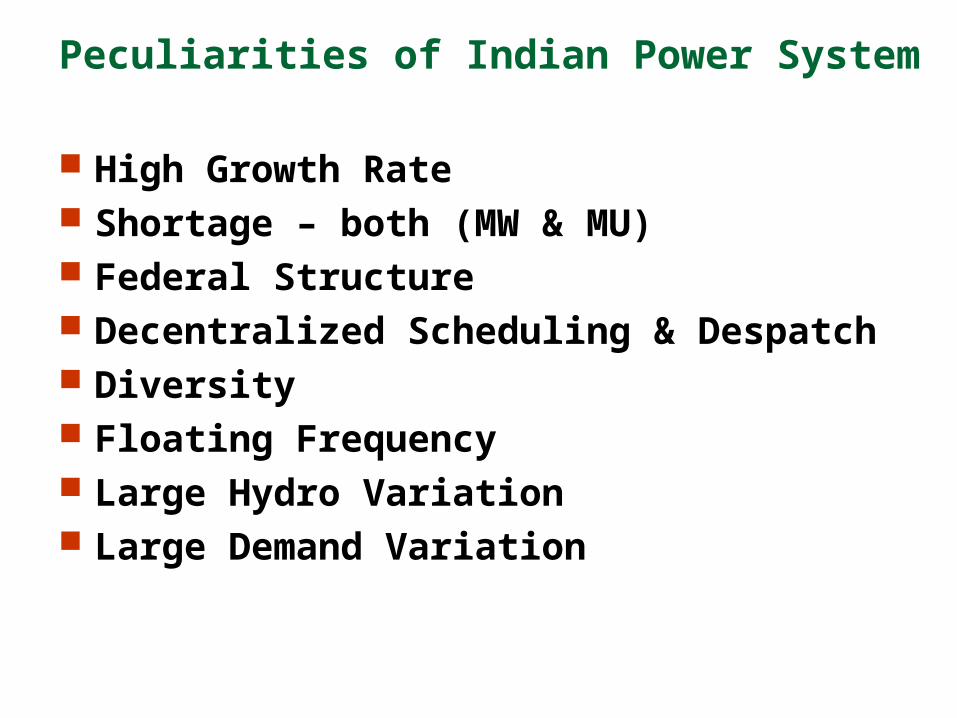
Peculiarities of Indian Power System
High Growth Rate Shortage – both (MW & MU) Federal Structure Decentralized Scheduling & Despatch Diversity Floating Frequency Large Hydro Variation Large Demand Variation

How do we relate Internationally to the Other Grid Operators Worldwide ?
Associations Worldwide
Very Large Power Grid Operators (VLPGO)
TSO-Comparison Group (http://www.tso-comparison.com)
CIGRE (INTERNATIONAL COUNCILON LARGE ELECTRIC SYSTEMS) - C2 and C5 committees
http://www.cigre-c2.org/ System Operation and Control http://www.cigre-c5.org/ Electricity Markets and Regulation
(Conseil International des Grands Réseaux Electriques).International Interconnections
SAARC

Very Large Power Grid Operators(VLPGO)
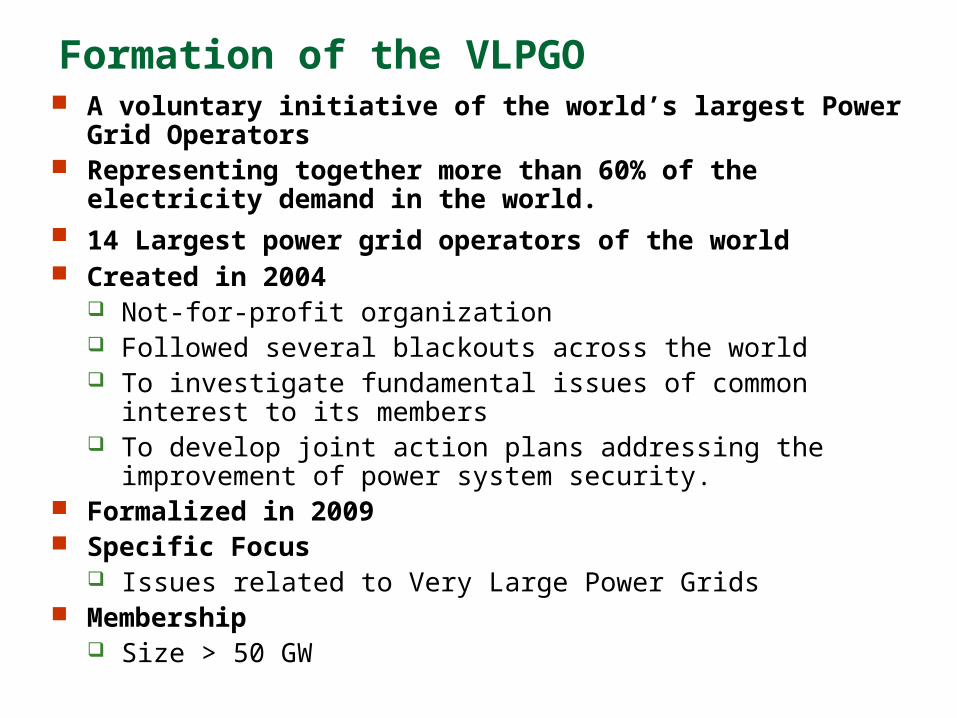
Formation of the VLPGO A voluntary initiative of the world’s largest Power Grid Operators Representing together more than 60% of the electricity demand
in the world. 14 Largest power grid operators of the world Created in 2004
Not-for-profit organization Followed several blackouts across the world To investigate fundamental issues of common interest to its
members To develop joint action plans addressing the improvement of power
system security. Formalized in 2009 Specific Focus
Issues related to Very Large Power Grids Membership
Size > 50 GW

VLPGO : Role of Grid Operators Worldwide Work constantly to plan, monitor, supervise and
control the energy delivered as a continuous process 24 hours a day
Delivering the electricity that powers modern societies Critical role of Grid Operators includes
acting on behalf of Consumers, to ensure quality while minimizing costs and recognizing economic and societal dependence on electricity;
a technical role in planning, designing, and managing the Power Systems;
an interface role with generators, market participants and distributors, which are the most direct users of the transmission grid;
a natural role of interlocutors with power exchanges, regulators and governments.

Common Challenges for VLPGO Providing power system reliability and security Smart Grid development Integration of Renewables Integration of Electric Vehicles Capacity development and optimization including system
renovation and development, equipment upgrading. Reducing CO2 emissions Improve productivity and energy efficiency Power system visualization Demand Side Management Interconnections
Development of new technologies and HVDC Establishment and coordination of new control centers
11
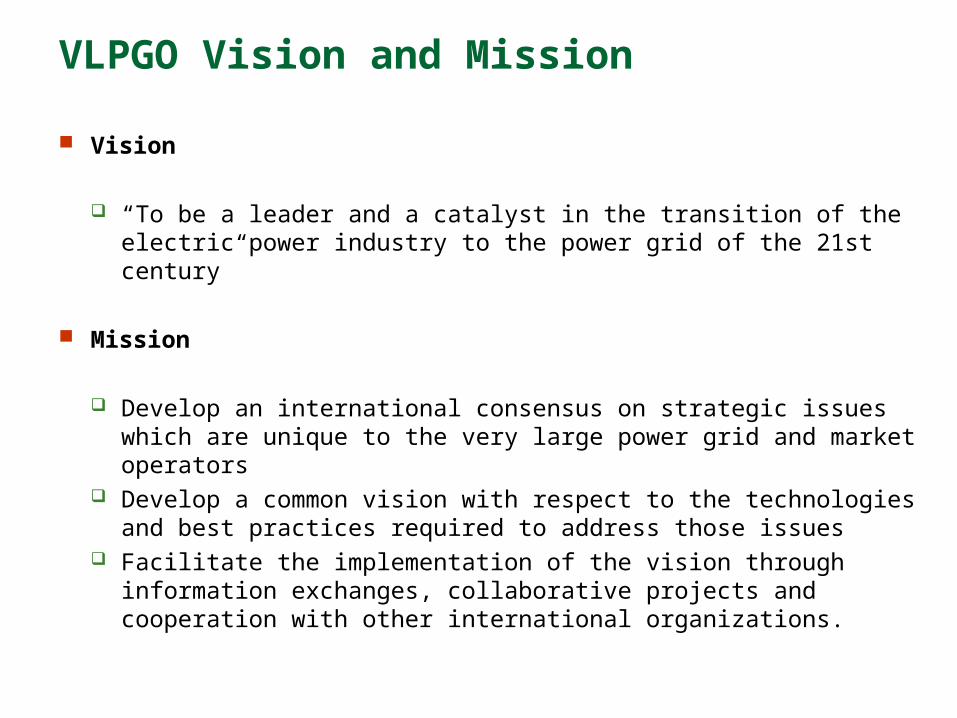
VLPGO Vision and Mission
Vision
“To be a leader and a catalyst in the transition of the electric power industry to the power grid of the 21st century”
Mission
Develop an international consensus on strategic issues which are unique to the very large power grid and market operators
Develop a common vision with respect to the technologies and best practices required to address those issues
Facilitate the implementation of the vision through information exchanges, collaborative projects and cooperation with other international organizations.

Objectives: Transition to Grid of 21st Century
Innovate Thinking An international consensus on strategic issues challenging the
very large power grid and market operators
Technology Advancement A common vision with respect to the technologies and best
practices required to address those issues in a framework of social and environmental responsibility of each member.
Industry Leadership Through a common Communication Policy, the dissemination
and implementation of a common vision through information exchange, collaborative projects and cooperation with other international organizations.
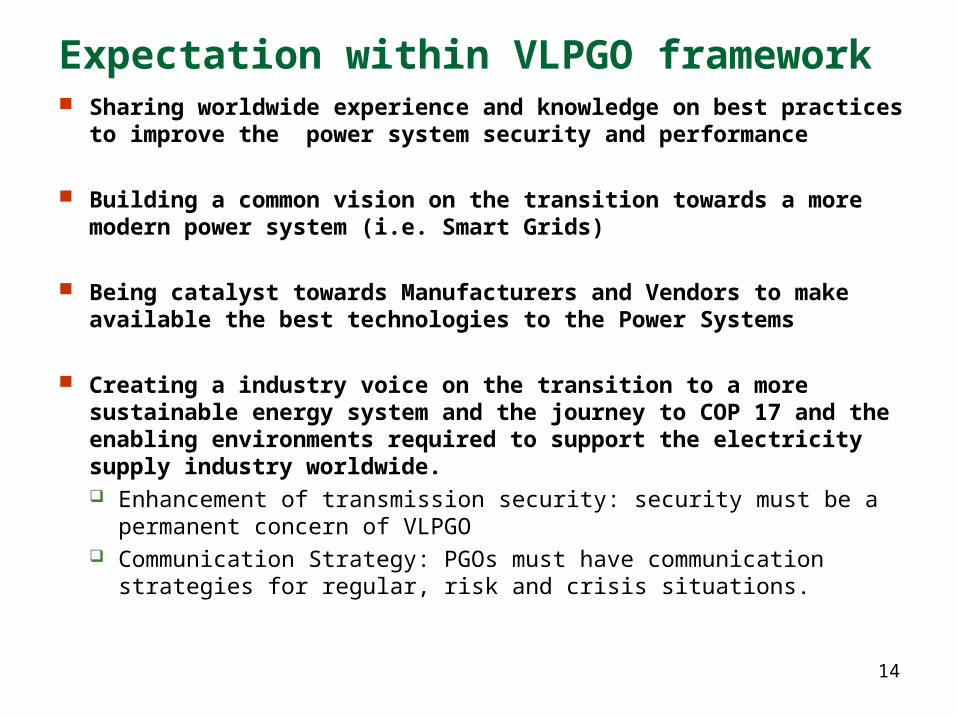
Expectation within VLPGO framework Sharing worldwide experience and knowledge on best practices to
improve the power system security and performance
Building a common vision on the transition towards a more modern power system (i.e. Smart Grids)
Being catalyst towards Manufacturers and Vendors to make available the best technologies to the Power Systems
Creating a industry voice on the transition to a more sustainable energy system and the journey to COP 17 and the enabling environments required to support the electricity supply industry worldwide. Enhancement of transmission security: security must be a permanent
concern of VLPGO Communication Strategy: PGOs must have communication strategies for
regular, risk and crisis situations.
14

VLPGO Delivering Value to its Members Emerging Technology
Identify early trends Assess common impacts Develop common solution requirements
Shared Learning Identify common key operational risks Share after-the-fact analysis of major events
Common Approaches & Solutions Develop common specifications across suppliers Create new market mechanisms Produce guidelines for common reliability issues
Best Practices Share “best” Ideas and policies Create methodologies for evaluation or analysis
Industry Influence Develop common positions for industry stakeholders

16
Structure of VLPGO Activities
The VLPGO consists of:
The Governing Board has: Streamlined the working approach between different forums
Is writing guidance for conveyors – to improve performance (2010)
Focused on a smaller number of activities to deliver material progress & create a multi-year plan
5 Joint Projects 5 Working Groups 2 Workshops
Governing Board
Short-term collaboration on specific project by subset of
membersOne of exploration of topic
areaTask Task TaskTask Task

17
Year Work Group/Joint Project Name of the WG/JP/WS2005 WG #1 Cascading Events and How to Prevent Them
WG #2 EMS Architectures For The 21st CenturyWG #3 Advanced Decision Support Tools
2006 WG #1 Cascading Events and Restoration ProcessWG #2 EMS Architectures For The 21st CenturyWG #3 Advanced Decision Support Tools
2007 WG #1 Application of PMU Technology, with Emphasis on Early Detection and Prevention of Cascading Events"WG #2 Visualization for Decision Support in the Control RoomWG #3 Market Mechanisms and Incentive Instruments to promote generating capacity - and demand response
2008 WG #1 Application of Synchrophasor Technology in Power system operationWG #2 Preventing Blackouts and Cascading eventsWG #3 Market Mechanisms and Incentive Instruments to promote generating capacity - and demand response
2009 WG #1 SynchrophasorsWG #2 Enhanced SecurityWG #3 Integration of RenewablesJP #1 Asset ManagementJP #2 HVDCJP #3 PHEVsJP #4 Backup Control CentersJP #5 Monitoring and AutomationJP #6 Visualization
2010 WG #1 SynchrophasorsWG #2a Enhanced Security- VulnerabilityWG #2b Enhanced Security- RestorationWG #3 Integration of Renewable TechnologiesJP #1 Asset ManagementJP #2 HVDCJP #3 PHEVsJP #4 Monitoring and AutomationWS #1 Smart GridWS #2 Key Performance Indicators (KPI)
18
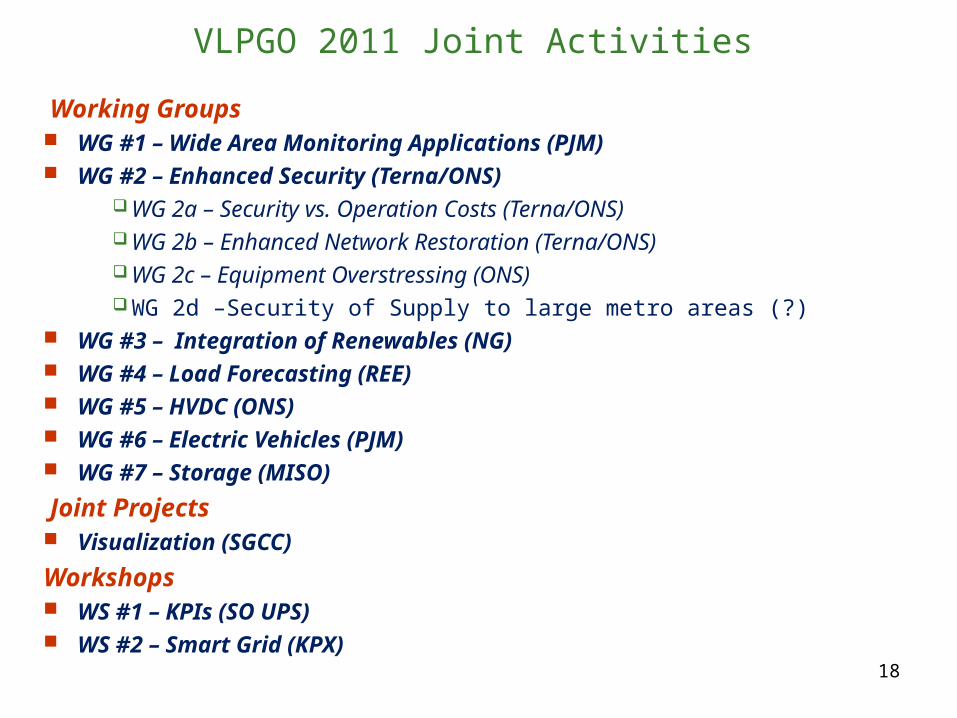
VLPGO 2011 Joint Activities
Working Groups WG #1 – Wide Area Monitoring Applications (PJM) WG #2 – Enhanced Security (Terna/ONS)
WG 2a – Security vs. Operation Costs (Terna/ONS)WG 2b – Enhanced Network Restoration (Terna/ONS)WG 2c – Equipment Overstressing (ONS)WG 2d –Security of Supply to large metro areas (?)
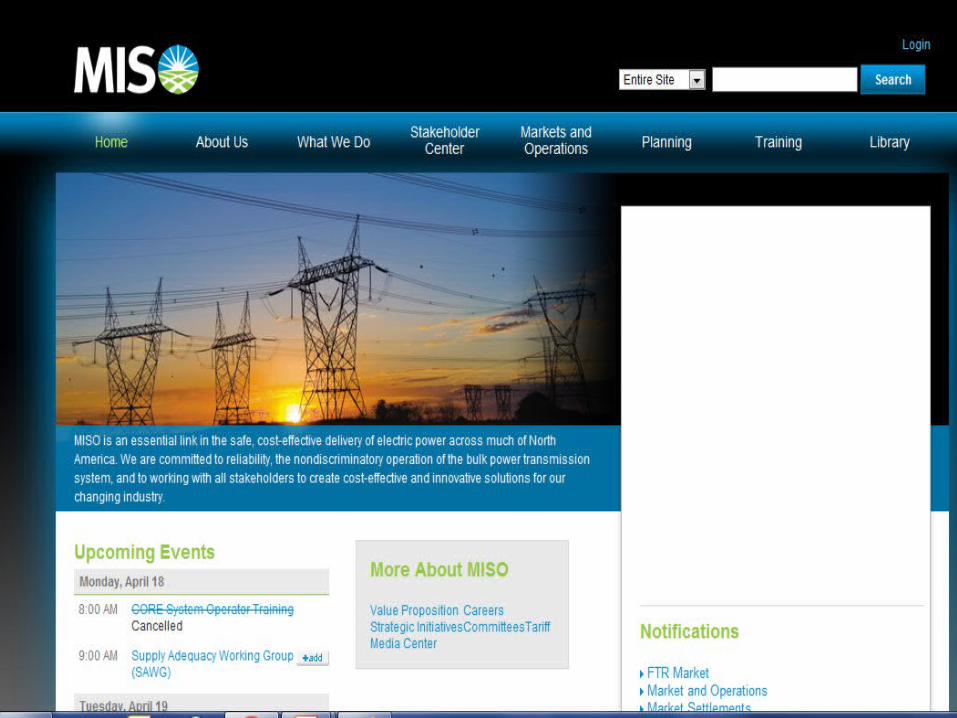
WG #3 – Integration of Renewables (NG) WG #4 – Load Forecasting (REE) WG #5 – HVDC (ONS) WG #6 – Electric Vehicles (PJM) WG #7 – Storage (MISO)
Joint Projects Visualization (SGCC)
Workshops WS #1 – KPIs (SO UPS) WS #2 – Smart Grid (KPX)

19
VLPGO Current Activities - mapped
Enduring Drivers
Principle Drivers
Smart
WS #1: Smart Grids
Renewable
WG #3: Integration of
Renewable Technologies
Security and Safety of Supply
WG #2a: Enhanced Security - Vulnerability
Efficient Operation
New TechnologyWG #1: SynchroPhasors (Wide Area
Monitoring)
JP #2: HVDC in
Synchronous Power
Systems
JP #1: Asset Management
JP #3: Plug-in Hybrid Electric Vehicles
JP #4: Monitoring and
Automation
#5: Visualization
WS #2 – Key Performance Indicators (KPIs)
WG #2b: Enhanced Security - Restoration
WG #2c: Equipment Overstresses

20
VLPGO Accomplishments thus far
20
SynchroPhasors:WAMS ArchitectureRequirements and PMUCertification Test MethodologyPreliminary Report”, 2008
SynchroPhasors:WAMS ArchitectureRequirements and PMUCertification Test MethodologyPreliminary Report”, 2008
Capacity Markets:“Market Mechanisms andincentive Instrument toPromote Generating Capacityand Demand Response”, 2008
Capacity Markets:“Market Mechanisms andincentive Instrument toPromote Generating Capacityand Demand Response”, 2008
Self Healing Grid:“Cascading Events and How to PreventThem – Restoration Process PreventionOf Large-Scale Blackouts In The LargeMetropolitan Cities”, 2006 - ApplicationGuide“Self Healing Techniques to PreventBlack Outs and Cascading Events”,2008
Self Healing Grid:“Cascading Events and How to PreventThem – Restoration Process PreventionOf Large-Scale Blackouts In The LargeMetropolitan Cities”, 2006 - ApplicationGuide“Self Healing Techniques to PreventBlack Outs and Cascading Events”,2008
EMS Architecture:EMS Architectures for the 21st
Century (transferred this workto CIGRE working groupD2.24)
EMS Architecture:EMS Architectures for the 21st
Century (transferred this workto CIGRE working groupD2.24)

VLPGO Workplan … Road Ahead
NLDC 21

22
VLPGO Future Drivers
Principle Drivers
Enduring Drivers
Connecting low
carbon renewable
sources of
generation
Building SMARTer
electricity networks
of the future & the
impact of SMART
load changes
Ensuring the future
Security and
Safety of Supply of
our networks
Advancing and implementing new technology to the benefits of our customers
Developing network capacity & operating our electricity networks in the most efficient and economical way we can

TSO – Comparison Group
The Group of International Comparison of Transmission System Operation Practice
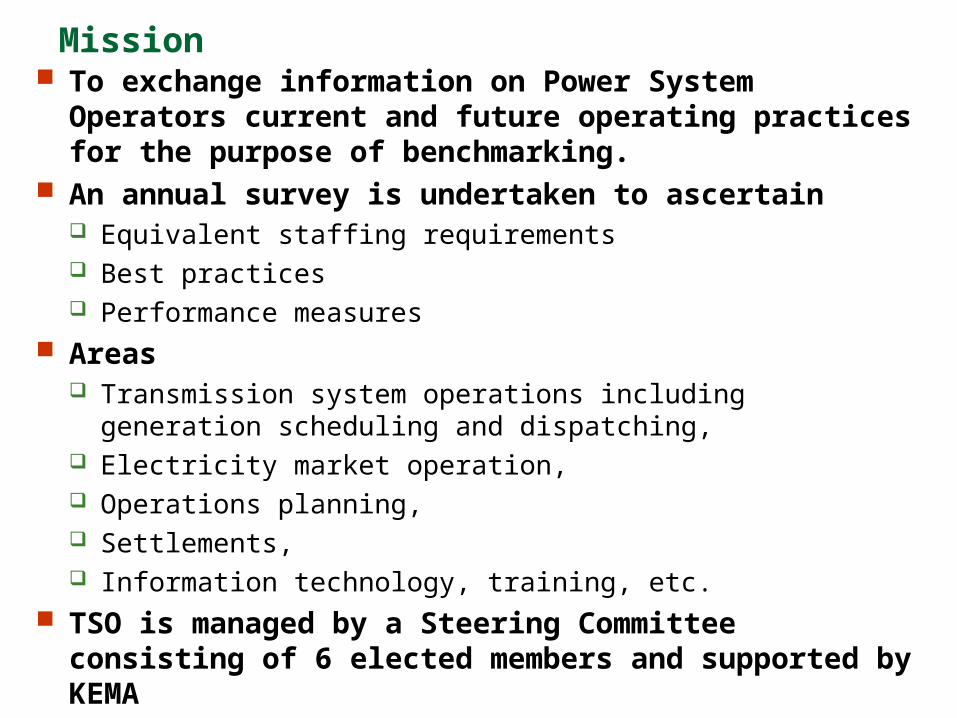
Mission To exchange information on Power System Operators
current and future operating practices for the purpose of benchmarking.
An annual survey is undertaken to ascertain Equivalent staffing requirements Best practices Performance measures
Areas Transmission system operations including generation
scheduling and dispatching, Electricity market operation, Operations planning, Settlements, Information technology, training, etc.
TSO is managed by a Steering Committee consisting of 6 elected members and supported by KEMA

Most important reasons for being a member
Performance Measures Database (> 50 data points) Comparing with other TSOs (Benchmark Model) Identification of peers (Company profiles / Activity
Lists) Learning from other TSOs (Best Practice) Informal contacts and TSO Questionnaires
(Networking) Counter Benchmark to Regulatory Benchmark
(Insurance policy)

Members Members Name Country ESKOM South Africa Red Eléctrica de España* Spain Landsnet Iceland Fingrid* Finland Amprion* Germany Transpower NZ* New Zealand Saudi Electricity Company Saudi Arabia TenneT Netherlands Statnett SF Norway PJM Interconnection** PA, USA National Grid Electricity Transmission* United Kingdom CLP Power* Hong Kong ESB NG Ireland Transpower Germany Swissgrid Switzerland Rede Eléctrica Nacional Portugal Hydro Québec Canada Svenska Kraftnät Sweden PSE Poland EWA Bahrain China Southern Power Grid China Power Grid Corporation of India Ltd. India
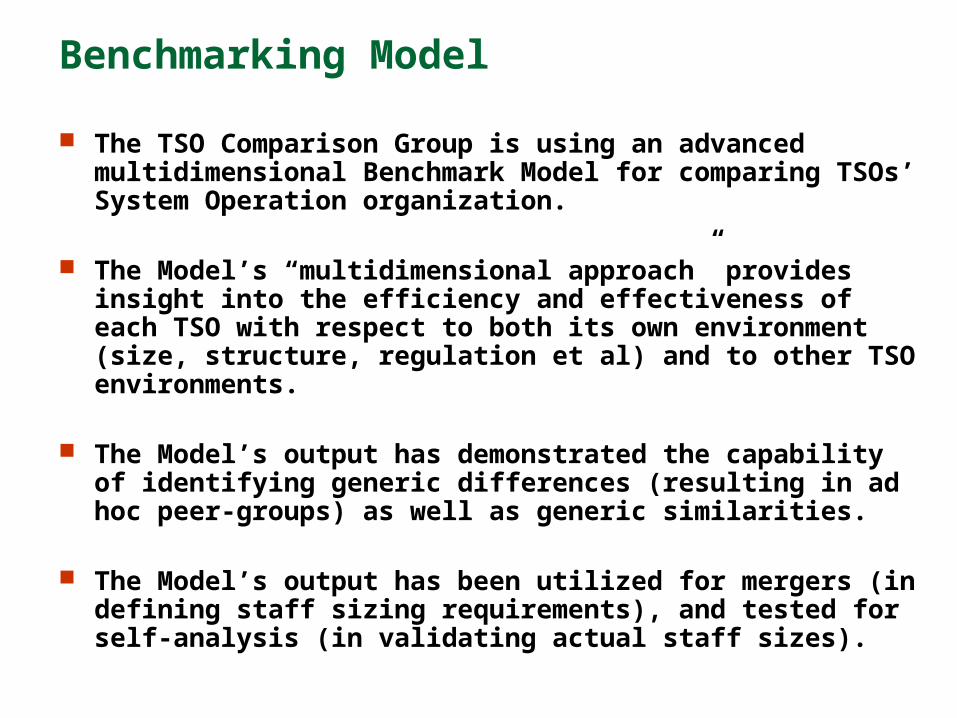
Benchmarking Model
The TSO Comparison Group is using an advanced multidimensional Benchmark Model for comparing TSOs’ System Operation organization.
The Model’s “multidimensional approach” provides insight into the efficiency and effectiveness of each TSO with respect to both its own environment (size, structure, regulation et al) and to other TSO environments.
The Model’s output has demonstrated the capability of identifying generic differences (resulting in ad hoc peer-groups) as well as generic similarities.
The Model’s output has been utilized for mergers (in defining staff sizing requirements), and tested for self-analysis (in validating actual staff sizes).
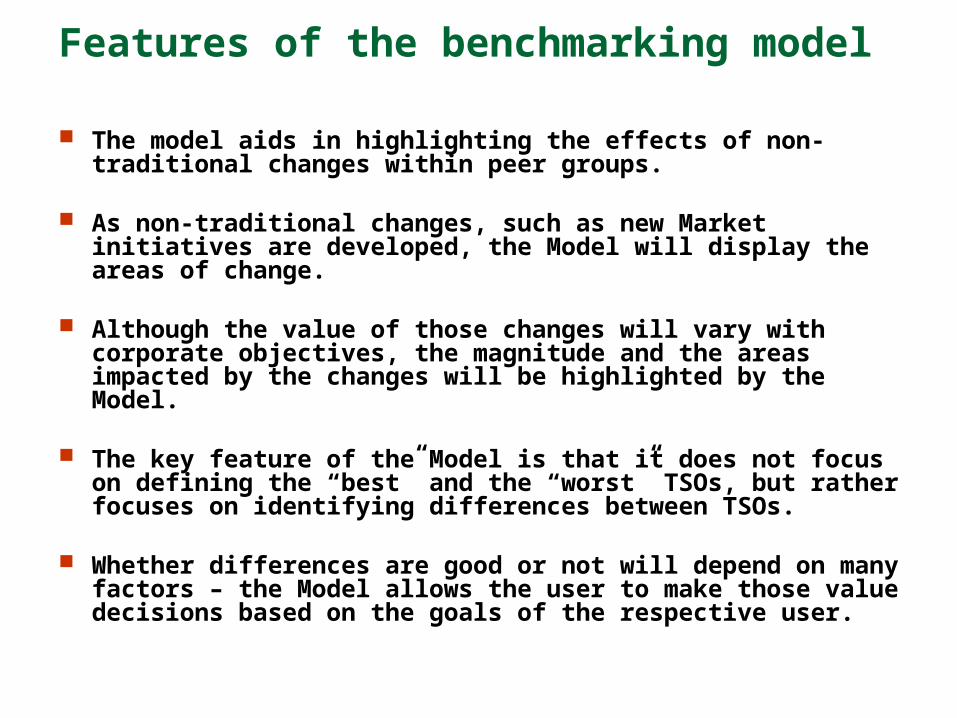
Features of the benchmarking model
The model aids in highlighting the effects of non-traditional changes within peer groups.
As non-traditional changes, such as new Market initiatives are developed, the Model will display the areas of change.
Although the value of those changes will vary with corporate objectives, the magnitude and the areas impacted by the changes will be highlighted by the Model.
The key feature of the Model is that it does not focus on defining the “best” and the “worst” TSOs, but rather focuses on identifying differences between TSOs.
Whether differences are good or not will depend on many factors – the Model allows the user to make those value decisions based on the goals of the respective user.

For Benchmark purposes a ‘standard TSO’ with five key System Operation processes has been defined..
SchedulingOperations
PlanningAfter The
FactReal TimeOperation
Support
1 year ahead 2 weeks ahead day of operationAfter day of operation
time
SchedulingOperations
PlanningAfter The
FactReal TimeOperation
Support
1 year ahead 2 weeks ahead day of operationAfter day of operation
time
SchedulingOperations
PlanningAfter The
FactReal TimeOperation
Support
1 year ahead 2 weeks ahead day of operationAfter day of operation
time
SchedulingOperations
PlanningAfter The
FactReal TimeOperation
Support
1 year ahead 2 weeks ahead day of operationAfter day of operation
time
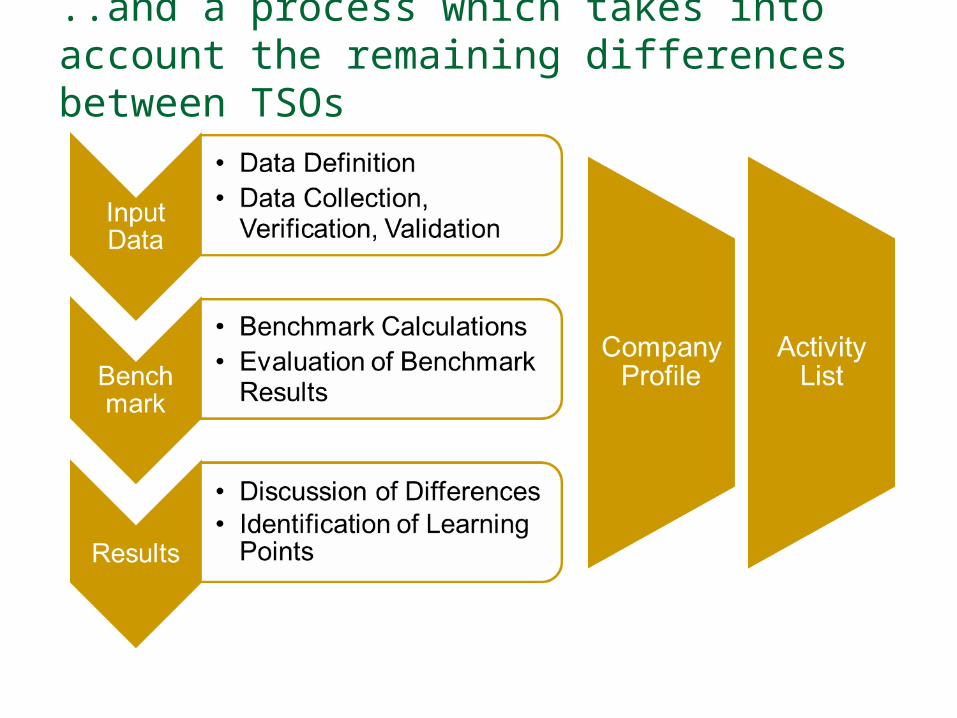
..and a process which takes into account the remaining differences between TSOs

Data Collected annually since 2000,validated by KEMA, verified by group
Operations Planning (1 year to 2 weeks before day of operation) Number of Planned Transmission
Outages Number of Planned Generating-unit
OutagesScheduling (2 weeks to 1 day before day of operation): Accuracy of peak load forecast Accuracy of minimum load forecast Transmission congestion:
Generation constrained "on". Foreseen transmission concerns Scheduled transmission outage
requests Scheduled generation outagesReal Time Operation (Day of Operation): Frequency control performance Average overall system deviation Generation and load instructions Personnel on shift RTO transmission outages taken
Support Operator training hours of teachers Number of SCADA database points
(Status points, Analog points, Control points)
Overall Performance: Transmitted energy at risk Response Time of Area Control
Error or Frequency Energy unsupplied due to
'unsupplied energy incidents' Unsupplied energy incidents Voltage excursionsReference Data Number of Staff in Full Time
Equivalents, separately for each process
Costs, separately for each process and network losses
Network date, including e.g. Circuit Ends, Line lengths, Generators, Peak Load, Transmitted Energy, Interconnectors.
All data are available for members
Example of data points:

For each process, two benchmark models have been developed…
TSO ProcessInput(staff, cost)
Output(uniform)
Environmental Factors(e.g. network size)
COST Based Model PERFORMANCE Based Model
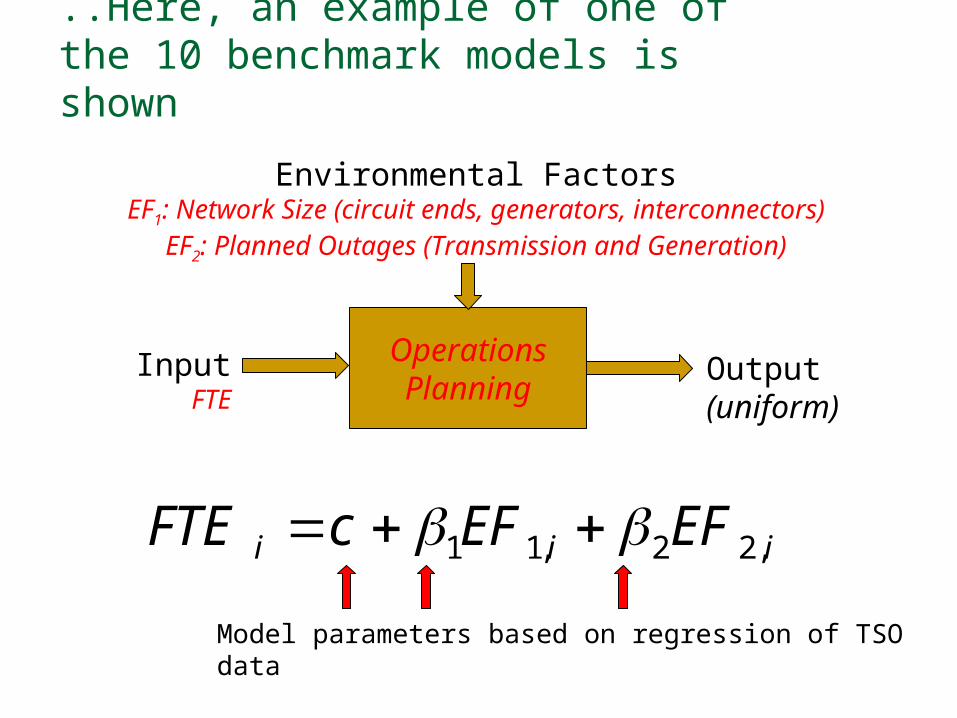
..Here, an example of one of the 10 benchmark models is shown
Operations Planning
InputFTE
Output(uniform)
Environmental FactorsEF1: Network Size (circuit ends, generators, interconnectors)
EF2: Planned Outages (Transmission and Generation)
iii EFEFcFTE ,22,11
Model parameters based on regression of TSO data

Real Time Operation FTE Model
EF1= NTW3 + NTW3a + 5*(NTW4 + NTW10a + NTW10b)
EF2= RTO5
NTW3 = Circuit Ends NTW10a = AC InterconnectorsNTW3a = Switched circuit ends NTW10b = DC InterconnectorsNTW4 = Generation Units RTO5 = RTO Transmission outages taken
En
viro
n-
men
tal
Fac
tors
Input
Circuit Ends, Switched Circuit Ends, Generating Units, Interconnectors, RTO Transmission Outages taken
Real Time Operation
OutputFTEs constant
FTE = ß1 EF1 + ß2 EF2 + 6 ± error
• At the Interim workshop it was decided to apply a fix constant of 6 for the RTO (FTE) model, which is considered to be to be the minimum staff required for 24 x7 operation in a control centre.
En
viro
n-
men
tal
Fac
tors
Input
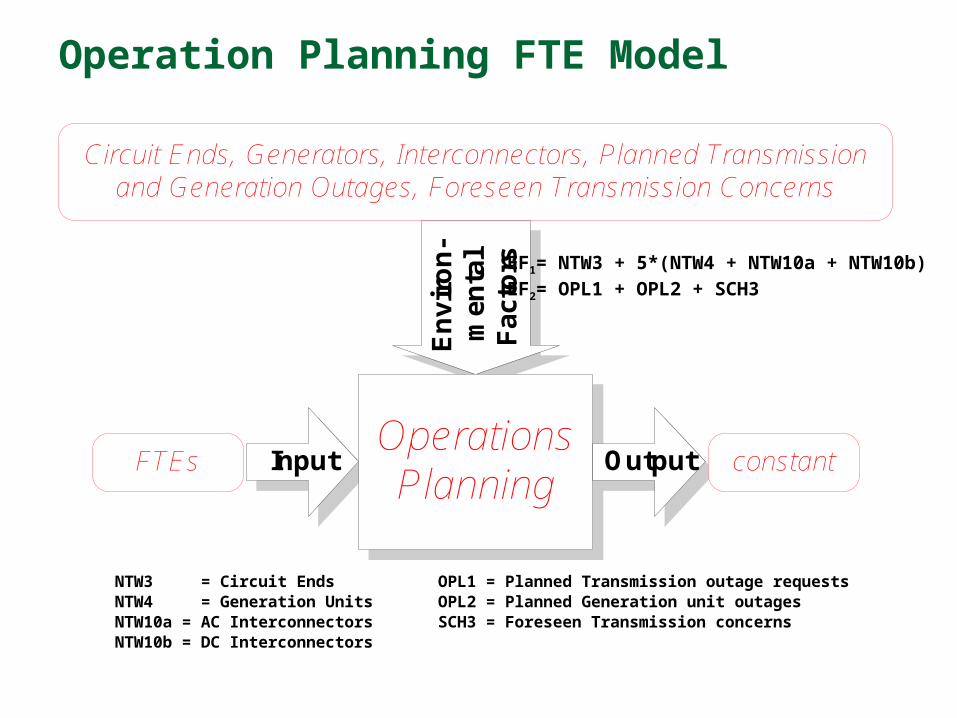
Circuit Ends, Generators, Interconnectors, Planned Transmissionand Generation Outages, Foreseen Transmission Concerns
OperationsPlanning
OutputFTEs constant
Operation Planning FTE Model
EF1= NTW3 + 5*(NTW4 + NTW10a + NTW10b)
EF2= OPL1 + OPL2 + SCH3
NTW3 = Circuit Ends OPL1 = Planned Transmission outage requestsNTW4 = Generation Units OPL2 = Planned Generation unit outagesNTW10a = AC Interconnectors SCH3 = Foreseen Transmission concernsNTW10b = DC Interconnectors

Scheduling FTE Model
EF1= SCH3 + SCH5 + SCH6
SCH3 = Foreseen Transmission concernsSCH5 = Scheduled Transmission outagesSCH6 = Scheduled Generation outages
En
viro
n-
men
tal
Fac
tors
Input
Scheduled Transmission and Generation Outages, Foreseen Transmission Concerns
Scheduling OutputFTEs constant

After the Fact FTE Model
EF1= NTW3 + 5*(NTW4 + NTW10a + NTW10b)
EF2= OAP4
NTW3 = Circuit Ends OAP4 = Unsupplied energy incidentsNTW4 = Generation UnitsNTW10a = AC InterconnectorsNTW10b = DC Interconnectors
En
viro
n-
men
tal
Fac
tors
Input
Circuit Ends, Generating Units, Interconnectors, Unsupplied Energy Incidents
After the Fact
OutputFTEs constantCost or FTE
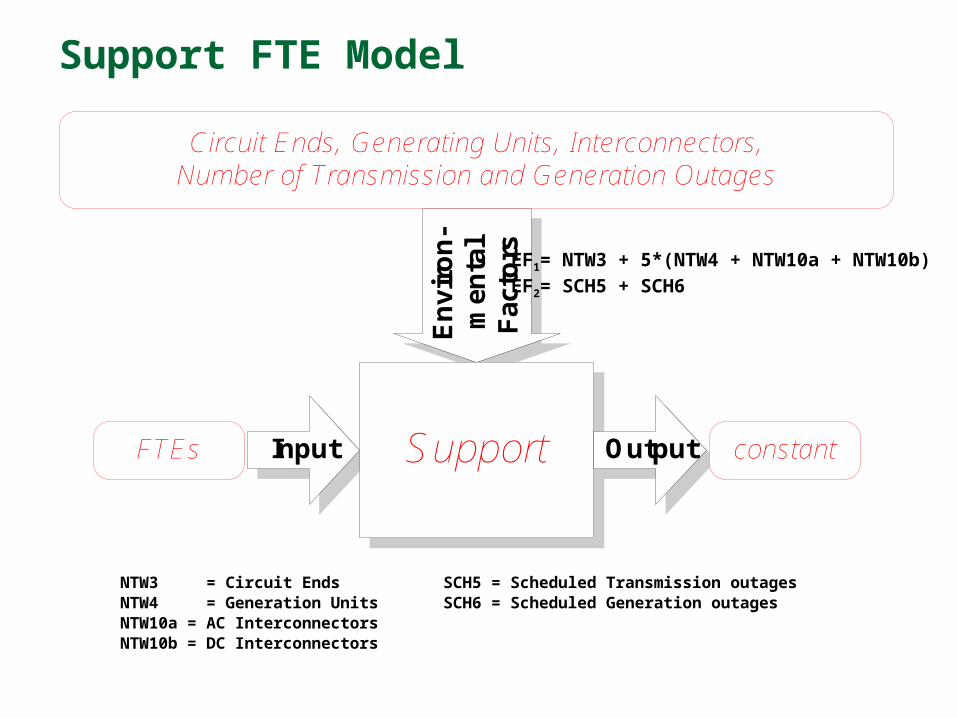
En
viro
n-
men
tal
Fac
tors
Input
Circuit Ends, Generating Units, Interconnectors, Number of Transmission and Generation Outages
Support OutputFTEs constant
Support FTE Model
EF1= NTW3 + 5*(NTW4 + NTW10a + NTW10b)
EF2= SCH5 + SCH6
NTW3 = Circuit Ends SCH5 = Scheduled Transmission outagesNTW4 = Generation Units SCH6 = Scheduled Generation outagesNTW10a = AC InterconnectorsNTW10b = DC Interconnectors

Which results in an assessmentfor each process for FTE and Cost
0
5
10
15
20
25
30
35
40
45
50
FT
Es
Actual 2005 FTEsBenchmark results (dots) with standard deviation
Actual 2005 FTEsBenchmark results (dots) with standard deviation
Example of Benchmark Results
Details are available to members only
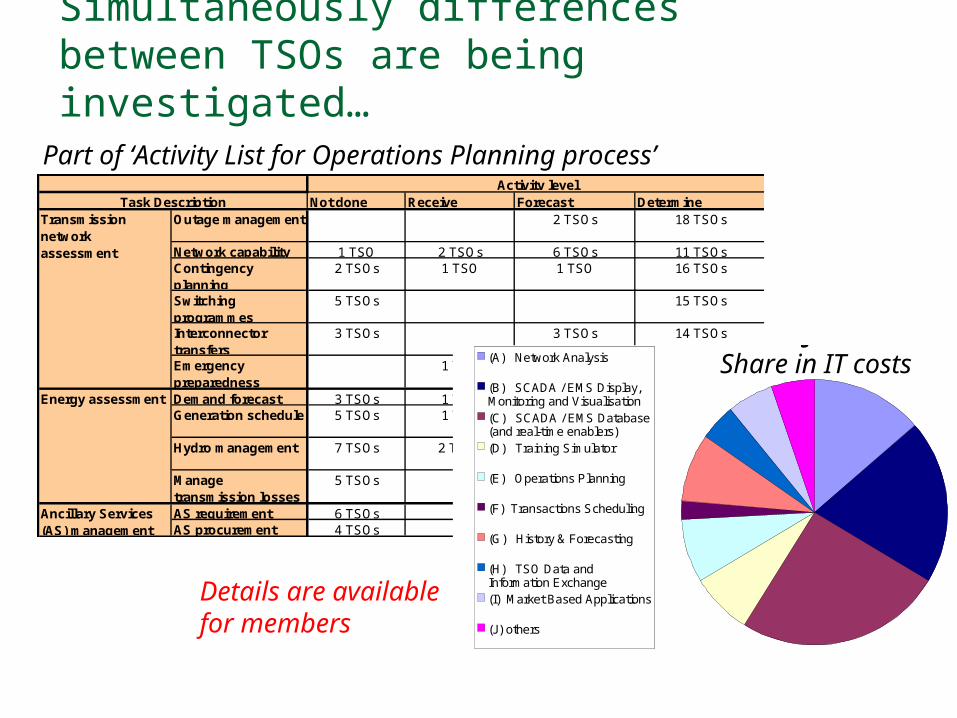
Simultaneously differences between TSOs are being investigated…
Not done Receive Forecast DetermineOutage management 2 TSOs 18 TSOs
Network capability 1 TSO 2 TSOs 6 TSOs 11 TSOsContingency planning
2 TSOs 1 TSO 1 TSO 16 TSOs
Switching programmes
5 TSOs 15 TSOs
Interconnector transfers
3 TSOs 3 TSOs 14 TSOs
Emergency preparedness
1 TSO 1 TSO 18 TSOs
Demand forecast 3 TSOs 1 TSO 5 TSOs 11 TSOsGeneration schedule 5 TSOs 1 TSO 5 TSOs 9 TSOs
Hydro management 7 TSOs 2 TSOs 2 TSOs 9 TSOs
Manage transmission losses
5 TSOs 15 TSOs
AS requirement 6 TSOs 3 TSOs 11 TSOsAS procurement 4 TSOs 16 TSOs
Ancillary Services (AS) management
Activity levelTask Description
Transmission network assessment
Energy assessment
(A) Network Analysis
(B) SCADA / EMS Display,Monitoring and Visualisation(C) SCADA / EMS Database(and real-time enablers)(D) Training Simulator
(E) Operations Planning
(F) Transactions Scheduling
(G) History & Forecasting
(H) TSO Data andInformation Exchange(I) Market Based Applications
(J) others
Average costs(A) Network Analysis
(B) SCADA / EMS Display,Monitoring and Visualisation(C) SCADA / EMS Database(and real-time enablers)(D) Training Simulator
(E) Operations Planning
(F) Transactions Scheduling
(G) History & Forecasting
(H) TSO Data andInformation Exchange(I) Market Based Applications
(J) others
Average costs
Details are available for members
Part of ‘Activity List for Operations Planning process’
Share in IT costs

And summarized in management presentations
PERFORMANCE
RE
SO
UR
CE
S
Low Resources /
High Performance
High Resources / Low Performance
Average resources
Average performance
PERFORMANCE
RE
SO
UR
CE
S
PERFORMANCE
RE
SO
UR
CE
S
Low Resources /
High Performance
High Resources / Low Performance
Average resources
Average performance
0
5
10
15
20
25
30
35
40
45
50
FTEs
Actual 2005 FTEsBenchmark results (dots) with standard deviation
Actual 2005 FTEsBenchmark results (dots) with standard deviation
0
5
10
15
20
25
30
35
40
45
50
FTEs
Actual 2005 FTEsBenchmark results (dots) with standard deviation
Actual 2005 FTEsBenchmark results (dots) with standard deviation
0
5
10
15
20
25
30
35
40
45
50
FTEs
Actual 2005 FTEsBenchmark results (dots) with standard deviation
Actual 2005 FTEsBenchmark results (dots) with standard deviation
0
5
10
15
20
25
30
35
40
45
50
FTEs
Actual 2005 FTEsBenchmark results (dots) with standard deviation
Actual 2005 FTEsBenchmark results (dots) with standard deviation
0
5
10
15
20
25
30
35
40
45
50
FTEs
Actual 2005 FTEsBenchmark results (dots) with standard deviation
Actual 2005 FTEsBenchmark results (dots) with standard deviation
Sum of five benchmark
results
Quality of System Operation(frequency, energy not supplied, Voltage)

Results of Annual Survey
An important basis for performance comparison and for improvement of operating practices.
Experience of Members of the Group discussed each year in one or two Workshops upon invitation of one of the participating companies
Membership of TSO is presently restricted to up to 30 companies / departments that qualify as an operator of a bulk transmission system

Issues to be Considered in International Interconnections
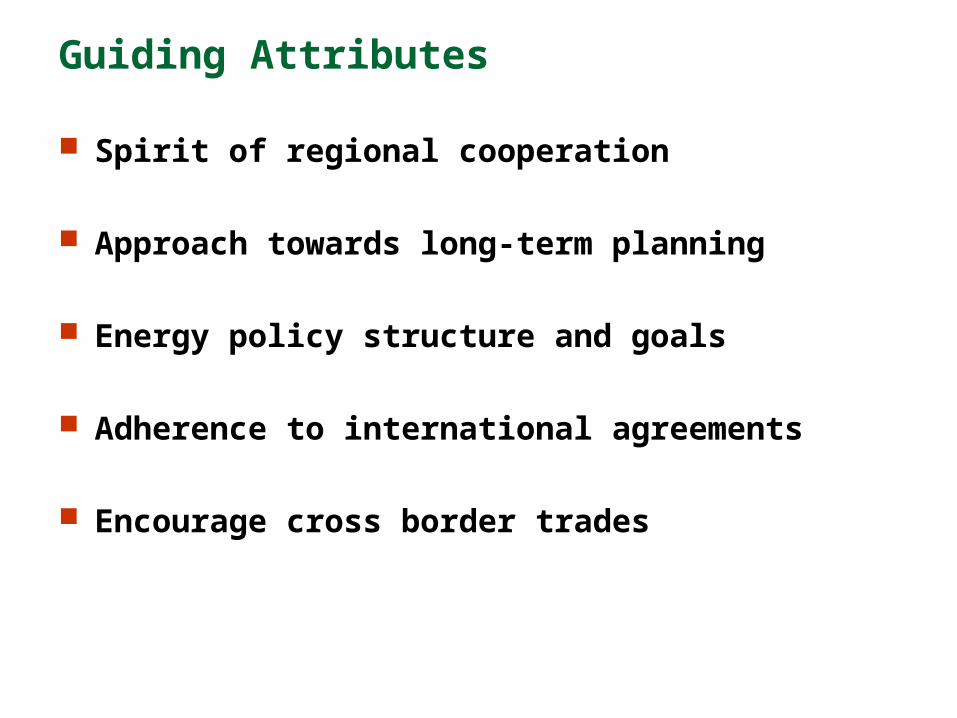
Guiding Attributes
Spirit of regional cooperation
Approach towards long-term planning
Energy policy structure and goals
Adherence to international agreements
Encourage cross border trades

International Interconnections - Benefits
Improving Reliability and Pooling of Reserves Reduced investment in generating capacity Improving load factor and increasing load diversity Economies of scale Diversity of generation mix and supply security Economic exchange Environmentally benign dispatch and siting of new
plant Coordination of maintenance schedules

International Interconnections – Various Aspects
Technical
Commercial
Regulatory/Legal
Coordination

Technical Objectives
Economy
Security
Reliability
Efficiency
Minimal environmental impact
Quality

Coordination
Working level coordination committee
Technical
Operation
Commercial
Protection

49
Weblink: http://www.un.org/esa/sustdev/publications/energy/interconnections.pdf
International Interconnections
Maps not to scale
BhutanNepal
Tala: 1020 MWChukha: 336 MWKurichu: 60 MWNet import by India
India- Bhutan synchronous links400 kV Tala-Binaguri D/C400 kV Tala-Malbase-Binaguri220 kV Chukha-Birpara D/C220 kV Chukha-Malbase-Birpara132 kV Kurichu-Bongaigaon
Over 16 links of 132/33/11 KVRadial links with NepalNet import by Nepal
Bangladesh400 KV AC line between Baharampur(India) and
Bheramara(Bangladesh) with 500 MW HVDC sub-station at
Bheramara
Sri – Lanka Madurai(India) and
Anuradhapura(Sri-Lanka) through ±500 KV HVDC
under sea cable

51
Survey Questionnaires Questionnaire I – Present Power Supply Position Questionnaire II
Organization of the Electricity Supply Industry Power System Planning & Planning Criterion Legal / Regulatory Issues Load despatch function Technical Issues Balancing Supply – Demand Electricity Market Ancillary Services Renewable Energy Resources Transmission Pricing Congestion Management Grid discipline Investments Existing International Interconnections
Questionnaire III – Long term projections

52
Draft Template – Contents

53
Draft Template – Tables and Figures
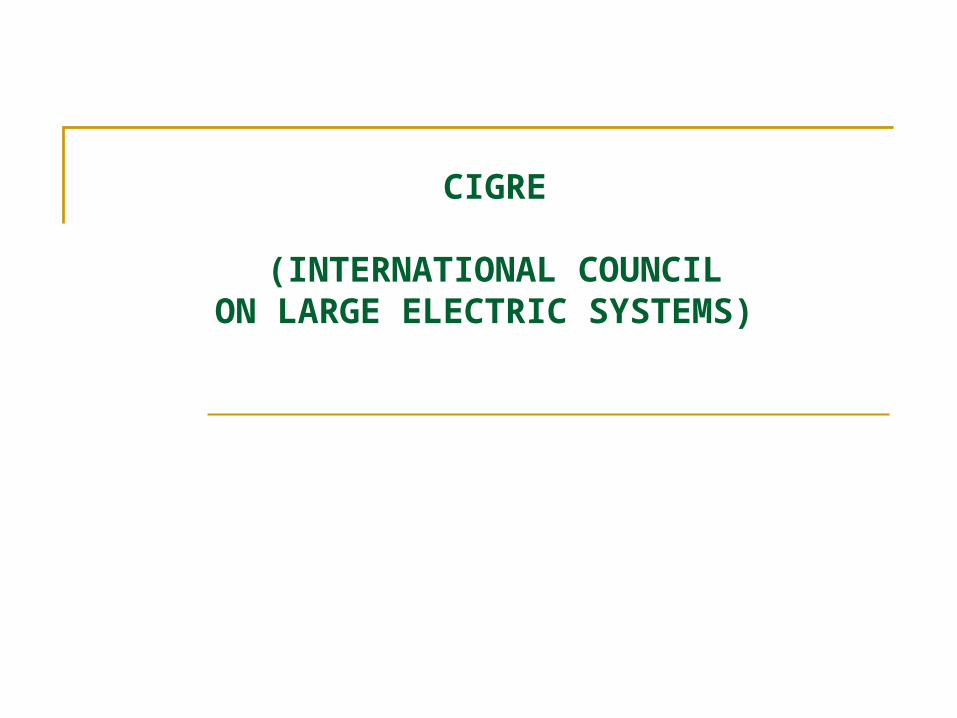
CIGRE
(INTERNATIONAL COUNCILON LARGE ELECTRIC SYSTEMS)

Aim
CIGRE (International Council on Large Electric Systems) is one of the leading worldwide Organizations on Electric Power Systems, covering their technical, economic, environmental, organisational and regulatory aspects.
A permanent, non-governmental and non-profit International Association, based in France, CIGRE was founded in 1921 and aims to: Facilitate the exchange of information between engineering
personnel and specialists in all countries and develop knowledge in power systems.
Add value to the knowledge and information exchanged by synthesizing state-of-the-art world practices.
Make managers, decision-makers and regulators aware of the synthesis of CIGRE's work, in the area of electric power.

CIGRE: Developing Technical Knowledge
CIGRE develops technical knowledge through 3 types of activities:
- Organizing Conferences and meetings, where papers are discussed,
- Carrying out Permanent studies by 16 Study Committees, each dealing with a specific technical field, publishing reports and organizing Tutorials.
- Making its publications available to members of CIGRE and others.

Study Committee C2 - System Operation and Control
The Study Committee C2 serves within Cigré by forming a working concept for the functionalities, structures and competence needed to operate integrated power systems in a way that is in compliance with the social requirements for security of electricity supply.
The performance of power systems in real time depend on technical quality factors built into the systems through various activities and knowledge currently covered by the other Cigré Study Committees. SC C2 therefore needs to use and combine results provided within these committees.
An area which is unique for C2 is however the dependency on a good performance of human resources in real-time system operation activities.
In these respects SC C2 encircles a wide range of competence areas and interfaces to other disciplines.
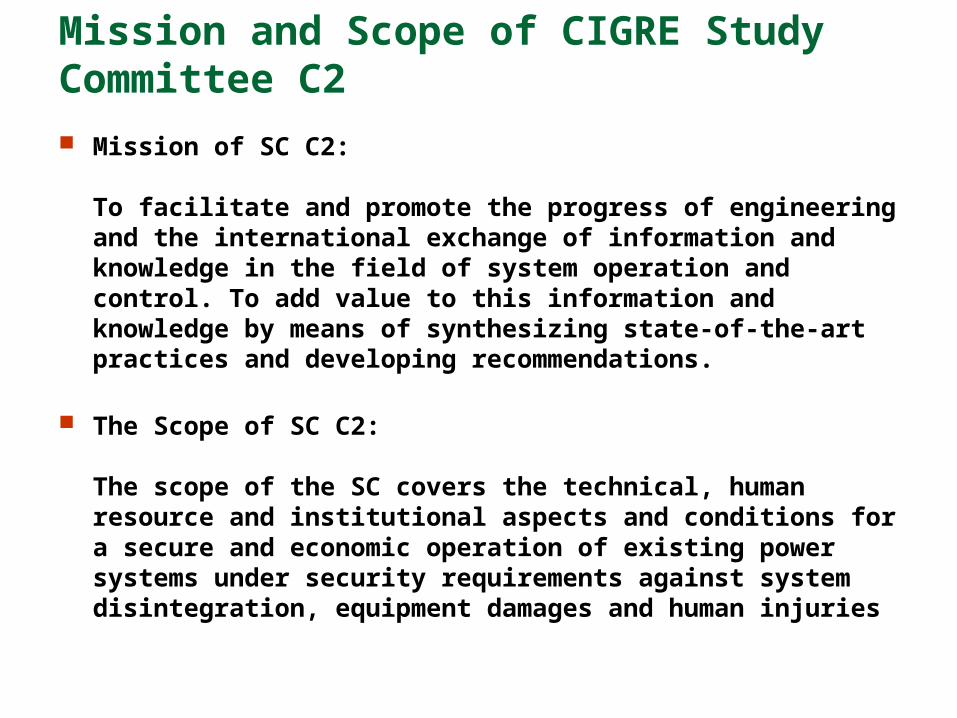
Mission and Scope of CIGRE Study Committee C2
Mission of SC C2:
To facilitate and promote the progress of engineering and the international exchange of information and knowledge in the field of system operation and control. To add value to this information and knowledge by means of synthesizing state-of-the-art practices and developing recommendations.
The Scope of SC C2:
The scope of the SC covers the technical, human resource and institutional aspects and conditions for a secure and economic operation of existing power systems under security requirements against system disintegration, equipment damages and human injuries

Driving forces for future work The priorities to important emerging factors that will
influence and define new requirements on the System Operation performance.
Directions are: Integration of regional and national grids into large open markets Management of generation capacity and energy shortages Management of capacity shortages Impact from new sources of dispersed generation and related
system requirements Influence from customer needs and response Interaction between open market trading mechanisms and
power system operation in congestion and transit flow management
Integration of information and communication technology

Type 1 Number 2 Title 3 Convener 4 Created5 Disb 6
WG C2.11 System control in light of recent developments in Substation control (IEC standards). M. Power (EI) 2007 2010 WG C2.12 Applications of Synchronised Phasor Measurement in Power Systems TBD Proposed TBD WG C2.13 Voltage and Var support in System Operation T. Papazoglou ( GR) 2007 2011 WG C2.14 Requirement on design and implementation of Restoration Tools and Procedures TBD Proposed TBD WG C2.15 Common Information Model and its prospective use in power system operations TBD Proposed TBD WG C2.16 Challenges in the control centre (EMS) due to distributed Generation and
Renewables M. Power (EI) 2011 2013
WG C2.21 Lessons learnt from recent Emergencies and Blackout Incidents Ben Li June 2010 2012 WG C2.22 Application of resilience engineering to safety management principles in Control
Centers, ensuring and enhancing power system reliability T. Carolin (ZA) 2009 2011
WG C2.31 Joint and coordinated development of operators in control center from different companies and nationalities
Udo Spanel (DE) 2007 20087
WG C2.32 Emergency organisation in control centres crisis management in system operation Ch. Fontaine (BE) 2007 2008 WG C2.33 Control Centre Operator Requirements, Selection, Training and Certification N. Cukalevski (RS) 2009 2011 WG C2.34 Capabilities and requirements of a control centre in the 21st century - Functional and
Human resources view Udo Spanel (DE) 2009 2011
JWG C2/C5.05 Developments and changes in the Business of System Operators O. Gjerde (NO) 2000 2010
1 Type : Working Group (WG), Task Force (TF), Advisory Group (AG), Co-operation Group (CG), Joint Working Group (JWG), Joint Task Force (JTF), … 2 Number : identification number 3 Title : full title in English 4 Name : Initials NAME (2 letters for nationality) 5 Created : year of creation 6 Disbanded : scheduled year of disbanding 7 Disbanded in December 2008
Sub – Committees of C2

Study Committee C5 - Electricity Markets and Regulation
The Mission of Study Committee C5 is "to facilitate and promote the progress of engineering and the international exchange of information and knowledge in the field of electricity markets and regulations. To add value to this information and knowledge by means of synthesizing state-of-the-art practices and by developing recommendations."
SC C5 Strategic Goals Development and changes in the Business of System
Operations Market Entities Market Activities and Market Design Market Regulations

Working Groups of C5 Committee
The six Working Groups and one Joint Working Group approved by Technical Committee are:
WG C5-3 Investments & Financing of new Transmission and Generation Assets in a Deregulated Environment
WG C5-7 Market Design – Structure and Development of Electricity Markets
WG C5-8 Renewables and energy efficiency in a deregulated market
WG C5-9 Retail Market Competition – Customer Switching, Metering and Load profiles
WG C5-10 Establishment of Effective and Sustainable Regulatory Incentives
for Capital Investments in Electricity Networks and Generation
WG C5-11 Market design for large scale integration of renewable energy sources and demand side management
JWG C2/C5–5 Development and Changes in the Business of System Operators
NLDC 63
Month n Year1989
Working group 39.05 of Study Working group 04 of Study Committee
Working group 03(Operational WG / Task Force / Study Committee
Methodologies in Power Topic
July-89November-91
Working group 14.11Working group 34.08
Joint Working group 39/11Working group 34.01Task Force 38.01.08
1993November-93
October-97October-97
Task Force No. 4 of Working group Working group 34.06
Task Force 38.04.02Guide for Upgrading Protection Against Methods and Techniques
August-98August-98August-98
Bulk Electricity System Application Guide on Analysis and Optimization Maintenance and Methods and Tools For Application of
Exchange of Services Reliable Fault Clearance Modeling of Power
Task Force 35.13.02 Knowledge based
April-99April-99
Working group 14.29Task Force 38.02.17Task Force 16 of Advisory group of 02 Task Force 35.13.03Task Force 38.04.04Task Force 38.05.09Joint Working group 14/37/38/39.24Working group 14.20Task Force 38.02.19
Analysis and Modelling Coordination of Controls Advanced Angle Stability
System Protection
Impact Of Interactions Communication Concepts Long Term Operation Methods and Tools for
Working group 34.08Joint Working group 23/39.14
Facts Technology for Economic Assesment of
Maintenance Outsourcing
Methods and Tools for
August-00October-00
February-01
Alarm Handling Portfolio and Risk Cigre Glossary of terms Isolation and Restoration
August-99August-99
December-97December-99
April-00May-00
August-01December-01
February-02April-02
April-01June-01June-01June-01
April-02
Task Force 38.05.12Study Committees 37,38 and 39
Task Force 38.04.03
Task Force 38.02.14
Task Force 38.05.07Working group 35.13
CIGRE WG/Task Force/Study Committees

Working group C4.601Working group C1.6
Working group 34.09Task Force 35.07Working group 37.30
Electric Power Systems
Custom Power State Of Thermal Behaviour of The Needs and Report on Survey to The benefit of Mobile Data. Network Planning in a
June-01December-02
February-03April-03
August-02August-02August-02
Task Force C2.10Working group C4.601Working group C1.6
Definition and
Working group C1.04Task Force C6.04.01Task Force C2.02.24Joint Working group D2/B3/C2.01
IEEE/CIGRE Joint Task Force
February-07
October-04April-05
October-05April-06
June-03
April-06
August-03August-03
December-03April-04
August-06February-07Working group C4.602
Working group C6.03
Power Quality Indices and Connection of Generators HVDC and Facts for Data Minning Techniques Electric Power System Congestion Management Coordinated Voltage Operating Dispersed
Working group C4.07Working group C6.02Working group B3.33Working group D1.11 / Task Force Working group C1.3Working group C5.04
Optimisation of Protection Management of
Working group A3.10(High Voltage Working group C2.01
Fault current Limiters in Improving Resilience in
Joint Advisory group SC15/D1-JAG 02
Working group 39.01
Study Committees C1_109Study Committees C1_201
Working group B5.09Working group C1.31
Working group 14.31Working group 22.12
Applications and Required Connection Criteria at the Defense Plan Against Security for Information Operational Services Review of Online dynamic
August-07
Modeling and Dynamic Wide Area Monitoring and Wide Area Monitoring and Separation Of Operation
Study Committees C1_105
Impact of regulatory Impact of regulatory
Working group C4.601Working group C4.601
February-07February-07
April-07April-07June-07June-07
August-07August-07August-07August-07
Assesment of System Market design for a high
Study Committees C1_10739.01
Working group C2.01Working group C1.19
2004200420042004Implementation Aspects of Study Committees C1_106
Review of Online dynamic Systems with Multiple DC
Working group C5.04Working group C2.02.24Working group C4.601Working group B4.41
June-07August-07
Study Committees C5
Imbalance Settlement and ElectraImproving Resilience in Generation Reserve and Congestion Management Defense Plan Against
October-07Electricity Market and
2004January-07January-07
February-07August-06
April-07
CIGRE WG/Task Force/Study Committees

System Operation Models

ISO: Independent System OperatorAO: Asset Owner
Possible Models for Regulatory & Commercial Relationships

Scope of System Operation Activities

EUROPEAN & SOUTH AFRICAN EUROPEAN & SOUTH AFRICAN MODELMODEL
G GG
D DD
T + SO
G
D
G
D
This model is followed in UK by NGC, in Norway by Statenett, in Sweden by Svenska Kraftnet, in Finland by Fingrid, in Netherland by Tennet, in Denmark by Eltral/Elkrafts and in South Africa by Eskom.

FRENCH MODELFRENCH MODEL
T + SOG
DEdF
RTE
This model is followed in France, wherein Transmission and System Operation functions have been delegated to RTE. EdF is responsible for the Generation and the Distribution.

MALAYSIAN AND KOREAN MALAYSIAN AND KOREAN MODELSMODELS
G GG
This model is followed in Korea by KEPCO and in Malaysia by TNB. These entities are now in the process of separating the distribution function from Transmission & SO functions.
T + SO
D +
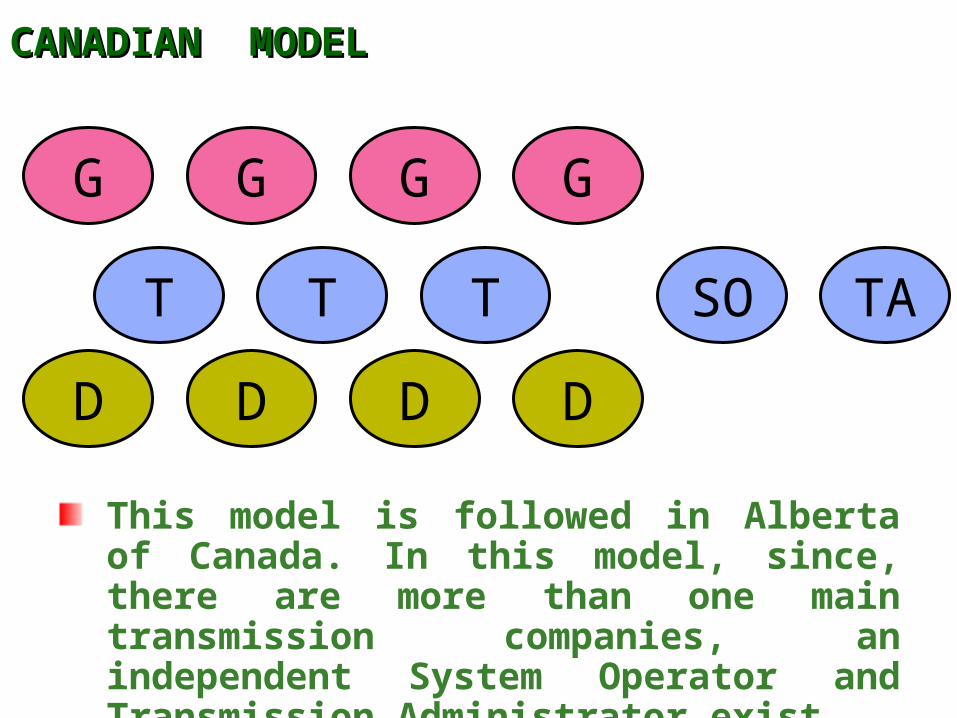
CANADIAN MODELCANADIAN MODEL
G GG
D DD
G
D
T TT TASO
This model is followed in Alberta of Canada. In this model, since, there are more than one main transmission companies, an independent System Operator and Transmission Administrator exist.

AMERICAN MODELAMERICAN MODEL
G G G
D D D
T T
G
D
G
D
G
D
TSO SORTO
This model is followed in USA. Based on their California experience, USA is now moving towards TSO model through RTO.

ORGANISATIONAL SET-UP OF POWERGRIDORGANISATIONAL SET-UP OF POWERGRID
Ring FencedSystem Operation
ThroughNLDC / RLDCs
CTU FUNCTIONS
Inter-stateTransmission
Services
P O W E R G R I D
LICENSEES
NON-CTU FUNCTIONS
Telecom,Consultancy,Distribution

ISO Models:Balancing, Operational & Deep ISOs

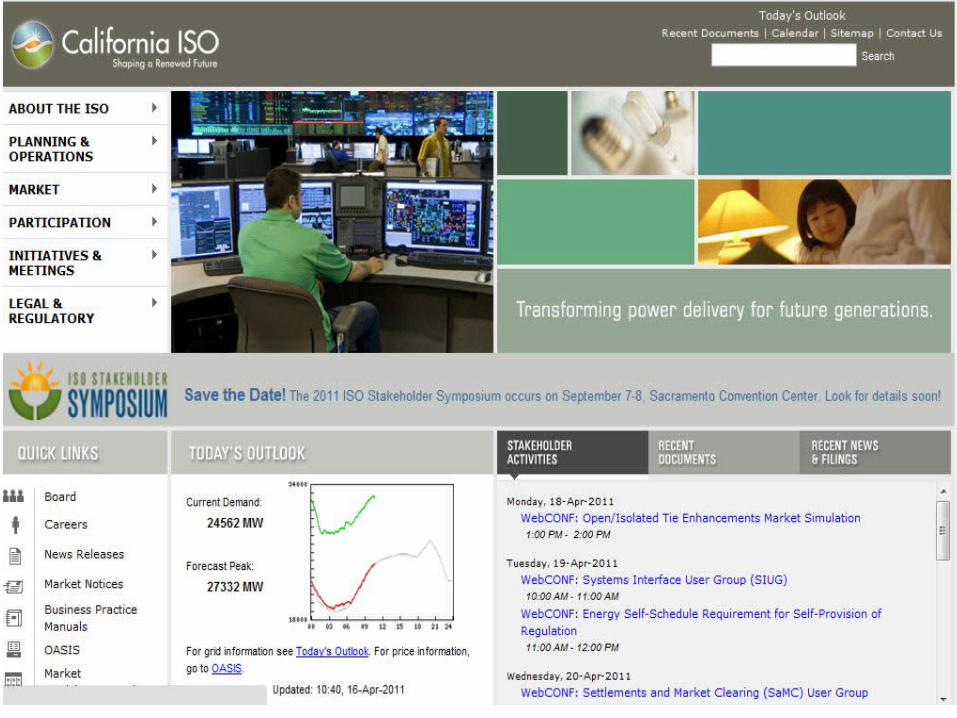
Website of System Operators Worldwide
75
S.No. Name of the TSO Country Web Presence1 ESKOM South Africa www.eskom.co.za
2 Red Eléctrica de España* Spain www.ree.es
3 Landsnet Iceland www.landsnet.is
4 Fingrid* Finland www.fingrid.com
5 Amprion* Germany www.amprion.net
6 Transpower NZ Newzealand www.transpower.co.nz
7 Saudi Electricity Company Saudi Arabia www.se.com.sa
8 TenneT Netherlands www.tennet.org
9 Statnett SF Norway www.statnett.no
10 PJM Interconnection** PA,USA www.pjm.com
11 National Grid Electricity Transmission* UK www.nationalgrid.com
12 CLP Power Hong Kong www.clpgroup.com.hk
13 ESB NG Ireland www.eirgrid.com
14 Transpower Germany www.transpower.de
15 Swisssgrid Switzerland www.swissgrid.ch
16 Rede Eléctrica Nacional Portugal www.ren.pt
17 Hydro Québec Canada www.hydroquebec.com
18 Svenska Kraftnät Sweden www.svk.se
19 PSE Poland www.pse-operator.pl
20 EWA Bahrain www.mew.gov.bh
21 China Southern Power Grid China www.eng.csg.cn
22 Power Grid Corporation of India Ltd. India www.powergridindia.com / www.nldc.in
76
77

78

79

Thank You !!
80