Verve Energy Annual Report 2006 Table of contentsfile/verve+ar+2005-06.pdf · 2 Chairman’s Report...
55
1 Verve Energy Annual Report 2006 Table of contents Operations Review Chairman’s Report .....................................................................................................2 Chief Executive’s Report ...........................................................................................3 Our company ..............................................................................................................4 Our achievements ......................................................................................................4 Our business ..............................................................................................................5 Review of financial performance ..............................................................................6 Production ..................................................................................................................6 Generation facts and figures ....................................................................................7 Electricity reform and trading ...................................................................................7 Safety and health .......................................................................................................7 Sustainable energy ....................................................................................................8 The environment ........................................................................................................8 Facts and figures .....................................................................................................10 Glossary....................................................................................................................10 Financial Review Appendix A Directors’ report (including corporate governance statement)………………..4-12 Income statement ………………………………………………………………………..13 Statement of changes in equity………………………………………………………..14 Balance sheet …………………………………………………………………………….15 Statement of cash flow…………………………………………………………………..16 Notes to the financial statement…………………………………………….……. 17-43 Directors’ declaration…………………………………………………………………....44 Independent audit report………………………………………………………………..45
Transcript of Verve Energy Annual Report 2006 Table of contentsfile/verve+ar+2005-06.pdf · 2 Chairman’s Report...

1
Verve Energy Annual Report 2006 Table of contents Operations Review Chairman’s Report.....................................................................................................2 Chief Executive’s Report...........................................................................................3 Our company..............................................................................................................4 Our achievements......................................................................................................4 Our business ..............................................................................................................5 Review of financial performance..............................................................................6 Production ..................................................................................................................6 Generation facts and figures ....................................................................................7 Electricity reform and trading...................................................................................7 Safety and health .......................................................................................................7 Sustainable energy ....................................................................................................8 The environment ........................................................................................................8 Facts and figures .....................................................................................................10 Glossary....................................................................................................................10 Financial Review Appendix A Directors’ report (including corporate governance statement)………………..4-12 Income statement ………………………………………………………………………..13 Statement of changes in equity………………………………………………………..14 Balance sheet …………………………………………………………………………….15 Statement of cash flow…………………………………………………………………..16 Notes to the financial statement…………………………………………….……. 17-43 Directors’ declaration…………………………………………………………………....44 Independent audit report………………………………………………………………..45

2
Chairman’s Report
On behalf of the Board of Directors, I am pleased to present the first Verve Energy Annual Report. As Verve Energy was created on 1 April 2006, when Western Power separated into four businesses, this report will cover the period from 1 April until 30 June. These first three months of operation have provided a mixed output:
• A poor financial performance with an operating loss and a debt to equity ratio of 120%; • Plant availability of 79.5% that was typical of the past few years but below longer term average and
industry peer group; • Safety performance at 3.6 LTIFR was reasonable and in the top half of peer group; • No interruption of power supply due to generation, with some commendable efforts at power stations
to maintain supply. The short-term financial outlook is not a lot better, with high oil prices and limited gas availability continuing. On the positive side:
• The distractions of operational and strategic thinking due to physical and organisational change in transition to the new entity are largely complete;
• There is a manifest willingness to confront the challenges and to create a successful, open, vibrant and integrated business;
• Initiatives to re-invest resources to the underlying causes of poor plant availability are being pursued enthusiastically;
• A new business model has been implemented and is being communicated within Verve Energy. This will better position the Corporation in the new energy market and enhance competitive focus;
• We are prepared for entry into the Wholesale Electricity Market (WEM) and we can make a meaningful contribution to the State while expanding a core business in energy trading.
Overall, Verve Energy is committed to the reform of the WA electricity industry and to work closely with Government regulatory agencies to achieve a smooth transition and an outcome that is in the best interest of the State. I congratulate members of the Verve Energy team for the way in which they have established the business and for the progress being made toward being a successful participant in the new electricity market. I thank my fellow Board members for their support and commitment and look forward to our continued growth.
PETER WEST CHAIRMAN

3
Chief Executive’s Report The first three months of Verve Energy’s operations have been challenging as we establish a new generating business. As a dedicated generation business with focus on wholesale supply, we are working towards “One Team” to achieve our Vision of becoming a leading business in the evolving Western Australian energy market. Our immediate objectives were to establish Verve Energy as a stand-alone business, including implementation of structure, governance, operational and support processes and the development of our corporate identity and purpose. We have built on our existing strengths and commenced development of new ones to meet the new challenges in a different environment with different rules. We have set performance targets and operational priorities to improve plant availability and reliability of electricity supply - an area that requires significant improvement. Our review of maintenance practices with the assistance of a leading international generator has provided a blueprint for changes in plant operation and maintenance. As a key participant in the development and establishment of the new electricity markets, Verve Energy is committed to electricity industry reform and to work closely with the Office of Energy, Independent Market Operator and the Economic Regulation Authority. We are setting up our marketing and trading capabilities. As a participant in the Wholesale Electricity Market, our challenge is to become a competitive generator of electricity so that we can win business in the new market. We are implementing culture change within the Corporation to develop a performance-driven commercially-oriented workforce. We are committed to building the Corporation’s environmental credentials and renewable energy portfolio. A review of business processes to deliver efficient and cost savings in our operations has commenced. Verve Energy’s financial performance was disappointing. The net loss after tax for the three months from 1 April to 30 June 2006 was $11.9 million. This result was due to the high consumption of liquid fuels largely because of a combination of insufficient gas transportation capacity in the Dampier-Bunbury Natural Gas Pipeline and the unavailability of coal-burning plant during maintenance outages. The transportation issue is being addressed by the pipeline owners constructing new pipeline capacity, which will significantly reduce our liquids burn. A capital works program budget of $101.2 million for 2006/07 focused mainly on improving the condition of our existing plant and investing in renewable energy development. I would like to acknowledge the contribution made by the Verve Energy team during our first three months of business. There still is much to be done and I look forward to increasing our rate of progress to becoming a successful player in the new electricity market.
JOHN E LILLYWHITE CHIEF EXECUTIVE

4
Operations Review Our company Verve Energy was created on April 2006 when Western Power separated into four businesses. The separation was part of the State Government’s reform of the electricity industry aimed at delivering lower long-term electricity prices to customers through the introduction of competition. Owned by the State Government, Verve Energy has its own Board which reports to the Minister for Energy while the Chief Executive is responsible for the Corporation’s day-to-day operations. Verve Energy is a State asset with an equity level of $615 million and annual forecast revenue of approximately $1 billion. As part of moves to deregulate the power industry, the Government imposed a ceiling on Verve Energy’s capacity to encourage others to build generating plants. Verve Energy’s installed generating capacity has been capped at 3000MW. By retiring old plant over the next three years, we will achieve that limit. Our achievements
• Increased generating capacity of Collie Power Station • Kemerton Power Station began operating on gas • Agreement reached with NW Shelf Gas for additional gas supply for Worsley cogeneration unit • Operational success of the Integrated Wood Processing pilot plant (IWP) • Development of biomass co-firing at Muja Power Station • Development of Coral Bay wind-diesel system • Further work on the projects to install two wind turbines at Kalbarri and additional wind turbines at
Hopetoun and Denham • Rottnest Island wind-diesel power system completed
Corporate results Performance indicators 1 April –30 June Revenue ($) 258.1 EBIT ($) 3.2 Supply of electricity (GWh) 3070.1 Electricity generation sent out (GWh) 2902.6 Renewable energy generation 17.2 Corporate reputation index 3.7 Thermal efficiency (%) 31.5 Plant availability (%) 79.5 Forced outage factor 5.3 Lost Time Injury Frequency Rate 3.6 Medical Time Injury Frequency Rate 25.7 Our values, vision and mission Safety is our overarching value and a priority in all aspects of our business. It concerns our employees, our contractors and the public. Our other core business values are integrity, leadership, achievement, quality relationships and commitment. Verve Energy’s vision is to create a leading business in the evolving Western Australian energy market. Our mission is to achieve our vision by embracing our new environment, maximising our value by matching our generating portfolio to market opportunities, and driving improvements in service and cost through opportunities to renew and innovate while providing a safe and rewarding workplace.

5
Organisational structure John Lillywhite - Chief Executive Karl Matacz - Chief Financial Officer Mark Hands - General Counsel Greg Denton - General Manager Trading & Sustainable Energy Barrie Brandt - General Manager Fuel Ken Bowron - General Manager Assets Fred Sibenaler - General Manager Production Derek Noakes - General Manager Human Resources Peter Winner – Manager Corporate Relations Our business Verve Energy competes with privately owned energy companies to provide electricity supply to WA’s business and residential customers. Verve Energy owns and operates power stations in the South West Interconnected System (SWIS), which extends from Kalbarri in the north, east to Kalgoorlie, and south to Albany. Our power stations in the SWIS have an installed generating capacity of 3480MW of electricity. We own and operate four major power stations – Kwinana, Cockburn, Pinjar and Muja, while a fifth at Collie is owned by us, and operated and maintained by Transfield BRW Services (TBRW). Verve Energy’s smaller power stations are situated at Mungarra, West Kalgoorlie, Tiwest Kwinana and Geraldton, and our joint venture power station is at Worsley near Collie. The privately owned and operated Kemerton Peaking Power Station has been available to Verve Energy since November 2005. Our portfolio includes wind farms at Albany and Esperance; wind-diesel plants in the isolated towns of Bremer Bay, Hopetoun, Denham and Exmouth; biomass plants at Narrogin and near Collie; and solar facilities at Kalbarri and Rockingham. What makes Verve Energy distinct from our competitors is the variety of fuels - coal, gas and liquids (oil or distillate) - used in our power stations and our diverse portfolio of sustainable energy sources. Verve Energy has about 56 per cent of electricity generation capacity in Western Australia with the remaining 44 per cent owned by private industry. Payments by Verve Energy to the State Government are equivalent to dividends, local government rates and charges and Commonwealth income tax. Fuel accounts for around 50% of the cost of generating electricity for Verve Energy. Verve Energy has a long term coal supply contract with Wesfarmers Premier Coal and a contract with Griffin Coal expiring in 2010. Most of Verve Energy’s gas requirements are met from the North West Shelf under a long-term arrangement with the North West Shelf Joint Venture.
Verve Energy has a 15-year gas transportation agreement with the owners of the Dampier-Bunbury Natural Gas Pipeline (DBNGP) for our gas-fired power stations. Our people We have 570 staff at five sites. We recognise the importance of developing our workforce for the successful operation of our power stations and therefore offer apprenticeships, traineeships and a graduate development program. We currently have 27 apprentices, eight trainees and eight graduates working with us. The community Verve Energy is committed to building strong relationships with the communities in which we operate. In June, we conducted our first corporate reputation survey, after just three months of operation as Verve Energy. Our corporate reputation index score for 2006 was 43%.
6
Review of financial performance As Verve Energy was established under the Electricity Corporations Act 2005 as a body corporate and commenced operation from 1 April 2006 no comparative financial performance is provided. The company’s opening balance sheet was established by way of a Transfer Order made by the Minister for Energy and published in the Government Gazette on 31 March 2006. It is the basis by which Western Power Corporation’s assets, rights and liabilities were allocated to the company. Verve Energy recorded an operating loss of $16 million for the three months ended 30 June 2006. Our results at a glance: Revenue: $258 million EBITDA: $34 million EBITDA Margin: 13% EBIT: $3 million Operating Cash Flow: ($26 million) Sales to Synergy contributed about 83% of total sales and are priced on the Vesting Contract agreement established as part of the disaggregation process. Demand for energy over the period met expectation, however the EBITDA margin for the period was substantially affected by plant availability and gas curtailments leading to higher than expected liquid fuel and electricity purchases. Total expenditure excluding interest and income tax was $254.9 million. Net operating cash flow outflow for the period of $26 million is due to the timing of payments from Synergy. In the first three months of operation only two monthly sales payments were due and payable. Net cash used in investing activities of $36 million was primarily to fund the Muja Power Station uprate and replacement of control and instrumentation systems. As a result, total debt has increased by $66.6 million from the opening position on 1 April, 2006. Production In preparation for the new competitive WA electricity market, Verve Energy is optimising fuel arrangements; increasing plant efficiency; and reviewing its maintenance strategy. Benefits of new fuel arrangements We have negotiated new, long term arrangements for our major fuel inputs of gas and coal. The new arrangements are more suited to the emerging competitive electricity market. In developments related to gas, Verve Energy has executed arrangements with:
• The North West Shelf Gas Sellers and Origin Energy for deliveries of gas to the Verve Energy and Origin Energy owned gas-fired cogeneration plant at the Worsley Alumina Refinery near Collie; and
• Australian Pipeline Trust (APT) for the storage of gas at APT’s Mondarra underground gas storage facility and for transportation of gas in APT’s Parmelia gas pipeline.
During the quarter, Verve Energy's consumption of liquid fuels was high, largely as a result of a combination of inadequate gas transportation capacity in the Dampier to Bunbury Natural Gas Pipeline and coal-burning plant unavailability. The capacity of the pipeline is currently being expanded as a result of long term transportation agreements entered into in 2004. Some additional firm transportation capacity has been available since early in 2006, with a further capacity increment due later in 2006 following completion of the current expansion program. Power station upgrades Collie Power Station We spent $6.75 million to increase Collie Power Station’s generating capacity by 10MW to 340MW. Muja Power Station Planning is progressing on a two-stage upgrade program at Muja Power Station scheduled for 2007 and 2008. This upgrade will secure the future of Muja as the number one coal-fired power station in WA.

7
Maintenance review A review of the maintenance practices on Verve Energy’s major generating units is underway. The review by RWE npower, a major player in the UK power generation industry, is considering whether the current maintenance regime will deliver a portfolio of generating plant suitable for the evolving market. Generation facts and figures
Generating plant Fuel Capacity (kW)
Acquired/ commissioned
Energy generated (GWh) 1 April – 30 June, 2006
Collie Coal 330,000 1999 1946.2 Cockburn Gas 240,000 2003 1199.8 Muja A&B Coal/heavy
fuel oil 240,000 1965 1227.8
Muja C Coal/heavy fuel oil
400,000 1987 1879.0
Muja D Coal/heavy fuel oil
400,000 1985-86 2673.0
Kwinana A & C Coal/gas/fuel oil
640,000 1970-78 1759.5
Kwinana B Gas/fuel oil 240,000 1970-73 349.1 Kwinana gas turbine Gas/distillate 21,000 1972 0 Mungarra gas turbines Gas 112,000 1990-91 260.0 Pinjar gas turbines Gas/distillate 586,000 1990-96 571.7 Worsley Gas 60,000 2000 432.1 Tiwest gas turbine Gas 36,000 1999 135.5 Regional gas turbines Gas/distillate 83,000 1973/1984 5.3 Albany wind farm Wind 22,000 2002 58.9 Esperance Wind 5625 1993 & 2002 16.4 Hopetoun (wind only) Wind 600 2004 0.8 Bremer Bay Wind 600 2004 2.8 Electricity generation Generated - GWh 3095.6 Sent out - GWh 2902.6 Used in works - GWh 193.0 Purchased - GWh 167.5 Portfolio thermal efficiency sent out - %
31.5
Fuel consumption for generation - TJ
33,142
Electricity reform and trading Verve Energy is working closely with the Independent Market Operator and other Market Participants in the development of market systems and market trials for the Wholesale Electricity Market.
Verve Energy welcomes the opportunity to trade electricity with energy retailers and large customers. Safety and health Safety is Verve Energy’s first and most important value. In everything we do, we first consider the safety of our people, contractors and the public. With 570 people working for us in power stations in country towns and in offices in the city, we continually strive to improve the quality of working life and business performance, reduce the risks of illness and injury and boost the wellbeing of our people. Our Safety and Health Policy sets out how everyone working for Verve Energy accepts a personal responsibility to provide a safe and healthy workplace for themselves and their fellow employees. Our Fit for Work policy, through a focus on physical mental and emotional health, reflects the corporation’s commitment to the health and safety of our people.

8
Safety performance Our safety performance is reflected in our Lost Time Injuries Frequency Rate (LTIFR) and Medical Treatment Injury Frequency Rate (MTIFR). Our LTIFR for 1 April-30 June was 3.6 and our MTIFR was 25.7. Sustainable energy Verve Energy is a leader in the development of renewable energy generation using wind and bio-energy technologies. Integrated Wood Processing Plant (IWP) Excellent results were achieved during the operation of the Narrogin Integrated Wood Processing (IWP) pilot plant. Activated carbon was produced for the first time in May, the last of the four processes to be successfully carried out at the plant. The other products, produced at the plant from mallee trees, are renewable electricity, eucalyptus oil and charcoal. With this phase of demonstration now completed, the Narrogin IWP plant is in ‘care and maintenance’ mode while we analyse results. Biomass co-firing at Muja Power Station We are developing a biomass co-firing operation at Muja Power Station, near Collie, in partnership with WA pallet maker Pinetec Ltd. In the two-way operation, Pinetec is buying 2.5MW of electricity, for its sawmill and pallet making facility and steam for kiln drying, from Verve Energy. Verve Energy will buy 78,000 tonnes of sawmill residue - sawdust, bark and chips - a year to mix with coal to fire the power station. Development of new wind-diesel systems Through our business brand Diesel and Wind Systems (D&WS), we continue to operate existing wind-diesel systems and are developing a number of new projects in regional WA. Design work continued for a new wind-diesel power system, for Horizon Power, at Coral Bay; two wind turbines and a specially developed control system at Kalbarri; and an additional wind turbine in each of the towns of Hopetoun and Denham. Another research project is looking at ways in which the wind-diesel system at Bremer Bay could be reconnected to the main grid to provide residents with improved reliability. D&WS’s expertise was utilised to upgrade the Rottnest Island power station to allow significantly more wind energy to be used and for excess wind to provide power to the water desalination plant. The environment Verve Energy takes its environmental responsibilities seriously. We recognise the value of the environment to the community and future generations and we work towards sustainable development by the responsible production of electricity. Our Environmental Policy can be found on our website. Our environmental performance is tracked annually utilising a number of performance indicators. Our main environmental performance indicators are our greenhouse response and renewable energy use. Measuring performance against targets is an integral element of Verve Energy’s continuous improvement process. Reducing the Greenhouse Effect Verve Energy is committed to reducing the impact of atmospheric emissions on the environment by the responsible use of resources. And we are committed to continuing our development of renewable energy generation. In the period from 1 April to 30 June, Verve Energy generated enough renewable energy from our renewable energy generators including Albany, Denham, Esperance, Hopetoun and Exmouth wind farms to create over 16,000 Renewable Energy Certificates (RECs). We also created over 5000 RECS from Muja Power Station using waste wood products from the nearby Pinetec pallet making facility.

9
Atmospheric emissions Verve Energy’s emission details are provided annually to the National Pollutant Inventory (NPI). This information can be accessed via http://www.npi.gov.au. The following tables provide information on the main atmospheric emissions from our major power stations. SULFUR DIOXIDE EMISSIONS (Kgs emitted per MWh of electricity sent out) 1/4/06 to
30/6/06
Collie 5.7 Muja 6.3 Kwinana 2.9 Pinjar Gas Turbine 0.0 Mungarra Gas Turbine 0.0 Cockburn 0.0 NITROGEN OXIDES EMISSIONS (Kgs emitted per MWh of electricity sent out)
1/4/06 to 30/6/06
Collie 3.5 Muja 4.3 Kwinana 3.2 Pinjar Gas Turbine 2.0 Mungarra Gas Turbine 1.9 Cockburn 0.3
PARTICULATE (COAL ONLY) EMISSIONS (Kgs emitted per MWh of electricity sent out)
1/4/06 to 30/6/06
Collie 0.15 Muja 9.2 Kwinana 0.1
Greenhouse Response Verve Energy’s sent out a total of 2,902.6 GWh of electricity in the period April to June 2006. Direct greenhouse gas emissions associated with the electricity generated by Verve Energy amounted to 2.72 million tonnes of carbon dioxide equivalent (CO2e). Renewable energy generation has led to the offset of an estimated 0.016 million tonnes of CO2e in the period April to June 2006. A further emissions offset of 2,800 tonnes of CO2e is estimated to have been absorbed by Verve Energy’s tree plantation activities in the period April to June 2006. Performance Indicator 1/4/06-30/6/06 Carbon Intensity (kgCO2e/kWh electricity sent out)
0.93
Environmental due diligence Verve Energy is bound to, and complies with, the stringent state and federal environmental regulation and licensing requirements of our operational sites. Environmental due diligence in Verve Energy is provided by a corporate Environmental Management System (EMS) which built on the principles of ISO 14001, the international EMS standard. EMS is driven by an intranet-based documentation and management tool (EMISWeb) to facilitate the process of environmental governance and management in the corporation. Environmental incidents Three significant incidents were recorded on Verve Energy’s environmental management data system EMISWeb from 1 April to 30 June, none of which caused serious environmental impact.

10
Facts and figures State Records Act 2000 Verve Energy maintains and supports quality recordkeeping practices in its day-to-day business activities. All records are managed according to the requirements of the State Records Act 2000 and Verve Energy’s approved Recordkeeping Plan. Regular reviews are conducted of the corporate recordkeeping systems and practices to ensure their efficiency and effectiveness. New employees and contractors are provided with information on the recordkeeping systems both at induction and at compulsory training in the use of the system. The training programs are reviewed on an ongoing basis to ensure they reflect any new business requirements. Western Australian Electoral Act In accordance with the requirements of Section 175ZE of the Western Australian Electoral Act 1907, the following information in respect to expenditures (excluding GST) incurred by, or on behalf of Verve Energy during from 1 April to 30 June 2006 is disclosed as follows: Market research organisations: $9462 - Synovate. Media advertising agencies: $42,121 - TMP Worldwide. Total expenditure: $51,583 Glossary CO2 Carbon Dioxide. CO2e Carbon Dioxide equivalent: the amount of carbon dioxide that has the same global warming effect as a
mixture of greenhouse gases. DBNGP Dampier-Bunbury Natural Gas Pipeline EMS Environmental Management System. EMISWeb Electronic environmental management information system. GW Gigawatt. A measure of electrical power. Equivalent to one million kilowatts. GWh Gigawatt-hour. One GWh = 1000 MWh or one million kilowatt-hours. ISO 14001 International Standards Organisation 14001. The international standard for environmental management
systems. kV Kilovolt. One kV = 1000 volts. A volt is the unit of potential of electric pressure. kW Kilowatt. One kW = 1000 watts. A watt is the rate at which electrical energy is produced or used. kWh Kilowatt-hour.The standard unit of energy, equivalent to the consumption rate of one kilowatt for one hour.
Commonly used as the ‘unit’ of electrical energy. MVA Megavolts-ampere. The product of the voltage rating (kV) and the current rating (kA).Used to represent the
rating of electrical equipment such as transformers. MW Megawatt. One MW = 1000 kW or one million watts. MWh Megawatt-hour. One MWh = 1000 kWh. NOX Nitrogen Oxides. A term used for a mixture of nitrogen oxides. SO2 Sulfur Dioxide SWIS South West Interconnected System TJ Terajoule. One TJ = one million, million joules, or 1012 joules. Used to indicate the energy content of gas.
Financial Review
30 June 2006

Electricity Generation Corporation (trading as Verve Energy)
Financial Review Contents
Page Directors’ report (including corporate governance statement) 4-12 Income statement 13 Statement of changes in equity 14 Balance sheet 15 Statement of cash flow 16 Notes to the financial statement 17-43 Directors’ declaration 44 Independent audit report 45
3
Directors’ report For the three months period ended 30 June 2006 The Directors present their report and the financial report of Verve Energy (‘the Corporation’) for the three months ended 30 June 2006 and the auditor’s report thereon. Contents of Directors’ report Page
Directors 4
Company secretary 4
Directors’ meetings 5
Corporate governance statement Board of Directors 5 Nomination of a director 6 Remuneration and Development Committee 6 Remuneration report 7 Audit and Risk Management Committee 8 Risk management 9 Ethical standards 10 Communication with shareholders 11
Principal activities 11
Dividends 11
Events subsequent to reporting date 11
Likely developments 12
Indemnification and insurance of officers and auditors 12
Non-audit services 12
Lead auditors independence declaration 12
Rounding off 12
4
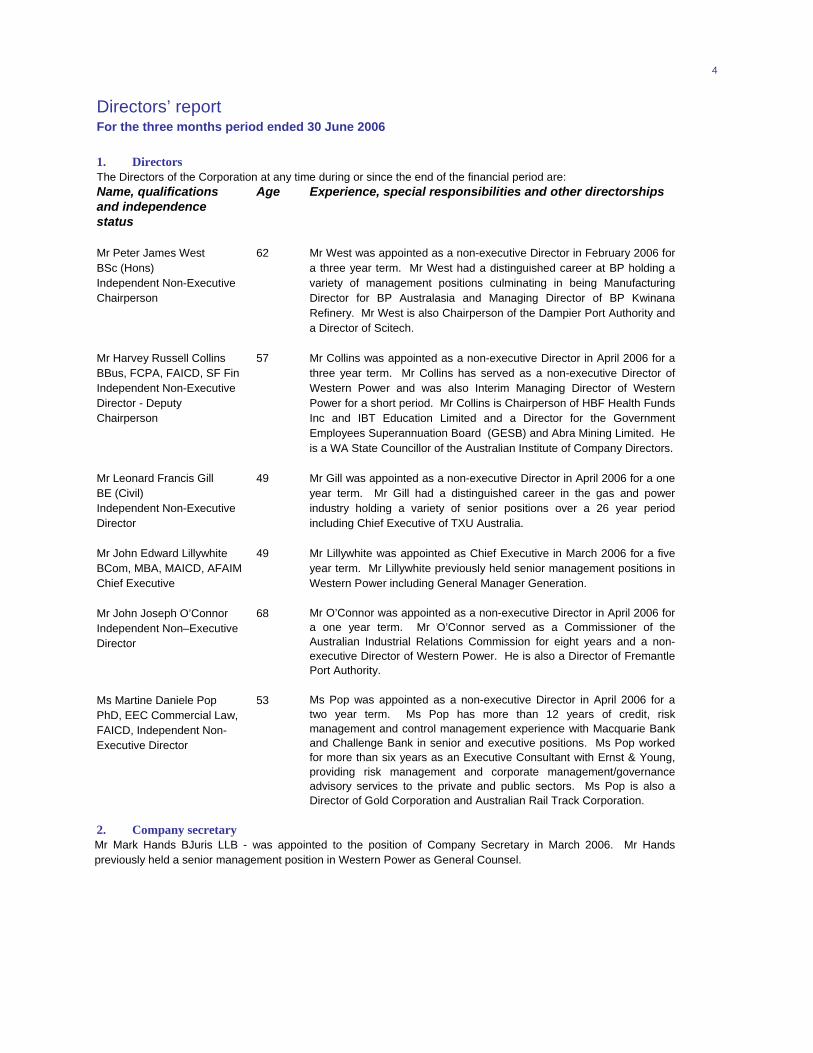
Directors’ report For the three months period ended 30 June 2006 1. Directors The Directors of the Corporation at any time during or since the end of the financial period are: Name, qualifications and independence status
Age Experience, special responsibilities and other directorships
Mr Peter James West BSc (Hons) Independent Non-Executive Chairperson
62 Mr West was appointed as a non-executive Director in February 2006 for a three year term. Mr West had a distinguished career at BP holding a variety of management positions culminating in being Manufacturing Director for BP Australasia and Managing Director of BP Kwinana Refinery. Mr West is also Chairperson of the Dampier Port Authority and a Director of Scitech.
Mr Harvey Russell Collins BBus, FCPA, FAICD, SF Fin Independent Non-Executive Director - Deputy Chairperson
57 Mr Collins was appointed as a non-executive Director in April 2006 for a three year term. Mr Collins has served as a non-executive Director of Western Power and was also Interim Managing Director of Western Power for a short period. Mr Collins is Chairperson of HBF Health Funds Inc and IBT Education Limited and a Director for the Government Employees Superannuation Board (GESB) and Abra Mining Limited. He is a WA State Councillor of the Australian Institute of Company Directors.
Mr Leonard Francis Gill BE (Civil) Independent Non-Executive Director
49 Mr Gill was appointed as a non-executive Director in April 2006 for a one year term. Mr Gill had a distinguished career in the gas and power industry holding a variety of senior positions over a 26 year period including Chief Executive of TXU Australia.
Mr John Edward Lillywhite BCom, MBA, MAICD, AFAIM Chief Executive
49 Mr Lillywhite was appointed as Chief Executive in March 2006 for a five year term. Mr Lillywhite previously held senior management positions in Western Power including General Manager Generation.
Mr John Joseph O’Connor Independent Non–Executive Director
68 Mr O’Connor was appointed as a non-executive Director in April 2006 for a one year term. Mr O’Connor served as a Commissioner of the Australian Industrial Relations Commission for eight years and a non-executive Director of Western Power. He is also a Director of Fremantle Port Authority.
Ms Martine Daniele Pop PhD, EEC Commercial Law, FAICD, Independent Non-Executive Director
53 Ms Pop was appointed as a non-executive Director in April 2006 for a two year term. Ms Pop has more than 12 years of credit, risk management and control management experience with Macquarie Bank and Challenge Bank in senior and executive positions. Ms Pop worked for more than six years as an Executive Consultant with Ernst & Young, providing risk management and corporate management/governance advisory services to the private and public sectors. Ms Pop is also a Director of Gold Corporation and Australian Rail Track Corporation.
2. Company secretary Mr Mark Hands BJuris LLB - was appointed to the position of Company Secretary in March 2006. Mr Hands previously held a senior management position in Western Power as General Counsel.

5
Directors’ report For the three months period ended 30 June 2006 3. Directors’ meeting The number of Directors’ meetings (including meetings of committees of Directors) and number of meetings attended by each of the Directors of the Corporation during the financial period are:
Director Board Meetings Audit and Risk Management Committee
Meetings
Remuneration and Development Committee Meetings
A B A B A B Mr Peter James West (Chairperson) 7 7 0 0 1 1 Mr Harvey Russell Collins(Deputy Chairperson) 5 7 1 1 0 0 Mr Leonard Francis Gill 7 7 0 0 1 1 Mr John Edward Lillywhite 7 7 1 1 1 1 Mr John Joseph O’Connor 5 7 0 0 1 1 Ms Martine Daniele Pop 5 7 1 1 0 0 A – Number of meetings attended B – Number of meetings held during the time the Director held office during the period Four of the Board meetings were resolutions without a meeting (via circular resolution)
4. Corporate governance statement This statement outlines the main corporate governance practices in place throughout the financial period, which comply with the ASX Corporate Governance Council recommendations, unless otherwise stated. 4.1 Board of Directors Role of the Board The Board of Directors is the governing body of the Corporation and is responsible to the Minister for Energy (“the Minister”) for the performance of the Corporation. Subject to the Electricity Corporations Act 2005 (“the Act”), the Board has the authority to perform the functions, determine policies and control the affairs of the Corporation. To fulfil this role, the Board is responsible for the overall corporate governance of the Corporation including formulating its strategic direction, approving and monitoring capital expenditure, setting remuneration, appointing and removing the Chief Executive, creating succession policies for senior executives, establishing and monitoring the achievement of management’s goals and ensuring the integrity of internal control and management information systems. It is also responsible for approving and monitoring financial and other reporting. The Board has delegated responsibility for operation and administration of the Corporation to the Chief Executive and executive management. Responsibilities are delineated by formal authority delegations. Board processes To assist in the execution of its responsibilities, the Board has established a number of Board committees including the Remuneration and Development Committee, and an Audit and Risk Management Committee. These committees have written mandates and operating procedures. The Board is establishing a framework for the management of the Corporation including a system of internal control, a business risk management process and the establishment of appropriate policies. The full Board intends scheduling 10 meetings each year, plus strategy meetings and any extraordinary meetings at such other times as may be necessary to address any specific significant matters that may arise. The agenda for meetings is prepared in conjunction with the Chairperson, Chief Executive and Company Secretary. Standing items include the Chief Executive’s report (which includes a financial report), strategic matters, governance and compliance. Submissions are circulated in advance. Executives are regularly involved in Board discussions and Directors have other opportunities, including visits to business operations, for contact with a wider group of employees and key stakeholders.

6
Directors’ report For the three months period ended 30 June 2006
Director education The Corporation has developed an induction pack to educate new Directors about the nature of the business. Directors also have the opportunity to visit business operations and meet with management to gain a better understanding of the business. Independent professional advice and access to Corporation information Each Director has the right to access all relevant Corporation information and to the Corporation’s executives and, subject to prior consultation with the Chairperson, may seek independent professional advice from a suitably qualified adviser at the Corporation’s expense. The Director must consult with an advisor suitably qualified in the relevant field, and obtain the Chairperson’s approval of the fee payable for the advice before proceeding with the consultation. A copy of the advice received by the Director is made available to all other members of the Board. Composition of the Board The names of the Directors of the Corporation in office at the date of this report are set out in the Directors’ report on page 4 of this report. The composition of the Board is determined under the Act using the following principles: • No less than four and no more than six Directors appointed by the Governor of Western Australia (“the
Governor”) on the nomination of the Minister. • The Governor appoints the Chairperson and Deputy Chairperson. Appointments in each case are made on
the nomination of the Minister. • A member of staff of the Corporation is not to be a Director of the Corporation. • The Chief Executive may be a Director of the Corporation. 4.2 Nomination of a Director In making nominations for appointment to the Board of the Corporation, the Minister is to ensure that: • Each nomination is made only after consultation with the Board (except for initial members to the Board);
and • Where a vacancy occurs the Board may recommend a candidate to the Minister. 4.3 Remuneration and Development Committee The Remuneration and Development Committee is a committee of the Board established under Section 13 of the Act. The Remuneration and Development Committee reviews and makes recommendations to the Board on remuneration packages and policies applicable to staff of the Corporation. The members of the Remuneration and Development Committee during the year were: • Mr Peter James West – Independent Non-Executive Chairperson. • Mr John Joseph O’Connor – Independent Non-Executive Director. • Mr Leonard Francis Gill – Independent Non-Executive Director. The Board policy is that the Remuneration and Development Committee will comprise entirely of independent non-executive Directors. Any person may be invited to Remuneration and Development Committee meetings, but not necessarily for the full duration of meetings. A standing invitation is issued to the Chief Executive, General Manager Human Resources and the General Counsel. The Remuneration and Development Committee meets three times a year unless otherwise required. The committee met once during the period and committee members’ attendance record is disclosed in the table of Directors’ meetings on page 5 of this report.

7
Directors’ report For the three months period ended 30 June 2006 4.4 Remuneration report
4.4.1 Principles of compensation
The Minister determines the remuneration and allowances of a non-executive Director. In the case of the Chief Executive the Board fixes the remuneration with the concurrence of the Minister.
The Board on recommendation of the Chief Executive approves compensation levels for executives. Remuneration for key management personnel of the Corporation is competitively set to attract and retain appropriately qualified and experienced executives. The compensation structures explained below are designed to attract suitably qualified candidates, reward the achievement of strategic objectives, and achieve the broader outcome of creation of value for our shareholder. The compensation structures take into account: • The capability and experience of the key management personnel. • The key management personnel’s ability to control the relevant performance. • The Corporation’s performance including earnings and delivering constant returns on shareholder wealth. • The amount of incentives within each key management person's compensation. Compensation packages include a mix of fixed and performance-based incentives. Fixed compensation Fixed compensation consists of base compensation (which is calculated on a total cost basis and includes any fringe benefit taxation charges related to employee benefits), as well as employer contributions to superannuation funds. Performance-linked compensation Performance-linked compensation is designed to reward key management personnel for meeting or exceeding their financial and personal objectives. The incentive is an ‘at risk’ component provided in the form of cash. Each year the Remuneration and Development Committee sets the key performance indicators (KPIs) for the key management personnel. The KPIs generally include measures relating to the Corporation, and the individual, and include financial, people, customer, strategy and risk measures. The measures chosen directly align the individual’s reward to the KPIs of the Corporation and to its strategy and performance. Service contracts
It is the Corporation’s policy that contracts of employment for key managers excluding the Chief Executive, General Manager Production and the General Manager Trading and Sustainable Energy, are unlimited in term but capable of termination on four weeks notice and that the Corporation retains the right to terminate the contract immediately, by making payment equal to 52 weeks pay in lieu of notice. The key managers are also entitled to receive on termination of employment their statutory entitlements of accrued annual and long service leave, together with any superannuation benefits. The Chief Executive has a contract of employment that commenced on 1 April 2006 with the Corporation. The contract specifies the duties and obligations to be fulfilled by the Chief Executive and provides that the Board and Chief Executive will early in each financial year, consult and agree objectives for achievement during that year. The Chief Executive’s contract of employment terminates on 1 April 2011. At any time prior to this date the contract can be terminated either by the Corporation providing 12 months notice or the Chief Executive providing six months notice. The Chief Executive has no entitlement to termination payment in the event of termination for misconduct. The General Manager Trading and Sustainable Energy has a contract of employment that commenced on 31 January 2005 with Western Power Corporation that was subsequently assigned to the Corporation from 1 April 2006. This contract of employment terminates on 30 January 2007. At any time prior to this date either party can terminate the contract by providing six months notice. 4.4.1 Principles of compensation (continued)

8
Directors’ report For the three months period ended 30 June 2006 The General Manager Production has a contract of employment that commenced on 24 February 2006 with Western Power Corporation that was subsequently assigned to the Corporation from 1 April 2006. This contract of employment terminates on 24 February 2009. At any time prior to this date the General Manager providing 12 weeks notice, or the Corporation giving 12 months notice can terminate this contract. Non-Executive Directors The Minister determines total compensation for all non-executive Directors. Directors’ base fees are presently set at $50,000 per annum plus 9% superannuation.
The Chairperson receives $105,000 per annum plus 9% superannuation. The Deputy Chairperson receives $65,000 per annum plus 9% superannuation. Non-executive Directors do not receive performance related compensation. Directors’ fees cover all main Board activities and membership of committees. 4.4.2 Directors’ and Executive Officers’ remuneration – audited
Details of the nature and amount of each major element of remuneration of each director of the Corporation and each of the five named Corporation executives who receive the highest remuneration for the three months period ended 30 June 2006 are: Short Term Post employment Salary &
feesNon-monetary
benefits Sub - totalSuperannuation
benefits
Total $ $ $ $ $Non–executive Directors Mr Peter West (Chairperson) 43,474 140 43,614 3,925 47,539Mr Harvey Collins (Deputy Chairperson)
18,209 166 18,375 1,654 20,029
Mr Leonard Gill 12,500 - 12,500 1,125 13,625Mr John O’Connor 10,137 - 10,137 5,804 15,941Ms Martine Pop 12,260 - 12,260 846 13,106 Executive Director Mr John Lillywhite (Chief Executive) 63,979 7,928 71,907 12,140 84,047 Executives Mr Ken Bowron 45,736 5,107 50,843 9,454 60,297Mr Barrie Brandt 48,751 5,616 54,367 6,370 60,737 Mr Greg Denton 48,923 166 49,089 11,831 60,920Mr Mark Hands 46,836 166 47,002 13,709 60,711Mr Derek Noakes 53,713 1,604 55,317 4,979 60,296Total 404,518 20,893 425,411 71,837 497,248 4.5 Audit and Risk Management Committee The Audit and Risk Management Committee (“the ARMC”) is a committee of the Board established under Section 13 of the Act. The purpose of the ARMC is to assist the Board to fulfil its corporate governance and oversight responsibilities relating to the reporting of financial information, the internal control, compliance, risk management process and system and audit. The ARMC has a documented charter, approved by the Board. All members must be non-executive Directors with a majority being independent. The Chairperson may not be the Chairperson of the Board. The committee advises on the establishment and maintenance of a framework of internal control and appropriate ethical standards for the management of the Corporation. The members of the ARMC during the year were: • Mr Harvey Collins (Chairperson) – Independent Non-Executive Director • Ms Martine Pop – Independent Non-Executive Director
9
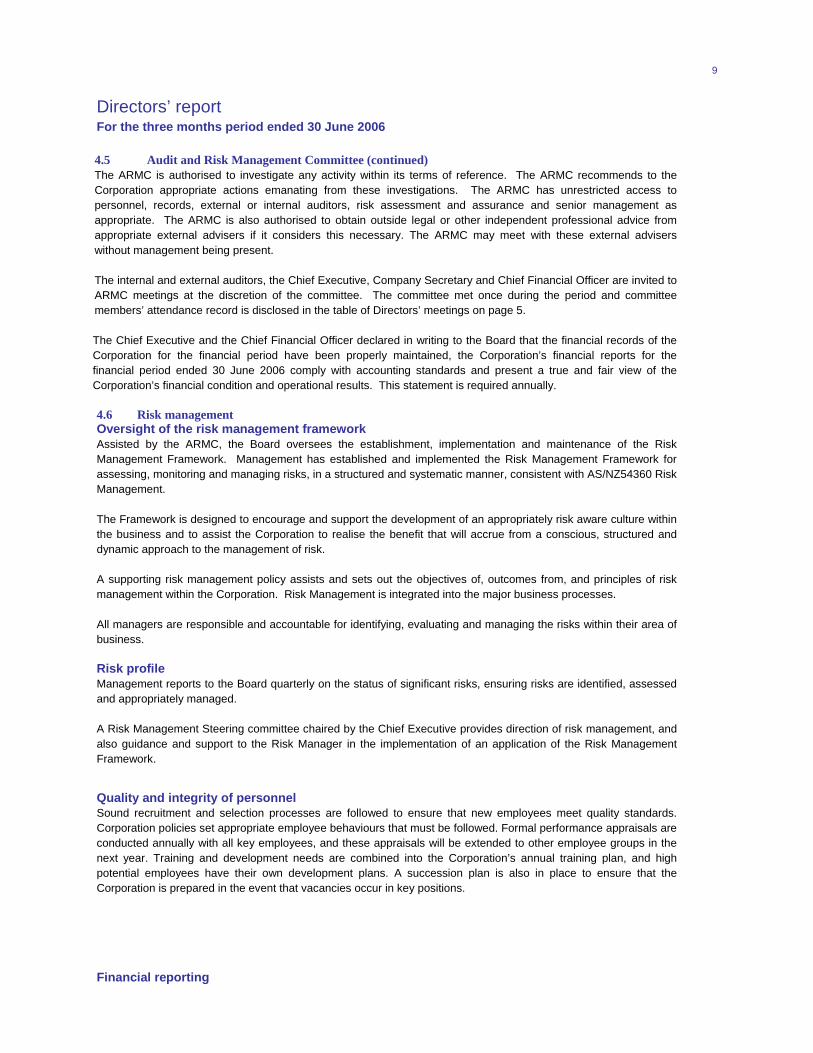
Directors’ report For the three months period ended 30 June 2006 4.5 Audit and Risk Management Committee (continued) The ARMC is authorised to investigate any activity within its terms of reference. The ARMC recommends to the Corporation appropriate actions emanating from these investigations. The ARMC has unrestricted access to personnel, records, external or internal auditors, risk assessment and assurance and senior management as appropriate. The ARMC is also authorised to obtain outside legal or other independent professional advice from appropriate external advisers if it considers this necessary. The ARMC may meet with these external advisers without management being present. The internal and external auditors, the Chief Executive, Company Secretary and Chief Financial Officer are invited to ARMC meetings at the discretion of the committee. The committee met once during the period and committee members’ attendance record is disclosed in the table of Directors’ meetings on page 5. The Chief Executive and the Chief Financial Officer declared in writing to the Board that the financial records of the Corporation for the financial period have been properly maintained, the Corporation’s financial reports for the financial period ended 30 June 2006 comply with accounting standards and present a true and fair view of the Corporation’s financial condition and operational results. This statement is required annually. 4.6 Risk management Oversight of the risk management framework Assisted by the ARMC, the Board oversees the establishment, implementation and maintenance of the Risk Management Framework. Management has established and implemented the Risk Management Framework for assessing, monitoring and managing risks, in a structured and systematic manner, consistent with AS/NZ54360 Risk Management. The Framework is designed to encourage and support the development of an appropriately risk aware culture within the business and to assist the Corporation to realise the benefit that will accrue from a conscious, structured and dynamic approach to the management of risk. A supporting risk management policy assists and sets out the objectives of, outcomes from, and principles of risk management within the Corporation. Risk Management is integrated into the major business processes. All managers are responsible and accountable for identifying, evaluating and managing the risks within their area of business. Risk profile Management reports to the Board quarterly on the status of significant risks, ensuring risks are identified, assessed and appropriately managed. A Risk Management Steering committee chaired by the Chief Executive provides direction of risk management, and also guidance and support to the Risk Manager in the implementation of an application of the Risk Management Framework.
Quality and integrity of personnel Sound recruitment and selection processes are followed to ensure that new employees meet quality standards. Corporation policies set appropriate employee behaviours that must be followed. Formal performance appraisals are conducted annually with all key employees, and these appraisals will be extended to other employee groups in the next year. Training and development needs are combined into the Corporation’s annual training plan, and high potential employees have their own development plans. A succession plan is also in place to ensure that the Corporation is prepared in the event that vacancies occur in key positions. Financial reporting

10
Directors’ report For the three months period ended 30 June 2006 The Chief Executive and the Chief Financial Officer have declared in writing to the Board that the Corporation’s financial reports are founded on a sound system of risk management and internal compliance and control which implements the policies adopted by the Board. Monthly actual results are reported against budgets approved by the Directors and revised forecasts for the year are prepared regularly. Environmental regulation The Corporation’s operations are subject to significant environment regulation under both Commonwealth and State legislation. The Corporation is committed to achieving a high standard of environmental performance. To this end it has established an Environmental Management System (EMS) built upon the principles of ISO 14001, the International EMS standard. The EMS provides a structured process to assess and manage environmental risks and is designed to continually improve environmental performance and fulfil the Corporation’s due diligence requirements. The Corporation’s Environmental Policy is the cornerstone of the EMS. To enable it to meet its responsibilities, the Corporation has established a regular internal reporting process as part of its EMS. On a quarterly basis the executive team and Board of Directors receive a report of environmental performance. Compliance with the requirements of environmental regulations and with specific requirements of site environmental licences was substantially achieved across all. No actions have been taken against the Corporation by any government agency for any breaches of environmental regulation, ministerial condition or licence conditions in the three months ended 30 June 2006. Internal audit The internal audit function also assists the Board to discharge its fiduciary and corporate governance responsibilities. It reports on functional matters directly to the Chairperson of the ARMC. With respect to risk management, it assists the organisation by identifying and evaluating significant exposure to risks and contributing to the improvement of risk management and control systems in its work. The ARMC is responsible for approving the annual internal audit program and reviewing the internal audit function. Conflict of interest Directors must keep the Corporation advised, on an ongoing basis, of any interest that could potentially conflict with the Corporation. The Board has developed procedures to assist Directors to disclose potential conflicts of interest. Where the Board believes that a significant conflict exists for a Director on a Board matter, the Director concerned does not receive the relevant Board papers and is not present at the meeting whilst the item is considered. 4.7 Ethical standards Code of Conduct and Integrity Pursuant to Section 31 of the Act the Corporation has prepared and issued a code of conduct setting out minimum standards of conduct and integrity that are to be observed by all employees. The code of conduct and integrity has been developed to ensure the Corporation manages its employees in a prudent and equitable manner. In summary the code requires that all Corporation personnel obey all applicable laws, regulations, rules and other instructions, uphold the Corporation values and follow all lawful directions. 4.8 Communication with shareholders The Corporation’s key stakeholder is the Corporation’s shareholder, the Minister, representing the Government of the day. A formal protocol has been developed to ensure the most comprehensive levels of governance apply to communications with the Minister and his Office. The protocol specifically reflects the particular relationship that exists between a corporatised Government Trading Enterprise and the Government.

11
Directors’ report For the three months period ended 30 June 2006 5. Principal activities The principal activities of the Corporation during the course of the three month period were to:
• Generate, purchase or otherwise acquire, and supply electricity from sources of energy including renewable sources.
• Acquire, transport and supply gas and steam. • Acquire, develop, operate and supply energy efficient technologies. • Provide ancillary services. • Provide Regional Power Corporation consultative and advisory services in relation to electricity generation
and on their behalf operate and maintain electricity generation plant or equipment. • Undertake, maintain and operate any works, system, facilities, apparatus or equipment required for the
above. Objectives As the largest electricity supplier in Western Australia, the Corporation seeks to meet the requirements of its stakeholders. Our vision is to create a leading business in the evolving Western Australian energy market. In order to achieve this vision, our primary strategic objectives are to:
• Embrace our new environment i) Establish the Corporation as a competitive participant in the Wholesale Electricity Market
(WEM). ii) Establish marketing and trading capability. iii) Increase our proportion of renewable energy.
• Maximise our value by matching our generating portfolio to market opportunities. Reduce cost of production. i) Increase return on assets. ii) Increase plant efficiency and flexibility. iii) Diversify customer base.
• Drive improvements in service and cost through opportunities to renew and innovate i) Increase plant availability and utilisation. ii) Reduce carbon-intensity.
• Provide a safe and rewarding workplace i) Create opportunities for personal growth and development. ii) Foster a behaviour-based safety climate. iii) Implement best practice human resources and organisation development practices.
Significant changes in the state of affairs There was no material change in the state of affairs during the financial period. The distribution of assets and liabilities from Western Power Corporation to the Corporation on disaggregation is disclosed in Note 30. 6. Dividends No dividends were paid or declared by the Corporation to the owner during the financial period. 7. Events subsequent to reporting date There has not arisen in the interval between the end of the financial year and the date of this report any item, transaction or event of a material and unusual nature likely, in the opinion of the Directors of the Corporation, to affect significantly the operations of the Corporation, the results of those operations, or the state of affairs of the Corporation in future financial years. 8. Likely developments The Corporation will continue to pursue its policy of increasing profitability during the next financial year. Further information about likely developments in the operations of the Corporation and the expected results of those operations in future financial years has not been included in this report because disclosure of the information would be likely to result in unreasonable prejudice to the Corporation.

12
Directors’ report For the three months period ended 30 June 2006 9. Indemnification of Directors and Officers During the reporting period a Directors and Officers Liability Insurance Policy was established to ensure that the Directors and officers had adequate coverage. The policy indemnifies Directors and Officers of the Corporation from losses arising from a claim or claims made against them jointly or severally during the period of insurance by reason of any wrongful act (as defined in the policy) in the capacity as a Director or Officer of the Corporation. 10. Non-audit services During the period, the contractor to the Corporation’s auditor did perform certain other services in addition to their statutory duties. Details of the amounts paid to the contractor to the Corporation’s auditor for non-audit services provided during the year are set out below.
$
Other services Taxation compliance services 5,000 11. Lead auditor’s independence declaration The lead auditor’s independence declaration is set out on page 46 and forms part of the Directors’ Report for the financial period ended 30 June 2006. 12. Rounding off The Corporation has rounded off to the nearest thousand dollars unless otherwise stated. This report is made with a resolution of the Directors:
_____________________ Chairman Dated at Perth this 20 day of September 2006.

Electricity Generation Corporation (trading as Verve Energy) 13
Income statement For the three months period ended 30 June 2006
Note
Three months ended 30 June
2006
$’000 Revenue 2a 245,242 Other income 2b 12,848 258,090 Fuel and electricity purchases 160,717 Raw materials and services used 41,259 Employee expenses 15,360 Depreciation and amortisation expenses 3 30,775 Other expenses 6,812 3 254,923 Profit before financing costs 3,167 Financial income 3 184 Financial expenses 3 (19,816) Net financing costs (19,632) Loss before tax (16,465) Income tax benefit 5 4,546 Loss for the financial period (11,919) The income statement is to be read in conjunction with the notes of the financial statements set out on pages 19 to 43.

Electricity Generation Corporation (trading as Verve Energy) 14
Statement of Changes In Equity For the three months period ended 30 June 2006
Note 2006
$’000 Equity at beginning of the financial period 30 629,326 Direct adjustment to equity Fair value (net of tax) (121) Finance lease (net of tax) (2,364) (2,485) Net Income recognised directly in equity Reserves Hedging reserve (net of tax) 20 207 Fair value reserve (net of tax) 20 (85) 122 Loss for the period (11,919) Equity at end of the financial period 615,044 The statement of changes in equity is to be read in conjunction with the notes to the financial statements set out on pages 19 to 43.
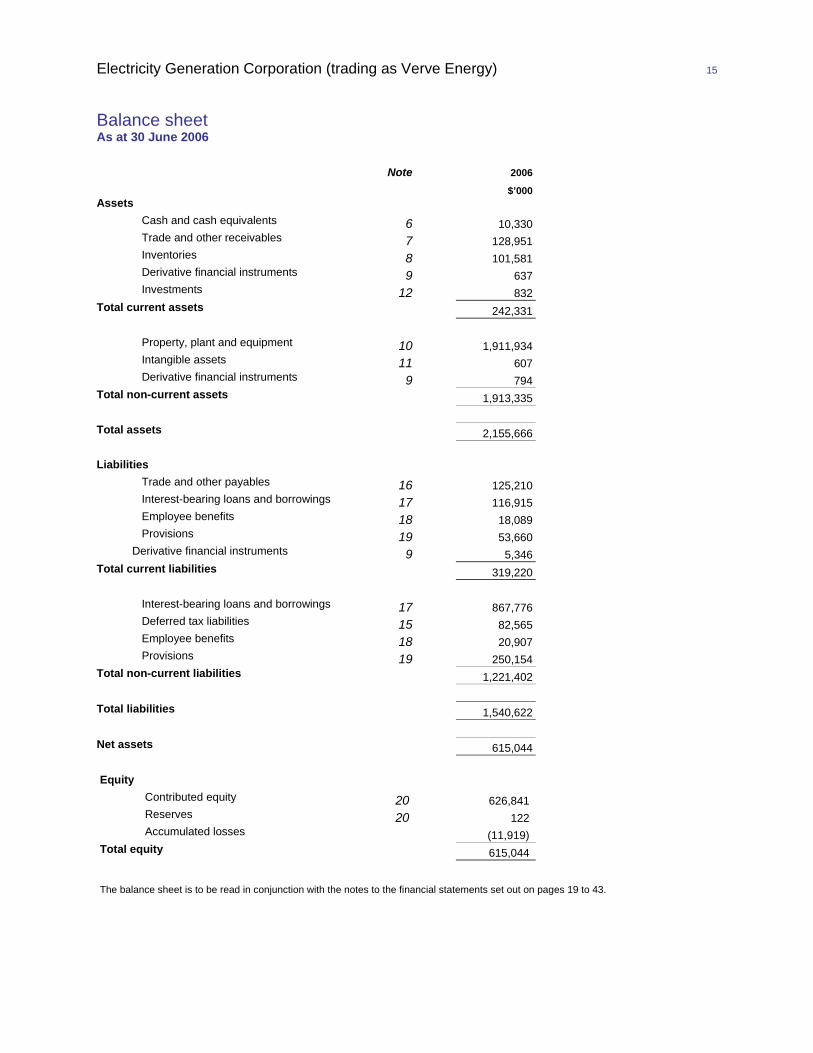
Electricity Generation Corporation (trading as Verve Energy) 15
Balance sheet As at 30 June 2006
Note 2006 $’000 Assets Cash and cash equivalents 6 10,330 Trade and other receivables 7 128,951 Inventories 8 101,581 Derivative financial instruments 9 637 Investments 12 832 Total current assets 242,331 Property, plant and equipment 10 1,911,934 Intangible assets 11 607 Derivative financial instruments 9 794 Total non-current assets 1,913,335 Total assets 2,155,666 Liabilities Trade and other payables 16 125,210 Interest-bearing loans and borrowings 17 116,915 Employee benefits 18 18,089 Provisions 19 53,660
Derivative financial instruments 9 5,346 Total current liabilities 319,220 Interest-bearing loans and borrowings 17 867,776 Deferred tax liabilities 15 82,565 Employee benefits 18 20,907 Provisions 19 250,154 Total non-current liabilities 1,221,402 Total liabilities 1,540,622 Net assets 615,044 Equity Contributed equity 20 626,841 Reserves 20 122 Accumulated losses (11,919) Total equity 615,044 The balance sheet is to be read in conjunction with the notes to the financial statements set out on pages 19 to 43.

Electricity Generation Corporation (trading as Verve Energy) 16
Statement of cash flow For the three months period ended 30 June 2006 Note 2006
$’000
Cash flows from operating activities Cash receipts from customers 161,716 Cash paid to suppliers and employees (185,303) Interest paid (2,132) Interest received 184 Net cash from operating activities 26 (25,535) Cash flows from investing activities Payment of property, plant and equipment (36,254) Net cash from investing activities (36,254) Cash flows from financing activities Proceeds from borrowing 259,000 Repayment of borrowing (192,393) Payment of finance lease liabilities (6,925) Net cash from financing activities 59,682 Net decrease in cash and cash equivalents (2,107) Cash and cash equivalents at 1 April 2006 12,437 Cash and cash equivalents at 30 June 2006 6 10,330 The statement of cash flows is to be read in conjunction with the notes to the financial statements set out on pages 19 to 43.

Electricity Generation Corporation (trading as Verve Energy) 17
Notes to the financial statements for three months ended 30 June 2006 1. Significant accounting policies (a) Statement of compliance (b) Basis of preparation (c) Going concern (d) Basis of consolidation (e) Foreign currency (f) Derivative financial instruments (g) Hedging (h) Property, plant and equipment (i) Intangible assets (j) Investments (k) Trade and other receivables
(l) Inventories (m) Cash and cash equivalents (n) Impairment
(o) Interest-bearing borrowings (p) Employee benefits (q) Provisions (r) Trade and other payables (s) Revenue (t) Expenses (u) National tax equivalent regime (v) Goods and services tax (w) Accounting estimates and
judgements (x) Segment reporting

Electricity Generation Corporation (trading as Verve Energy) 18
Notes to the financial statements for three months ended 30 June 2006 2. Revenue 3. Expenses 4. Auditors’ remuneration 5. Income tax benefit 6. Cash and cash equivalents 7. Trade and other receivables 8. Inventories 9. Derivative financial instruments 10. Property, plant and equipment 11. Intangible assets 12. Investments 13. Investment in joint venture entity 14. Investment in joint venture
operation 15. Deferred tax assets and liabilities 16. Trade and other payables 17. Interest-bearing loans and
borrowings 18. Employee benefits 19. Provisions
20. Contributed equity and reserves 21. Financial instruments 22. Operating leases 23. Capital and other commitments 24. Contingencies 25. Subsidiary 26. Reconciliation of cash flows from
operating activities 27. Directors’ and executive
remuneration disclosures 28. Subsequent events 29. Segment reporting 30. Distribution from owner
(disaggregation)

Electricity Generation Corporation (trading as Verve Energy) 19
Notes to the financial statements 1. Significant accounting policies Electricity Generation Corporation trading as Verve Energy (‘the Corporation’) is a Corporation domiciled in
Australia. The financial report of the Corporation for the three months period ended 30 June 2006 comprises the Corporation and its subsidiaries and the Corporation’s interest in associates and jointly controlled entities.
The financial report was authorised for issue by the Directors on 20 September 2006.
(a) Statement of compliance The financial report is a general purpose financial report which has been prepared in accordance with Australian
Accounting Standards (‘AASBs’) adopted by the Australian Accounting Standards Board (‘AASB’) and the Corporations Act 2001. International Financial Reporting Standards (‘IFRSs’) form the basis of Australian Accounting Standards (‘AASBs’) adopted by the AASB, and for the purpose of this report are called Australian equivalents to IFRS (‘AIFRS’) to distinguish from previous Australian GAAP. The financial reports of the Corporation comply with IFRSs and interpretations adopted by the International Accounting Standards Board.
(b) Basis of preparation The financial report is presented in Australian dollars. The following standards and amendments were available
for early adoption but have not been applied by the Corporation in these financial statements:
• UIG 8 Scope of AASB 2. • AASB 7 Financial instruments: Disclosure (August 2005) replacing the presentation requirements of
financial instruments in AASB 132. AASB 7 is applicable for annual reporting periods beginning on or after 1 January 2007
• AASB 2005-10 Amendments to Australian Accounting Standards (September 2005) makes consequential amendments to AASB 132 Financial Instruments: Disclosures and Presentation, AASB 101 Presentation of Financial Statements, AASB 114 Segment Reporting, AASB 117 Leases, AASB 133 Earnings per Share, AASB 139 Financial Instruments: Recognition and Measurement, AASB 1 First-time Adoption of Australian Equivalents to International Financial Reporting Standards, AASB 4 Insurance Contracts, AASB 1023 General Insurance Contracts and AASB 1038 Life Insurance Contracts, arising from the release of AASB 7. AASB 2005-10 is applicable for annual reporting periods beginning on or after 1 January 2007.
The Corporation plans to adopt UIG 8, AASB 7 and AASB 2005-10 in the 2007 financial year. The initial
application of UIG 8, AASB 7 and AASB 2005-10 is not expected to have an impact on the financial results of the Corporation as the standard and the amendment are concerned only with disclosures.
The financial report is prepared on the historical cost basis except that the following assets and liabilities are stated at their fair value: derivative financial instruments and financial instruments classified as available-for-sale.
The preparation of a financial report in conformity with Australian Accounting Standards requires management to make judgements, estimates and assumptions that affect the application of policies and reported amounts of assets and liabilities, income and expenses. The estimates and associated assumptions are based on historical experience and various other factors that are believed to be reasonable under the circumstances, the results of which form the basis of making the judgements about carrying values of assets and liabilities that are not readily apparent from other sources. Actual results may differ from these estimates.
The estimates and underlying assumptions are reviewed on an ongoing basis. Revisions to accounting
estimates are recognised in the period in which the estimate is revised if the revision affects only that period, or in the period of the revision and future periods if the revision affects both current and future periods. Judgements made by management in the application of Australian Accounting Standards that have a significant effect on the financial report and estimates with a significant risk of material adjustment in the next year are discussed in note 1(w).
The Corporation has rounded off to the nearest thousand dollars unless otherwise stated.
(c) Going concern Notwithstanding that the Corporation has incurred a loss of $11,919,000 for the three months ended 30 June
2006 and has a working capital deficiency of $76,889,000, there are reasonable grounds to believe that the Corporation is able to pay its debts as and when they become due and payable considering the balance of

Electricity Generation Corporation (trading as Verve Energy) 20
Notes to the financial statements available financing Going concern (continued) facilities of $658,044,000 is not utilised at the end of reporting period, and the fact that the Corporation is forecasting positive cashflow in 2007. Accordingly the financial statements have been prepared on the going concern basis which contemplates establishment of profitable operations and the realisation of assets and liabilities in the ordinary course of business.
(d) Basis of consolidation
(i) Subsidiaries Subsidiaries are entities controlled by the Corporation. Control exits when the Corporation has the power,
directly or indirectly, to govern the financial and operating policies of an entity so as to obtain benefits from its activities. In assessing control, potential voting rights that presently are exercisable or convertible are taken into account.
Consolidated accounts have not been presented as they are identical to the Corporation as the investment in the
subsidiary (Western Carbon Pty Ltd as disclosed in note 25) has been fully written off prior to disaggregation and has been dormant since.
(ii) Joint ventures
Joint ventures are those entities over whose activities the Corporation has joint control, established by contractual agreement.
Jointly controlled entities
In the financial statements, investments in jointly controlled entities, including partnerships, are accounted for using equity accounting principles. Investments in joint venture entities are carried at the lower of the equity accounted amount and recoverable amount. The Corporation’s share of the jointly controlled entity’s net profit or loss is recognised in the income statement from the date joint control commenced until the date joint control ceases. Other movements in reserves are recognised directly in the reserves.
In the Corporation’s financial statements, investments in joint venture entities are carried at cost. Jointly controlled operations and assets
The interest of the Corporation in unincorporated joint ventures and jointly controlled assets are brought to account by recognising in its financial statements the assets it controls, the liabilities that it incurs, the expenses it incurs and its share of income that it earns from the sale of goods or services by the joint venture.
(iii) Transactions eliminated on consolidation
Intragroup balances and any unrealised gains and losses or income and expenses arising from intragroup transactions, are eliminated in preparing the financial statements.
Unrealised gains arising from transactions with jointly controlled entities are eliminated to the extent of the
Corporation’s interest in the entity. Unrealised losses are eliminated in the same way as unrealised gains, but only to the extent that there is no
evidence of impairment. Gains and losses are recognised as the contributed assets are consumed or sold by the jointly controlled entities or, if not consumed or sold by the jointly controlled entity, when the Corporation’s interest in such entities is disposed of.
(e) Foreign currency The functional and presentation currency of the Corporation is Australian dollars (A$). Transactions in foreign currencies are translated at the foreign exchange rate ruling at the date of the
transaction. Monetary assets and liabilities denominated in foreign currencies at the balance sheet date are translated to Australian dollars at the foreign exchange rate ruling at that date. Foreign exchange differences arising on translation are recognised in the income statement. Non-monetary assets and liabilities that are measured in terms of historical cost in a foreign currency are translated using the exchange rate at the date of the transaction. Non-monetary assets and liabilities denominated in foreign currencies that are stated at fair value are translated to Australian dollars at foreign exchange rates ruling at the dates the fair value was

Electricity Generation Corporation (trading as Verve Energy) 21
Notes to the financial statements determined.
(f)
Derivative financial instruments The Corporation uses derivative financial instruments to hedge its exposure to foreign exchange, commodity and interest rate risks arising from operating, financing and investing activities. In accordance with its treasury policy, the Corporation does not hold or issue derivative financial instruments for trading purposes. However, derivatives that do not qualify for hedge accounting are accounted for as trading instruments.
Derivative financial instruments are recognised initially at fair value. Subsequent to initial recognition, derivative
financial instruments are stated at fair value. The gain or loss on measurement to fair value is recognised immediately in the income statement. However, where derivatives qualify for hedge accounting, recognition of any resultant gain or loss depends on the nature of the item being hedged (see accounting policy g).
The fair value of interest rate swaps is the estimated amount that the Corporation would receive or pay to terminate the swap at the balance sheet date, taking into account current interest rates and the current creditworthiness of the swap counterparties. The fair value of forward exchange contracts is their quoted market price at the balance sheet date, being the present value of the quoted forward price. The fair value of commodity swaps is the estimated amount the Corporation would receive or pay to terminate the swap at balance sheet date, taking into account current commodity prices.
Interest rate swap and commodity swap-embedded are accounted for at fair value. The gain and loss on
measurement to fair value is recognised immediately in the income statement.
(g) Hedging On entering into a hedging relationship, the Corporation formally designates and documents the hedge
relationship and the risk management objective and strategy for undertaking the hedge. The documentation includes identification of the hedging instrument, the hedged item or transaction, the nature of the risk being hedged and how the entity will assess the hedging instrument’s effectiveness in offsetting the exposure to changes in the hedged item’s fair value or cash flows attributable to the hedged risk. Such hedges are expected to be highly effective in achieving offsetting changes in fair value or cash flows and are assessed on an ongoing basis to determine that they actually have been highly effective throughout the financial reporting periods for which they are designated.
(i) Cash flow hedges
Where a derivative financial instrument is designated as a hedge of the variability in cash flows of a recognised asset or liability, or a highly probable forecasted transaction, the effective part of any gain or loss on the derivative financial instrument is recognised directly in equity. When the forecasted transaction subsequently results in the recognition of a non-financial asset or non-financial liability, or the forecast transaction for a non-financial asset or non-financial liability becomes a firm commitment for which fair value hedge accounting is applied, the associated cumulative gain or loss is removed from equity and included in the initial cost or other carrying amount of the non-financial asset or liability. If a hedge of a forecasted transaction subsequently results in the recognition of a financial asset or a financial liability, the associated gains and losses that were recognised directly in equity are reclassified into profit or loss in the same period or periods during which the asset acquired or liability assumed affects profit or loss (i.e. when interest income or expense is recognised).
For cash flow hedges, other than those described above, the associated cumulative gain or loss is removed from equity and recognised in the income statement in the same period or periods during which the hedged forecast transaction affects profit or loss. The ineffective part of any gain or loss is recognised immediately in the income statement.
When a hedging instrument expires or is sold, terminated or exercised, or the entity revokes designation of the hedge relationship, but the hedged forecast transaction is still expected to occur, the cumulative gain or loss at that point remains in equity and is recognised in accordance with the above policy when the transaction occurs. If the hedged transaction is no longer expected to take place, the cumulative unrealised gain or loss recognised in equity is recognised immediately in the income statement.

Electricity Generation Corporation (trading as Verve Energy) 22
Notes to the financial statements (ii) Hedge of monetary assets and liabilities
Where a derivative financial instrument is used to hedge economically the foreign exchange exposure of a recognised monetary asset or liability, no hedge accounting is applied and any gain or loss on the hedging instrument is recognised in the income statement.
(h) Property, plant and equipment (i) Owned assets
Property, plant and equipment are stated at cost or deemed cost less accumulated depreciation (see below) and impairment losses (see accounting policy n). The cost of self-constructed assets includes the cost of materials, direct labour, the initial estimate, where relevant, of the costs of dismantling and removing the items and restoring the site on which they are located, and an appropriate proportion of production overheads.
Where parts of an item of property, plant and equipment have different useful lives, they are accounted for as separate items of property, plant and equipment.
(ii) Leased assets Leases in terms of which the Corporation assumes substantially all the risks and rewards of ownership are
classified as finance leases. The finance lease is stated at an estimated amount equal to its fair value and the present value of the minimum lease payments at inception of the lease, less accumulated depreciation (see below) and impairment losses (see accounting policy n). Lease payments are accounted for as described in accounting policy (v).
(iii) Subsequent costs
The Corporation recognises in the carrying amount of an item of property, plant and equipment the cost of replacing part of such an item when that cost is incurred if it is probable that the future economic benefits embodied within the item will flow to the Corporation and the cost of the item can be measured reliably. All other costs are recognised in the income statement as an expense as incurred.
(iv) Depreciation
Depreciation is charged to the income statement on a straight-line basis over the estimated useful lives of each part of an item of property, plant and equipment. Land is not depreciated. The estimated useful lives in the current period are as follows:
Buildings 40 years
Plant and equipment 20 – 45 years Leasehold improvements 10 years Lease assets 25 years
The residual value, the useful life and the depreciation method applied to an asset are reassessed at least
annually.
(i) Intangible assets Intangible assets are stated at cost less accumulated amortisation (see below) and impairment losses (see
accounting policy n). (i) Subsequent expenditure
Subsequent expenditure on capitalised intangible assets is capitalised only when it increases the future economic benefits embodied in the specific asset to which it relates. All other expenditure is expensed as incurred.
(ii) Amortisation
Amortisation is charged to the income statement on a straight-line basis over the estimated useful lives of intangible assets and are amortised from the date they are available for use. The estimated useful lives in the current period are as follows:
Computer software 2 – 3 years

Electricity Generation Corporation (trading as Verve Energy) 23
Notes to the financial statements Exclusive rights 2 –14 years
(j) Investments
(i) Investments in equity securities Financial instruments held as available-for-sale are classified as current assets and are stated at fair value, with
any resultant gain or loss recognised in the income statement.
The fair value of financial instruments held as available-for-sale is their quoted at market price at the balance sheet date.
(k) Trade and other receivables
Trade and other receivables are stated at their amortised cost less impairment losses (see accounting policy (n)).
(l) Inventories Inventories are stated at the lower of cost and net realisable value. Net realisable value is the estimated selling
price in the ordinary course of business, less the estimated costs of completion and selling expenses.
(m) Cash and cash equivalents Cash and cash equivalents comprise cash at bank and call deposits.
(n) Impairment The carrying amounts of the Corporation’s assets, other than deferred tax assets (see accounting policy u), are
reviewed at balance sheet date to determine whether there is any indication of impairment. If any such indication exists, the asset’s recoverable amount is estimated (see accounting policy n(i)).
An impairment loss is recognised whenever the carrying amount of an asset or its cash-generating unit exceeds
its recoverable amount. Impairment losses are recognised in the income statement .
Impairment losses recognised in respect of cash-generating units are allocated first to reduce the carrying amount of any goodwill allocated to cash-generating units (group of units) and then, to reduce the carrying amount of the other assets in the unit (group of units) on a pro rata basis.
(i) Calculation of recoverable amount The recoverable amount of the investments in held-to-maturity securities and receivables carried at amortised
cost is calculated as the present value of estimated future cash flows, discounted at the original effective interest rate (i.e. the effective interest rate computed at initial recognition of these financial assets). Receivables with a short duration are not discounted.
Impairment of receivables is not recognised until objective evidence is available that a loss event has occurred.
Significant receivables are individually assessed for impairment. Impairment testing of significant receivables that are not assessed as impaired individually is performed by placing them into portfolios of significant receivables with similar risk profiles and undertaking a collective assessment of impairment. Non-significant receivables are not individually assessed. Instead, impairment testing is performed by placing non-significant receivables in portfolios of similar risk profiles, based on objective evidence from historical experience adjusted for any effects of conditions existing at each balance sheet date.
The recoverable amount of other assets is the greater of their fair value less costs to sell and value in use. In
assessing value in use, the estimated future cash flows are discounted to their present value using a pre-tax discount rate that reflects current market assessments of the time value of money and the risks specific to the asset. For an asset that does not generate largely independent cash inflows, the recoverable amount is determined for the cash-generating unit to which the asset belongs.
(ii) Reversals of impairment
Impairment losses are reversed when there is an indication that the impairment loss may no longer exist and there has been a change in the estimate used to determine the recoverable amount.
An impairment loss is reversed only to the extent that the asset’s carrying amount does not exceed the carrying
amount that would have been determined, net of depreciation or amortisation, if no impairment loss had been recognised.

Electricity Generation Corporation (trading as Verve Energy) 24
Notes to the financial statements
(iii) Derecognition of financial assets and liabilities A financial asset (or, where applicable, a part of a financial asset) is derecognised when: A. the rights to receive cash flows from the asset have expired B. the Corporation retains the right to receive cash flows from the asset, but has assumed an obligation to pay
them in full without material delay to a third party; or C. the Corporation has transferred its rights to receive cash flows from the asset and either (a) has transferred
substantially all the risks and rewards of the asset, or (b) has neither transferred nor retained substantially all the risks and rewards of the asset, but has transferred control of the asset.
A financial liability is derecognised when the obligation under the liability is discharged, cancelled or expired.
When an existing financial liability is replaced by another from the same lender on substantially different terms, or the terms of an existing liability are substantially modified, such an exchange or modification is treated as a derecognition of the original liability and the recognition of a new liability. The difference in the respective carrying amounts is recognised in profit and loss.
(o) Interest-bearing borrowings
Interest-bearing borrowings are recognised initially at fair value less attributable transaction costs. Subsequent to initial recognition, interest-bearing borrowings are stated at amortised cost with any difference between cost and redemption value being recognised in the income statement over the period of the borrowings on an effective interest basis.
(p) Employee benefits
(i) Defined contribution superannuation funds
Obligations for contributions to defined contribution superannuation funds are recognised as an expense in the income statement as incurred.
(ii) Defined benefit superannuation funds
The Corporation’s net obligation in respect of defined benefit superannuation funds is calculated separately for each fund by estimating the amount of future benefit that employees have earned in return for their service in the current and prior periods; that benefit is discounted to determine its present value, and the fair value of any fund assets is deducted.
The discount rate is the yield at the balance sheet date on government bonds that have maturity dates
approximating to the terms of the Corporation’s obligations. The calculation is performed by a qualified actuary. When the benefits of a fund are improved, the portion of the increased benefit relating to past service by
employees is recognised as an expense in the income statement on a straight-line basis over the average period until the benefits become vested. To the extent that the benefits vest immediately, the expense is recognised immediately in the income statement.
Where the calculation results in a benefit to the Corporation, the recognised asset is limited to the net total of any
unrecognised actuarial losses and past service costs and the present value of any future refunds from the fund or reductions in future contributions to the fund. Past service cost is the increase in the present value of the defined benefit obligation for employee services in prior periods, resulting in the current period from the introduction of, or changes to, post-employment benefits or other long-term employee benefits. Past service costs may either be positive (where benefits are introduced or improved) or negative (where existing benefits are reduced).
(iii) Long-term service benefits
The Corporation’s net obligation in respect of long-term service benefits, other than defined benefit superannuation funds, is the amount of future benefit that employees have earned in return for their service in the current and prior periods. The obligation is calculated using expected future increases in wage and salary rates including related on-costs and expected settlement dates, and is discounted using the rates attached to the Government bonds at the balance sheet date which have maturity dates approximating to the terms of the Corporation’s obligations.
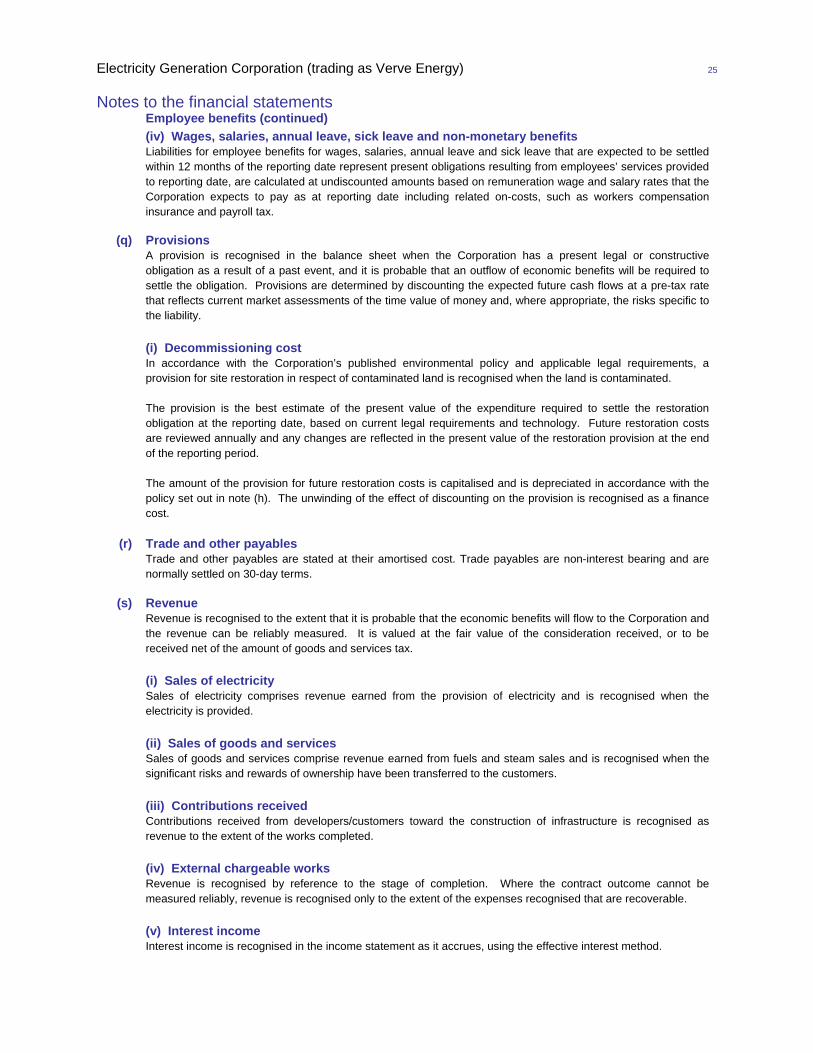
Electricity Generation Corporation (trading as Verve Energy) 25
Notes to the financial statements Employee benefits (continued) (iv) Wages, salaries, annual leave, sick leave and non-monetary benefits
Liabilities for employee benefits for wages, salaries, annual leave and sick leave that are expected to be settled within 12 months of the reporting date represent present obligations resulting from employees’ services provided to reporting date, are calculated at undiscounted amounts based on remuneration wage and salary rates that the Corporation expects to pay as at reporting date including related on-costs, such as workers compensation insurance and payroll tax.
(q) Provisions
A provision is recognised in the balance sheet when the Corporation has a present legal or constructive obligation as a result of a past event, and it is probable that an outflow of economic benefits will be required to settle the obligation. Provisions are determined by discounting the expected future cash flows at a pre-tax rate that reflects current market assessments of the time value of money and, where appropriate, the risks specific to the liability.
(i) Decommissioning cost
In accordance with the Corporation’s published environmental policy and applicable legal requirements, a provision for site restoration in respect of contaminated land is recognised when the land is contaminated.
The provision is the best estimate of the present value of the expenditure required to settle the restoration
obligation at the reporting date, based on current legal requirements and technology. Future restoration costs are reviewed annually and any changes are reflected in the present value of the restoration provision at the end of the reporting period.
The amount of the provision for future restoration costs is capitalised and is depreciated in accordance with the
policy set out in note (h). The unwinding of the effect of discounting on the provision is recognised as a finance cost.
(r) Trade and other payables
Trade and other payables are stated at their amortised cost. Trade payables are non-interest bearing and are normally settled on 30-day terms.
(s) Revenue
Revenue is recognised to the extent that it is probable that the economic benefits will flow to the Corporation and the revenue can be reliably measured. It is valued at the fair value of the consideration received, or to be received net of the amount of goods and services tax.
(i) Sales of electricity
Sales of electricity comprises revenue earned from the provision of electricity and is recognised when the electricity is provided.
(ii) Sales of goods and services Sales of goods and services comprise revenue earned from fuels and steam sales and is recognised when the
significant risks and rewards of ownership have been transferred to the customers. (iii) Contributions received Contributions received from developers/customers toward the construction of infrastructure is recognised as
revenue to the extent of the works completed. (iv) External chargeable works Revenue is recognised by reference to the stage of completion. Where the contract outcome cannot be
measured reliably, revenue is recognised only to the extent of the expenses recognised that are recoverable. (v) Interest income Interest income is recognised in the income statement as it accrues, using the effective interest method.
Electricity Generation Corporation (trading as Verve Energy) 26
Notes to the financial statements Revenue (continued) (vi) Government grants
Grants that compensate the Corporation for expenses incurred are recognised as revenue in the income statement in the same periods in which the expenses are incurred. Grants that compensate the Corporation for the cost of an asset are recognised in the income statement as other income. Government grant income is recognised when the grant becomes receivable.
(vii) Renewable energy certificates
Renewable energy certificates are not recognised in the financial statements until they are sold or surrendered.
(t) Expenses (i) Fuel costs Fuel costs are assigned on the basis of weighted average cost. (ii) Operating lease payments
Payments made under operating leases are recognised in the income statement on a straight-line basis over the term of the lease. Lease incentives received are recognised in the income statement as an integral part of the total lease expense and spread over the lease term.
(iii) Finance lease payments
Minimum lease payments are apportioned between the finance charge and the reduction of the outstanding liability. The finance charge is allocated to each period during the lease term so as to produce a constant periodic rate of interest on the remaining balance of the liability.
(iv) Interest expenses
Interest expense is recognised in the income statement as it accrues, using the effective interest method.
(u) National Taxation Equivalent Regime The Corporation operates under the National Taxation Equivalent Regime (NTER) environment. While tax
equivalent payments will continue to be remitted to State Treasury, the Corporation’s tax is subject to Australian Taxation Office (ATO) administration. The calculation of the liability in respect of these taxes is governed by the Income Tax Administration Acts and the NTER guidelines as agreed by the State Government.
Income tax on the profit or loss for the period comprises current and deferred tax. Income tax is recognised in
the income statement except to the extent that it relates to items recognised directly in equity, in which case it is recognised in equity.
Current tax is the expected tax payable on the taxable income for the year, using tax rates enacted or
substantively enacted at the balance sheet date Deferred tax is provided using the balance sheet liability method, providing for temporary differences between
the carrying amounts of assets and liabilities for financial reporting purposes and the amounts used for taxation purposes. The amount of deferred tax provided is based on the expected manner of realisation or settlement of tax liability.
A deferred tax asset is recognised only to the extent that it is probable that future taxable profits will be available
against which the asset can be utilised. Deferred tax assets are reduced to the extent that it is no longer probable that the related tax benefit will be realised.
(v) Goods and services tax
Revenue, expenses and assets are recognised net of the amount of goods and services tax (GST), except where the amount of GST incurred is not recoverable from the taxation authority. In these circumstances, the GST is recognised as part of the cost of acquisition of the asset or as part of the expense.
Goods and services tax (continued) Receivables and payables are stated with the amount of GST included. The net amount of GST recoverable
from, or payable to, the ATO is included as a current asset or liability in the balance sheet.

Electricity Generation Corporation (trading as Verve Energy) 27
Notes to the financial statements Cash flows are included in the statement of cash flows on a gross basis. The GST components of cash flows
arising from investing and financing activities that are recoverable from, or payable to, the ATO are classified as operating cash flows.
(w) Accounting estimates and judgements
The estimates and judgements that have a significant risk of causing a material adjustment to the carrying amounts of assets and liabilities within the next financial year are discussed below.
(i) Key sources of estimation uncertainty Note 21 contains a detailed analysis of the foreign exchange exposure of the Corporation and risks in relation to
foreign exchange movements. (ii) Defined benefit superannuation fund obligations Various actuarial assumptions are utilised in the determination of the Corporation’s defined benefit
superannuation fund obligations. These assumptions are discussed in note 18. (iii) Long service leave provision Various actuarial assumptions are utilised in the determination of the Corporation’s long service leave liability.
(iv) Decommissioning cost The Corporation determines the anticipated costs of dismantling and removing the asset and restoring the site on
which it is located based on the actual expenditure incurred in the past. (v) Finance lease asset The Corporation determines the anticipated costs of constructing the asset and the estimated rate of return on
the asset. (vi) Interest rate swap and commodity swap-embedded The Corporation determines the anticipated interest rate derivatives and distillate price index.
(x) Segment reporting As per the Act, the functions of the Corporation is restricted to South West interconnected system except where
the Corporation generates and supplies or purchases electricity from renewable sources.

Electricity Generation Corporation (trading as Verve Energy) 28
Notes to the financial statements
2. Revenue and other income a. Revenue
2006 $’000 Sale of electricity 229,198 Sale of goods and services 16,044 245,242
b. Other income
2006 $’000 Contract works 3,944 Derivative financial instruments income FX gains 140 Embedded derivative 37 Commodity 967 Contribution income 946 Government grants 3,147 Others 3,667 12,848
3. Expenses Loss before tax includes the following specific
expenses:
2006 $’000 Depreciation and amortisation expenses Depreciation 28,322 Amortisation Lease asset 2,428 Intangible asset 25 30,775 Net Financing costs Interest income (184) Finance lease interest 6,925 Unwinding of discount on provision 1,900 Interest and finance charges paid and payable 10,991 19,632 Operating lease expenses 1,154 Cost of goods and services sold 12,285

Electricity Generation Corporation (trading as Verve Energy) 29
Notes to the financial statements
4. Auditors’ remuneration
2006 $ Audit services Audit and review of financial reports 153,000 Other services Taxation services 5,000 158,000
5. Income tax benefit Recognised in the income statement 2006 $’000 Current tax benefit Current year - Deferred tax benefit Origination and reversal of temporary differences (8,014) Benefit of tax loss recognised 12,560 Total income tax benefit in income statement 4,546 Reconciliation between tax benefit and pre-tax net loss 2006 $’000 Loss before tax (16,465) Income tax using the domestic Corporation tax rate of 30% 4,939 Decrease in income tax benefit due to: Non deductible expenses (393) Income tax benefit and pre-tax net loss 4,546
6. Cash and cash equivalents 2006 $’000 Cash at bank and on hand 3,830 Call deposits 6,500 Cash and cash equivalents 10,330
7. Trade and other receivables
2006 $’000 Trade receivables 112,190 Other receivables 110 Deposit 1,950 Prepayments 14,701 128,951 On disaggregation, Western Power Corporation’s recoverable works receivables were allocated to Western Power
Networks. Where these receivables are collected by Western Power Networks on behalf of the Corporation, Western Power Network is required to distribute the monies to the Corporation.

Electricity Generation Corporation (trading as Verve Energy) 30
Notes to the financial statements
8. Inventories 2006 $’000 Fuels 64,460 Raw materials 36,886 Work in progress 108 Finished goods 127 101,581 On disaggregation, the Western Power Corporation’s coal inventory allocated to the Corporation was written down
to its fair value. This is because the cost and net realisable value of the coal inventory was deemed to be in excess of the fair value. The fair value of the coal inventory was calculated using the coal price negotiated during the August 2005 contract agreement.
on 9. Derivative financial instruments
2006 $’000 Current assets Forward exchange – cash flow hedge 385 Commodity swaps – cash flow hedge 252 637 Non current assets Interest rate swaps 579 Forward exchange contracts 215 794 Current Liability Interest rate swaps – embedded 2,762 Forward exchange contracts – cash flow hedge 923 Commodity swaps – embedded 1,661 5,346
Electricity Generation Corporation (trading as Verve Energy) 31
Notes to the financial statements Derivative financial instruments (continued)
(a) Instruments used by the Corporation The Corporation is party to derivative financial instruments in the normal course of business in order to hedge
exposure to fluctuations in interest and foreign exchange rates in accordance with the Corporation’s financial risk management policies.
(i) Interest rate swap The Corporation considered the interest rate swap as ineffective, the gain or loss from remeasuring the hedging
instruments at fair value is recognised into profit and loss as interest expense. (ii) Forward exchange contracts – cash flow hedge The Corporation has entered into forward exchange contracts to hedge against exchange rate movements. The
portion of the gain or loss on the hedging instrument that is determined to be an effective hedge is recognised directly in equity.
(iii) Commodity swap contracts – cash flow hedge The Corporation has entered into commodity swaps to hedge against adverse commodity price movements. The
gain and loss from remeasuring the hedging instruments at fair value is deferred in equity in the hedging reserve, to the extent that the hedge is effective, and the ineffective portion is recognised immediately into the income statement.
(b) Interest rate swaps and commodity swaps-embedded The Corporation has contractual arrangements that provide evidence of embedded derivatives for distillate price
index and interest rate derivatives. The portion of the gain or loss on the fair value at balance sheet date is recognised immediately into the income statement.
(c) Credit risk exposure
The Corporation undertakes approximately 100% of its transactions in foreign exchange, commodity and interest rate contracts with financial institutions with a credit rating of A or better.

Electricity Generation Corporation (trading as Verve Energy) 32
Notes to the financial statements
10. Property, plant and equipment Land Building Plant &
equipmentWorks under construction
* Leased assets
Total
$’000 $’000 $’000 $’000 $’000 $’000 Balance cost at 1 April 2006 5,552 135,708 1,488,541 36,681 - 1,666,482Additions - - - 40,087 238,799 278,886Decommissioning costs adjustment - - (2,555) - - (2,555)Written off - - - (129) - (129)Balance at 30 June 2006 5,552 135,708 1,485,986 76,639 238,799 1,942,684 Balance depreciation 1 April 2006 - - - - - -Depreciation charge for the period - 1,882 26,440 - 2,428 30,750Balance at 30 June 2006 - 1,882 26,440 - 2,428 30,750 Carrying amount at 30 June 2006 5,552 133,826 1,459,546 76,639 236,372 1,911,934 Carrying amount at 1 April 2006 5,552 135,708 1,488,541 36,681 - 1,666,482
*The Corporation has applied UIG 4, which is effective 1 January 2006, and has determined that the Power Purchase Agreement contains a lease arrangement. The lease has been recognised as a finance lease in accordance with AASB 117 Leases. On disaggregation, the Western Power Corporation’s property, plant and equipment allocated to the Corporation was written up to its fair value. The fair value of the property, plant and equipment was calculated based on the discounted future cash flows associated with the assets.
11. Intangible assets
Computer software
Exclusive rights Total
$’000 $’000 $’000 Cost at 1 April 2006 94 537 631 Additions - - - Cost at 30 June 2006 94 537 631 Depreciation at 1 April 2006 - - - Depreciation charge for the period 10 14 24 Depreciation at 30 June 2006 10 14 24 Carrying amount at 30 June 2006 84 523 607 Carrying amount at 1 April 2006 94 537 631
12. Investments
2006 $’000 Listed equity security available for sale 832 832 The movement in fair value from 1 April 2006 is recognised in the fair value reserve (refer Note 20).

Electricity Generation Corporation (trading as Verve Energy) 33
Notes to the financial statements
13. Investment in joint venture entity The Corporation has a 50% interest in a joint venture. Wind Energy Corporation was formed in Australia in August
2000 to focus on business opportunities relating to large scale wind farms operating in parallel with an interconnected electricity grid, and hybrid power systems for remote and regional applications that utilise renewable energy technologies. The original investment has been written down to its recoverable amount of zero before the disaggregation. The Corporation has been dormant during the financial period.
14. Interest in joint venture operation The Corporation has a 50% interest in a joint venture, South West Cogeneration Joint Venture, a 120 MW
cogeneration facility on the site of the Worsley Alumina Refinery in the South West of Western Australia. The output of the facility, thermal energy and electricity, is sold to the refinery and other energy customers. Within the terms of the joint venture agreement a pre-emptive right exists in regard to the disposal of either parties’ interest.
The following items which represent the Corporation’s interest in the assets and liabilities employed in the joint
venture were included in the assets and liabilities of the Corporation:
2006 $’000 Current assets Cash and cash equivalents 214 Trade receivables 901 Inventories 286 1,401 Non current assets Plant and equipment 29,489 Total assets 30,890 Current liabilities Trade payables 5,129 Total liabilities 5,129
There are no contingent liabilities, contingent assets or capital commitments relating to the joint venture at 30 June 2006.
15. Deferred tax assets and liabilities
Deferred tax assets and liabilities are attributable to the following: Assets Liabilities Net 2006 2006 2006 $’000 $’000 $’000 Property, plant and equipment 2,432 (178,640) (176,208) Other investments - (60) (60) Inventory 2,198 - 2,198 Provisions 75,324 - 75,324 Other items 3,738 (64) 3,674 Tax value of loss carry-forwards 12,560 - 12,560 Hedging reserve - (89) (89) Fair value reserve 36 - 36 Net tax assets /(liabilities) 96,288 (178,853) (82,565) Deferred tax assets and liabilities (continued)

Electricity Generation Corporation (trading as Verve Energy) 34
Notes to the financial statements Movement in temporary differences during the period
Balance 1 April
2006 Recognised in
income Recognised in
equity Balance at 30
June 2006 $’000 $’000 $’000 $’000 Property, plant and equipment (172,923) (3,285) - (176,208) Other investment (60) - - (60) Inventory 3,465 (1,267) - 2,198 Provisions 80,063 (4,739) - 75,324 Other items 1,332 1,277 1,065 3,674 Tax value of loss carry-forwards - 12,560 - 12,560 Hedging reserve - - (89) (89) Fair value reserve - - 36 36 Net tax assets / (liabilities) (88,123) 4,546 1,012 (82,565) On disaggregation, the Western Power Corporation’s deferred tax liabilities were allocated to the four separate state
owned entities based on the adjusted carrying value of the assets and liabilities contributed to them.
16. Trade and other payables
2006 $’000 Trade payables 100,980 Other payables 5,128 Billing in advance 4,211 Interest and other payables 8,855 GST and others 6,036 125,210
17. Interest-bearing loans and borrowings This note provides information about the contractual terms of the Corporation’s interest-bearing loans and
borrowings. For more information about the Corporation’s exposure to interest rate and foreign currency risk, see note 21.
2006 $’000 Current liabilities Finance lease liabilities 792 Unsecured loans and borrowings 116,123 116,915 Non Current liabilities Finance lease liabilities 241,943 Unsecured loans and borrowings 625,833 867,776
Financing arrangements Unsecured funding facility at reporting date Total facilities available 1,400,000 Facilities utilised at reporting date 741,956 Facilities not utilised at reporting date 658,044 Interest-bearing loans and borrowings (continued) Unsecured funding facility The Corporation has in place several borrowing facilities with Western Australian Treasury Corporation. There is

Electricity Generation Corporation (trading as Verve Energy) 35
Notes to the financial statements no fixed repayment term on the facilities.
Finance lease liabilities Finance lease liabilities of the Corporation are payable as follows:
Minimum lease
payments Interest
Principal 2006 2006 2006 $’000 $’000 $’000 Less than one year 28,446 27,654 792 Between one and five years 115,674 109,144 6,530 More than five years 595,478 360,065 235,413 739,598 496,863 242,735 The lease term under the contract is 25 years.
18. Employee benefits 2006 $’000 Current liabilities Salaries and wages accrued 253 Liability for long service leave 7,047 Liability for annual leave 10,789 18,089 Non Current liabilities Present value of wholly unfunded obligations 16,789 Present value of funded obligations - Recognised liability for defined benefit obligations 16,789 Liability for long service leave 4,118 20,907
(a) Liability for defined benefit obligations The Corporation makes contributions to two defined benefit superannuation funds that provide defined benefit
amounts for employees upon retirement. The Corporation is expected to meet the cost of the retirement benefit obligations as they fall due.
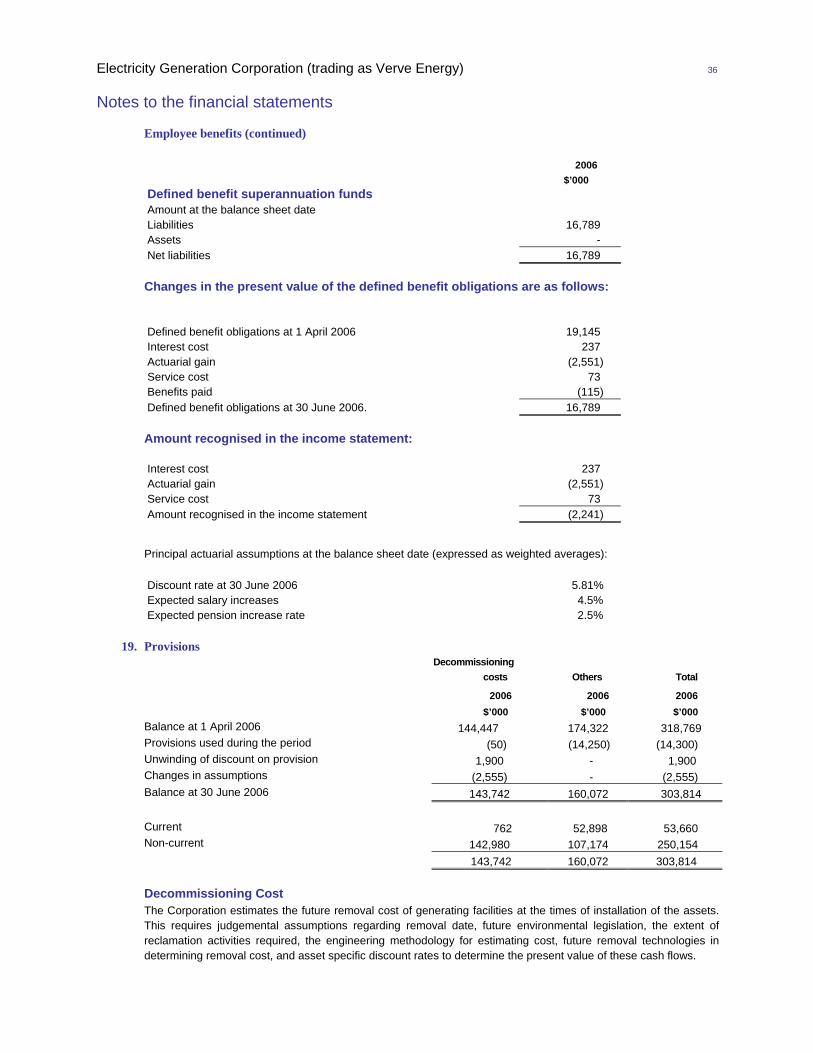
Electricity Generation Corporation (trading as Verve Energy) 36
Notes to the financial statements
Employee benefits (continued)
2006 $’000 Defined benefit superannuation funds Amount at the balance sheet date Liabilities 16,789 Assets - Net liabilities 16,789
Changes in the present value of the defined benefit obligations are as follows: Defined benefit obligations at 1 April 2006 19,145 Interest cost 237 Actuarial gain (2,551) Service cost 73 Benefits paid (115) Defined benefit obligations at 30 June 2006. 16,789
Amount recognised in the income statement: Interest cost 237 Actuarial gain (2,551) Service cost 73 Amount recognised in the income statement (2,241)
Principal actuarial assumptions at the balance sheet date (expressed as weighted averages): Discount rate at 30 June 2006 5.81% Expected salary increases 4.5% Expected pension increase rate 2.5%
19. Provisions
Decommissioning
costs
Others
Total
2006 2006 2006 $’000 $’000 $’000 Balance at 1 April 2006 144,447 174,322 318,769 Provisions used during the period (50) (14,250) (14,300) Unwinding of discount on provision 1,900 - 1,900 Changes in assumptions (2,555) - (2,555) Balance at 30 June 2006 143,742 160,072 303,814 Current 762 52,898 53,660 Non-current 142,980 107,174 250,154 143,742 160,072 303,814
Decommissioning Cost The Corporation estimates the future removal cost of generating facilities at the times of installation of the assets.
This requires judgemental assumptions regarding removal date, future environmental legislation, the extent of reclamation activities required, the engineering methodology for estimating cost, future removal technologies in determining removal cost, and asset specific discount rates to determine the present value of these cash flows.
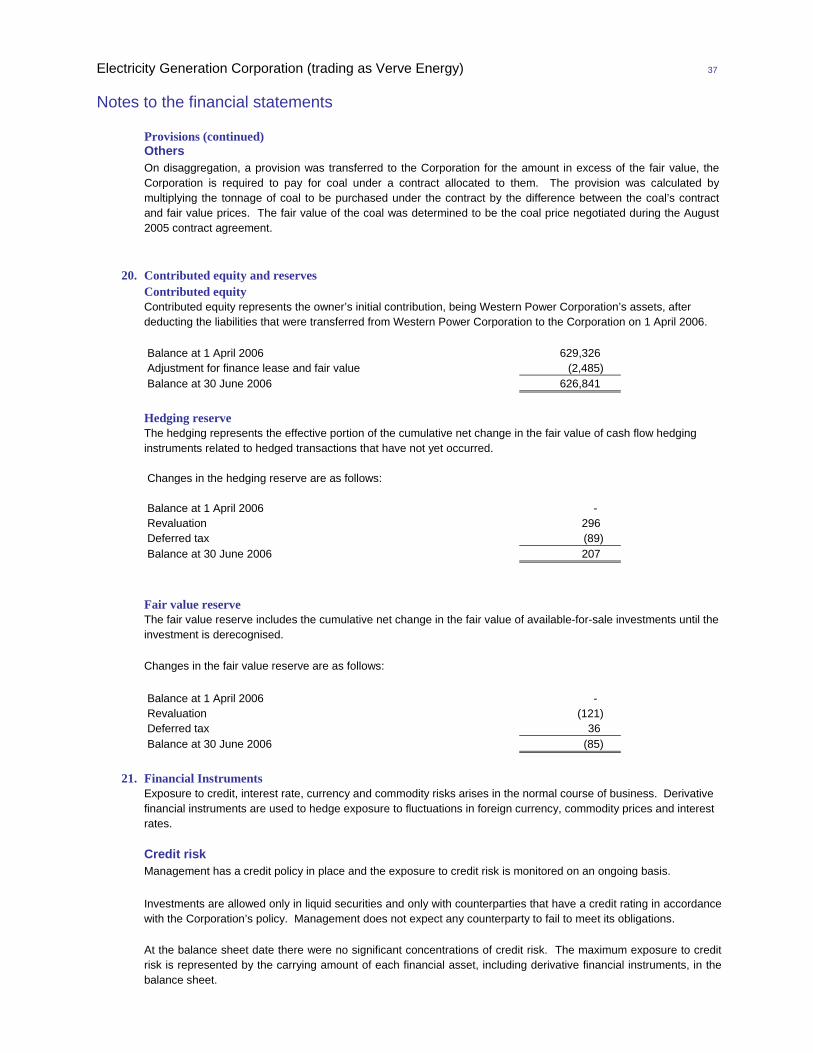
Electricity Generation Corporation (trading as Verve Energy) 37
Notes to the financial statements
Provisions (continued) Others On disaggregation, a provision was transferred to the Corporation for the amount in excess of the fair value, the
Corporation is required to pay for coal under a contract allocated to them. The provision was calculated by multiplying the tonnage of coal to be purchased under the contract by the difference between the coal’s contract and fair value prices. The fair value of the coal was determined to be the coal price negotiated during the August 2005 contract agreement.
20. Contributed equity and reserves
Contributed equity Contributed equity represents the owner’s initial contribution, being Western Power Corporation’s assets, after
deducting the liabilities that were transferred from Western Power Corporation to the Corporation on 1 April 2006.
Balance at 1 April 2006 629,326 Adjustment for finance lease and fair value (2,485) Balance at 30 June 2006 626,841
Hedging reserve The hedging represents the effective portion of the cumulative net change in the fair value of cash flow hedging
instruments related to hedged transactions that have not yet occurred. Changes in the hedging reserve are as follows: Balance at 1 April 2006 - Revaluation 296 Deferred tax (89) Balance at 30 June 2006 207
Fair value reserve The fair value reserve includes the cumulative net change in the fair value of available-for-sale investments until the
investment is derecognised. Changes in the fair value reserve are as follows:
Balance at 1 April 2006 - Revaluation (121) Deferred tax 36 Balance at 30 June 2006 (85)
21. Financial Instruments
Exposure to credit, interest rate, currency and commodity risks arises in the normal course of business. Derivative financial instruments are used to hedge exposure to fluctuations in foreign currency, commodity prices and interest rates.
Credit risk Management has a credit policy in place and the exposure to credit risk is monitored on an ongoing basis. Investments are allowed only in liquid securities and only with counterparties that have a credit rating in accordance
with the Corporation’s policy. Management does not expect any counterparty to fail to meet its obligations. At the balance sheet date there were no significant concentrations of credit risk. The maximum exposure to credit
risk is represented by the carrying amount of each financial asset, including derivative financial instruments, in the balance sheet.

Electricity Generation Corporation (trading as Verve Energy) 38
Notes to the financial statements
Financial Instruments (continued) Interest rate risk Hedging The Corporation adopts a policy of ensuring that 100% of its exposure to changes in interest rates on borrowings is
on a fixed rate basis. Interest rate swaps, dominated in Australian dollars, have been entered into to achieve an appropriate exposure. The swaps that will mature in three years (see the following table) have a fixed rate of 5.56% and as at 30 June 2006, a notional contract amount of $43,100,000.
The change in fair value of the interest rate swap is recognised in the income statement. The net fair value of swaps at 30 June 2006 was approximately $579,396 comprising assets of $6,425,265 and
liabilities of $5,845,869. Effective interest rates and repricing analysis In respect of income-earning financial assets and interest-bearing financial liabilities, the following table indicates
their effective interest rates at the balance sheet date and the periods in which they reprice.
Note
Weighted average interest
rate
Total $’000
6 months or less
$’000
6-12
months $’000
1+
years $’000
Debt securities held-to-maturity* 17 6.03% (741,956) (169,221) (58,042) (514,693) Cash 6 5.25% 3,830 3,830 - - Cash investments 6 5.65% 6,500 6,500 - - Deposits held as security 7 5.79% 1,950 1,950 - - Interest rate swap 9 6.09% 579 - - 579 Finance lease* 17 11.41% 242,735 355 437 241,943
Total (486,362) (156,586) (57,605) (272,171)
*These assets/liabilities bear interest at fixed rates.
Foreign currency risk
The Corporation is exposed to foreign currency risk on purchases that are denominated in a currency other than the Australian dollar. The currencies giving rise to this risk are primarily Japanese Yen, Euro, US Dollar, Pound Sterling and the Swiss Franc.
The Corporation hedges its foreign currency exposure in respect of purchases. The Corporation uses forward
exchange contracts to hedge its foreign currency risk. Most of the forward exchange contracts have maturities of less than one year after the balance sheet date. Where necessary, the forward exchange contracts are rolled over at maturity.
Forecasted transactions The Corporation classifies its forward exchange contracts hedging forecasted transactions as cash flow hedges and
states them at fair value. The net fair value of forward exchange contracts used as hedges of forecasted transactions at 30 June 2006
was a deficit of $323,400, comprising assets of $600,100 and liabilities of $923,500 that were recognised in fair value derivatives.
Commodity price risk The Corporation is exposed to commodity price risk on purchases. The Corporation hedges its commodity price exposure in respect of purchases. The Corporation uses commodity
swaps to hedge its price risk. Most of the commodity swap contracts have maturities of less than six months after the balance sheet date.

Electricity Generation Corporation (trading as Verve Energy) 39
Notes to the financial statements
Financial Instruments (continued) Forecasted transactions The Corporation classifies its commodity swap contracts as cash flow hedges and states them at fair value. The
portion of the gain or loss on the swap that is determined to be ineffective is recognised in the income statement. The net fair value of commodity swap contracts used as hedges of forecasted transactions at 30 June 2006
was an asset of $252,000 that was recognised in fair value derivatives. Where commodity swaps are not classified as cash flow hedges, the fair value of the commodity swap is recognised in the income statement.
Sensitivity analysis In managing interest rate, commodity and currency risks the Corporation aims to reduce the impact of short-term
fluctuations on the Corporation’s earnings. Over the longer-term, however, permanent changes in foreign exchange, commodity and interest rates would have an impact on earnings.
At 30 June 2006, it is estimated that a general increase of 1% in interest rates would decrease the result before
tax by approximately $1,750,000. Interest rate swaps have been included in this calculation. It is estimated that a general increase of 1% in the value of the Australian dollar against other foreign currencies
would have decreased the result before tax by approximately $33,000 for the financial period ended 30 June 2006. The forward exchange contracts have been included in this calculation.
It is estimated that a general increase of 1% in oil price would have decreased the profit before tax by
approximately $36,000 for the financial period ended 30 June 2006. The commodities swap have been included in this calculation.
Estimation of fair values Other than disclosed below, the carrying values of the financial assets and liabilities approximate the fair values as
at 30 June 2006: Carrying
amount Fair value amount
$’000 $’000 Interest-bearing loans and borrowings 741,956 750,587
Securities Fair value is based on quoted market interest rates as at the balance sheet date without any deduction for
transaction costs.
Derivatives Forward exchange contracts are either marked to market using quoted market prices or by discounting the
contractual forward price and deducting the current spot rate. For interest rate swaps, broker quotes are used. Those quotes are back tested using pricing models or discounted cash flow techniques.
Where discounted cash flow techniques are used, estimated future cash flows are based on management’s best
estimates and the discount rate is a market related rate for a similar instrument at the balance sheet date. Where other pricing models are used, inputs are based on market related data at the balance sheet date.
Finance lease liabilities The fair value is estimated as the present value of future cash flows, discounted at market interest rates for
homogeneous lease agreements. The estimated fair values reflect change in interest rates. Trade and other receivables / payables For receivables / payables with a remaining life of less than one year, the notional amount is deemed to reflect the
fair value.

Electricity Generation Corporation (trading as Verve Energy) 40
Notes to the financial statements
Financial instruments (continued)
Interest rates used for determining fair value Other than the rates used by the actuarial assumptions rate as disclosed in Note 18, the Corporation uses the
government bond rate of 5.39% to determine the fair value of decommission cost during the financial period. Interest-bearing loans and borrowings Fair value is calculated based on discounted expected future principal and interest cash flows.
22. Operating leases Leases as lessee Non-cancellable operating lease rentals are payable as follows: 2006 $’000 Less than one year 17,753 Between one and five years 77,443 More than five years 456 95,652
23. Capital and other commitments
2006 $’000 Contracted but not provided for and payable: Within one year 56,450 Between one and five years 19,650 More than five years - 76,100
24. Contingencies On disaggregation, Western Power Corporation contingent assets and liabilities were allocated to the corporation
as follows. The Directors are of the opinion that provisions are not required in respect of these matters, as it is not probable that a future sacrifice of economic benefits will be required or the amount is not capable of reliable measurement.
2006 $’000 Contingent liabilities not considered remote Litigation Pacific Western Pty Ltd has lodged a claim for in excess of
$2,700,000 against the Corporation for work completed under the operation and maintenance agreement for Collie Power Station. The Corporation has counter claimed against Pacific Western Pty Ltd. The amount claimed by the Corporation is included in contingent assets below
In excess of $2,700
A former Chief Executive of Western Power Corporation, Dr WS van
der Mye is seeking an employment termination payment of $500,000 and unquantified amounts for breach of contract, interest and legal costs against the Corporation. The allegation is denied and the action is being defended. 500
Contingent assets Litigation The Corporation has made a claim against Pacific Western Pty Ltd for
in excess of $6,000,000 being the amount of loss or damage directly attributable to the early termination. 6,000

Electricity Generation Corporation (trading as Verve Energy) 41
Notes to the financial statements
25. Subsidiary
Western Carbon Pty Ltd was incorporated in Australia in July 2002 and has been dormant since that date.
26. Reconciliation of cash flows from operating activities 2006 $’000 Cash flows from operating activities Loss for the period (11,919) Adjustments for: Depreciation and amortisation 30,775 Impairment losses 121 Unwinding discount 1,900 Operating profit before changes in working capital
and provisions (Increase) in trade and other receivables (96,661) (Increase) in inventories (3,410) Decrease in other current assets 2,092 Increase in trade and other payables 54,991 (Decrease) in provisions and others (3,424) Net cash from operating activities (25,535)
27. Directors’ and executive remuneration disclosures The following were non-executive Directors and Executives of the Corporation any time during the reporting
period: Non-executive Directors Executives Mr Peter James West (Chairperson)
Mr Harvey Russell Collins (Deputy Chair) Mark Hands Ken Bowron
Mr Leonard Francis Gill Barrie Brandt Mr John Joseph O’Connor
Ms Martine Daniele Pop Greg Denton Derek Noakes
Executive Director Mr John Edward Lillywhite (Chief Executive) 2006 $’000 Short term employee benefits 425,411 Post employment benefits 71,837 497,248
Apart from the details disclosed in the Directors’ report para 4.4.2 no Directors or Executives have entered into a
material contract with the Corporation since the end of the financial period.
28. Subsequent events There has not arisen in the interval between the end of the financial year and the date of this report any item,
transaction or event of a material and unusual nature likely, in the opinion of the Directors of the Corporation, to affect significantly the operations of the Corporation, the results of those operations, or the state of affairs of the Corporation, in future financial years.
29. Segment Reporting The Corporation operates in only one business and geographical segment being the generation and supply of
electricity in Western Australia.

Electricity Generation Corporation (trading as Verve Energy) 42
Notes to the financial statements
30. Distribution to Owner (Disaggregation)
(1) Transfer Order In September 2005, legislation was passed in Parliament to allow for the disaggregation of the Western Power
Corporation into four separate state owned entities. These entities were created under the Electricity Corporations Act 2005 and established on 1 April 2006. The entities are:
• The Electricity Generation Corporation (Verve Energy); • The Electricity Networks Corporation (Western Power Networks); • The Regional Power Corporation (Horizon Power); and • The Electricity Retail Corporation (Synergy Energy). On disaggregation, the assets, rights and liabilities of the Western Power Corporation were distributed to the
Minister. The Minister, under a Transfer Order prepared under section 147(1) of the Electricity Corporations Act 2005 (Gazetted on 31 March 2006), specified the subsequent allocation of these assets, rights and liabilities among the four separate owned entities.
The Transfer Order designated the allocation described above as a contribution by the owner of the Western
Power Corporation for the four separate state owned entities and that the contribution formed part of the entities contributed equity. The transfer of the opening balances of assets and liabilities from Western Power Corporation to the four successor entities has been reported in the Western Power Corporation financial statements as at 30 June 2006. The Western Power Corporation financial statements include a reconciliation of the Western Power Corporation 31 March 2006 closing balances to the opening balances allocated to the four successor entities on 1 April 2006.
Further, the Transfer Order specified that the values of the assets, rights and liabilities of the Western Power
Corporation vested in the Corporation and Synergy Energy be at those values determined as their fair values. As the final details of the assets and liabilities to be transferred to the Corporation pursuant to the Transfer Order
were only provided on 18 September 2006, there has only been limited time to review the appropriateness of the fair values and the adequacy of the supporting information thereto. Notwithstanding that the information provided at the date of transfer is considered reasonable, analysis is continuing and when complete, may potentially give rise to adjustments as at 1 April 2006.
(2) Taxation Treatment The Western Power Corporation, and the four separate state owned entities are subject to the NTER
administered by the ATO. Under agreement with the ATO, the disaggregation of the Western Power Corporation was completed on a tax neutral basis. Hence there was no NTER tax consequences for the Western Power Corporation. The four separate state owned entities inherited the tax attributes of the Western Power Corporation in relation to the assets, rights and liabilities allocated to them on disaggregation.
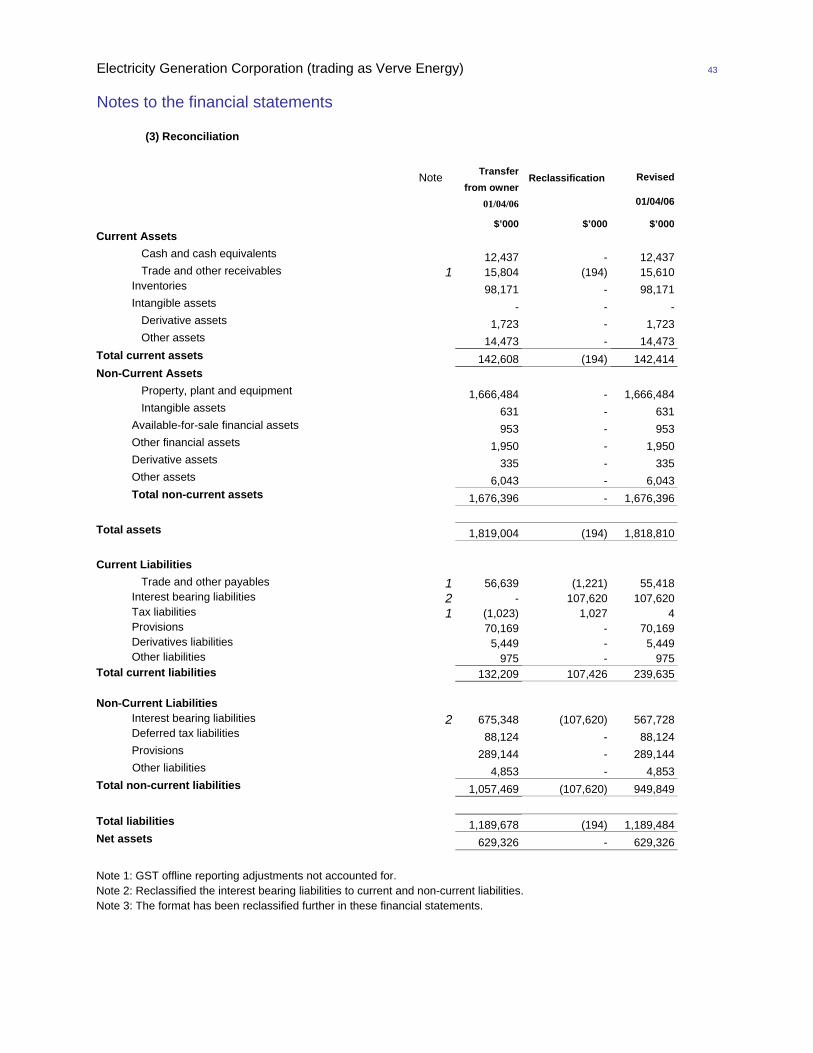
Electricity Generation Corporation (trading as Verve Energy) 43
Notes to the financial statements
(3) Reconciliation
Note Transfer
from owner Reclassification Revised
01/04/06 01/04/06
$’000 $’000 $’000Current Assets Cash and cash equivalents 12,437 - 12,437 Trade and other receivables 1 15,804 (194) 15,610
Inventories 98,171 - 98,171Intangible assets - - -
Derivative assets 1,723 - 1,723 Other assets 14,473 - 14,473Total current assets 142,608 (194) 142,414Non-Current Assets Property, plant and equipment 1,666,484 - 1,666,484 Intangible assets 631 - 631
Available-for-sale financial assets 953 - 953Other financial assets 1,950 - 1,950Derivative assets 335 - 335Other assets 6,043 - 6,043Total non-current assets 1,676,396 - 1,676,396
Total assets 1,819,004 (194) 1,818,810 Current Liabilities Trade and other payables 1 56,639 (1,221) 55,418
Interest bearing liabilities 2 - 107,620 107,620Tax liabilities 1 (1,023) 1,027 4Provisions 70,169 - 70,169Derivatives liabilities 5,449 - 5,449Other liabilities 975 - 975
Total current liabilities 132,209 107,426 239,635 Non-Current Liabilities
Interest bearing liabilities 2 675,348 (107,620) 567,728Deferred tax liabilities 88,124 - 88,124
Provisions 289,144 - 289,144Other liabilities 4,853 - 4,853
Total non-current liabilities 1,057,469 (107,620) 949,849 Total liabilities 1,189,678 (194) 1,189,484Net assets 629,326 - 629,326 Note 1: GST offline reporting adjustments not accounted for. Note 2: Reclassified the interest bearing liabilities to current and non-current liabilities. Note 3: The format has been reclassified further in these financial statements.
Directors’ declaration
1 In the opinion of the Directors of Electricity Generation Corporation Trading as Verve Energy (‘the Corporation’):
(a) the financial statements and notes are in accordance with the Electricity Corporations Act 2005,
including:
(i) giving a true and fair view of the financial position of the Corporation as at 30 June 2006 and of their performance, as represented by the results of their operations and their cash flows, for the financial period ended on that date; and
(ii) complying with Australian Accounting Standards and the Electricity Corporations Act 2005;
and
(b) the remuneration disclosures that are contained in sections 4.2.2 of the Remuneration report in the Directors’ report comply with the Electricity Corporations Act 2005.
(c) there are reasonable grounds to believe that the Corporation will be able to pay its debts as and
when they become due and payable. 2 The Directors have been given the declarations by the Chief Executive and Chief Financial Officer for
the financial period ended 30 June 2006 pursuant to the Electricity Corporations Act 2005.
Dated at Perth 20 day of September 2006.
Signed in accordance with a resolution of the Directors:
Chairman
Electricity Generation Corporation (trading as Verve Energy) ABN 586 738 30106

AUDITOR GENERAL
4th Floor Dumas House 2 Havelock Street West Perth 6005 Western Australia Tel: 08 9222 7500 Fax: 08 9322 5664
INDEPENDENT AUDIT REPORT ON ELECTRICITY GENERATION CORPORATION (TRADING AS VERVE ENERGY) To the Parliament of Western Australia Audit Opinion In my opinion, the financial report of the Electricity Generation Corporation (trading as Verve Energy) is in accordance with: (a) schedule 3 of the Electricity Corporations Act 2005, including: (i) giving a true and fair view of the Corporation’s financial position at
30 June 2006 and of its performance for the financial year ended on that date; and
(ii) complying with Accounting Standards in Australia; and (b) other mandatory professional reporting requirements in Australia. Scope The Board of Directors is responsible for the financial report. The financial report consists of the Income Statement, Statement of Changes in Equity, Balance Sheet, Statement of Cash Flow, accompanying Notes and Directors’ Declaration. Summary of my Role As required by the Electricity Corporations Act 2005, I have independently audited the financial report to express an opinion on it. This was done by testing selected samples of the evidence. Further information on my audit approach is provided in my audit practice statement. Refer "http://www.audit.wa.gov.au/pubs/Audit-Practice-Statement.pdf". An audit does not guarantee that every amount and disclosure in the financial report is error free, nor does it examine all evidence and every transaction. However, my audit procedures should identify errors or omissions significant enough to adversely affect the decisions of users of the financial report.
D D R PEARSON AUDITOR GENERAL 26 September 2006