Vertical Foreclosure in the U.S. Cable Television Market ...
49
1 Vertical Foreclosure in the U.S. Cable Television Market: An Empirical Study of Program Network Carriage and Positioning Dong Chen School of Economics Peking University Beijing, China 100871 [email protected] David Waterman Department of Telecommunications Indiana University 1229 E. 7 th St. Bloomington, IN 47405 [email protected] October, 2005 We thank the Kelley School of Business at Indiana University, Bloomington, for their support of this study.
Transcript of Vertical Foreclosure in the U.S. Cable Television Market ...
1
Vertical Foreclosure in the U.S. Cable Television Market: An Empirical Study of Program Network Carriage and Positioning
Dong Chen School of Economics
Peking University Beijing, China 100871 [email protected]
David Waterman
Department of Telecommunications Indiana University
1229 E. 7th St. Bloomington, IN 47405 [email protected]
October, 2005
We thank the Kelley School of Business at Indiana University, Bloomington, for their support of this study.

2
Abstract
We provide new evidence of vertical foreclosure in the U.S. cable television market,
primarily using a 2004 database of 680 cable systems. Focusing on four program network
groups (basic outdoor entertainment, basic cartoon, basic movie, and premium movie),
we find that more frequent carriage of affiliated networks and less frequent carriage of
rival networks, a pattern identified by previous empirical studies, persists in spite of
extensive channel capacity expansion and digitization of cable systems, as well as new
competition from DBS—developments that might be expected to reduce or eliminate
vertical foreclosure effects. We also find a new form of vertical foreclosure in the digital
environment: integrated cable operators that do carry rival networks are more likely to
position them on higher priced digital tiers, or in other ways that appear to limit demand
for them.
JEL Classification: L22, L82
Key Words: vertical integration, foreclosure, cable television

3
1 Introduction
We define “vertical foreclosure” to mean that a vertically integrated firm with
monopoly power in a downstream market limits or denies access of its rivals’ inputs to
that market. The cable television industry provides rich opportunities to study vertical
foreclosure empirically. Apparently due to large fixed costs associated with laying
physical cable networks, cable system operators are typically local monopolists in a given
geographic area, creating a bottleneck that gives rise to the potential threat of
foreclosure.1 Among hundreds of basic and premium cable networks now in business, a
number are vertical integrated with cable operators and many others are not, allowing
comparisons between the product selection and marketing behaviors of systems across
local markets.
As we detail further, previous empirical studies of the effects of vertical integration
in cable television have established vertical foreclosure as we define it to exist, both for
certain premium and for certain basic networks (Waterman & Weiss, 1996; Chipty, 2001).
In particular, these authors found that integrated cable operators have tended to carry
their affiliated networks relatively more frequently, and rival networks less frequently,
and that the total number of cable networks varies with ownership. Those studies,
however, relied on data from the late 1980s or early 1990s, before competition from DBS
and massive expansions of cable system channel capacity due to digital 1 Before 1992, incumbent cable operators were typically awarded monopoly status by the local governments through exclusive franchises. The 1992 Cable Television Consumer Protection and Competition Act removed such restrictions and allowed potential entry. However, as of 2003, new entrants to the cable programming distribution business (called “overbuilds”) are present in only 2.6% of US cable franchise areas (Federal Communications Commission, 2004, paragraph 126).

4
technology--forces that might be expected to alleviate foreclosure. Also, the extent to
which earlier studies were able to measure “discriminatory” marketing practices affecting
the integrated and non-integrated networks that a system does choose to carry was very
limited.
In this paper, we examine the existence and the extent of vertical foreclosure in the
U. S. cable television industry, using cross-sectional data involving 680 cable systems in
the early to mid-2000s, focusing on four distinct groups of cable networks having similar
programming content. In brief summary, we find that foreclosure in cable television is a
persistent phenomenon, as indicated both by rates of network carriage, and by the
positioning of networks on analog vs. digital program tiers.
In the next section, we discuss foreclosure, summarize previous literature on this
topic, and elaborate motivation for the present study. In Section III and IV, we describe
our empirical method and discuss our hypotheses. Section V contains a description of the
data and some descriptive statistics. The empirical models and the estimation results
concerning cable operators’ program carriage and position patterns are presented in
Section VI, followed by concluding remarks in Section VII.
II Background and Previous Studies
The cable television industry can be divided into three successive stages: program
producers, program service providers (or “networks”), and cable operators. The producers
create the video programming products and sell them to the networks, who act in turn as
wholesalers in this industry. (Production and networking are heavily integrated.)

5
Networks arrange, package, and market the programs and offer them to cable operators,
who act as retailers by signing up subscribers. Subscribers purchase programming as
parts of various packages (e.g., “basic” or “expanded basic” service, or various digital
tiers), or a la carte, by buying individual subscription networks or pay-per-view programs
from the operators.
Most of the over 11,000 local cable systems in the U.S. are owned by Multiple Cable
System Operators, or MSOs, which engage in master affiliation agreements with cable
network providers. Among other terms, those contracts typically specify per-subscriber
fees to be paid to the networks carried by the MSO’s systems. In a number of cases, a
certain network may be carried by all the systems of an MSO, but especially with less
established networks, only some of them carry a given network.
Vertical affiliations via equity ownership between cable operators and cable networks
are significant. As of 2003, 33% of the 339 national cable programming networks that
serve as potential inputs to local systems were vertically affiliated with one or more
MSOs.2 In recent years, horizontal and vertical ownership has become increasingly
concentrated. The largest MSO in 2003, Comcast, served 22.7% of all U.S. cable
subscribers, and had ownership interests in 41 programming networks, including, for
example, Outdoor Life Network and E! Entertainment.3 The second largest MSO, Time
Warner, owned systems serving 11.6% of the national market, and had ownership interest
2 Federal Communications Commission (2004), paragraph 141. 3 The number of networks in which Comcast has ownership interest was obtained by counting iN Demand's 35 multiplexed channels separately. Federal Communications Commission (2004), paragraph 143.

6
in 62 national programming networks, including CNN and Home Box Office (HBO).
How might vertical integration in this market environment lead to market
foreclosure? Underlying theories specific to the cable market is a long tradition of
economic research on vertical integration. Spengler (1950), Machlup and Taber (1960),
Bork (1978), Williamson (1971) and Klein, Crawford, and Alchian (1978) focus on
efficiency motives involving elimination of double marginalization or reduction of
transactions costs. Blair and Kaserman (1978), Vernon and Graham (1971), and
Schmalensee (1973), offer models in which efficiency motives for integration may lead to
foreclosure of non-integrated downstream firms, but they find ambiguous welfare effects.
Several more recent papers, especially Salinger (1988), Hart and Tirole (1990), Ordover,
Saloner and Salop (1990), and Bolton and Whinston (1993), employ a game-theoretic
approach to demonstrate circumstances under which anti-competitive or other strategic
behavior may lead to foreclosure and a decline in social welfare. For surveys of the
vertical integration literature involving foreclosure, see Katz (1989) and Snyder (1995).
In the cable television industry, vertical foreclosure might occur either for
anti-competitive or for benign, efficiency-based reasons. An anti-competitive theory that
has raised interest among economists and policymakers hinges on the fact that the
distribution of video programming network inputs is characterized by significantly
increasing returns to scale.4 A large portion of the total cost of producing and distributing
cable networks consists of the initial production cost, or the “first-copy” cost. In
4 Owen and Wildman (1992) discuss economies of scale in cable networking.

7
comparison, the cost of distributing this video programming via satellite is negligible.
Therefore, the size of the national audience that a certain video program is able to reach
(and thus can collect revenue from) is crucial to determining its average cost per
subscriber. This condition provides a potential incentive for a vertically integrated cable
operator having a significant share of the national cable market to raise an upstream
network rival’s costs per subscriber by excluding that network from its program menu.
Furthermore, for an advertisement-supported basic cable network, cost-per-thousand
ad rates are an increasing function of the network’s national audience reach, possibly
because advertisers regard geographic gaps in the national audience coverage of a given
network to be a serious disadvantage.5 In this case, foreclosure may not only increase
programming costs per subscriber, but disproportionately reduce the network’s
advertising revenues. In turn, the rival network will be disadvantaged in its ability to offer
a competitive quality of programming, and may be induced to exit the market altogether.
Of course, such foreclosure is not without short term costs. Excluding programming
networks for strategic reasons necessarily means that the cable operator gives up
potentially profitable retailing opportunities. Which effect actually dominates in the
integrated cable operator’s decision making process remains an empirical question.
Vertical foreclosure in cable television does not necessarily imply an
anti-competitive motive. If two programming networks are close substitutes, for example,
5 Waterman and Yan (1999) offer empirical evidence that limited national coverage negatively affects cost-per thousand advertising rates charged by basic cable networks. Chipty and Snyder (1999) argue that the convex relationship between national coverage of networks and advertising rates is evidence that MSOs have limited market power in the programming market.

8
then carrying one of them will necessarily reduce subscriber demand for the other. Cable
operators face capacity constraints just as grocers face shelf space costs for carrying
another cereal brand. If vertical integration of a cable operator with premium network A
reduces its effective wholesale input price for efficiency reasons (due to elimination of
double marginalization, for example), the operator has an incentive to reduce A’s
subscription price, which in turn reduces demand for a rival premium network, B. The
end result may be the exclusion of B from the operator’s menu because demand becomes
insufficient to cover B’s marginal carriage costs. Cable operators always face more
program carriage opportunities than they can accommodate, so it is inevitable that
programming menus will be affected by vertical integration if that integration makes
certain networks effectively cheaper to carry.
However, even if foreclosure is benign in its intent, thus raising no antitrust concerns,
its results may still be undesirable due to non-economic considerations. Exclusion of rival
networks reduces the amount and the variety of information that is available to the public.
Such a reduction in the diversity of opinions (e.g., in the case of cable news networks)
can in itself be a concern from a broader social point of view, as evidenced by a history of
federal legislation, FCC rulings and other constraints on media firms.6
6 See in particular, “In the Matter of Time Warner, Inc., Turner Broadcasting Systems, Inc, Telecommunications, Inc, and Liberty Media Corporation, United States of America, Before the Federal Trade Commission, Agreement Containing Consent Order, File No. 961-0004 (September 12, 1996). The FTC Ruling required Time Warner to carry at least one basic cable news service in addition to CNN as a condition of the Time Warner-Turner merger. As directed by the 1992 Cable Act, the FCC also promulgated rules in 1993 that limit the proportion of a cable system’s channel capacity that can be occupied by programming services in which the operator has a financial interest to 40% for systems with a capacity of fewer than 75% channels, but these rules have had little if any practical effect. (In the Matter of Implementation of Sections 12 and 19 of the Cable Television and Consumer Protection Act of 1992: Development of Competition and Diversity in Video Programming Distribution and Carriage, Second Rep. & Order, MM Dkt. No. 92-265 (1993) par 41.)

9
In either the anti-competitive or the efficiency foreclosure scenario, it is important to
emphasize that a necessary condition for damage to program diversity beyond the local
level depends critically on the national market share of the foreclosing MSO. If that share
is insufficiently large, the effects on rivals’ cost would be insufficient for an
anti-competitive foreclosure strategy to be viable--or in the efficiency motivation case,
for diversity to be effectively influenced at the national level.7
Previous empirical studies of the cable television market have found evidence that is
consistent with a theory of vertical foreclosure. Using 1989 data, Waterman and Weiss
(1996) found that cable operators’ likelihood of carrying the four main rival premium
networks of the time (HBO, Cinemax, Showtime and The Movie Channel) was
significantly higher than average if the operator was vertically affiliated with the network,
and significantly lower if the network were an unaffiliated rival. The authors also found
that given the decision to carry a rival network, integrated cable operators tended to favor
their affiliated networks in pricing and marketing activities, as inferred by subscribership
penetration rates. At the aggregate level, the authors found that operators integrated with
some of the premium networks tended to carry significantly fewer premium networks in
total. Waterman and Weiss (1997) supplemented this study with econometric evidence
that operators vertically affiliated with seven basic cable networks carried those networks
more frequently than unaffiliated cable operators in nearly all cases.
7 Waterman and Weiss (1997) elaborate this reasoning. Chipty (1995) as well as Ford and Jackson (1997) report empirical evidence that larger MSOs pay lower prices for programming. Raskovich (2003) and Chipty and Snyder (1999) argue that large MSO size may not contribute to greater bargaining power in any case.

10
Chipty (2001) conducted a study of vertical foreclosure in cable using 1991 data. At
the individual network level, she found that cable operators vertically integrated with the
TV shopping service, QVC, were less likely to carry the competing independent service,
HSN. In addition, she found that Time Warner and Viacom, both MSO owners of
premium networks at the time, were less likely to carry the basic movie service,
American Movie Classics (AMC). At the aggregate level, Chipty found that vertical
integration with basic cable networks lead cable operators to offer a greater number of
basic services, while integration with premium services resulted in fewer than average
networks carried. While Waterman and Weiss did not distinguish between efficiency and
anti-competitive strategic motives for carriage pattern differences, Chipty found
empirical evidence that consumer welfare increased as a result of the vertical integration.
Another empirical study of the industry published by Ford and Jackson (1997) reported
that vertical integration between cable operators and networks, as well as horizontal
concentration of MSOs, lowered programming costs.
The results of these previous studies suggest that vertical foreclosure may be present
in the U.S. cable television industry, but they were based on data from more than a
decade ago. In 1994 (three years after the period examined by the last major economic
study), the average cable system was able to provide 37 analog video channels.8 By 2004,
the average number of analog channels had increased to 70 and the average number of
8 Authors’ calculation based on Table 3 in Federal Communications Commission (1994).
11
digital channels was about 120.9 Some of the capacity increase has followed from more
efficient hardware such as fiber optic cables. The digital component of the increase has
been largely due to the extensive diffusion of digital compression technology since the
mid-1990s. That technology, in combination with various hardware components,
generally allows 12 or more digital channels of comparable video quality to be offered in
place of one analog channel. As a result, most operators now offer “digital tiers” of 30 to
over 100 additional channels that include certain basic and premium subscription
networks and pay-per-view or video-on-demand program channels. Prior to 1997, no
cable operator in the U.S. offered digital video service, while as of June 2003, digital
cable services were available to about 90% of all cable subscribers.10
Contemporaneous with these changes has been a large increase in the number of
competing cable networks. According to the FCC, the number of cable networks in
business increased from 106 in 1994 to 339 in 2003.11
With these great increases in channel capacity and network competition, it is
interesting to examine whether the observed foreclosure patterns found in earlier studies
still persist. First, a reduction of channel carriage opportunity costs is implied by the
expansion of average system capacity. Secondly, increased audience fragmentation due to
more competing networks implies that audience substitution effects, and thus the
incentive of operators to exclude “rival” networks (for either efficiency or
9 Federal Communications Commission (2004), paragraph 25. 10 Federal Communications Commission (2004), paragraph 41. Although digital services are widely available, only 31.26% of the basic cable subscribers, or about 20.6 million, actually subscribed to digital services as of June 2003. 11 Federal Communications Commission (2004), Table 8.

12
anticompetitive motives), should diminish.
Another change affecting the cable industry is the competition from direct broadcast
satellite (DBS), a nationally distributed multi-channel service offering a menu that
includes most of the same basic and premium networks. Although relatively marginal
“home satellite dish” (HSD) systems existed in 1990, its U.S. household penetration
never exceeded about 3.5%.12 “True” DBS began with the 1994 launch of DirecTV. By
2003, DBS penetration reached 21.6%.13 In general, competition should mitigate vertical
foreclosure by increasing the marginal incentive of cable operators to offer a
programming menu of maximum appeal to subscribers or by decreasing the marginal
effectiveness of a strategic foreclosure strategy.14
Finally, the emergence of digital cable service introduces a more subtle issue in
cable operators’ program carriage that has not been systematically studied in previous
research. Besides the choice of whether to include a particular programming network on
its menu, a cable operator decides whether to offer it on an analog or digital tier. Much
like magazines, basic cable networks earn revenues from advertising (for the average
basic network, about two thirds of its total revenue) and per-subscriber fees charged to
cable operators. In general, these networks regard carriage on a basic analog tier to be
more desirable, in order to maximize audience exposure for their advertisers. Digital tiers
are typically offered to subscribers for an extra monthly charge, and thus have much
12 Federal Communications Commission (2004), paragraph 9. 13 Federal Communications Commission (2004), paragraph 16. 14 See Goolsbee and Petrin (2004) for an empirical analysis of the effects of DBS competition on cable television.

13
lower audience exposure. As of June 2003, only about 20.6 million of the 65.9 million
cable subscribers in the US, or about 31%, actually received any digital tier
programming.15 Tier positioning is an important source of friction in basic
network/operator negotiations, suggesting that vertical ownership may lead to a greater
tendency for an integrated basic network to be carried on an analog tier, and a rival
network on a digital tier.16
For subscription, or “pay” networks that do not offer advertising, carriage on an
analog tier increases the potential subscribership because consumers do not need to buy
the digital tier to get the network.17 Placement of an attractive service on a digital tier can
be in the interest of a cable system since it increases the value of subscribing to the digital
tier. Other things equal, however, the marginal efficiency advantage to a cable operator of
placing a premium network on an analog instead of a digital tier is likely to be higher if
the operator owns the network. This is because the operator earns net revenue from each
sale of the network in addition to the revenue from digital tier sales. Such a strategy is
also consistent with an anticompetitive model since placement of a rival’s network on a
digital tier can disadvantage the rival by limiting demand for it.
Placing a rival network on a digital tier can also be seen as an indirect method for
15 This proportion is obtained by dividing the number of digital cable subscribers (20.6 million) by the number of basic cable subscribers (65.9 million). See Table 1 and paragraph 41 of Federal Communications Commission (2004). 16 See, for example, Cable Program Investor (Kagan World Media), October 22, 2004, p. 1. 17 The 1992 Cable Act prohibit cable TV operators from requiring purchase of any programming tier other than the basic tier for access to any programming service offered on an a la carte or pay-per-view basis. This limits the strategic options of cable operators to position premium networks only on a digital tier, but that strategy can typically be accomplished by offering those networks only as part of a package of digital programming having one price for the package. See FCC, Consumer Options for Selecting Cable Channels and the Tier Buy-through prohibition, Information Sheet, February, 2003.

14
charging a higher retail price to consumers for the rival network that is more desirable
from a marketing perspective. Although an operator’s optimal strategy of pricing an
integrated network and a similar rival that are offered side-by-side on the same tier is not
clear, it is reasonable that the operator might desire to charge a higher price for the rival
because the perceived wholesale price of the integrated network is lower.18 Such a
side-by-side price differential, however, might send an undesirable negative quality signal
to consumers about the lower priced, integrated network. Effectively higher pricing of the
rival through separate tier placement may avoid that negative signal. An analogous
argument applies to a cost raising strategy.
Another program positioning issue involves networks, such as Encore or Sundance
Channel, that are offered by some systems as a basic service, and by others as a premium
service. In that case, an integrated system could find it advantageous to position a rival
network on a basic instead of a premium tier, or vice versa, in order to increase demand
for a similar affiliated network, or in order to raise costs of the rival. In comparison to the
analog vs. digital case, it is less evident what the specifics of such a basic vs. premium
tier strategy would be. We also point out that all programmers are able to influence the
positioning decisions of cable operators by changing their networks’ programming
designs, or by setting differential wholesale pricing, with respect to premium vs. basic
tier carriage, or with respect to digital vs. analog carriage. These mechanisms are quite
18 Salinger (1991) shows that if a downstream monopoly retailer vertically integrates with one of two substitute products, thereby reducing the effective wholesale price of the integrated product, nearly any changes in optimal relative retail prices of the two products are theoretically possible.

15
imperfect, however, rendering the tier positioning of cable networks an important
component of operators’ strategies.
III Selection of Networks for Study
To investigate the extent of possible vertical foreclosure in the cable television
market, we focus on four groups of programming networks: basic outdoor entertainment,
basic cartoon, basic movie, and premium movie. Our first criterion for selecting these
groups was that networks within them belonged to a distinct market segment, within
which the networks could be presumed to be reasonably close substitutes. The second
criterion was that within each group, one or more of the networks was vertically affiliated
with an MSO while at least some other networks in the group were unaffiliated.
The four selected network groups we selected are displayed in Table 1, along with
launch dates of the individual networks. Within the outdoor entertainment segment,
Outdoor Life Network (OLN), owned by Comcast, and the independently owned Outdoor
Channel, are basic networks with advertiser support that have offered generally similar
program menus in fishing, boating and other outdoor sports and activities. Similarly for
the second category, cartoons. The better established Cartoon Network, owned by Time
Warner, has competed head to head with Toon Disney as an advertiser-supported basic
network for a number of years. The third segment, basic movie services, is somewhat
broader, but all four of the services we include specialize in classic or other older
Hollywood films (notably Turner Classic Movies, American Movie Classics, and Fox
Movie Network), or more contemporary but generally out of the mainstream theatrical

16
films (notably Independent Film Channel, IFC). These four networks are entirely or
mainly sold by cable systems as part of basic or expanded basic tiers, although only IFC
and AMC sell advertising.19 Time Warner obtained 100% ownership of TCM through its
merger with Turner Broadcast System (TBS) in 1996. Both AMC and IFC are majority
owned by another MSO, Cablevision, which had a relatively small national market share
(3.1%) in 2003.20 The fourth group, premium (or pay) movie-based networks, is the
largest and arguably most diverse segment. The two longest established rivals, HBO and
Showtime, offer some original series in addition to their main menu of recent Hollywood
features. The others all specialize in relatively recent major films, although Flix,
Sundance, and Encore (sometimes known as “mini-pays”) generally charge lower prices
and have less generally attractive, or less mainstream movies. None of the networks in
this group carry advertising and all are sold as premium subscription networks in most or
at least a large minority of cases.21
The four groups of programming networks which we study is a small subset of all
cable networks in the video programming market. Others are excluded for a variety of
reasons. We do not consider the general-interest cable networks (eg, USA Network, TNT 19 Cable Program Investor (Kagan World Media), March 15, 2004, p. 3. For both networks, advertisement is only a minor source of their revenue. In 2003, 14% of IFC’s total revenue was from advertisement, and advertising was 28% for AMC. 20 Fox Movie Channel is owned by News Corp., which acquired Direct TV in 2004. The data used for our analysis reflect the market condition prior to that merger. 21 Unlike the four oldest premium networks (HBO, Cinemax, Showtime, and The Movie Channel), Starz!, Encore, Flix, and Sundance Channel may sometimes be included in a cable system's basic program package (see next section for more detail). Since these networks are not ad-supported and a significant number of cable systems still treat them as pay services along with the other four, we will follow the convention by calling them premium networks.
Showtime, The Movie Channel, Flix, and Sundance Channel are owned by Viacom Inc., which formerly held cable system assets. However, Viacom divested all its cable systems in 1996. Starz! and Encore are both owned by Liberty Media, which holds cable system assets through its ownership of Cablevision of Puerto Rico. Since our dataset does not include any cable systems in Puerto Rico, Starz! and Encore are non-integrated networks with respect to our study. When offered on analog tiers, premium networks are typically sold a la carte. When offered only on digital tiers, premium networks are often sold as part of a package of similar pay networks.

17
and TBS), because we judged their content to be too diverse. Cable news services
(including CNN, Fox News, and CNBC) are more distinct but had become almost
ubiquitous by 2003. Sports and music networks lacked significant ownership affiliations
with MSOs. Nevertheless, the evidence presented in this paper must be interpreted as
examples of certain type of behaviors by the vertically integrated cable operators rather
than a complete picture of vertical integration of the cable television market.
All four network groups involve vertical integration as of 2004 with one of the two
largest MSOs, Comcast and Time Warner. Although two of the basic movie networks also
were partially owned by Cablevision, a relatively small cable operator having a 3.1%
national share, we did not investigate that MSOs behavior due to inadequate data.22
Together, however, Comcast and Time Warner accounted for the large majority of all
vertical ownership affiliations with cable programming networks in that year.23 We also
investigate carriage and marketing behavior of AT&T cable systems in 2001 with respect
to the basic outdoor channels. OLN was originally launched by AT&T Broadband and
Cox Communications and then Comcast acquired full ownership of this network in
2001.24 In the same year, Comcast merged with AT&T Broadband, a process completed
in 2002. Due to the relatively recent acquisition of OLN by Comcast, we thus conduct a
supplemental statistical analysis of AT&T’s behaviour prior to Comcast’s ownership
22 Our sample of 680 networks contained only four observations for Cablevision systems. See Section IV below. 23 Among the 110 vertically-integrated cable networks in 2003, 62% of them, or 68 networks, were affiliated with either Time Warner or Comcast. (Source: authors’ calculation based on numbers from Federal Communications Commission, 2004, paragraph 143.) Other MSOs that also hold equity interest in at least one cable network include Cablevision, Cox and Liberty Media. 24 In May 2001, Fox Entertainment Group acquired a 50% of the stake of Outdoor Life Network, and then sold it to Comcast in October 2001. The merger between Comcast and AT&T Broadband in the same year eventually made OLN a wholly-owned subsidiary of Comcast.

18
involvement.
We proceed to analyze cable operators’ program carriage decisions at two levels.
First, we examine whether integrated MSOs have a greater likelihood of including their
vertically affiliated networks in their program menus--and of most interest, whether they
are less likely to carry unaffiliated rival networks. Second, conditional on their decisions
to carry a given network, we investigate whether integrated MSOs are more likely to
place an affiliated network on a tier that advantages that network, and are less likely to do
so for an unaffiliated rival. In our positioning analysis, we focus on analog vs. digital tier
placement, but include some study of basic vs. premium tier placement.
IV Data Sources and Description
Our main data source is the Television and Cable Factbook (2004; the Factbook
hereafter) published by Warren Communication News, Inc. The Factbook is an annual
volume that contains detailed information concerning cable operator’s program carriage
information for over 11,000 local cable systems in the United States. In particular, the
Factbook reports what program packages are offered to a cable system’s subscribers (e.g.
analog or digital, basic or premium), what networks are included in each package, and the
number of subscribers the network has. The Factbook also contains information about the
geographic location, MSO ownership, availability of digital service, and certain other
demand or cost-related characteristics of systems that we use in our models below.
Table 2 gives descriptive statistics for the various ownership, demographic and
system-specific explanatory variables that we use in this study. Variables defined as

19
“system” level, such as miles of plant or TV market ranking, are all from the Factbook
and directly describe the specific local system or franchise area. These data are
supplemented by demand or cost-related demographic information from the U.S. Census
Bureau, such as median household income and population density, but at the county level.
(The variables in Table 2 are discussed further below.)
A sample of 680 observations with complete information for the model variables was
first randomly drawn from the 2004 Factbook. For cable systems owned by Comcast and
Time Warner, only those shown to offer digital services were included in the sample. A
shortcoming of the Factbook is that the information contained may not be complete or
fully updated each year. As a result, some cable systems may appear in the Factbook not
to offer digital services when they actually do. For example, the 2004 Factbook indicates
that Comcast’s cable systems serving the Los Angeles areas do not offer a digital basic
package. In fact, as of the end of 2003, over 95% of all Comcast’s cable systems had been
upgraded to allow for two-way digital video and Internet services, which included those
serving Los Angeles.25 Similarly, as of the end of 2003, over 99% of Time Warner’s
cable systems offered digital video services.26 Therefore, any records showing that the
cable systems owned by these two MSOs do not offer digital services are likely to be out
of date and thus were excluded from our sample. To the extent that the availability of
digital services will increase a cable system’s probability of carrying any given
25 Comcast 2003 Annual Report. 26 Time Warner 2003 Annual Report.

20
programming network, this data selection may lead to an overestimation of Comcast and
Time Warner’s likelihood of carrying the networks under examination. Therefore, if any
exclusion is found from the data, the actual magnitude may be even greater. Our results
thus may be biased against findings that rival networks are disadvantaged by non-carriage
or disadvantageous positioning.
As indicated in Table 2, 83% of the cable systems in our sample offered digital video
service to their subscribers. About 20% of the systems were owned by Comcast and 10%
by Time Warner. These proportions reflect the actual national market conditions
reasonably well.27
Table 3 provides a cross tabulation of cable systems’ program carriage information
by MSO for the four network groups. The proportion of Comcast systems that carried
OLN in 2004 is substantially higher, and the proportion that carried Outdoor Channel
substantially lower, than for unaffiliated MSOs. We also include in Table 3 data for
outdoor entertainment network carriage on AT&T systems in 2001. The needed
information on cable systems’ characteristics and their program carriage decisions on
Outdoor Channel and OLN is extracted from the 2001 Factbook for exactly the same
cable systems that are contained in the later sample, according to a unique system
identification number.28 Since the acquisition of OLN by Comcast did not happen until
October 2001 and the merger between Comcast and AT&T Broadband was completed in
27 As of the end of 2003, Comcast and Time Warner respectively served 22.69% and 11.62% of all basic cable subscribers. 28 Nine observations were lost in this matching process due to the fact that some cable systems in operation in 2004 did not exist in 2001.

21
2002, the information contained in the 2001 Factbook reflects market conditions when
AT&T, but not Comcast, was vertically affiliated with OLN.
The 2001 data for the outdoor networks in Table 3 show a similar pattern to that of
Comcast’s carriage in 2004. The proportion of systems owned by AT&T that carried OLN
in 2001 is much higher than that for other cable systems. The difference between AT&T
and the other cable systems in their propensity to carry the rival Outdoor Channel,
however, is not as large as with Comcast in 2004.
For Time Warner, the 2004 network carriage picture is mixed. For both the cartoon
and basic movie segments, Time Warner systems have a greater likelihood of carrying
their affiliated services (Cartoon and TCM, respectively), but also a greater tendency to
carry rivals AMC, Fox, and Toon Disney. Time Warner’s tendency to offer rival IFC is
slightly lower than that of other MSOs. For premium networks, all cable operators’
carriage rates are very high for the four oldest services (HBO, Cinemax, Showtime, and
The Movie Channel), although Time Warner systems offered all of them at least slightly
more frequently. The situations are different for the four newer premium services, which
have lower carriage rates on average. Time Warner systems were less likely to carry
Encore, and more likely to carry Starz!, while differences in the carriage rates of Flix and
Sundance Channel were negligible.
Table 4 summarizes the proportions of cable systems that include the subject
networks in the analog program tier-- given that the networks are actually carried and that
the cable system offers at least one digital package. These data show that the proportions

22
of Comcast systems that carry their affiliated service, OLN, in the analog tier and that
carry rival Outdoor Channel in the digital tier are higher than for other cable operators. A
similar pattern is observed for Time Warner. For the affiliated basic movie service, TCM,
analog tier carriage rates are relatively high for Time Warner systems, and digital carriage
rate higher for the rival Toon Disney channel. Positioning differences for the other
networks, however, are relatively minor. For the premium networks, the data show a
general pattern that the more established networks (like HBO, Cinemax, Showtime, and
The Movie Channel) are more likely to be placed in the analog tier than the relatively
new services. The data also show that Time Warner has a lower analog tier carriage rate
for all the eight premium services considered--including its affiliated services, HBO and
Cinemax.
Finally, Table 5 shows the proportion of cable systems that offer the various
movie-based networks in the premium group as premium services vs. carriage as part of a
basic or expanded basic package. The five major premium networks are almost never
offered to their subscribers as part of a basic program package by any cable system. The
mini-pays, Encore, Flix, and Sundance, however, are frequently offered as part of a basic
package. Time Warner systems tend to offer Encore more frequently and Sundance less
frequently as a basic service in comparison to other systems. Among the basic movie
network group, TCM and AMC are always part of a basic service. Notably, however,
Time Warner is the only cable operator that offers Fox and IFC as premium services, and
it does so in a substantial number of cases.

23
These raw data tabulations for network carriage and positioning suggest that there
may exist systematic behavioral differences between MSOs vertically affiliated with
networks within a group and those without such affiliations. We now proceed to a
regression analysis to isolate such differences by taking into account system-specific and
demographic variables as well as network ownership information.
V. Empirical Models
To analyze the effects of system ownership on network carriage patterns, we estimate
reduced-form probit models of the following form:
,***********
****
iiiiii
iiiiii
iiiii
MSOqRENTERpHHSIZEoNONWHITEnOLDmYOUNGlLPOPkLINCOMEjDIGITALhLCAPACITYgLMILESf
LHPASSeLAGEdLSIZEcRANKbaCARRIAGE
ε++++++++++++
++++=
where the variables have the following definitions (see Table 2 for additional
information):
- CARRIAGE: dummy variable indicating whether a cable network under analysis is
carried by system i;
- RANK: TV market ranking, with lower numbers indicating larger TV markets;
- LSIZE: natural logarithm of system owners’ (MSOs’) horizontal size, measured by the
percentage of basic subscribers served nationally;
- LAGE: natural logarithm of system age, measured by the number of months since
franchise began;

24
- LHPASS: natural logarithm of home passed;
- LMILES: natural logarithm of miles of cable plant;
- LCAPACITY: natural logarithm of analog channel capacity;
- DIGITAL: dummy variable indicating whether digital services are available;
- LINCOME: natural logarithm of median household income for the county in which
system i operates;
- LPOP: natural logarithm of population density for the county in which system i
operates, measured by the number of persons per square mile;
- YOUNG: percentage of households with individuals under age 18 in the county in
which system i operates;
- OLD: percentage of households with individuals over age 65 in the county in at which
system i operates;
- NONWHITE: percentage of non-white population in the county in which system i
operates;
- HHSIZE: average household size in the county in which system i operates, measured
by the number of persons per household;
- RENTER: percentage of households that rent their homes in the county in which
system i operates;
- MSO: dummy variable indicating whether cable system i is owned by Comcast, Time
Warner, or AT&T as appropriate.
This group of independent variables is similar to that used in other studies of cable

25
system carriage and marketing behavior by Chipty and Waterman and Weiss. In general,
we expect that higher channel capacity and availability of digital service will be
unambiguously associated with greater likelihood of any network’s carriage. Other things
equal, systems with higher population density, greater miles of plant, more homes passed,
and that are owned by larger MSOs should have higher likelihood of network carriage to
the extent that economies of scale lower system costs. A larger MSO, however, could also
tend to reduce carriage of rival networks for anti-competitive reasons. In addition, these
cost-related variables may proxy for various unknown demand factors. Turning to direct
demand-related variables, higher income and the presence of younger family members
are generally associated with higher cable demand. Note, however, as suggested by
results of previous empirical studies, that the carriage of any particular network does not
necessarily rise with stronger general demand. A market with higher income subscribers,
for example, may induce a cable operator to offer a larger number of premium networks
relative to basic networks, so that carriage of a given basic network may fall with income.
It is difficult to predict the effects of TV market ranking, system age, or the proportion of
renters on demand. All the independent variables in the model, however, plausibly affect
costs and demand in cable markets and thus network carriage.
For the positioning models, we estimate A-CARRIAGE or B-CARRIAGE, as a
function of almost the same sets of independent variables, where A-CARRIAGE is a
dummy variable indicating whether a cable network under analysis is carried by system i
in the analog tier; and B-CARRIAGE is a dummy variable indicating whether a cable

26
network under analysis is offered by system i in a basic program package. For the
positioning estimations that involve A-CARRIAGE, we only include the observations for
systems that offer at least one digital service. Therefore, in the estimation of those models,
the variable indicating the availability of digital services (DIGITAL) is dropped.
Greater analog channel capacity should unambiguously encourage the carriage of
any given network on an analog tier. Expected signs of other independent variables,
however, are difficult to predict. The use of logarithmic forms of some independent
variables reflects our expectations that these variables will have diminishing marginal
effects on carriage or positioning decisions.
VI Channel Carriage and Positioning Results
A. Basic Outdoor Entertainment Networks
We first investigate Comcast’s probability of carrying its corporate relative OLN and
of carrying the unaffiliated Outdoor Channel, in comparison to cable operators without an
equity interest in either network. The key explanatory variable is a dummy indicating
whether a cable system is owned by Comcast or not as of 2004, or by AT&T in 2001.
Since the MSO, Cox Communication, is also one of the previous owners of OLN, models
were estimated with and without the Cox observations. The estimation results are in Table
6.
As expected, digital tier availability has a highly significant positive influence on
outdoor channel carriage in all eight carriage models, although somewhat less so in 2001
when digital tiers were far less widely available. Channel capacity is unexpectedly

27
insignificant in all models, although this result may be due to positive correlation with
digital service availability. If the variable indicating digital services is dropped from these
models, the estimate for the channel capacity variable becomes positive in all eight cases,
and strongly significant in four.29 Most other cost and demand-related variables have
weak or no significance, or have unexpected signs, a pattern of results similar to that
produced for similar variables by the Waterman and Weiss and Chipty studies. A similar
pattern of results also characterizes other models in this study reported below.
The effects of Comcast’s ownership on carriage of outdoor entertainment networks
generally confirms patterns observed in the descriptive data, and are almost identical with
or without the potentially confounding Cox observations. In 2004, Comcast was about
20% more likely to carry OLN than other MSOs, and about 30% less likely to carry its
rival, Outdoor Channel.
For the 2001 models, results are similar, although the estimated marginal effects of
AT&T ownership on carriage of OLN and Outdoor Channel are much lower. This result
suggests that the availability of digital tiers, although they encourage carriage of all
networks, does not make it less likely in relative terms for an integrated cable operator to
engage in the exclusion of its rival networks.
For the 2004 analysis of analog vs. digital tier positioning, neither the OLN nor the
Outdoor Channel models indicate statistically significant differences in placement of
29 The estimation results are available from the authors upon request.

28
these networks by Comcast systems (Table 7).30
B. Basic Cartoon Services
Carriage models reported in Table 8 for carriage of the two basic cartoon networks
indicate a pattern different than that of the outdoor networks. Corrected for other factors,
Time Warner is about 16% more likely to carry its affiliated network, Cartoon Network,
than other MSOs, but contrary to the foreclosure hypothesis, 29% more likely to offer its
rival Toon Disney. Also shown by these models is that carriage of Toon Disney by MSOs
on average is 55% higher for systems having a digital tier, while carriage of the older,
better established Cartoon network is only about 5% more likely with the presence of
digital service. The latter results clearly reflect the far greater dependence of the newer
Toon Disney network on digital carriage, as indicated by the descriptive data in Table 4.
As indicated by Model 3 in Table 8, however, Time Warner systems that carry Toon
Disney, are about 25% more likely than other cable operators to offer it only on a digital
tier. This result suggests that although Time Warner’s carriage of its rival network Toon
Disney is relatively high, that MSO systematically positions this network in a way that
limits its audience reach. By contrast, virtually all cable systems that carry Cartoon
Network offer it on an analog tier, undoubtedly reflecting the earlier launch and rapid
growth of this service in the early 1990s. (A statistical model for positioning of Cartoon
30 The insignificant Outdoor Channel result could be due to collinearity of the Comcast dummy with the MSO size variable, which has high significance in that model. We re-estimated the same model without the MSO size variable and found that the coefficient for the Comcast dummy became strongly negative and significant, consistent with the descriptive data. Re-estimation of all of models reported in this article without the MSO size variable (which has fairly erratic signage and significance) results in very few other substantive differences in the signage or significance of the MSO-specific dummies.

29
Network could not be estimated since it has virtually no digital tier-only carriage.)
C. Basic Movie Channels
As shown in Table 9, Time Warner systems were about 13% more likely to carry
their well-established vertical affiliate, TCM, than was the average system (Model 1).
Among its three rivals, Time Warner’s carriage of AMC was not significantly different,
but was much higher (28%) for Fox Movie Channel (FMC), and significantly lower (18%)
for IFC. In our sample, IFC is not carried by any cable system that does not offer at least
one digital package. Therefore, the variable indicating the availability of digital services
is perfectly correlated with the dependent variable and thus is dropped from the
estimation. To control for the effect of digital capabilities, we re-estimated the model for
IFC by using only the observations for the systems that offer at least one digital service.
The results (Table 9, Model 5) show that, by considering only those digitally able systems,
the exclusion of IFC by Time Warner becomes greater, the marginal effect increasing
from −18% to about −24%..
The statistically neutral results for AMC carriage contrast with those obtained by
Chipty (2001), who found statistically significant exclusion of AMC by the owners of
premium movie networks, including Time Warner. This discrepancy is not surprising,
however, in that Chipty’s study using 1991 data reflecting AMC’s then more nascent
national cable penetration of 32% (Chipty, 2001, p. 439). Judging from our sample,
AMC’s national penetration had reached about 90% by 2004, likely elevating it to the
status of a “must-have” channel, and thus making its exclusion unprofitable for most

30
systems by that time.
Lower than average carriage estimates in Table 9 for IFC on Time Warner systems
appear consistent with the foreclosure hypothesis, but that MSO’s much greater than
normal carriage of FMC is contrary to foreclosure.31
The FMC result seems especially unconducive to the foreclosure model because its
program menu--mostly old movies that were produced in the 1930s to the 1970s--seems
very similar to that of TCM. Further analysis is less dismissive of the foreclosure model,
however: TCM and FMC are rarely placed on the same program tier by Time Warner.
Table 4 shows that about 87% of the cable systems owned by Time Warner include TCM
in the analog tier, while 94% of that MSO’s systems which choose to carry FMC offer
that network only on a digital tier. Also, as shown by Table 5, Time Warner is the only
cable operator to offer FMC as a premium service, a strategy Time Warner followed in
about one third of all instances in which FMC was given carriage. Moreover, FMC was
also on a digital tier in all of these premium pricing cases. In contrast, Time Warner
always placed TCM on a basic tier.32
Some further insight into TCM/FMC positioning is gained from Model 6 of Table 9,
which reports estimated MSO differences in carriage of FMC only for the basic tier. That
31 To make sure that results for Independent Film Channel are not distorted due to its partial ownership by Cablevision, we also estimate the IFC models excluding the observations for the cable systems owned by Cablevision. The results remain virtually unchanged. (The results are available upon request from the authors.) 32 In our sample, when Fox Movie Channel and Independent Film Channel are offered as premium services by Time Warner, they are invariably included in the digital tiers. Accurate information on the number of subscribers to these two networks is not available. However, using the national level figures for the penetration rate of digital services (31%) and the proportion of basic cable subscribers that have access to premium networks (53%), we can obtain a rough estimate for the proportion of basic cable subscribers that also subscribe to these two movie services in those local markets, which is about 16%.

31
model indicates statistically neutral, rather than significantly positive, differences in Time
Warner’s carriage of FMC in comparison to other MSOs. Time Warner’s relatively more
generous carriage of FMC is thus confined to that network’s carriage as a (digital tier)
pay network.
Although Table 4 indicates that tier separation of TCM and FMC also tends to occur
on cable systems having no vertical affiliation with TCM, the separations are sharper on
Time Warner systems, due in large part to the much higher than average Time Warner
system carriage of TCM on an analog tier, as indicated in Table 4.
Turning again to IFC, the 24% less frequent carriage of that network by Time Warner
systems indicated by Model 5 of Table 9 may also understate the practical level of IFC’s
foreclosure from Time Warner systems. The descriptive data of Table 5 show that similar
to the Fox Movie Case, Time Warner carried IFC as a premium channel in about one third
of cases where any carriage was given, a strategy also not followed by any other MSO.
As in the FMC cases, Time Warner’s offerings of IFC as a premium network were in
virtually all cases via a digital tier. Model 7 of Table 9 shows that when only the cases in
which IFC was carried on a basic tier are considered, Time Warner systems offered IFC
still less frequently (an estimated –36%), than the average system.33
The lack of relevant cases did not permit analog vs. digital tier positioning models to
be statistically estimated for any of the basic movie networks except TCM.34 As the
33 When basic tier carriage is considered for only the systems with digital services, Time Warner systems are 43% less likely to offer IFC. The estimation results are available from the authors upon request. 34 In the former case, there was only one cable system, which is owned by Time Warner, that does not include American Movie Classics in the analog program package. Due to the lack of data variation, the probit estimation is not

32
descriptive data in Table 4 suggest would be the case, Model 8 of Table 9 shows that
Time Warner systems were statistically much more likely (38% more) to offer TCM on
an analog tier than was the average system.
Marketing of cable networks is too complex, and the relevant substitution effects too
murky for us to confidently conclude that foreclosure occurs in the case of these basic
networks. All of these networks, for example, may also be viewed by cable operators as
potential competitors to their premium network offerings. We have advanced above,
however, plausible explanations for how foreclosure involving basic movie networks may
take place through positioning as well as carriage practices.
D. Premium Network Carriage
Finally, we consider Time Warner’s carriage decisions involving the eight
movie-based premium networks. Nearly ubiquitous carriage of HBO and Cinemax by
U.S. cable systems prohibits estimation of carriage models for those Time Warner-owned
networks. We were, however, able to estimate carriage models for the six rival networks
unaffiliated with Time Warner (Table 10). Non-ownership variables indicate a pattern
similar to the basic network models reported previously. Signage is negative for the Time
Warner ownership variables in all six models, though carriage is significantly negative
and of notable magnitude (ranging from 14% to 18%) only in the 3 “mini-pay” cases. In
all three of the statistically insignificant cases, however, carriage differences are unlikely
feasible. In the latter case, only five cable systems in our sample include Independent Film Channel in the analog package, and the probit estimation is unsuccessful for the same reason.

33
to be sharp because of the generally very high national penetration rates of those
networks (Table 3).
We were able to estimate analog vs. digital tier positioning models for all eight
networks in the premium group (Table 11). Contrary to the foreclosure hypothesis, Time
Warner carried HBO on an analog tier 11% less frequently than did the average cable
system. The sign was also negative, though statistically insignificant, for Cinemax. In
three of the six other cases (Encore, Starz and TMC), however, Time Warner is shown to
be less likely to include those networks on the analog tier, while results were not
significantly different for the other three networks.
There is a final piece to the premium network positioning puzzle. As the models in
Table 12 indicate, Time Warner systems offer Encore more frequently as a basic network,
and Sundance much less frequently as a basic network, than does the average system.
Differences for Flix were insignificant and basic vs. premium models could not be
estimated for the other networks in the premium group.
Overall, premium network carriage and analog vs. digital carriage patterns are
generally consistent with a foreclosure model, although results are insignificant in several
cases and contrary to the hypothesis in at least the HBO positioning case. These results
indicate that further studies on this issue are still needed.
VII Summary and conclusions
While there are some notable exceptions, the carriage and network positioning
patterns we have analyzed in this study are generally consistent with the vertical

34
foreclosure hypothesis as we have defined it. In each of the four network groups studied
—basic outdoor entertainment, basic cartoon, basic movie and premium movie
networks--vertically affiliated networks were almost uniformly favored by Comcast,
Time Warner, and AT&T in terms of higher carriage and/or more frequent positioning on
analog program tiers that are more widely available to consumers. In a majority of cases,
unaffiliated networks that we identified to be rivals to these integrated networks were
carried less frequently and they were more often placed on limited-access digital tiers.
We have confined our study to a series of example network groups, and mainly to
the behavior of only two MSOs. We also did not attempt to systematically measure
changes in foreclosure behavior over time, although it appears that in cases like AMC, the
extent of foreclosure tends to diminish when a network survives to become well
established in the market. Overall, however, the bulk of evidence in this paper is that
vertical foreclosure remains a persistent phenomenon in the U.S. cable television
industry--in spite of great increases in channel capacity and digitization, as well as
competition from DBS. To our knowledge, ours is the first systematic empirical study to
document foreclosure patterns in cable television in the new competitive environment of
digital tiering.
We believe that a unique contribution of this study is our demonstration that vertical
foreclosure in the modern cable industry cannot be understood only in terms of network
carriage differentials. Integrated systems have the ability to reduce competition for their
affiliated networks, or to disadvantage rival networks, in a variety of ways other than the

35
yes-or-no carriage decision—notably tier placement. It was not possible to conclude from
this study whether the foreclosure patterns we observe are efficiency or
anti-competitively motivated, or whether consumers are on net better off or worse off as a
result. Questions also remain about the extent to which unaffiliated cable networks are in
fact disadvantaged by receiving digital vs. analog tier placement, or especially by basic
vs. premium positioning. These questions are worthy of more detailed study.

Table 1 Programming Networks for Analysis Market Segment Programming Network MSO Ownership (%) Launch Date Subscribers (mil)
Outdoor Life Network Comcast (100) Jul-95 52.2 Outdoor Entertainment Outdoor Channel - Apr-93 23.1
Turner Classic Movies Time Warner (100) Apr-94 63.8 American Movie Classics Cablevision (60) Oct-84 83.6 Independent Film Channel Cablevision (60) Sep-94 26.8
Basic Movie Service
Fox Movie Channel - Nov-94 24.7 Cartoon Network Time Warner (100) Oct-92 83.0 Cartoon Toon Disney - Apr-98 39.4 HBO Time Warner (100) Nov-72 20.5 Cinemax Time Warner (100) Aug-80 8.0 Showtime - Jun-76 8.7 The Movie Channel - Dec-79 5.8 Encore - Apr-91 13.8 Starz! - Mar-94 7.6 Flix - Aug-92 6.7
Premium Network
Sundance Channel - Feb-96 9.9 Source: Federal Communication Commission (2004); Kagan World Media (2003), Cable Program Investor, June. Notes: The number of subscriber information is as of June 2003.

Table 2 Variable Definitions and Descriptive Statistics (N = 680) Variable Empirical Measure Level Mean Demographic variables Population density Number of persons per square mile County 601.80 Income Median household income County 38021.64 Younger viewership Percentage of households with individuals under age 18 County 35.37 Older viewership Percentage of households with individuals over age 65 County 25.88 Non-white viewership Percentage of population non-white County 17.72 Average household size Persons per household County 2.54 Renter Percentage of households that are renters County 27.65 Cable system specific variables TV market ranking Lower numbers indicate larger TV markets Rankings exceeding
100 are coded as 100 System 69.40
System age Number of months since franchise began System 340.35 System size Home passed System 41659.21 Owner’s horizontal size The percentage of basic subscribers served nationally by the MSO System 7.83 Miles Miles of cable planted System 490.78 Capacity Analog channel capacity System 64.43 Digital service Availability of digital video service System 0.83 Comcast ownership The percentage of systems owned by Comcast System 19.85 Time Warner ownership The percentage of systems owned by Time Warner System 10.44 Notes: In the case of joint ownership, the cable system is treated as owned by Comcast or Time Warner if either of them is one of the owners. The information on pricing and subscribership is not available for all observations. For those variables, the mean was calculated based on the observations with this information only.
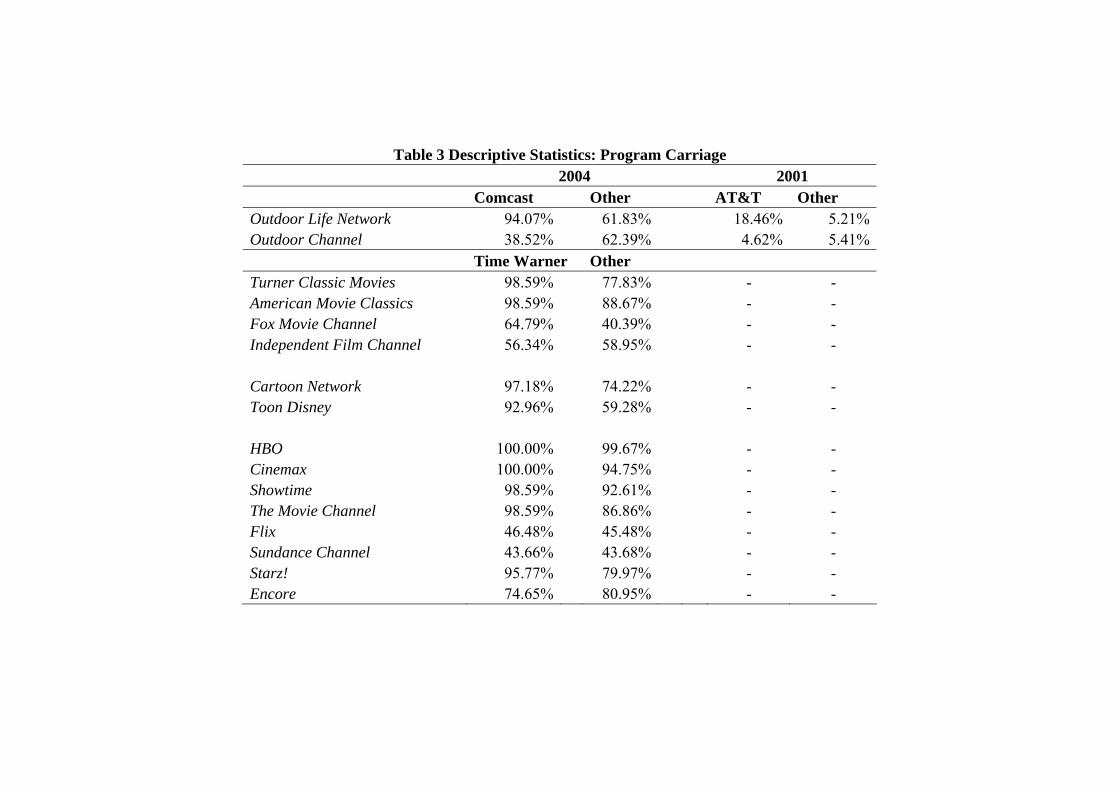
Table 3 Descriptive Statistics: Program Carriage 2004 2001 Comcast Other AT&T Other Outdoor Life Network 94.07% 61.83% 18.46% 5.21%Outdoor Channel 38.52% 62.39% 4.62% 5.41% Time Warner Other Turner Classic Movies 98.59% 77.83% - - American Movie Classics 98.59% 88.67% - - Fox Movie Channel 64.79% 40.39% - - Independent Film Channel 56.34% 58.95% - - Cartoon Network 97.18% 74.22% - - Toon Disney 92.96% 59.28% - - HBO 100.00% 99.67% - - Cinemax 100.00% 94.75% - - Showtime 98.59% 92.61% - - The Movie Channel 98.59% 86.86% - - Flix 46.48% 45.48% - - Sundance Channel 43.66% 43.68% - - Starz! 95.77% 79.97% - - Encore 74.65% 80.95% - -

Table 4 Descriptive Statistics: Program Positioning – Analog vs. Digital Comcast Other Analog Digital only Analog Digital onlyOutdoor Life Network 42.52% 57.48% 35.15% 64.85%Outdoor Channel 5.77% 94.23% 26.18% 73.82% Time Warner Other Analog Digital only Analog Digital onlyCartoon Network 100.00% 0.00% 99.75% 0.25%Toon Disney 3.03% 96.97% 34.01% 65.99% Turner Classic Movie 87.14% 12.86% 53.44% 46.56%American Movie Classics 98.57% 1.43% 100.00% 0.00%Fox Movie Channel 5.97% 94.03% 7.69% 92.31%Independent Film Channel 2.50% 97.5% 1.11% 98.89% HBO 53.53% 46.47% 70.68% 29.32%Cinemax 50.70% 49.30% 59.62% 40.38%Showtime 50.00% 50.00% 58.86% 41.14%The Movie Channel 20.00% 80.00% 40.26% 59.74%Starz! 17.65% 82.35% 28.66% 71.34%Encore 12.31% 87.69% 32.60% 67.40%Flix 6.06% 93.94% 8.19% 91.81%Sundance Channel 2.78% 97.22% 3.96% 96.04%Notes: Percentages were calculated given that the networks are carried and that the cable system offers at least one digital service.

Table 5 Descriptive Statistics: Program Positioning – Basic vs. Premium Time Warner Other Basic Premium Basic Premium HBO 0.00% 100.00% 0.00% 100.00% Cinemax 0.00% 100.00% 0.00% 100.00% Showtime 0.00% 100.00% 0.00% 100.00% The Movie Channel 0.00% 100.00% 0.00% 100.00% Starz! 0.00% 100.00% 2.44% 97.56% Encore 52.31% 47.69% 23.40% 76.6% Flix 18.18% 81.82% 18.86% 81.14% Sundance Channel 50.00% 50.00% 68.35% 31.65% Turner Classic Movie 100.00% 0.00% 100.00% 0.00% American Movie Classics 100.00% 0.00% 100.00% 0.00% Fox Movie Channel 68.09% 31.91% 100.00% 0.00% Independent Film Channel 64.29% 35.71% 100.00% 0.00% Notes: Percentages were calculated given that the networks are carried.

Table 6 Carriage of Outdoor Entertainment Networks Year 2004 Year 2001 OLN OLN
(without Cox)Outdoor Channel Outdoor Channel
(without Cox) OLN OLN
(without Cox) Outdoor Channel
Outdoor Channel
(without Cox) (1) (2) (3) (4) (5) (6) (7) (8) RANK -0.001 (0.001) -0.001 (0.001) -0.001 (0.001) -0.001 (0.001) 0.000 (0.000) 0.000 (0.000) 0.000 (0.000) 0.000 (0.000)
LSIZE 0.044*** (0.013) 0.041*** (0.013) 0.001 (0.014) 0.000 (0.014) -0.005 (0.004) -0.006 (0.004) -0.004 (0.003) -0.005* (0.003)
LAGE 0.030 (0.068) 0.016 (0.070) -0.244*** (0.072) -0.260*** (0.074) 0.013 (0.024) 0.002 (0.020) -0.017 (0.018) -0.020 (0.016)
LHPASS 0.002 (0.037) -0.007 (0.038) 0.005 (0.036) 0.002 (0.037) 0.026** (0.012) 0.021** (0.010) 0.009 (0.011) 0.007 (0.010)
LMILES -0.004 (0.036) -0.004 (0.038) -0.015 (0.035) -0.006 (0.036) -0.014 (0.011) -0.014 (0.009) -0.004 (0.010) -0.003 (0.010)
LCAPACITY 0.022 (0.070) 0.011 (0.073) 0.024 (0.069) -0.009 (0.071) 0.017 (0.024) 0.012 (0.021) 0.031 (0.019) 0.018 (0.017)
DIGITAL 0.729*** (0.039) 0.748*** (0.037) 0.580*** (0.040) 0.597*** (0.040) 0.187*** (0.039) 0.158*** (0.037) 0.114*** (0.024) 0.108*** (0.026)
LINCOME 0.188 (0.157) 0.226 (0.162) -0.492*** (0.153) -0.428*** (0.155) -0.045 (0.048) -0.018 (0.043) -0.065 (0.041) -0.030 (0.037)
LPOP -0.032 (0.022) -0.036 (0.023) -0.019 (0.022) -0.019 (0.022) -0.007 (0.007) -0.006 (0.006) -0.001 (0.006) -0.001 (0.005)
YOUNG 0.035*** (0.012) 0.031** (0.013) -0.002 (0.009) -0.004 (0.009) 0.002 (0.002) 0.002 (0.002) 0.003 (0.002) 0.002 (0.002)
OLD -0.001 (0.006) -0.002 (0.006) -0.003 (0.006) -0.002 (0.006) -0.001 (0.002) -0.001 (0.002) -0.001 (0.002) -0.001 (0.001)
NONWHITE 0.000 (0.002) 0.000 (0.002) -0.001 (0.002) -0.001 (0.002) -0.003*** (0.001) -0.002*** (0.001) -0.001 (0.001) -0.001 (0.001)
HHSIZE -1.112*** (0.302) -1.069*** (0.308) 0.028 (0.232) 0.050 (0.237) .008 (0.064) 0.010 (0.055) -0.025 (0.053) -0.012 (0.050)
RENTER -0.002 (0.004) -0.002 (0.004) -0.004 (0.004) -0.003 (0.004) 0.004*** (0.001) 0.003*** (0.001) -0.001 (0.001) -0.001 (0.001)
COMCAST 0.194*** (0.058) 0.205*** (0.058) -0.294*** (.060) -0.310*** (0.061) - - - - - - - -
ATT - - - - - - - - 0.047 (0.029) 0.062** (0.031) -0.548** (0.318) -0.021** (0.010)
N 680 657 680 657 671 648 671 648
Pseudo R2 0.3725 0.3754 0.1991 0.2071 0.4519 0.4696 0.2695 0.3167
Notes: Marginal effects reported with standard errors in brackets. * indicates significance at 10% level, ** at 5% level, and *** at 1% level.

Table 7 Positioning of Outdoor Entertainment Networks OLN
in analog tier Outdoor Channel
in analog tier RANK 0.001 (0.001) 0.000 (0.001) LSIZE -0.003 (0.017) -0.076*** (0.013) LAGE 0.031 (0.080) 0.088 (0.075) LHPASS 0.006 (0.042) -0.026 (0.044) LMILES 0.013 (0.042) -0.024 (0.043) LCAPACITY 0.165** (0.080) 0.013 (0.070) LINCOME 0.410** (0.179) -0.527*** (0.183) LPOP 0.038 (0.027) 0.041 (0.029) YOUNG 0.002 (0.008) -0.033*** (0.012) OLD -0.002 (0.006) -0.023*** (0.007) NONWHITE 0.002 (0.002) 0.004** (0.002) HHSIZE -0.243 (0.261) 0.588 (0.363) RENTER -0.006 (0.004) -0.015*** (0.005) COMCAST -0.036 (0.066) 0.023 (0.101) N 457 369 Pseudo R2 0.0588 0.2445
Notes: Positioning models are estimated only with the observations for systems that actually carry the subject networks and provide digital services. Marginal effects reported with standard errors in brackets. * indicates significance at 10% level, ** at 5% level, and *** at 1% level.

Table 8: Program Carriage and Positioning of Cartoon Services Cartoon Network
carriage Toon Disney
carriage Toon Disney in analog tier
RANK 0.001* (0.001) 0.000 (0.001) -0.001 (0.001) LSIZE -0.013 (0.009) 0.009 (0.012) -0.047*** (0.013) LAGE -0.004 (0.053) -0.059 (0.068) 0.019 (0.067) LHPASS 0.044 (0.028) 0.017 (0.037) 0.042 (0.040) LMILES 0.025 (0.027) -0.036 (0.036) -0.106*** (0.041) LCAPACITY 0.221*** (0.049) 0.048 (0.067) 0.018 (0.074) DIGITAL 0.195*** (0.055) 0.553*** (0.047) - -LINCOME 0.136 (0.108) 0.266 (0.145) 0.010 (0.170) LPOP -0.013 (0.016) -0.007 (0.021) -0.025 (0.028) YOUNG 0.010 (0.008) -0.004 (0.008) 0.007 (0.012) OLD 0.001 (0.004) -0.001 (0.005) -0.019*** (0.007) NONWHITE 0.002 (0.001) 0.002 (0.002) -0.001 (0.002) HHSIZE -0.470** (0.200) -0.152 (0.216) -0.259 (0.320) RENTER 0.000 (0.003) 0.002 (0.004) -0.001 (0.004) TIME WARNER 0.162*** (0.033) 0.288*** (0.051) -0.251*** (0.039) N 680 680 410 Pseudo R2 0.2319 0.2031 0.2089
Notes: Positioning models are estimated with the observations for systems that actually carry the subject networks and provide digital services. Marginal effects reported with standard errors in brackets. * indicates significance at 10% level, ** at 5% level, and *** at 1% level.

Table 9 Carriage and Positioning of Basic Movie Channels TCM
Carriage AMC
Carriage FMC
Carriage IFC
Carriage IFC Carriage
(with digital only) FMC Carriage
(in basic tier only) IFC Carriage
(in basic tier only)TCM
in analog tier
(1) (2) (3) (4) (5) (6) (7) (8) RANK -0.001 (0.001) 0.000 (0.000) -0.002*** (0.001) 0.001 (0.001) 0.001 (0.001) -0.002** (0.001) 0.001* (0.001) -0.001 (0.001)
LSIZE -0.025*** (0.009) 0.011** (0.005) 0.000 (0.012) 0.096*** (0.012) 0.078*** (0.011) -0.001 (0.012) 0.097*** (0.012) -0.069*** (0.014)
LAGE 0.000 (0.046) 0.022 (0.027) -0.300*** (0.076) -0.232*** (0.070) -0.245*** (0.067) -0.316*** (0.074) -0.245*** (0.071) 0.168** (0.079)
LHPASS 0.036 (0.025) 0.010 (0.015) -0.021 (0.038) 0.120*** (0.035) 0.052 (0.034) -0.031 (0.037) 0.127*** (0.035) -0.002 (0.042)
LMILES -0.035 (0.024) 0.009 (0.014) -0.013 (0.038) -0.068** (0.034) -0.040 (0.034) 0.007 (0.037) -0.072** (0.035) 0.010 (0.041)
LCAPACITY 0.134*** (0.046) 0.030 (0.027) 0.068 (0.071) 0.149** (0.065) 0.056 (0.064) 0.082 (0.069) 0.159** (0.066) 0.116 (0.077)
DIGITAL 0.561*** (0.060) 0.044 (0.029) 0.559*** (0.027) - - - - 0.537*** (0.027) - - - -
LINCOME 0.017 (0.095) 0.118** (0.059) -0.511*** (0.163) -0.165 (0.142) -0.247* (0.147) -0.466*** (0.159) -0.152 (0.144) 0.197 (0.179)
LPOP -0.008 (0.014) 0.010 (0.008) -0.004 (0.024) -0.035 (0.021) -0.041* (0.022) -0.005 (0.024) -0.031 (0.021) 0.047* (0.027)
YOUNG 0.017** (0.008) 0.001 (0.004) -0.005 (0.010) 0.020* (0.012) 0.011 (0.011) -0.008 (0.010) 0.019 (0.012) -0.019 (0.012)
OLD -0.004 (0.004) 0.001 (0.002) -0.003 (0.006) -0.013** (0.006) -0.011** (0.006) -0.004 (0.006) -0.013** (0.006) -0.007 (0.007)
NONWHITE 0.001 (0.001) 0.000 (0.001) -0.004* (0.002) -0.001 (0.002) -0.002 (0.002) -0.003 (0.002) -0.001 (0.002) 0.000 (0.002)
HHSIZE -0.540*** (0.184) -0.114 (0.103) 0.193 (0.256) -0.760*** (0.279) -0.268 (0.270) 0.270 (0.258) -0.710** (0.282) 0.142 (0.316)
RENTER -0.002 (0.002) -0.002 (0.001) 0.002 (0.004) 0.000 (0.004) 0.005 (0.004) 0.000 (0.004) -0.002 (0.004) 0.000 (0.004)
TIME WARNER
0.130*** (0.027) 0.031 (0.032) 0.284*** (0.068) -0.182** (0.072) -0.242*** (0.072) 0.068 (0.068) -0.364*** (0.061) 0.376*** (0.044)
N 680 680 680 680 561 680 680 509
Pseudo R2 0.3293 0.1939 0.2271 0.1635 0.1217 0.1983 0.1661 0.1217
Notes: Positioning models are estimated with the observations for systems that actually carry the subject networks and provide digital services. Marginal effects reported with standard errors in brackets. * indicates significance at 10% level, ** at 5% level, and *** at 1% level.

Table 10 Carriage of Premium Networks Showtime
Carriage TMC
Carriage STARZ! Carriage
Encore Carriage
Flix Carriage
Sundance Channel Carriage
(1) (2) (3) (4) (5) (6) RANK 0.000 (0.000) 0.000 (0.000) 0.001 (0.001) 0.000 (0.001) -0.001* (0.001) 0.001 (0.001)
LSIZE -0.002 (0.002) 0.000 (0.004) 0.023*** (0.007) 0.025*** (0.007) 0.023* (0.012) 0.053*** (0.013)
LAGE 0.020* (0.011) 0.002 (0.023) -0.031 (0.045) 0.008 (0.041) -0.041 (0.069) -0.149** (0.076)
LHPASS 0.007 (0.005) 0.037*** (0.012) 0.016 (0.024) -0.021 (0.021) -0.005 (0.037) 0.063 (0.041)
LMILES 0.002 (0.005) -0.012 (0.010) -0.019 (0.022) 0.011 (0.019) 0.051 (0.036) 0.026 (0.040)
LCAPACITY 0.011 (0.009) 0.019 (0.019) 0.061 (0.041) 0.068* (0.041) 0.142** (0.069) 0.243*** (0.075)
DIGITAL 0.176*** (0.057) 0.334*** (0.064) 0.687*** (0.056) 0.582*** (0.059) 0.368*** (0.048) 0.494*** (0.033)
LINCOME -0.023 (0.021) 0.006 (0.041) -0.129 (0.090) -0.066 (0.088) 0.308** (0.152) 0.384** (0.164)
LPOP -0.001 (0.003) -0.006 (0.006) 0.030** (0.013) 0.020 (0.013) -0.028 (0.023) -0.018 (0.025)
YOUNG 0.000 (0.002) 0.003 (0.003) -0.003 (0.006) -0.001 (0.006) -0.005 (0.009) -0.002 (0.008)
OLD 0.000 (0.001) 0.005** (0.002) -0.005 (0.004) -0.002 (0.004) 0.012** (0.006) 0.009 (0.006)
NONWHITE 0.000 (0.000) -0.001 (0.001) -0.003** (0.001) -0.002* (0.001) 0.007*** (0.002) 0.008*** (0.002)
HHSIZE -0.003 (0.037) -0.017 (0.083) 0.043 (0.142) -0.037 (0.148) 0.113 (0.237) 0.148 (0.241)
RENTER 0.001 (0.001) 0.004*** (0.001) 0.001 (0.002) 0.001 (0.002) -0.003 (0.004) -0.004 (0.004)
TIME WARNER
-0.027 0.034 -0.014 (0.041) -0.076 (0.073) -0.155** (0.075) -0.144** (0.062) -0.182*** (0.056)
N 680 680 680 680 680 680
Pseudo R2 0.4270 0.4598 0.5330 0.4221 0.1687 0.3204
Notes: Marginal effects reported with standard errors in brackets. * indicates significance at 10% level, ** at 5% level, and *** at 1% level.
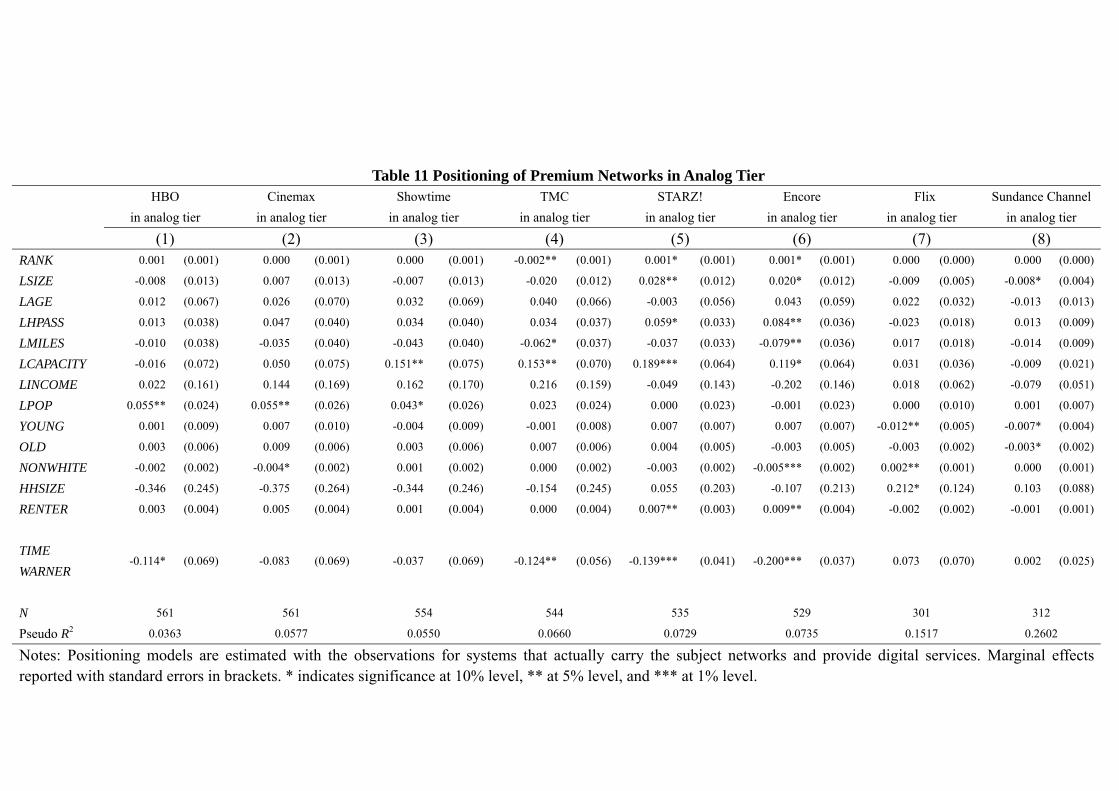
Table 11 Positioning of Premium Networks in Analog Tier
HBO in analog tier
Cinemax in analog tier
Showtime in analog tier
TMC in analog tier
STARZ! in analog tier
Encore in analog tier
Flix in analog tier
Sundance Channel in analog tier
(1) (2) (3) (4) (5) (6) (7) (8) RANK 0.001 (0.001) 0.000 (0.001) 0.000 (0.001) -0.002** (0.001) 0.001* (0.001) 0.001* (0.001) 0.000 (0.000) 0.000 (0.000)
LSIZE -0.008 (0.013) 0.007 (0.013) -0.007 (0.013) -0.020 (0.012) 0.028** (0.012) 0.020* (0.012) -0.009 (0.005) -0.008* (0.004)
LAGE 0.012 (0.067) 0.026 (0.070) 0.032 (0.069) 0.040 (0.066) -0.003 (0.056) 0.043 (0.059) 0.022 (0.032) -0.013 (0.013)
LHPASS 0.013 (0.038) 0.047 (0.040) 0.034 (0.040) 0.034 (0.037) 0.059* (0.033) 0.084** (0.036) -0.023 (0.018) 0.013 (0.009)
LMILES -0.010 (0.038) -0.035 (0.040) -0.043 (0.040) -0.062* (0.037) -0.037 (0.033) -0.079** (0.036) 0.017 (0.018) -0.014 (0.009)
LCAPACITY -0.016 (0.072) 0.050 (0.075) 0.151** (0.075) 0.153** (0.070) 0.189*** (0.064) 0.119* (0.064) 0.031 (0.036) -0.009 (0.021)
LINCOME 0.022 (0.161) 0.144 (0.169) 0.162 (0.170) 0.216 (0.159) -0.049 (0.143) -0.202 (0.146) 0.018 (0.062) -0.079 (0.051)
LPOP 0.055** (0.024) 0.055** (0.026) 0.043* (0.026) 0.023 (0.024) 0.000 (0.023) -0.001 (0.023) 0.000 (0.010) 0.001 (0.007)
YOUNG 0.001 (0.009) 0.007 (0.010) -0.004 (0.009) -0.001 (0.008) 0.007 (0.007) 0.007 (0.007) -0.012** (0.005) -0.007* (0.004)
OLD 0.003 (0.006) 0.009 (0.006) 0.003 (0.006) 0.007 (0.006) 0.004 (0.005) -0.003 (0.005) -0.003 (0.002) -0.003* (0.002)
NONWHITE -0.002 (0.002) -0.004* (0.002) 0.001 (0.002) 0.000 (0.002) -0.003 (0.002) -0.005*** (0.002) 0.002** (0.001) 0.000 (0.001)
HHSIZE -0.346 (0.245) -0.375 (0.264) -0.344 (0.246) -0.154 (0.245) 0.055 (0.203) -0.107 (0.213) 0.212* (0.124) 0.103 (0.088)
RENTER 0.003 (0.004) 0.005 (0.004) 0.001 (0.004) 0.000 (0.004) 0.007** (0.003) 0.009** (0.004) -0.002 (0.002) -0.001 (0.001)
TIME WARNER
-0.114* (0.069) -0.083 (0.069) -0.037 (0.069) -0.124** (0.056) -0.139*** (0.041) -0.200*** (0.037) 0.073 (0.070) 0.002 (0.025)
N 561 561 554 544 535 529 301 312
Pseudo R2 0.0363 0.0577 0.0550 0.0660 0.0729 0.0735 0.1517 0.2602
Notes: Positioning models are estimated with the observations for systems that actually carry the subject networks and provide digital services. Marginal effects reported with standard errors in brackets. * indicates significance at 10% level, ** at 5% level, and *** at 1% level.

Table 12 Positioning of Premium Networks in Basic vs. Premium tiers
Encore in basic tier
Flix in basic tier
Sundance Channel in basic tier
RANK 0.001 (0.001) 0.000 (0.001) 0.001 (0.001)
LSIZE 0.065*** (0.012) 0.050*** (0.013) 0.181*** (0.025)
LAGE -0.051 (0.062) -0.084* (0.044) 0.088 (0.088)
LHPASS -0.095*** (0.035) -0.021 (0.027) 0.024 (0.052)
LMILES 0.081** (0.035) 0.042 (0.028) 0.014 (0.050)
LCAPACITY 0.193*** (0.064) 0.093 (0.063) -0.209* (0.118)
DIGITAL 0.160*** (0.061) -0.330 (0.243) - -
LINCOME 0.389*** (0.149) 0.020 (0.120) 0.432* (0.246)
LPOP -0.015 (0.024) 0.041** (0.021) -0.009 (0.039)
YOUNG -0.005 (0.008) -0.026** (0.010) -0.026 (0.020)
OLD 0.005 (0.005) -0.008* (0.004) -0.001 (0.010)
NONWHITE 0.004** (0.002) 0.003* (0.002) 0.002 (0.003)
HHSIZE -0.250 (0.240) 0.315 (0.227) 0.742 (0.486)
RENTER 0.002 (0.004) -0.013*** (0.003) 0.006 (0.006)
TIME WARNER 0.186*** (0.070) 0.011 (0.048) -0.422*** (0.092)
N 565 314 312
Pseudo R2 0.1577 0.3821 0.3574
Notes: Positioning models are estimated with the observations for systems that actually carry the subject networks. Marginal effects reported with standard errors in brackets. * indicates significance at 10% level, ** at 5% level, and *** at 1% level. When estimating the Sundance Channel model, the DIGITAL variable was dropped because no system without digital service carries Sundance Channel in the basic program tier.

References Blair, R. D. and D. L. Kaserman (1978). “Vertical Integration, Tying, and Antitrust Policy.”
American Economic Review 68(3): 397-402. Bolton, P. and M. D. Whinston (1993). “Incomplete Contracts, Vertical Integration, and
Supply Assurance,” Review of Economics Studies 60: 121-148. Bork, R. H. (1978). The Antitrust Paradox: A Policy at War with Itself. New York: Basic
Books, Inc., Publishers. Chipty, T. (1995). “Horizontal Integration for Bargaining Power - Evidence from the Cable
Television Industry.” Journal of Economics & Management Strategy, 4(2), 375-397. Chipty, T. (2001). “Vertical Integration, Market Foreclosure, and Consumer Welfare in the
Cable Television Industry.” American Economic Review 91(3): 428-453. Chipty, T. and C. M. Snyder (1999). “The Role of Firm Size in Bilateral Bargaining: A
Study of the Cable Television Industry.” Review of Economics and Statistics 81(2): 326-340.
Federal Communications Commission (1994). Annual Assessment of the Status of
Competition in the Market for the Delivery of Video Programming. ______ (2004). Annual Assessment of the Status of Competition in the Market for the
Delivery of Video Programming. Ford, G. S. and J. D. Jackson (1997). “Horizontal Concentration and Vertical Integration in
the Cable Television Industry.” Review of Industrial Organization 12(4): 501-518. Goolsbee, A. and A. Petrin (2004). “The Consumer Gains from Direct Broadcast Satellites
and the Competition with Cable TV.” Econometrica 72(2): 351-381. Hart, O. and J. Tirole (1990). “Vertical Integration and Market Foreclosure.” Brookings
Papers on Economic Activity. Microeconomics 1990: 205-286. Katz, M. L., 1989, “Vertical Contractual Relations,” in R. Schmalensee and R. D. Willig
(eds.), Handbook of Industrial Organization, vol. 1: 655-721, Amsterdam: North-Holland.
Klein, B., R. G. Crawford, A. Alchian (1978). “Vertical Integration, Appropriable Rents,
and the Competitive Contracting Process.” Journal of Law and Economics 21(2): 297-326.

Machlup, F. and M. Taber (1960). “Bilateral Monopoly, Successive Monopoly, and Vertical Integration”, Economica, 27: 101-119.
Ordover, J. A., G. Saloner, S. Salop (1990). “Equilibrium Vertical Foreclosure.” American
Economic Review 80(1): 127-142. Owen, B. M. and S. S. Wildman (1992). Video Economics. Cambridge, Massachusetts:
Harvard University Press. Raskovich, A. (2003). “Pivotal Buyers and Bargaining Position.” Journal of Industrial
Economics 51(4): 405-426. Salinger, M. A. (1988). “Vertical Mergers and Market Foreclosure.” Quarterly Journal of
Economics 103(2): 345-356. Schmalensee, R. (1973). “A Note on the Theory of Vertical Integration,” Journal of
Political Economy 81: 442-449. Snyder, C. M. (1995). “Empirical Studies of Vertical Foreclosure”, in 1995 Industry
Economics Conference Papers and Proceedings, B. Hawkins (ed.). Canberra: Australian Government Publishing Service: 98-125.
Spengler, J. J. (1950). “Vertical Integration and Antitrust Policy.” Journal of Political
Economy 58(4): 347-352. Vernon, J. M. and D. A. Graham. (1971) “Profitability of Monopolization by Vertical
Integration,” Journal of Political Economy 79: 924-925. Waterman, D. and A. A. Weiss (1996). “The Effects of Vertical Integration between Cable
Television Systems and Pay Cable Networks.” Journal of Econometrics 72(1-2): 357-395.
Waterman, D. and A. A. Weiss (1997). Vertical Integration in Cable Television. Cambridge,
Massachusetts: The MIT Press. Waterman, D. and M. Z. Yan (1999). “Cable Advertising and the Future of Basic Cable
Networking.” Journal of Broadcasting & Electronic Media 43(4): 645-658. Williamson, O. E. (1971). “The Vertical Integration of Production: Market Failure
Considerations,” American Economic Review 61: 112-123.