Version 1 22/09/2008 - ESPON | Inspire Policy Making … · Web viewFourthly, socio-spatial...
73
TiPSE The Territorial Dimension of Poverty and Social Exclusion in Europe Applied Research 2013/1/24 Interim Report ANNEX 6 Progress Report on Social Exclusion Indicators Márton Czirfusz, Katalin Kovács, and Gergely Tagai Institute of Economics Hungarian Academy of Sciences December 2012
-
Upload
truongduong -
Category
Documents
-
view
213 -
download
0
Transcript of Version 1 22/09/2008 - ESPON | Inspire Policy Making … · Web viewFourthly, socio-spatial...

TiPSEThe Territorial Dimension of Poverty
and Social Exclusion in Europe
Applied Research 2013/1/24
Interim Report
ANNEX 6Progress Report on Social Exclusion IndicatorsMárton Czirfusz, Katalin Kovács, and Gergely Tagai
Institute of Economics Hungarian Academy of SciencesDecember 2012

This report presents the interim results of an
Applied Research Project conducted within the
framework of the ESPON 2013 Programme,
partly financed by the European Regional
Development.
The partnership behind the ESPON Programme
consists of the EU Commission and the Member
States of the EU27, plus Iceland, Liechtenstein,
Norway and Switzerland. Each partner is
represented in the ESPON Monitoring
Committee.
This report does not necessarily reflect the
opinion of the members of the Monitoring
Committee.
Information on the ESPON Programme and
projects can be found on www.espon.eu
The web site provides the possibility to
download and examine the most recent
documents produced by finalised and ongoing
ESPON projects.
This basic report exists only in an electronic
version.
ISBN number -
© ESPON &Nordregio, 2012.
Printing, reproduction or quotation is authorised
provided the source is acknowledged and a
copy is forwarded to the ESPON Coordination
Unit in Luxembourg.
ii

CONTENTS1 Context and goals...........................................................................................................1
2 Domains, dimensions and indicators..............................................................................2
3 Some notes on the territorial dimension of social exclusion...........................................3
4 Domains..........................................................................................................................5
5 Dimensions.....................................................................................................................7
6 Indicators......................................................................................................................11
7 Methodology.................................................................................................................18
8 Measuring social exclusion – a step-by-step approach................................................21
9 Discussion and preliminary policy implications.............................................................49
References..................................................................................................................................52
TABLESTable 1: Domains and dimensions of social exclusion recommended by WP2.1 and WP2.6 8
Table 2: Matching TiPSE’s domains and dimensions with Reimer (2004) and Philip and Schucksmith’s (2003) systems of social exclusion 9
FIGURESFigure 1: Measuring complex phenomena: possible methodologies 18
iii

MAPSMap 1: Net Adjusted Disposable Income per Capita (2007).......................................................22
Map 2: Activity Rate (population over 14 years, 2001)................................................................24
Map 3: Activity Rate Gender Gap (population over 14 years 2001)............................................25
Map 4: Activity Rate (population over 14 years, 2009)................................................................26
Map 5: Activity Rate Gender Gap (population over 14 years, 2009)...........................................27
Map 6: Unemployment Rate (2005)............................................................................................28
Map 7: Unemployment Rate Gender Gap (2005).......................................................................29
Map 8: Long-term Unemployment Rate (2007)...........................................................................30
Map 9: Healthy Life Expectancy (2007).......................................................................................32
Map 10: Share of Population with Primary Education or Less (2001).........................................34
Map 11: Share of Population with Tertiary Education (2001)......................................................35
Map 12: Gender Gap, Primary Level Educational Attainment (2001).........................................36
Map 13: Gender Gap, Tertiary Level Educational Attainment.....................................................37
Map 14: Share of Private Households with Lone Parent living with at least one child (2001).....40
Map 15: Total Dependency Ratio (2011).....................................................................................42
Map 16: Elderly:Child Ratio (2011)..............................................................................................43
Map 17: Share of Inhabitants with Citizenship outside the Reporting Country (2001)................47
iv

1 Context and goalsThis progress report on social exclusion indicators covers WP2.6 entitled ‘Development and Mapping of SE indicators’. The project proposal of ESPON TiPSE clearly describes the aims of WP2.6 and establishes links to other work packages. As page 23 of the Application form Part B states, the WP ‘aims to develop “mapable” indicators of social exclusion at the NUTS 3 or LAU 1 level’. WP 2.6 should establish explicit links to the definitions of social exclusion put forward in WP2.1 (cf. the draft ‘Review of concepts of poverty and social exclusion’, June 2012). The first part of this progress report therefore explains, how ‘academic’ definitions summarised in the aforementioned draft may be matched with Part IV of that report on ‘Implications for indicators’; i.e. how issues touched upon in academic literature are to be elaborated on in a meaningful way in cross-European regional mapping of territorial dimension of social exclusion.
As for the implementation of this mapping exercise, ESPON TiPSE project proposal advanced the simple proxy indicator methodology. In order to validate the usefulness of this approach, this progress report offers a short overview of possible methods of measuring different dimensions of (territorial) social exclusion. These aspects have already been highlighted in parts of WP2.1 draft paper ‘Review of concepts of poverty and social exclusion’, primarily in its appendices. However, WP2.1 did not aimed at putting emphasis on possibilities of ESPON-space comparisons and the availability of cross-European regional (NUTS 3 level) data. In this sense, this progress report distils some considerations from the academic debates and policy practices reported on in WP2.1, and triangulates these with first findings of WP2.3 on the TiPSE database (see WP 2.3 Working Paper 3).
In the chapter ‘Measuring social exclusion – a step-by-step approach’ we aim at showing the first results of mapping some dimensions and some proxy variables of social exclusion at the European level. According to the TiPSE project proposal, this has been done primarily on NUTS 3 level, but some notes will be further made on extending the database and the mapping on LAU 1 level (using primarily census data).
This paper ends with the discussion of the results and with some considerations for the EU-level policy-making regarding the mapping of social exclusion.
This progress report is meant to pave the way for the WP2.6 outputs defined in the project proposal, i.e. a) a methodological paper which will form a chapter in Part C of the Final Report, and b) set of maps on different aspects of social exclusion.
1

2 Domains, dimensions and indicatorsSocial exclusion and its ‘territorial dimension’ is a fuzzy concept in the academic literature and in the policy practice. WP2.1 already documented an extensive body of academic and policy literature on these concepts which is not needed to reformulate here. However, the review of academic practices has clear implications for the tasks to be undertaken in WP2.6, as far as how to operationalise these theoretical concerns in a cross-European regional level mapping exercise on different dimensions of territorial social exclusion.
One of the most important conclusions of WP2.1 for WP2.6 is that definitions of social exclusion, academic and policy practices are highly context-dependent, they reflect situated knowledges of researchers and policy-makers (cf. Haraway, 1988). They offer a partial view from partial closed spaces of the research or policy field of the particular studies and policy actions. Hence, they cannot be easily upscaled to an ESPON-space NUTS 3 level mapping of social exclusion. Nevertheless, the literature brought together in WP2.1 is essential in making decisions in ESPON TiPSE on domains, dimensions and indicators of social exclusion.
Social exclusion is a relational, dynamic and multifaceted phenomenon, according to Silver (1994), quoted in WP2.1 draft. Consequently, measuring and mapping (territorial) social exclusion should aim at finding indicators and proxy variables which
a) at least in some examples reflect the relational nature of the included and the excluded people / groups of people,
b) as exclusion is not only a state of ‘being in a society’ but also a process, apart from stock indicators flow indicators may be used as well (cf. also Madanipour et al, 2003),
c) cover several dimensions of social exclusion that are inseparable from each other but interact in complex ways and on different geographical scales (for this aspect, WP2.6 will only deliver inputs, results will be analysed in WP2.7 and WP2.8).
In this section, following some notes on the territorial dimension of social exclusion, domains, dimensions and indicators of ESPON TiPSE’s understanding of social exclusion will be introduced and discussed. This approach of having a three-level hierarchy is following the seminal study of Levitas et al. (2007) which differentiated between three subject groups and ten dimensions of social exclusion each of which measured by various indicators.
2

3 Some notes on the territorial dimension of social exclusion
ESPON TiPSE project not only focuses on social exclusion in general, but the overarching goal is to draw conclusions on the territorial aspects of the phenomenon. As WP2.1 noted, most of the EU policy documents are aware that there is some sort of spatiality in the distribution of poverty and social exclusion, but they more or less theorise ‘the spatial’ as an appearance, i.e. only registering that social phenomena differ over space.
Part II of WP2.1 emphasised that many of contemporary approaches speak of sites and spaces of exclusion, such as exclusive and inclusive spaces. Examples catalogued in that draft paper vividly show that most of these empirical studies are on ‘micro-level’ (such as exclusion within the city, in rural spaces and places etc.), and regional level studies focus largely on which natural, social and economic endowments regions possess of.
Social sciences in the past decades more or less univocally understand ontologies of ‘the social’ and ‘the spatial’ in their co-constitution (for an early example see Gregory and Urry, 1985). This approach dismisses the idea of space as being a stage on which social relations unfold, as well as the idea of abstract space which hase a pure distance-decay function (put forward by neoclassical economics). What this ‘new’ approach stressed instead is the view that social relations are constructed over space, and that space plays a role in how social relations are constructed (Massey, 1985; Sayer, 1985).
This understanding has some serious implications for the research done on social and spatial exclusion (also in the context of ESPON TiPSE). Firstly, spatiality of social exclusion is not something to be abstracted of in any research. In this sense, ESPON has a crucial role in directing policy-makers’ attention towards the idea that social exclusion is inherently spatial (at multiple scales) which must be considered in any policy-making practice.
Secondly, spatiality of social exclusion is not yet another dimension or aspect to be conceptualised. In this sense, maps on different dimensions of social exclusion (and specific indicators derived from these dimensions) show the co-constitution of society and space in a complex way; i.e. these maps have to be interpreted with this approach having in mind. ESPON TiPSE tackles this theoretical, methodological and ethical issue by combining mapping (WP2.6) and its interpretation (WP2.8) with case studies (WP2.4).
Thirdly, although the maps produced in WP2.6 may be easily interpreted as showing socially excluded NUTS 3 regions, one has to take into consideration that it is not the region which is excluded, but in the end people or groups of people. As social exclusion is an issue also tackled by EU’s regional policy, it is meaningful
3

nonetheless to map social exclusion on NUTS 3 level. For it is important to gather information which regions and in which meaningful ways may be targeted by EU’s regional policy to open up more inclusive realities for people living in these areas.
Fourthly, socio-spatial exclusion is a multi-scalar phenomenon. Although current literature on the social constructedness of scale (Herod, 2011) challenges that different social phenomena can be meaningfully linked to pre-constructed ‘levels’ and territorialisations of space, a consequence for ESPON TiPSE is to elaborate on the multi-scalarity of social exclusion. Hence, different dimensions of social exclusion have different importance on certain geographical scales. This means that a mixed-method approach with a combination of NUTS 3 (and LAU 1) level mapping and qualitative micro-level case studies would tell us something about how social exclusion actually takes place. In fact, NUTS 3 level mapping alone can also reveal some aspects of the multi-scalarity of social exclusion. To name a few examples, intra-household exclusion may be indicated by the proportion of inactive population (housewives are also within this group); ethnic/migrant composition of a region may indicate neighbourhood-level exclusion in urban areas; NUTS 3 level data on access to cultural institutions (such as a library) or passenger car density within the population may reveal that inhabitants of small villages within a rural region are facing social exclusion. State-level social policies (such as laws on social transfers) impact undoubtedly NUTS 3 level data as well.
This summary on the territorial dimension of social exclusion attempted to put forward some key theoretical issues on how ‘the social’ and ‘the spatial’ interact, the co-constitution of which may interfere with the mapping exercise of WP2.6. Some further notes will be made in the methodological and concluding part of this progress report.
4

4 DomainsWP2.1 identified different domains of social exclusion. According to Reimer (2004) and Philip and Shucksmith (2003), social exclusion operates in an interrelated way through four overlapping major social systems:
1. Market relations, or private systems,2. Bureaucratic relations, or state administrative systems,3. Associative relations, i.e. collective action processes based on shared interests,4. Communal relations, based on shared identity, among family and friends networks.
This concept of different relations undoubtedly helps in making sense of how social relations unfold (also over space) in order to exclude or include people or groups of people. Nevertheless, for TiPSE they represent an abstract level of social exclusion which has to be measured by some ‘clear’ indicators which are meaningful and available at NUTS 3 regional level in the ESPON countries. Because of these limitations, WP2.1 has already identified four domains of social exclusion for the mapping exercise:
1. Earning a living,2. Access to basic services,3. Social environment,4. Political participation.
WP2.1, however, did not established the conceptual links between Philip and Shucksmith’s social systems and ESPON TiPSE’s domains. There is more-or-less a direct link between the two, but some deviations will be summarised in the following chapter on ESPON TiPSE Indicators.
EU level policies’ frameworks changed in the past whether they identify domains of social exclusion. As WP2.1 noted, EU-commissioned research in 1998 identified five domains (factors) that cause social exclusion, namely social, economic, institutional, territorial factors and symbolic references (European Commission 1998). Hence, a difference should be made between a) domains–dimensions–indicators along which causes of social exclusion may be measured, and b) domains–dimensions–indicators along which policy intervention can tackle social exclusion. A slightly similar approach is adopted by a Polish case study which differentiates between ‘symptoms’ of social exclusion and refers also to the monitoring of policy intervention by assessing subjective exclusion consequences (for the latter, survey data was used) (Ministry of Labour and Social Policy and UNDP 2006).
EU level policies following the 1998 report focused more on the ‘Earning a living’ domain. WP2.1 concluded that the Lisbon Strategy and its relaunch in 2005 shifted the emphasis from economic and social cohesion to growth and jobs; which means that the policy discourse is focused on coping social exclusion by job-creation and increasing (per capita) income. The EU 2020 agenda – also cited in WP2.1 – on the
5

one hand pushes forward a slightly different understanding by emphasising social exclusion throughout the life-cycle, on the other hand the growth-related understanding of social exclusion did not changed at all. In this sense, the approach followed by the EU policy-making corresponds to only one or two of the three characteristics of social exclusion referred to earlier in this progress report (relationality, process-orientation and multidimensional character). Relationality of social exclusion is considered one-sidedly, as relations between the ‘excluded’ and the ‘included’ are narrowed down to economic, growth-related issues (i.e. exclusion can be solved only by the fact that some ‘included’ people are working and producing added-value in the economy). Process-orientation of social exclusion is covered by focusing EU policy on a process (growth), and not on some static goal. Multi-dimensionality of social exclusion is, however, fully omitted. Mostly the same approach was followed in the aforementioned Polish study which conceptualised social exclusion as having two areas: exclusion from the labour market and exclusion from the market of goods and services (consumption), thereby offering a ‘pure economic’ perspective of the phenomenon (for the details see Ministry of Labour and Social Policy and UNDP 2006).
There are other examples, however, which take into account different, non-economic areas of social exclusion. UNDP (2011) differentiates between exclusion from economic life, social services, civic and social participation; and the OMC (Open Method of Coordination on Social Protection and Social Inclusion) also follows the same approach with the following domains: income (poverty), material deprivation, health, (low) educational attainment, access to the labour market, access to social care (discussed in detail in the Dortmund paper of Team HAS).
Neither approach is capable necessarily of solving the conceptualisation problem of social exclusion in all prevailing socio-spatial contexts or ‘welfare regimes’ throughout Europe. For example, several studies in post-socialist countries (with research undertaken already before the 2008 crisis) analysed the emerging group of working poor, which means that people with jobs are also facing poverty and social exclusion in this region (Smith, Stenning, Rochovská, Świątek, 2008). Although many (mostly theoretical) criticisms on the active inclusion through employment approach were cited by WP2.1, it is also important to note that it is exactly the territoriality (or socio-spatial embeddedness) of social exclusion because of which cross-European, univocal understandings and ‘treatments’ may fail in the end. In this sense, the EU’s reformed regional policy focusing on place-based approaches would establish a good opportunity to take into account the variegated socio-spatial contexts of exclusion.
6

5 DimensionsWP2.1 identified four domains of social exclusion for the TiPSE project to be used in the mapping exercise. To operationalise these four domains, several ‘dimensions’ should be chosen as the next step.
Although explicit domains of social exclusion are mostly missing from European policy-related documents (but these can be elaborated on ‘inductively’ in research overviews such as WP2.1 or WP2.6 of TiPSE), dimensions of poverty and social exclusion are present in many cross-European and national social policy documents. As WP2.1 offered an extensive overview of them, only the European level will be discussed further in this paper.
Poverty is not a central concept in WP2.6, and poverty is mostly defined one-sidedly, only relating to material-financial assets. Some documents move towards a multi-dimensional understanding though, as identifying dimensions of poverty is present in some documents of the EU policy. As an example, also referred to in WP2.1, the European Commission’s Platform against Poverty and Social Exclusion monitors and targets social exclusion with using three dimensions: the at-risk-of-poverty rate after social transfers, the index of material deprivation (lacking 4+ deprivation items) and the percentage of people living in households with very low work intensity (Bradshaw and Mayhew, 2010).
The Fifth report on economic, social and territorial cohesion (European Commission 2010) identified different aspects of social exclusion. In the evaluation of the impacts of cohesion policy, the document takes into consideration the important role of cohesion policy in reducing unemployment and increasing employability, as well as in tackling disadvantages in education and training. Moreover, it discusses the contribution ERDF made by funding infrastructural investments throughout Europe. All of these aspects are covered by ESPON TiPSE’s proposal on the different dimensions and indicators of social exclusion (compare with the next chapter of this progress report). In the Fifth cohesion report the multi-dimensional character of exclusion is discussed as to be tackled by identifying vulnerable groups (whose constitution as a separate group reflects different dimensions of their social exclusion), such as ‘people with special needs’, ‘migrants and minorities’, ‘asylum seekers’ or ‘Roma people’ (pages 227–230.). Targeted may it sound, and not calling into question the easiness of this understanding in the policy practice, an inherent problem in this approach is the stigmatisation of whole groups of people as being excluded (because they are migrants or because they are Roma). Having said that, ESPON TiPSE (forthcoming work packages) will in some aspects aim at the verification these approaches by cross-comparisons of several dimensions and its indicators (such as the dimension of ethnic composition or that of immigrants with the employment dimension).
7

Another sectoral policy discussed by WP2.1 is the common agricultural policy (CAP). In the past decades the emphasis of CAP shifted from direct subvention of agriculture to a multi-faceted rural development agenda. In this sense, the EU is targeting with the common agricultural policy-making one territorial appearance of social exclusion, namely that of rural areas and of people living in rural areas. A logical conclusion to be drawn is that industrial structure of regional economies (e.g. agriculture’s share in the GDP or in the employment) may also be considered as one possible dimension in the ‘Earning a living’ domain, to be touched upon by ESPON TiPSE. It will not be considered among the indicators in this project, however. The main reason for that is that the sectoral composition of regional economies is in non-mutual relationship with the vulnerability to social exclusion (e.g. higher percentage of the manufacturing industry may indicate a region of industrial decline with higher social exclusion or prosperous manufacturing with less social exclusion).
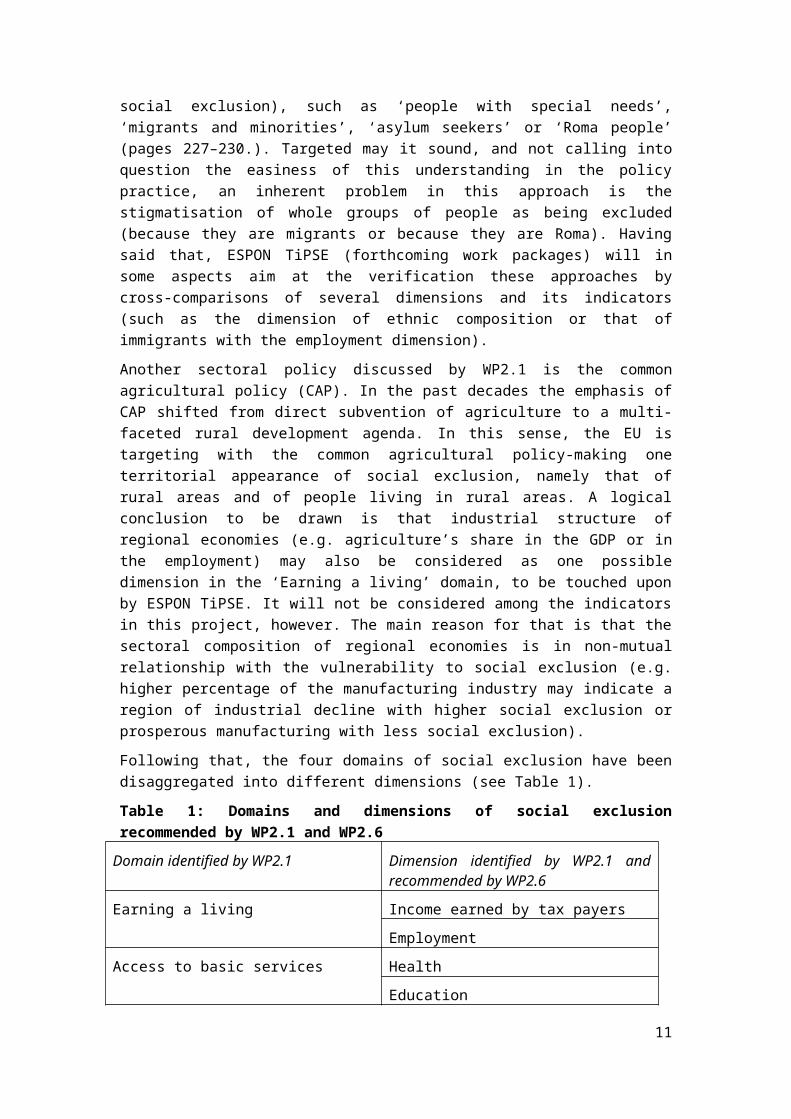
Following that, the four domains of social exclusion have been disaggregated into different dimensions (see Table 1).
Table 1: Domains and dimensions of social exclusion recommended by WP2.1 and WP2.6
Domain identified by WP2.1 Dimension identified by WP2.1 and recommended by WP2.6
Earning a living Income earned by tax payers
Employment
Access to basic services Health
Education
Housing
Transport and communication
Social environment Age
Ethnic composition
Immigrants
Crime and safety
Income from property taxes
Spending on social assistance
Political participation Citizenship
Voters
Civic engagement
Using this approach, a vast majority of dimensions covered by EU level and member states’ social policy are taken into account. Moreover, they reflect the multi-dimensionality of social exclusion which is the mainstream understanding in the academic discourses evaluated in WP2.1, and they also address Reimer (2004) and
8

Philip and Schucksmith’s (2003) four overlapping social systems, further specified in Table 2.
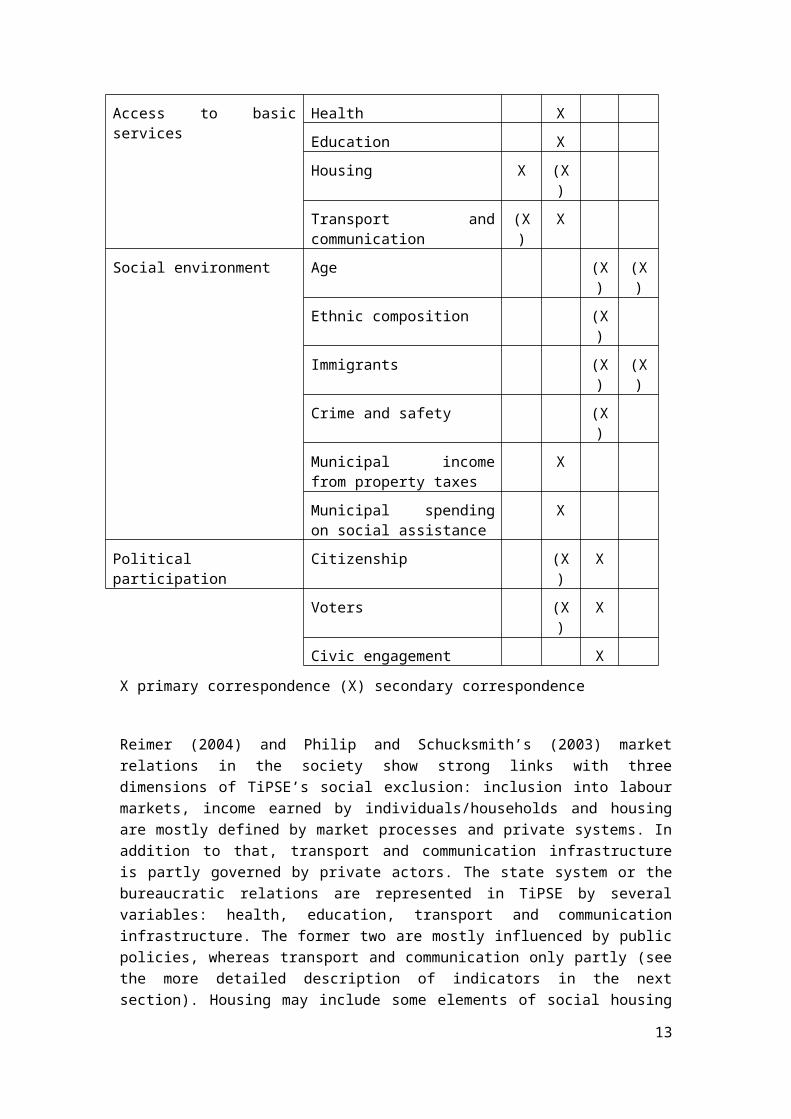
Table 2: Matching TiPSE’s domains and dimensions with Reimer (2004) and Philip and Schucksmith’s (2003) systems of social exclusion
Domain identified by WP2.1 Dimension identified by WP2.1 and recommended by WP2.6
Reimer (2004) and Philip and Schucksmith’s (2003) social systems
Mar
ket
re
latio
ns
(Priv
ate
syst
ems)
Bur
eauc
ratic
re
latio
ns
(Sta
te
Ass
ocia
tive
rela
tions
(v
olun
tary
sys
tem
s)C
omm
unal
rel
atio
ns
(fam
ily a
nd fr
iend
s)
Earning a living Income earned by tax payers
X
Employment X
Access to basic services Health X
Education X
Housing X (X)
Transport and communication
(X) X
Social environment Age (X) (X)
Ethnic composition (X)
Immigrants (X) (X)
Crime and safety (X)
Municipal income from property taxes
X
Municipal spending on social assistance
X
Political participation Citizenship (X) X
Voters (X) X
Civic engagement X
X primary correspondence (X) secondary correspondence
Reimer (2004) and Philip and Schucksmith’s (2003) market relations in the society show strong links with three dimensions of TiPSE’s social exclusion: inclusion into
9

labour markets, income earned by individuals/households and housing are mostly defined by market processes and private systems. In addition to that, transport and communication infrastructure is partly governed by private actors. The state system or the bureaucratic relations are represented in TiPSE by several variables: health, education, transport and communication infrastructure. The former two are mostly influenced by public policies, whereas transport and communication only partly (see the more detailed description of indicators in the next section). Housing may include some elements of social housing (as part of the municipal or state policy), political participation includes some associations with the role of the state, therefore both of these are considered as secondary constitutive within the dimensions. Associative relations, collective action processes cover realms of social life where relationships based upon shared interests within a group are taken into account. Primarily these may be linked to various aspects of political participation (citizenship, voting intentions and civic engagement), secondary these are related to different dimensions of identification and identity-building factors (age, ethnicity, migrant background, criminality). Communal relations (or relations with friends and families leading to social exclusion) is probably the least covered aspect of ESPON TiPSE. This social system may be operationalised, measured and quantified in a cross-European comparative study in an uneasy way. Consequently, there are only two dimensions somewhat implying characteristics of family and friends relationships.
10

6 IndicatorsFollowing the identification of domains and dimensions of social exclusion for ESPON TiPSE, key indicators or variables of the different dimensions should be clarified. In this phase, theoretical considerations of WP2.1 and WP2.6 outlined earlier in this progress report are to be matched with findings of WP2.3. Major criteria of finding suitable indicators are the following:
a) the indicator represents the dimension (and the domain) of social exclusion in a meaningful way;
b) the chosen indicator is most possibly an established or potential key variable in social policies throughout Europe (this aspect is important for the policy-implications of the ESPON project);
c) data is available at least at NUTS 3 level (LAU 1 data availability will be examined if possible in the future).
At the present stage of the project, criteria a) and b) were considered, therefore the indicator list is provisional in some aspects. For some dimensions and indicators, criterion c) will be discussed in the section ‘Measuring social exclusion – a step-by-step approach’. Full indicator list will be delivered in the final methodological paper of WP2.6.
The review of EU and member states’ policies on social exclusion in WP2.1 clearly showed that measurement and monitoring of social exclusion is based on indicators which in majority of the cases are not grouped in dimensions and domains. Hence, there is a marked difference between the approach of ESPON TiPSE – which follows a deductive way of making sense of the world by starting with theories and distilling these to indicators – versus that of social policy – which approaches inductively, i.e. it starts with collecting and interpreting indicators in order to draw conclusions on processes of social exclusion on the more abstract and more general level.
However, it is possible to establish conceptual links between the four domains of ESPON TiPSE and the indicators of different social policy practices.
WP2.1 already emphasised that EU level policy (such as the Laeken indicators) are more focused on the domains ‘Earning a living’ and ‘Access to basic services’. Consequently, they fail to correspond the three criteria of relationality, process-orientation and multi-dimensionality referred to earlier in this paper.
Other studies cited in WP2.1 focus more on the lack of social integration. This approach covers predominantly the Social environment and the Political participation domains of ESPON TiPSE. As for the mapping exercise undertaken in WP2.6, these indicators are hardly useful, as data are collected during extended fieldwork via sampling and survey-methodology, and are not available in a harmonised way for a reliable cross-European comparison. (For example, Eurobarometer’s studies offer
11
representative regional level data either on NUTS 1 level – mostly in countries with smaller population – or on NUTS 2 level.)
Yet another group of studies referred to in WP2.1 uses indicators which identify vulnerable social groups (drug addicts, homeless people etc.) by using context-variables in a more direct, one-dimensional way than our approach is. As those studies stigmatise ‘ex ante’ by referring to one dimension (a surface appearance) as a sole cause of social exclusion – e.g. homeless people are socially excluded and they are excluded because they are homeless (cf. Mitchell, 2011) –, this approach will not be followed in ESPON TiPSE.
As the further step, indicators of social exclusion were gathered to all domains and dimensions. Table 3 contains the indicative list of variables at this stage of the project.
12

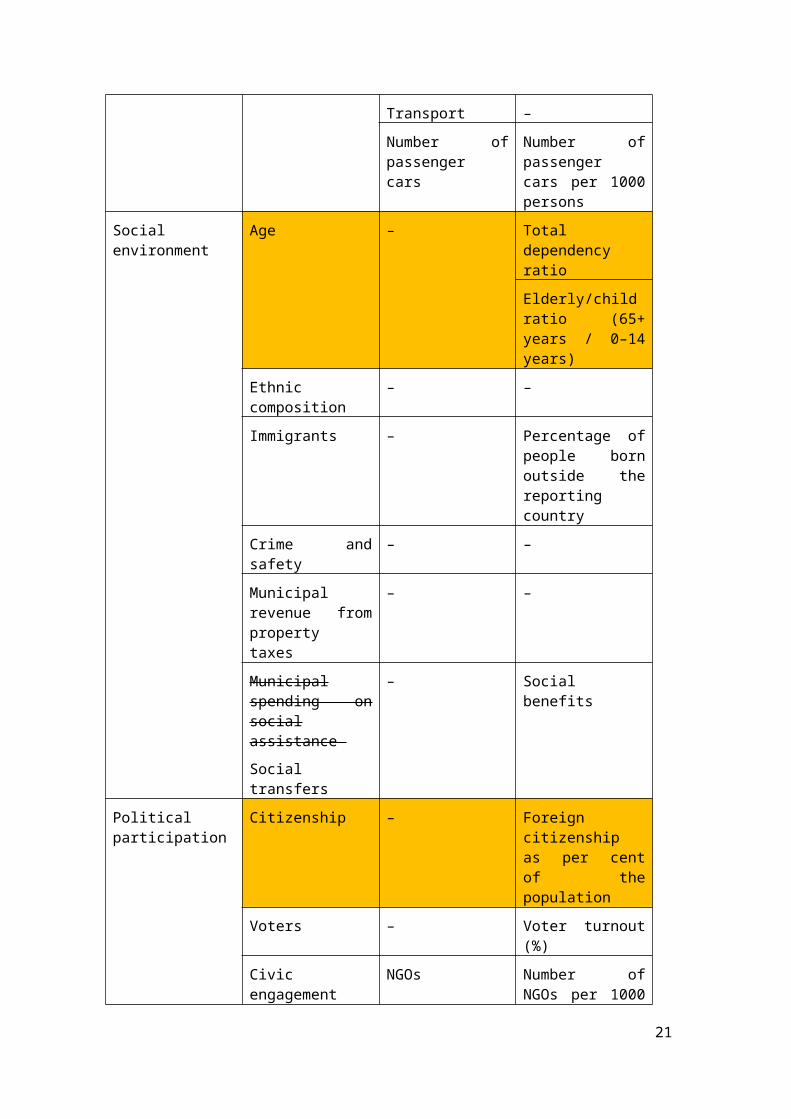
Table 3: ESPON TiPSE indicators of social exclusion by dimensions and domains
Domain identified by WP2.1
Dimension identified by WP2.1 and recommended by WP2.6
Indicator recommended by WP2.1
Indicator further specified by WP2.6
Earning a living Income earned by tax payers
Income earned by tax payers
Income earned by tax payers (per capita) ORcompensation of employees (ESA95, 4.02) per capita OR gross wages and salaries (ESA95 4.03 and 4.04) per capita
Employment Employed Employment rate (%)
Gender gap of employment rate (percentage points)
Unemployed Unemployment rate (%)
Gender gap of unemployment rate (percentage points)
Inactive Activity rate (%, aged 14+)
Gender gap of activity rate (percentage points)
Long-term unemployed
Long-term unemployment rate (%)
Gender gap of long-term unemployment rate (percentage points)
Jobless households
Ratio of jobless households (%)
Access to basic Health Access to primary Physicians and
13
services health doctors per 100,000 inhabitants
Healthy life expectancy
Healthy life expectancy (years)
Education Pre-school access Participation rates of 4-years olds in education
Primary school access
Pupils in primary and lower secondary education (ISCED 1-2) – as % of total population
Cultural house / library access
Percentage of people with access to a cultural house or library
Educational attainment: primary or less than primary education (ISCED levels 0–1)
Percentage of people (aged 14+) with less than primary or primary education (below ISCED levels 0–1)
Gender gap of male and female people (aged 14+) with less than primary or primary education (ISCED levels 0–1, percentage points)
Educational attainment: tertiary education (ISCED 5–6)
Percentage of people (aged 24+) with tertiary education (ISCED levels 5–6)
Gender gap of male and female people (aged 24+) with tertiary education (ISCED levels 5–6, percentage points)
Housing Tenure status of households
–
– Percentage of
14

people living in vulnerable household status (household status types being vulnerable to social exclusion will be discussed later)
– Percentage of people living in vulnerable family status (family status types being vulnerable to social exclusion will be discussed later)
– Percentage of people living in overcrowded housing units (density standard above a certain threshold)
Transport and communication
Post office Percentage of people with access to a post office (or: post offices per 10,000 inhabitants)
Broadband internet
Percentage of people with broadband internet access
Transport –
Number of passenger cars
Number of passenger cars per 1000 persons
Social environment
Age – Total dependency ratio
Elderly/child ratio (65+ years / 0–14 years)
Ethnic composition
– –
Immigrants – Percentage of people born
15

outside the reporting country
Crime and safety – –
Municipal revenue from property taxes
– –
Municipal spending on social assistance
Social transfers
– Social benefits
Political participation
Citizenship – Foreign citizenship as per cent of the population
Voters – Voter turnout (%)
Civic engagement NGOs Number of NGOs per 1000 persons
Members of NGOs Members of NGOs per 1000 persons
Note: dimensions and indicators covered by this progress report are marked in orange.
The datasets used in ESPON TiPSE project – as specified in the project proposal – are mainly from Eurostat. Pros and cons using Eurostat data are the following:
harmonised data for all member states, therefore data is ‘fully’ comparable (metadata offers some hints on the geographical cross-comparability);
longitudinal comparisons are possible (e.g. between census data of 2001 and 2011);
easy-for-use datasets, available free of charge;
not all data is available on NUTS 3 level;
few of the dimensions of social exclusion are covered in Eurostat datasets.
Several data is only available from censuses in either some or most or all of the countries. Regional breakdowns of the 2011 census period are not available at the present stage of the project, but will be expected to access in the course of the project (cf. WP2.3 Working Paper 3). EC Regulation 763/2008 Article 5 (2) states that “Member States shall provide the Commission (Eurostat) with final, validated and aggregated data and with metadata, as required by this Regulation, within 27 months of the end of the reference year [2011].”, this means that data will be available no later than March 2014.
In this progress report, some indicators of social exclusion will be mapped using comparable Eurostat datasets. Another goal is to identify variables for further use, on
16

the basis of the 2001 census round (see also the data fiches of WP2.3) and Eurostat information on the data of the 2011 census round.
Further considerations have been made whether to use other data sources from all of ESPON countries’ national statistical offices and other official or non-official data producers. This exercise is however not easy, as the TiPSE project and TiPSE’s project partners do not possess capabilities of a statistical institution in harmonising different datasets which use different methodologies. Some tentative figures will still be elaborated on later in the project (at least not for the whole ESPON-space but for some countries – e.g. for those in the case studies).
Several studies use survey-based data indicators in identifying causes and consequences of social exclusion. Thereby, they try to tackle shortcomings of above-mentioned understandings, namely that for example the Laeken indicators do not include any measurement of social isolation or subjective well-being (cf. Lelkes 2006, and the Dortmund paper of Team HAS). As these kinds of statistics are not available for a cross-European comparison in the above-mentioned databases, ESPON TiPSE does not aim to cover these aspects explicitly. However, some conclusions will be drawn from the case studies (WP2.4) regarding ‘subjective’ dimensions of social exclusion.
17

7 MethodologyWithin the social sciences research practice several methods exist how to measure multifaceted social phenomena and how to make sense of the empirical world ‘outside’. In this section several options for tackling this issue are discussed, and conclusions will be drawn for firstly, measuring social exclusion in general in the TiPSE project. Secondly, certain implications for geographical or territorial analyses will be examined.
As already outlined in WP2.1, social exclusion is mostly understood in a logocentric way in the literature. This means that social exclusion ‘as such’ is thought of to be existing in an ordered world which can be fully accessed by means of scientific research. This practice is undertaken in TiPSE by extensive research and quantification (WP2.3 and WP2.6) and by intensive research (WP2.4’s case studies) (cf. Sayer, 1992). In ESPON TiPSE, data analysis is having less an exploratory character in the sense that understanding of social exclusion as a concept would be constructed by interpreting datasets. Rather, TiPSE uses a deductive way of thinking by constructing domains and dimensions of social exclusion before the data collection and mapping exercise starts. WP2.1 also referred to social exclusion as a multidimensional phenomenon (or process) whose dimensions are intersecting, i.e. there are certain overlaps and/or causal relations between them. The dimensions should be measured by several indicators in the course of any project dealing with multifaceted phenomena.
In the quantitative social sciences literature there exist several methods for measuring complex phenomena. The most prevailing methodologies are summarised in Figure 1.
Figure 1: Measuring complex phenomena: possible methodologies
18

a) The easiest solution in capturing a multidimensional phenomenon is to use one proxy variable. The theoretical underpinning is that this sole indicator represents the whole complexity exactly because the dimensions are interlinked in a causative way. WP2.1 already noted some examples fitting into this group. For example, if social exclusion and poverty is used interchangeably in research practice, and poverty is conceptualised and operationalised as equalling people with an income below 60% of the equivalised disposable national median (after social transfers), then per capita income is regarded as a simple proxy variable of social exclusion. Another example is from EU’s regional policy where regional per capita GDP and GNI are sole variables for measuring development. It is unquestionable that this approach is easy to understand, easy to implement in policy discourse, there are no high-excess data collecting and data processing costs in governing the society. On the other hand, this approach oversimplifies social realities in a vast majority of cases.
b) A more complex way of operationalising research on multifaceted issues is to use more than one proxy variables. Here, the deductive way of thinking starts with conceptualising a phenomenon by constructing several dimensions. These may be hypothesised as being interlinked, or being separate and showing separable aspects. The dimensions may be then measured by one single indicator per dimension, or several indicators are considered for each of the dimensions. For example, UNDP (2011) operationalised 3 dimensions of social exclusion with 8 indicators each (24 altogether), then for all cases (here: individuals and not regions) it was assessed in how many indicators one is socially excluded (for all the indicators certain thresholds were used). The approach of identifying different dimensions and several indicators for each of them is followed by ESPON TiPSE, as it was described in the preceding parts of this progress report in detail. The considerations for this choice are that it is more complex than a simple variable method (thereby offering a more nuanced understanding of social exclusion), and that it is still simple enough to implement in social policies at the EU, national and regional scales. This approach leaves a considerable room for manoeuvre in the further course of the project regarding capturing interlinkages across dimensions and indicators: the next work packages of ESPON TiPSE will elaborate on this aspect as well.
c) The third option is to use a standardised complex variable for measuring complex social phenomena. For example, in the English Indices of Deprivation 38 separate indicators grouped into seven domains are used; income, employment, health, education, crime, access to services and living environment, inter alia. Each domain has a distinct weight in the complex index calculated using the 38 variables (http://www.communities.gov.uk/documents/statistics/pdf/1871208.pdf). This understanding is also followed by the UN and other national and supra-national policy actors in using the Human Development Index (HDI) or the Human Poverty Index (HPI) in conceptualising and operationalising development or poverty (for a European example at NUTS 2 level see Bubbico and Dijkstra, 2011). This method may be understood as the follow-up of b) – identifying dimensions, each of which measured by one or two variables, then these variables forming a simple composite variable after various mathematical transformations. The normalization of variables is done by using descriptive statistics (maximum and minimum) of the variables in the case of HDI and HPI, and the weighting of the disparate aspects is possible in
19

combining the dimensions into the index. Regarding the (in)separability of the dimensions, this method is quite Janus-faced. On the one hand it tells apart different dimensions (and represents them as having no interlinkages between them; if there were any, then it would be possible to look only at one of the correlating dimensions), on the other hand with the practice of calculating the average of the dimensions for the index it underlines that the dimensions are interchangeable (i.e. human development may be increased by a better educational attainment in the same way as with extending life expectancy).
d) The most complicated possibility is to use complex mathematical-statistical methodology, such as multi-dimensional regression, factor or principal component analysis. When using multi-dimensional regression (such as in PovMap) one aims to capture an unknown phenomenon by a combination of different variables for which there is a data coverage. The aim of the factor and principal component analysis is to reduce the number of variables by combining them into dimensions (factors) which are statistically independent from each other. Whereas in some cases factor analysis offers a meaningful way to capture multifaceted social phenomena (such as social exclusion), it is still a complicated method which is not really capable of channelling into social policy. Another problem is the comparability of the method: in different spatio-temporal contexts the results (factors) are different, thereby hardly comparable. Moreover, the method is based on a certain black-boxing: it uses a huge dataset as an input and results in factors as an output, but what happens during the calculation process is blinded out by the method itself. As one of the consequences, it is quite problematic when we try to understand mechanisms among different aspects of social exclusion. Another limitation for territorial analyses is that the method itself is not capable of saying anything about the spatiality and spatial structure of the phenomenon in question (as during the method correlations are calculated between variables and not between regions), and the results of the factor analysis is only valid at the geographical scale of the data (for a further discussion see Czirfusz, 2010). Another possibility of using sophisticated mathematical transformations for getting social exclusion indices is presented in a Polish case study (Ministry of Labour and Social Policy and UNDP 2006, Annex 2).
In ESPON TiPSE, WP2.6 puts forward a methodology of b) – to use different proxy variables for different dimensions of social exclusion throughout Europe. Still, as we also aim at comparing these dimensions and indicators later on in the project, all of the data will be mapped using quintiles in the legend (quintiles are defined using the whole dataset, not the countries’ data separately). This means that the maps are easily comparable, results are easy to communicate for social policy implications, geographical differences are easier to understand with using this visualisation technique. However, we are also aware of the limitations of this approach, namely that this understanding implies that there are X percent of each society which is socially excluded or is vulnerable to social exclusion.
20

8 Measuring social exclusion – a step-by-step approach The following part introduces all of the domains, dimensions and indicators to be used by ESPON TiPSE (see also Table 3). This progress report does not aim at offering a viable solution for measuring every dimension, but tentative maps, and solutions for overcoming methodology and data availability issues will be offered for each of the indicators.
8.1 Earning a living
8.1.1 Income earned by tax payers
Short description: Statistical data on income of persons and households is one of the key dimensions and indicators of poverty and social exclusion. Thereby, including it into social exclusion dimensions is unquestionable.
Data availability: Eurostat data on disposable and primary income of households is available within the tgs00026 and tgs00036 datasets, respectively, but only for NUTS 2 regions (see the map on the next page). Regional economic accounts (reg_ecobrch) cover some data on NUTS 3 level, but not income-related statistics. Most recent statistics are from year 2009. The same applies for social transfers (see later).
Census 2001 coverage: not applicable.
Census 2011 coverage: not applicable.
Comments: WP2.3 also noted that data on disposable income is only available in Eurostat datasets on the NUTS 2 level. The ESPON 2013 project which covers this aspect, ReRisk, includes disposable income per capita for NUTS 2 regions (year 2004–2005). Therefore, national statistical sources should be consulted in the later course of TiPSE. As national accounts are calculated on the basis of comparable ESA95 methodology, regional economic accounts on ‘compensation of employees (ESA95, 4.02) or ‘gross wages and salaries’ (ESA95, 4.03 and 4.04) may be suitable substitutes if available on NUTS 3 level in official statistical sources (cf. http://epp.eurostat.ec.europa.eu/cache/ITY_SDDS/EN/nama_esms.htm).
21
!
! ! !
!
!
!
!
!
!
!!!
!
!
!
!
!
!
!
!
!!
!
!!
!
!
!
!
!
!
!
!
!
!
!
!
!
!
!
!
!
!
!
!
!!
!
!
Acores
Guyane
Madeira
Réunion
Canarias
MartiniqueGuadeloupe
Valletta
Roma
Riga
Oslo
Bern
Wien
Kyiv
Vaduz
Paris
Praha
Minsk
Tounis
Lisboa
Athina
Skopje
Zagreb
Ankara
MadridTirana
Sofiya
London
Berlin
Dublin
Tallinn
Nicosia
Beograd
Vilnius
Kishinev
Sarajevo
Helsinki
Budapest
Warszawa
Podgorica
El-Jazair
Stockholm
Reykjavik
Křbenhavn
Bucuresti
Amsterdam
Luxembourg
Bruxelles/Brussel
Ljubljana
Bratislava
Regional level: NUTS xxSource: xxx, year
Origin of data: xxx, year© EuroGeographics Association for administrative boundaries
This map does notnecessarily reflect theopinion of the ESPONMonitoring Committee
Net Adjusted Disposable Income per Capita, 2007
© TEAM XXX, Project, Year
0 214 748 364 107 374 1820 500250
km
Income index (EU=100)125 - 235110 - 12595 - 11080 - 9565 - 8023,1 - 65
Map 1: Net Adjusted Disposable Income per Capita (2007)Map by Gergely Tagai.
22

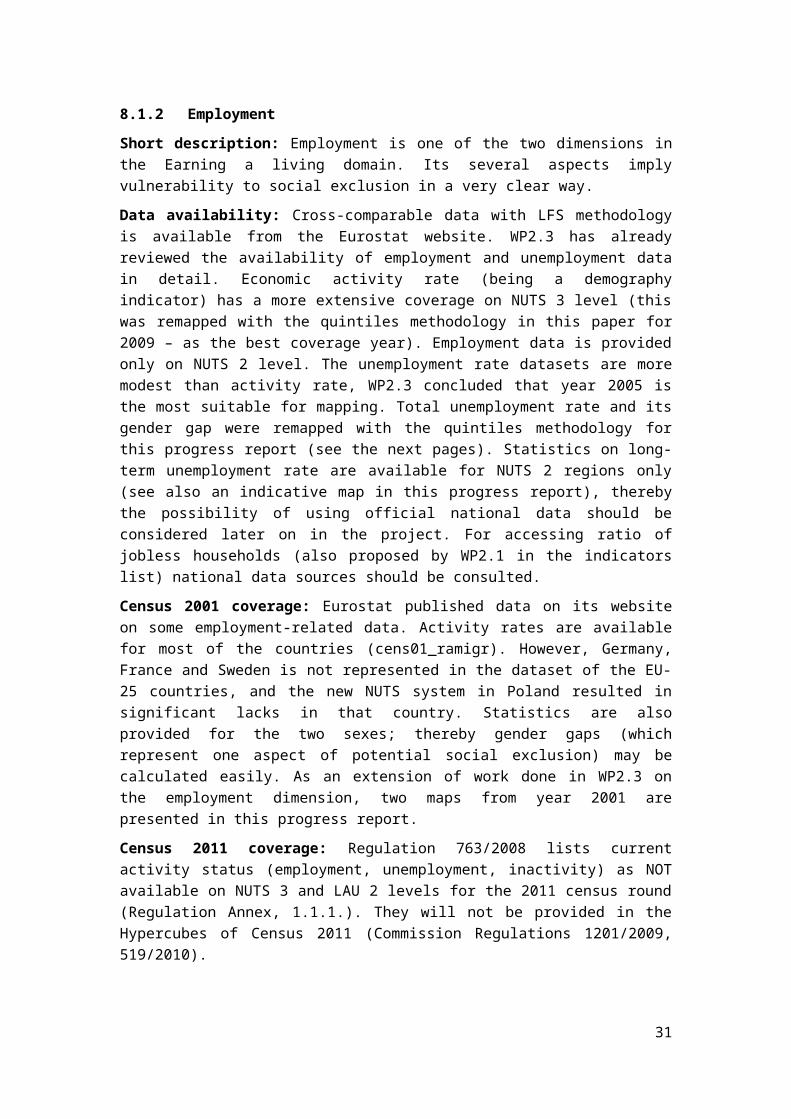
8.1.2 Employment
Short description: Employment is one of the two dimensions in the Earning a living domain. Its several aspects imply vulnerability to social exclusion in a very clear way.
Data availability: Cross-comparable data with LFS methodology is available from the Eurostat website. WP2.3 has already reviewed the availability of employment and unemployment data in detail. Economic activity rate (being a demography indicator) has a more extensive coverage on NUTS 3 level (this was remapped with the quintiles methodology in this paper for 2009 – as the best coverage year). Employment data is provided only on NUTS 2 level. The unemployment rate datasets are more modest than activity rate, WP2.3 concluded that year 2005 is the most suitable for mapping. Total unemployment rate and its gender gap were remapped with the quintiles methodology for this progress report (see the next pages). Statistics on long-term unemployment rate are available for NUTS 2 regions only (see also an indicative map in this progress report), thereby the possibility of using official national data should be considered later on in the project. For accessing ratio of jobless households (also proposed by WP2.1 in the indicators list) national data sources should be consulted.
Census 2001 coverage: Eurostat published data on its website on some employment-related data. Activity rates are available for most of the countries (cens01_ramigr). However, Germany, France and Sweden is not represented in the dataset of the EU-25 countries, and the new NUTS system in Poland resulted in significant lacks in that country. Statistics are also provided for the two sexes; thereby gender gaps (which represent one aspect of potential social exclusion) may be calculated easily. As an extension of work done in WP2.3 on the employment dimension, two maps from year 2001 are presented in this progress report.
Census 2011 coverage: Regulation 763/2008 lists current activity status (employment, unemployment, inactivity) as NOT available on NUTS 3 and LAU 2 levels for the 2011 census round (Regulation Annex, 1.1.1.). They will not be provided in the Hypercubes of Census 2011 (Commission Regulations 1201/2009, 519/2010).
Comments: Year-by-year data is available from the Eurostat website, although some aspects are not covered on NUTS 3 level. LFS methodology results in an easy comparability of data throughout Europe. Lack of data may be mitigated by using different national official sources, if available. This is not necessarily needed, however, as existing Eurostat indicators may cover the significant bulk of vulnerability to social exclusion because of (un)employment. An emerging topic and indicator in Europe in the post-2008 period is the high youth unemployment rate. Including this in the TiPSE datasets may be considered later on (although most recent NUTS 3 data coverage is not full at all – compare WP2.3). Census 2011 data unavailability is a serious limitation for the TiPSE project.
23
Map 2: Activity Rate (population over 14 years, 2001)
24

Map 3: Activity Rate Gender Gap (population over 14 years 2001)
Note: Positive numbers = higher female activity rate and vice versa
25

Map 4: Activity Rate (population over 14 years, 2009)
26

Map 5: Activity Rate Gender Gap (population over 14 years, 2009)
Note: Positive numbers = higher female activity rate and vice versa
27

Map 6: Unemployment Rate (2005)
28

Map 7: Unemployment Rate Gender Gap (2005)
Note: Positive numbers = higher female activity rate and vice versa
29

!
! ! !
!
!
!
!
!
!
!!!
!
!
!
!
!
!
!
!
!!
!
!!
!
!
!
!
!
!
!
!
!
!
!
!
!
!
!
!
!
!
!
!
!!
!
!
Acores
Guyane
Madeira
Réunion
Canarias
MartiniqueGuadeloupe
Valletta
Roma
Riga
Oslo
Bern
Wien
Kyiv
Vaduz
Paris
Praha
Minsk
Tounis
Lisboa
Athina
Skopje
Zagreb
Ankara
MadridTirana
Sofiya
London
Berlin
Dublin
Tallinn
Nicosia
Beograd
Vilnius
Kishinev
Sarajevo
Helsinki
Budapest
Warszawa
Podgorica
El-Jazair
Stockholm
Reykjavik
Křbenhavn
Bucuresti
Amsterdam
Luxembourg
Bruxelles/Brussel
Ljubljana
Bratislava
Regional level: NUTS xxSource: xxx, year
Origin of data: xxx, year© EuroGeographics Association for administrative boundaries
This map does notnecessarily reflect theopinion of the ESPONMonitoring Committee
Long-term Unemploym ent Rate, 2007
© TEAM XXX, Project, Year
0 214 748 364 107 374 1820 500250
km
percentage0,3 - 1,1 - 22 - 33 - 44 - 55 - 11,8
Map 8: Long-term Unemployment Rate (2007)Map by Gergely Tagai.
30

8.2 Access to basic services
8.2.1 Health
Short description: Health related issues represent a major aspect why certain groups of people become vulnerable to social exclusion. They will therefore also being covered in ESPON TiPSE.
Data availability: The indicator list identified two aspects of health: access to primary health services, and healthy life expectancy. The former is covered in Eurostat databases, but only at NUTS 2 level (hlth_rs_prsrg). Here, physicians and doctors per 100,000 inhabitants is a common indicator used by social exclusion and quality of life studies. The other aspect, healthy life expectancy is also a variable of the Human Development Index. This index is calculated on the regional level in the EU by Bubbico and Dijkstra (2011), however, only at NUTS 2 level (demo_r_mlifexp and tgs00101 datasets); an indicative map of this variable is shown in this progress report .
Census 2001 coverage: not applicable.
Census 2011 coverage: not applicable.
Comments: As statistics are not available on NUTS 3 level, alternative official data sources might be consulted at the national level. Data is expected to be relatively well comparable throughout different countries. An option would have been to use ESPON 2013 project EDORA data on hospital beds which is seemingly available for NUTS 3 level (year 2005), but the dataset instead consists of only NUTS 2 data (NUTS 2 averages are delivered for each NUTS 3 region).
31
!
! ! !
!
!
!
!
!
!
!!!
!
!
!
!
!
!
!
!
!!
!
!!
!
!
!
!
!
!
!
!
!
!
!
!
!
!
!
!
!
!
!
!
!!
!
!
Acores
Guyane
Madeira
Réunion
Canarias
MartiniqueGuadeloupe
Valletta
Roma
Riga
Oslo
Bern
Wien
Kyiv
Vaduz
Paris
Praha
Minsk
Tounis
Lisboa
Athina
Skopje
Zagreb
Ankara
MadridTirana
Sofiya
London
Berlin
Dublin
Tallinn
Nicosia
Beograd
Vilnius
Kishinev
Sarajevo
Helsinki
Budapest
Warszawa
Podgorica
El-Jazair
Stockholm
Reykjavik
Křbenhavn
Bucuresti
Amsterdam
Luxembourg
Bruxelles/Brussel
Ljubljana
Bratislava
Regional level: NUTS xxSource: xxx, year
Origin of data: xxx, year© EuroGeographics Association for administrative boundaries
This map does notnecessarily reflect theopinion of the ESPONMonitoring Committee
Healthy Life Expectancy, 2007
© TEAM XXX, Project, Year
0 214 748 364 107 374 1820 500250
km
years76 - 77,773 - 7670 - 7367 - 7064 - 6752,7 - 64
Map 9: Healthy Life Expectancy (2007)
Map by Gergely Tagai.
32

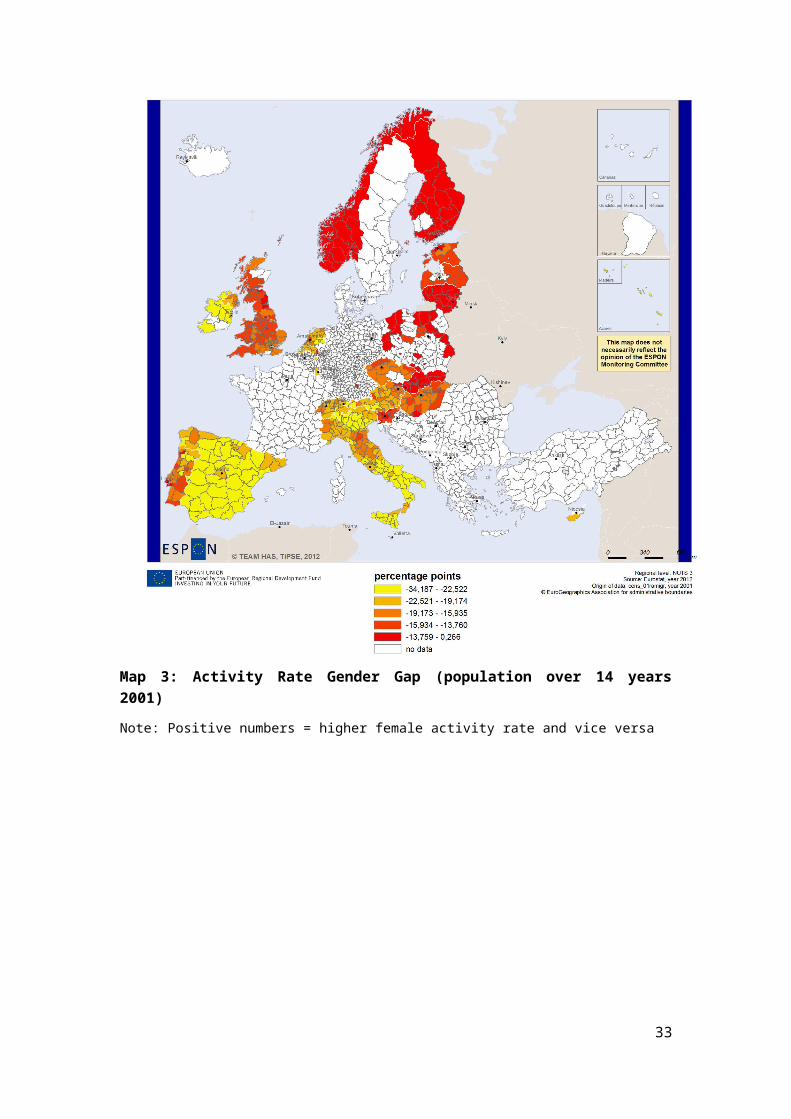
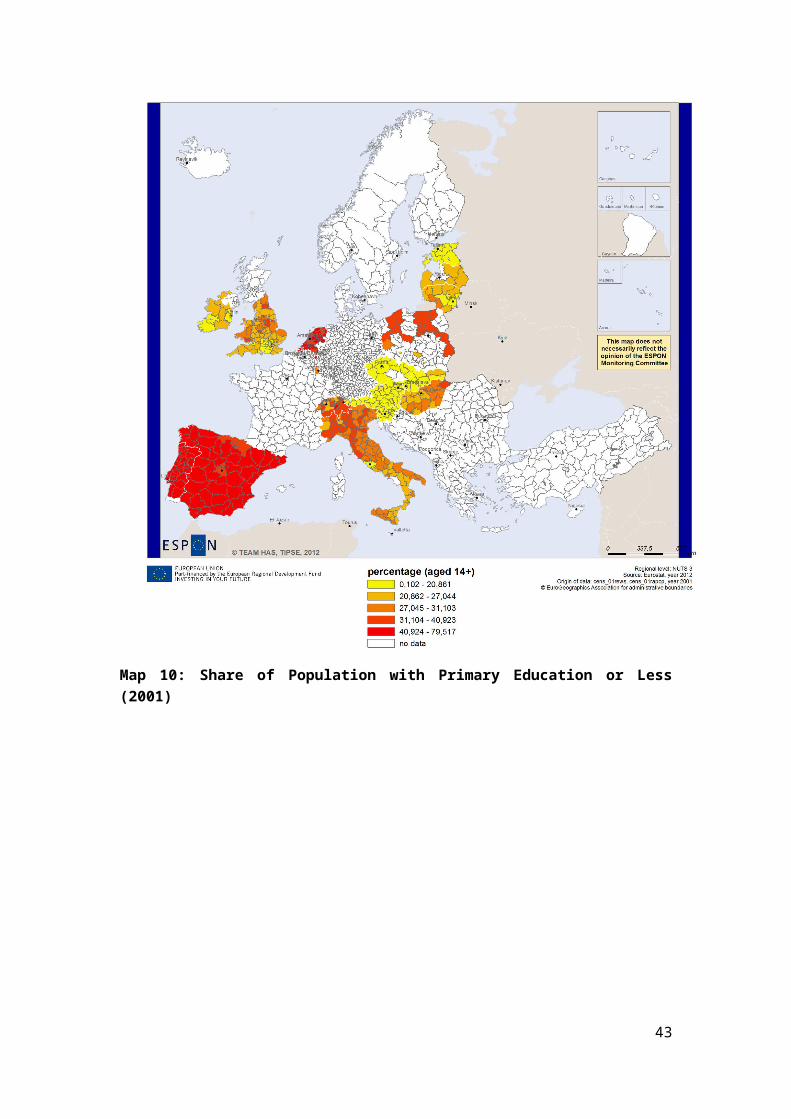
8.2.2 Education
Short description: Educational attainment is one of the key dimensions of social exclusion. People with lower educational attainment are more vulnerable to social exclusion than people with tertiary education. Additionally, a spatially variegated gender gap of this dimension throughout ESPON space is expected.
Data availability: Data on educational attainment is available from the decennial censuses with almost full coverage of people at NUTS 3 level. Other statistics on education are only published in the Eurostat website on NUTS 2 level. ESPON 2013 project EDORA lists educational statistics in its indicator list; this data source covers not all countries on NUTS 3 level, and only for the years 2005–2006. As education is mostly a public service, several official data is collected year-by-year. Official non-standard statistics might be therefore used for capturing this dimension in other years.
Census 2001 coverage: Census data for 2001 is available on the Eurostat website. However, there are limitations of this dataset regarding its coverage. For most of the countries data on population by educational attainment is provided for ISCED levels 0 and 1 (combined), so there is no opportunity to discern primary and pre-primary education (apart from Austria, where there is data only for ISCED 1). ISCED 5 and 6 (tertiary education) is also covered in combination. A serious limitation of the dataset is that for several countries demographic data on age groups is not available for calculating proportions of the population with each educational attainment. Changes in the NUTS system also affect the coverage in several countries (such as Poland). Because of these challenges, maps on the next pages are not really informative in this respect.
Census 2011 coverage: Regulation 763/2008 lists data on educational attainment as NOT available on NUTS 3 and LAU 2 levels for the 2011 census round (Regulation Annex, 1.1.1.). They will not be provided in the Hypercubes of Census 2011 (Commission Regulations 1201/2009, 519/2010).
Comments: Maps on the next pages reveal significant differences in the spatiality of social exclusion. There are inequalities within countries (such as in Italy or in the UK in ISCED 0–1 attainment), but in some aspects countries may seem more homogeneous (Spain in ISCED 0–1 or Finland in ISCED 5–6 attainment). There are considerable intra-national inequalities in Central and Eastern European countries as well. Gender gaps represent unique (and nationally more homogeneous) spatial structures of social exclusion (see for example the significantly lower tertiary education among women in Switzerland). Following that, this indicator would be very useful in operationalising social exclusion on the regional level in ESPON TiPSE. The implications of the data unavailability from Eurostat databases should be further discussed with other project partners in the course of WP2.6 (e.g. whether to collect and use other official national statistical sources). In addition, a more nuanced
33
definition of this dimension should be elaborated on (e.g. Do gender gaps in pre-primary and primary educational attainment signify that young boys are vulnerable to social exclusion?) taking into account the lack of data as well.
Other aspects of the education dimension were listed in Table 3. On pre-school and primary school access (operationalised by the Participation rates of 4-years-olds in education [R05_1] and Pupils in primary and lower secondary education (ISCED 1-2) – as % of total population [R05_3] of dataset educ_regind, respectively) data is available only at NUTS 2 level from Eurostat, thereby comparable official national data sources might be consulted later on in TiPSE. Operationalising cultural house and library access is more complicated (number per 1000 inhabitants might be an option), as comparability of different national data sources (if available at all) is expected to be very limited.
Map 10: Share of Population with Primary Education or Less (2001)
34

Map 11: Share of Population with Tertiary Education (2001)
35

Map 12: Gender Gap, Primary Level Educational Attainment (2001)
Note: Positive numbers = higher female activity rate and vice versa
36

Map 13: Gender Gap, Tertiary Level Educational Attainment
Note: Positive numbers = higher female activity rate and vice versa
37

8.2.3 Housing
Short description: Lack of accessible and affordable housing is one of the key aspects why people and households are vulnerable to social exclusion. Certain aspects of housing therefore are essential to include in ESPON TiPSE. There are certain limitations, however, on the comparability of data on the ‘more qualitative’ aspects of housing, as the ESPON states have different housing markets (more or less private forms, prevalence of renting apartments etc.) and different social policies on housing.
Data availability: In most of the ESPON countries, extensive and comparable housing statistics are provided primarily by the decennial censuses. These will be discussed in the next paragraphs.
Other data sources come from infrastructure datasets, such as population connected to public water supply and to wastewater treatment. This data, however, is only published for NUTS 2 regions by Eurostat (env_n2_pws and env_n2_pww datasets), so that national statistical sources might be consulted for these variables, if possible.
Census 2001 coverage: Detailed descriptions are not necessary, as census 2011 coverage will offer very detailed statistics on housing. Census 2001 data availability is more limited than census 2001 will be. In order to forecast usage of this dimension of social exclusion, one indicator is mapped at this stage of TiPSE: percentage of private households where a lone parent is living with at least one child (as this group may be identified as vulnerable to social exclusion).
Census 2011 coverage: Regulation 763/2008 lists household status as available on NUTS 3 level for the 2011 census round (Regulation Annex, 1.1.1.). The following categories will be provided by Eurostat (Hypercubes 48, 49, 52), out of which groups should be identified in TiPSE as being vulnerable to social exclusion (provisionally vulnerable groups are underlined):
persons living in a private household:- persons in a family nucleus (persons in a married couple, partners in a
registered partnership, partners in a consensual union, lone parents, sons/daughters);
- persons not in a family nucleus (living alone, not living alone);- persons living in a private household, but category not stated;
persons not living in a private household:- persons in an institutional household;- primary homeless persons; - persons not living in a private household, but category not stated.
Further breakdowns are available in the type of family nucleus dataset (with or without children, children under or over 25 years; size of family nucleus – 2, 3, 4, 5, 6, 7, 8, 9, 10, 11 or more persons; a vulnerability threshold should be elaborated on for TiPSE).
38

A prospective measurement of social exclusion in housing is the percentage of people living in vulnerable household status types and vulnerable family status types. Combinations with other dimensions are available (e.g. with age: living alone, over 65 years) for identifying potentially socially excluded groups.
Tenure status of the households will NOT be available for NUTS 3 levels according to the EU regulations (Regulations 763/2008 and 1201/2009, 519/2010), thereby alternative datasets should be used for this aspect. Here, an important aspect is how to delimit tenure statuses which are indicating social exclusion throughout Europe: different countries have different housing markets, national and municipal social policies offering different solutions for example in social housing. Therefore, before collecting data from national data sources, the comparability should be elaborated on in detail; at this stage dropping this indicator is proposed. Data on unoccupied dwellings (which is also one aspect of the tenure status) is offered for NUTS 3 and LAU 2 levels, but these statistics are possibly not indicating social exclusion (as there are no people living in unoccupied dwellings who may be facing social exclusion).
Housing overcrowdedness may be measured by the density standard – floor space in square meters per occupant (or alternatively number of rooms per occupant – national statistical offices shall provide data on either this or that), thresholds will be discussed later on in TiPSE. Hypercube 54 will offer data on NUTS 3 level, but not on LAU 2 (Regulations 763/2008, 1201/2009, 519/2010).
Other data on the quality of housing (e.g. water supply system, toilet facilities, bathing facilities, type of heating) will only provided on NUTS 1 and NUTS 2 levels according to the Regulation 763/2008.
Comments: Census 2011 data is indispensable for TiPSE in covering this aspect of social exclusion. Alternative data sources are not available, or are not as detailed as census data.
39

Map 14: Share of Private Households with Lone Parent living with at least one child (2001)
8.2.4 Transport and communication
Short description: Social groups and households are facing social exclusion also because they are inaccessible by means of transportation and communication. TiPSE is going to take into consideration this aspect of social exclusion as well. The four provisional indicators cover various ‘material’ aspects: whether people have access to a post office, to broadband internet, are accessible by means of transportation, and are able to access other places by a passenger car.
Data availability: Eurostat data is hardly available for covering this dimension. The only aspects for which Eurostat provides statistics on NUTS 2 level is the number of passenger cars (tran_r_vehst) and households with broadband internet access (isoc_r_broad_h). NUTS 3 level data is available on freight transport which is not relevant at all for measuring social exclusion.
40

Some former ESPON studies addressed accessibility topics in the past. ESPON 2006 database offers the variable ‘time to nearest motorway access, by car’ at NUTS 3 level. This measurement is on the one hand outdated (year 2001, since which significant infrastructural investments have been undertaken throughout Europe), and are not quite useful because of different geographical endowments (a motorway is not needed in every part of Europe to access places in order to conduct a ‘socially included’ life). Europe-wide accessibility data is irrelevant for TiPSE (as we imply that it does not count for socially excluded people that their region is easily accessible from all over Europe; or this accessibility has already been mirrored in other indicators and dimensions – such as employment opportunities).
Census 2001 coverage: not applicable.
Census 2011 coverage: not applicable.
Comments: Alternative data sources have to be consulted in the further course of the project to cover this dimension of social exclusion.
8.3 Social environment
8.3.1 Age
Short description: For capturing the different age-composition of NUTS 3 regions with two proxy variables, the total dependency ratio (percentage of people 0–14 and 65+ in the whole population) and elderly/child ratio was calculated (number of people aged 65+ related to people aged 0–14).
Data availability: NUTS 3 level Eurostat data is available throughout Europe for 2011 (for UK and France: 2010). WP2.3 already noted the excellent coverage of this dataset. Mapping and discussing changes over time (in line with the process-based understanding of social exclusion) on a longer-term (10 years) is not meaningfully possible, as full regional coverage for 2001 from the same dataset is only available for the following countries: Belgium, Bulgaria, France, Lithuania, Hungary, and Sweden. However, comparisons will be possibly enabled by the publication of 2011 census data.
Census 2011 coverage: Regulation 763/2008 lists age as available on NUTS 3 and LAU 2 levels for the 2011 census round (Regulation Annex, 1.1.1.). For NUTS 3, data in one-year cohorts will be available, LAU 2 level data will be provided by 5-years cohorts (Regulation 1201/2009) (Hypercube 55 for NUTS 3 data, Hypercube 56 for LAU 2 data).
Comments: there is high variance within the dataset throughout the ESPON space. The two variables are quite different, and reveal different aspects of age-related social exclusion. The total dependency ratio is showing marked East-West divides (with regions in post-socialist countries mostly in the first quintile), whereas elderly/child ratio is having a more scattered pattern throughout Europe (although
41

some countries, like Germany clearly stand out as facing severe aging). The proxy variables are easily understandable and might be good departure points for social policies. Limitations of cross-country comparison are minimal or non-existent.
Map 15: Total Dependency Ratio (2011)
42

Map 16: Elderly:Child Ratio (2011)
Ethnic composition
Short description and comments: as this data is almost exclusively found in census statistics, and it was not an obligatory question in the 2011 census round, this aspect should most possibly be dropped from the indicator list. Belonging to the ethnic minority is not a cause of social exclusion in each and every country (see for example the multi-ethnic character of Switzerland). In addition, ethnicity is a socially constructed category, and is very context-dependent. Individuals have more diverse identities than to reduce why they are socially excluded to the sole fact that they belong to ethnic minorities. Following that, official census data (if available) is not very reliable and does not tell too much on social realities within different places, because it is not able to capture complex identities of people. Moreover, several
43
articles stress that Western European (or UN) definitions and understandings of ethnicity do not work throughout Europe (for an Eastern European historical perspective on nationalisms, ethnicity and identity see Todorova, 2005).
8.3.2 Immigrants
Short description: Immigrants are representing one social group which is vulnerable to social exclusion in European countries. Although the issue is not affecting each ESPON country and region evenly, measuring immigrants’ share in the regions may inform TiPSE on one aspect of social exclusion.
Data availability: Census data is the most extensive source to be used for capturing this indicator.
Census 2001 coverage: Not relevant, as census 2011 will provide coverage. Eurostat data on immigrants is not available on its website for the 2001 census round.
Census 2011 coverage: Regulation 763/2008 lists country/place of birth, as available on NUTS 3 and LAU 2 levels for the 2011 census round (Regulation Annex, 1.1.1.). NUTS 3 level data on place of birth outside the reporting country can be extracted from Hypercube 46 (Commission Regulation 1201/2009).
Comments: Census 2011 data is indispensable for TiPSE in covering this aspect of social exclusion. Alternative data sources are not available, or are not as detailed as census data.
8.3.3 Crime and safety
Short description: ‘Revealed criminal cases per 1000 persons’ was anticipated to use as the most important indicator of crime and safety. The implication was that in poorer or more excluded societies/places criminal cases (at least in some crime categories) may be more prevailing than in ‘wealthy’ places.
Further research on the usability of this indicator in ESPON TiPSE raised serious concerns both theoretically and methodologically. Critical social studies underlined in the past years how crime statistics are culturally produced, how through crime statistics ‘socially excluded’ Others are produced for the police practice (cf. Belina, 2009), and how popular criminological theories (such as broken windows and situational crime prevention) use simplistic understandings of social and spatial exclusion (cf. Herbert and Brown, 2006). Other scholars still argue for a consideration of interrelations between crime and poverty, as the ‘debate on crime needs to widen to remember all victims who are unjustly robbed of their possessions, and even of their lives, both here and abroad through the violation of political or moral law’ (Dorling 2006, p. 1993).
44

As a further methodological problem for ESPON TiPSE, Eurostat metadata reminds us that crime statistics are not comparable across different countries because of five reasons: ‘different legal and criminal justice systems, rates at which crimes are reported to the police and recorded by them, differences in the point at which crime is measured (for example, report to the police, identification of suspect, etc.), differences in the rules by which multiple offences are counted, differences in the list of offences that are included in the overall crime figures’ (http://epp.eurostat.ec.europa.eu/cache/ITY_SDDS/en/crim_esms.htm). Eurostat metadata lists two variables which may be used comparatively: homicide rates and prison population rates. Homicide data probably does not capture meaningfully any dimension of social exclusion in ESPON TiPSE. Incarceration, however, may be an important entry point for understanding complex processes of social exclusion (by state policies): a case study by Peck and Theodore (2008) in Chicago vividly shows how the penal state is connected to the new economic and ethnoracial order which causes social exclusion of significant groups of people.
Following that, crime statistics may only be used very carefully by all research projects on social exclusion and by applied research resulting in social policy interventions as ESPON TiPSE.
Data availability: data may be available from non-standard official sources on the regional level.
Census 2001 coverage: not applicable.
Census 2011 coverage: not applicable.
Comments: although this indicator was foreseen for use by TiPSE WP2.1, it is more advisable to leave out this aspect of vulnerability for social exclusion. Cross-European comparisons are not meaningful.
8.3.4 Municipal revenue from property taxes
Short description: property taxes at the municipal/regional level might be one aspect how local governments are socially and spatially excluded from the national economy and governance. In each of the countries, where tax systems or revenues of the government sector are somewhat decentralised, it is a good measurement of the territorial dimension of social exclusion on the national scale.
Data availability: Eurostat does not cover this aspect on regional level.
Census 2001 coverage: not applicable.
Census 2011 coverage: not applicable.
Comments: Although statistics on government revenues and expenditures are comparable throughout Europe because of the standardised ESA95 system of national accounts
45

(http://epp.eurostat.ec.europa.eu/cache/ITY_SDDS/en/gov_a_tax_ag_esms.htm), the tax systems in European countries are so different that a meaningful comparison along this aspect is not possible at all. Different economic advantages and endowments of local governments to capture this aspect of social exclusion are more or less reflected in the ‘Earning a living’ domain of social exclusion in ESPON TiPSE (by combining income- and employment-related statistics). Therefore, dropping this variable is proposed by this progress report.
8.3.5 Social transfers
Short description: Statistical data on social assistance is one of the key dimensions and indicators of poverty and social exclusion. Following that, including it into social exclusion dimensions is indispensable.
Data availability: Eurostat data on social assistance is available within the nama_r_ehh2s dataset, but only for NUTS 2 regions (cf. WP2.3 on TiPSE indicators). Regional economic accounts (reg_ecobrch) cover some data on NUTS 3 level, but not social transfer-related statistics. Most recent statistics are from year 2009. The same applies for measuring households’ income (see above).
Census 2001 coverage: not applicable.
Census 2011 coverage: not applicable.
Comments: The original indicator (proposed by WP2.1 of TiPSE) for covering this aspect of social exclusion was ‘municipal spending on social assistance’. This measurement is most possibly not comparable throughout Europe, as there are different divisions of labour between municipalities and the nation state in different countries in the sense how they provide social assistance to persons and households. Following that, the name of the indicator has been changed to social transfers. NUTS 3 level data may be collected from national sources. The other option is to drop this variable, because – as WP2.3 observed – disposable income and social transfers may be substitutes for each other.
8.4 Political participation
8.4.1 Citizenship
Short description: Foreign citizens are representing one social group which may be vulnerable to social exclusion in some European countries. Although the issue is not affecting each ESPON countries and regions evenly, measuring foreign citizens’ share in the regions may inform TiPSE on one aspect of social exclusion.
Data availability: Census data is the most extensive source to be used for capturing this indicator.
Census 2001 coverage: not relevant, as census 2011 will provide coverage. Eurostat data on citizenship is available for the 2001 census round, a map of this indicator is shown indicatively in this progress report.
46

Census 2011 coverage: Regulation 763/2008 lists country of citizenship as made available on NUTS 3 and LAU 2 levels for the 2011 census round (Regulation Annex, 1.1.1.). NUTS 3 level data on country of citizenship outside the reporting country can be extracted from Hypercube 46 (Commission Regulation 1201/2009).
Comments: Census 2011 data is indispensable for TiPSE in covering this aspect of social exclusion. Alternative data sources are not available, or are not as detailed as census data.
Map 17: Share of Inhabitants with Citizenship outside the Reporting Country (2001)
8.4.2 Voters
Short description: Voting is one of the most important political rights in today’s European democracies. In ESPON TiPSE it is implied that lack of political participation makes people more vulnerable to social exclusion. To measure political
47

participation several indicators may be used, one of which is the voter turnout in national or EU-wide elections.
Data availability: Voter turnout in EU and parliamentary elections is listed among Eurostat’s indicators on the national level (tsdgo310). Metadata, however, reminds users that in Belgium, Luxembourg and Greece, voting is compulsory, and it is a civic obligation (with no penalty) in Italy. As a result, statistics are on the one hand not comparable across European countries (another limitation of the comparability is that the population with the right to vote may be slightly different in each of the countries). On the other hand, one may interpret the compulsory voting as the nation state’s effort to minimise this dimension of social exclusion through obligatory political participation.
Census 2001 coverage: not applicable.
Census 2011 coverage: not applicable.
Comments: As data is not comparable across Europe, other indicators may be considered instead in order to cover the domain of political participation.
8.4.3 Civic engagement
Short description: Civic engagement is one of the means by which people and groups of people become more included in the society. Following that, it is a very important aspect in conceptualising social exclusion for our project.
Data availability: cross-comparable Eurostat data is not available on this aspect of political participation. Official non-standard sources (e.g. on number of NGOs per 1000 inhabitants) may be consulted later on in the TiPSE project.
Census 2001 coverage: not applicable.
Census 2011 coverage: not applicable.
Comments: The implied indicators have been the number of NGOs per 1000 inhabitants, as well as members of NGOs per 1000 inhabitants. Cross-European comparability of data must be carefully evaluated before data collection from official national sources will be anticipated. This may include: definitions of NGOs, relevance of NGOs in the legal structure of the countries, available statistical sources on the issue etc.
48

9 Discussion and preliminary policy implicationsIndicators list – possibilities, limitations and comparability issues
Mapping different dimensions of social exclusion is one of the main outputs of the ESPON TiPSE project. This progress report shows how the project used a deductive framework to delimit different domains, dimensions and indicators for the project.
Multi-dimensionality of social exclusion will be elaborated on in other work packages using the deliverables from this work package. At this stage of TiPSE, the main conclusions on possibilities, limitations and comparability issues of the indicators are as follows.
Eurostat covers some dimensions of social exclusion with comparable data. For some variables, there are certain limitations regarding which countries are covered and which not. Overcoming these data availability problems is possible in the majority of the cases (see also WP2.3).
Census data is indispensable for some of the social exclusion dimensions, as they are collected only in the decennial censuses (or other data sources are not as reliable as censuses). Standard realms in this group are demographic data (age, employment, country of birth), educational attainment, employment, housing and country of citizenship.
- Several variables will be available from the 2011 census round on NUTS 3 level (such as immigration, housing, country of citizenship). The serious limitation is that comparable Eurostat data will only be provided starting March 2014. National statistical offices are not expected to publish these ‘hypercubes’ earlier either. TiPSE partners will discuss implications of this question in the further course of the project.
- Several variables will not be available from the 2011 census round on NUTS 3 level from Eurostat (such as the education and employment dimensions). This results in a severe problem for ESPON TiPSE, as data may only be collected from national statistical sources which have different policies of publishing territorial data on NUTS 3 level. Availability is not expected until early 2014 in this group either. TiPSE partners shall discuss this issue in detail.
For some ‘census’ dimensions, non-census Eurostat data is available, as in the employment dimension. For employment, standardised data using LFS methodology is available for a longitudinal comparison as well.
‘Non-standard’ official or non-official statistical sources on the national level may be considered for use by ESPON TiPSE. The most important concerns here are the availability of data, and the geographical cross-comparability (not only methodologically, but also whether these variables capture social exclusion in a same way throughout Europe – cf. the Voting dimension
49

discussed before). A viable option is to collect data only for countries in which the case studies are to be undertaken.
Some indicators were listed in WP2.1, but further considerations in WP2.6 would opt for leaving them out, mostly because theoretical-ethical issues (dimension of crime and safety) or because of limited geographical cross-comparability of data (such as municipal revenue from property taxes). Some indicators have been reformulated or refined in WP2.6 (social transfers).
9.1 Mapping the socially excluded – possibilities and limitations
Mapping practices, and particularly mapping social phenomena has been in the focus of social scientific practice for several decades, in order to understand, explain, monitor and change social realities. In this last section of the progress report, some theoretical and methodological concerns will be raised about mapping social exclusion.
In the past 2-3 decades, a research strand has been developed in critical social theory which tries to understand research practices of mapping, and explores issues under the label ‘critical cartography’. This group of research mixes post-positivist theories (such as social constructivism or post-structuralism), uses new practices (such as reflexivity – cf. Bourdieu 2004) and new methodologies stemming from them.
These new approaches understand maps as both a social product (also reflecting the world-views of its producer), as well as an active agent in the processes of communication and governmentality (Ball and Petsimeris, 2010; Michel, 2010). Mapping poverty and social exclusion has had the intellectual baggage of constructing poverty and interpreting poverty in a certain, univocal and powerful way for the past more than a century (cf. Ball and Petsimeris, 2010). The Chicago School’s heritage, for example, established ‘spaces of exclusion’ through its research methods and practices culminating in mapping social classes. Delimiting, researching and living in spaces and places have therefore become an integral step in the chain of events that results in scientific facts (cf. Gieryn, 2006). In addition, early works at intersections of poverty, wealth distribution and its spatiality have suggested that poverty is somehow inherited (Dorling and Pritchard, 2010), thereby conceptualising space as an important actor of social processes.
Critical studies on mapping social phenomena have referred to the power of maps in producing and distributing uncontested meanings, thereby excluding, marginalising and stigmatising different groups of people (cf. Belina, 2009). These researches have referred to false abstractions (Belina, 2009) in the mapping practice, and have denied the objective and neutral practices of visualisation using maps (Michel, 2010).
In the critical cartography literature, a distinction can be made between two strands. One of them is an approach which tries to understand (using mostly a framework of
50

discourse analysis) how maps are produced, which power relations and geographical imaginations are coded in the map, how the interrelations of signifier and signified are constantly reproduced by researchers and in the everyday practice (see for example Mose and Strüver, 2009). The other not only tries to understand mapping practices, but also aims at offering alternatives to them in order to change the world for better. These latter approaches have been more or less informed by the Marxist critique (Belina, 2009), or have applied a diverse theoretical entry point, such as Gibson-Graham’s action research (cf. Gibson-Graham, 2008) which merges feminist, post-structuralist and Marxian understandings.
This latter, ‘more active’ approach has also some implications for ESPON TiPSE, as some articles in the past decades also called for alternative representations of the spatiality of poverty, social exclusion, vulnerability of exclusion, or related social phenomena. Fahmy et al. (2008) on the one hand opted for a visualisation of poverty which uses tracts with the same number of population, which is a more ‘democratic’ representation of people offering everyone the same space on the map (see also the Online Census Atlas: Durham et al., 2006). St. Martin (2009) on the other hand, argues for countermapping strategies in order to reclaim resources for the dispossessed people, to constitute new imaginaries of places and to remap spaces and resources as common(s). St. Martin calls for mixed-method researches with combining ‘traditional’ mapping practices (of mostly official statistical data) with qualitative – primarily ethnographic – studies, so that alternative realities may be constructed together with marginalised groups of people. Within this research practices, mapping is not only a way of understanding spatial patterns of the reality, but also offering the entry point for proposing new or alternative realities. This approach is in line with other action researches which aim at dislocating different ontologies, such as ‘the poverty’, ‘the social exclusion’ or ‘the economy’. J-K. Gibson-Graham (2008), for example, used action research in order to offer new and more inclusive understandings of ‘the economy’, and thereby change the lives of people who were partaking in these action researches for the better.
The practice of St. Martin and Gibson-Graham may also have some conclusions to be drawn for research practices in ESPON TiPSE. For example, it might be elaborated on, how research outputs of WPs 2.3 and 2.6 on the social exclusion database and the mapping exercise are to be used as an entry point for discussions in the case studies’ interviewees. Using this approach, differences of the macro-level mapping and people’s place-based perceptions on social exclusion might be compared. This research practice can result in a more nuanced understanding of social exclusion and more inclusive social policies put forward by the TiPSE research project.
51

ReferencesBall, S. and Petsimeris, P. (2010) Mapping Urban Social Divisions. Forum Qualitative Sozialforschung / Forum: Qualitative Social Research, 11 (2) Article 37.
Belina, B. (2009) Kriminalitätskartierung – Produkt und Mittel neoliberalen Regierens, oder: Wenn falsche Abstraktionen durch die Macht der Karte praktisch wahr gemacht werden. Geographische Zeitschrift, 97(2) 192–212.
Bourdieu, P. (2004) Science of science and reflexivity. Chicago: University of Chicago Press.
Bradshaw, J. and Mayhew, E. (2010) The measurement of extreme poverty in the European Union, Report for the Directorate-General for Employment, Social Affairs and Inclusion, Brussels: European Commission
Bubbico, R.L. and Dijkstra, L. (2011) The European regional Human Development and Human Poverty Indices. Regional Focus, 02/2011. http://ec.europa.eu/regional_policy/sources/docgener/focus/2011_02_hdev_hpov_indices.pdf
Czirfusz, M. (2010) Faktoranalízis, a látszatmegoldás [Factor analysis, a pseudo-solution.] Tér és Társadalom, 24 (1) 37 – 49.
Dorling D. (2006) A place where everyone matters: crime and poverty. Environment and Planning A, 38 (11) 1993–1998.
Dorling, D. and Pritchard, J. (2010) The geography of poverty, inequality and wealth in the UK and abroad: because enough is never enough. Applied Spatial Analysis and Policy, 3 (2–3) 81–106.
Durham, H., Rees, P., and Dorling, D. (2006) An Online Census Atlas for everyone. Area, 38 (3) 336–341.
European Commission (1998) Non-monetary indicators of poverty and social exclusion – final report, Luxembourg: OOPEC
European Commission (2010) Investing in Europe’s future. Fifth report on economic, social and territorial cohesion. Luxembourg: Publications Office of the European Union
EC Regulation 763/2008 of the European Parliament and of the Council of 9 July 2008 on population and housing censuses. http://eur-lex.europa.eu/LexUriServ/LexUriServ.do?uri=OJ:L:2008:218:0014:01:EN:HTML
EC Regulation 1201/2009 of 30 November implementing Regulation (EC) No 763/2008 of the European Parliament and of the Council on population and housing censuses as regards the technical specifications of the topics and of their
52

breakdowns. http://eur-lex.europa.eu/LexUriServ/LexUriServ.do?uri=OJ:L:2009:329:0029:01:EN:HTML
EC Regulation 519/2010 of 16 June 2010 adopting the programme of the statistical data and of the metadata for population and housing censuses provided for by Regulation (EC) No 763/2008 of the European Parliament and of the Council. http://eur-lex.europa.eu/LexUriServ/LexUriServ.do?uri=OJ:L:2010:151:0001:0013:EN:PDF
Fahmy, E., Dorling, D., Rigby, J., Wheeler, B., Ballas, D., Gordon, D., Lupton, R. (2008) Poverty, Wealth and Place in Britain, 1968–2005. Radical Statistics, Issue 97, 11–30.
Gibson-Graham, J.K. (2008) Diverse economies: performative practices for ‘other worlds’. Progress in Human Geography, 32 (5) 613 –632.
Gieryn, T. F. (2006) City as truth-spot: laboratories and field sites in urban studies. Social Studies of Science, 36 (1) 5–38.
Gregory, D. and Urry, J. (eds.) (1985) Social relations and spatial structures. Basingstoke: Macmillan
Haraway, D. (1988) Situated knowledges: The science question in feminism and the privilege of partial perspective, Feminist Studies, 14 (3) 575 – 599.
Herbert, S. and Brown, E. (2006) Conceptions of Space and Crime in the Punitive Neoliberal City. Antipode, 38 (4) 755–777
Herod, A. (2011) Scale, London: Routledge
http://epp.eurostat.ec.europa.eu/cache/ITY_SDDS/en/crim_esms.htm
http://epp.eurostat.ec.europa.eu/cache/ITY_SDDS/en/gov_a_tax_ag_esms.htm
http://epp.eurostat.ec.europa.eu/cache/ITY_SDDS/EN/nama_esms.htm
http://www.communities.gov.uk/documents/statistics/pdf/1871208.pdf
Lelkes, O. (2006): Social Exclusion in Eastern-Central Europe. Concept, Measurement and Policy Interventions. Working Paper STEPS.
Levitas, R. et al (2007) The Multidimensional Analysis of Social Exclusion. Department of Sociology and the School of Social Policy, Bristol Institute of Social Affairs, University of Bristol.
Madanipour, A., (2003) Cities actions against social exclusion, Brussels: Eurocities
Massey, D. (1985) New directions in space, in Gregory, D. and Urry, J. (eds.) Social relations and spatial structures. Basingstoke: Macmillan. 9 – 19.
Michel, B. (2010) Für eine poststrukturalistische Perspektive auf das Machen und die Macht von Karten. Replik auf Ball und Petsimeris. Forum Qualitative Sozialforschung / Forum: Qualitative Social Research, 11(3), Article 28
53

Ministry of Labour and Social Policy and UNDP (2006) Social exclusion and integration in Poland. An indicators-based approach. Warsaw.
Mitchell, D. (2011) Homelessness, American style, Urban Geography, 32 (7) 933 – 956.
Mose, J. and Strüver, A. (2009) Diskursivität von Karten – Karten im Diskurs. In: Glasze, G. and Mattissek, A. (eds.) Handbuch Diskurs und Raum. Theorien und Methoden für die Humangeographie sowie die sozial- und kulturwissenschaftliche Raumforschung. Bielefeld: Transcript. 315–325.
Peck, J. and Theodore, N. (2008), Carceral Chicago: Making the Ex-offender Employability Crisis. International Journal of Urban and Regional Research, 32 (2) 251–281.
Philip, L. and Shucksmith, M. (2003) Conceptualising social exclusion in rural Britain, European Planning Studies, 11 (4) 461 – 480
Reimer, W. (2004) Social exclusion in a comparative context, Sociologia Ruralis, 44 (1) 76 – 94
Sayer, A. (1985) The difference that space makes, in Gregory, D. and Urry, J. (eds.) Social relations and spatial structures. Basingstoke: Macmillan. 49–66.
Sayer, A. (1992) Method in social science. A realist approach. 2nd edition. London: Routledge
Silver, H. (1994) Social exclusion and social solidarity: three paradigms, International Labour Review, 133 (5-6) 531–578
Smith, A., Stenning, A., Rochovská, A. and Świątek, D. (2008) The emergence of a working poor: Labour markets, neoliberalisation and diverse economies in post-socialist cities. Antipode, 40 (2) 283–311.
St. Martin, K. (2009) Toward a Cartography of the Commons: Constituting the Political and Economic Possibilities of Place. The Professional Geographer, 61 (4) 493–507.
Todorova, M. (2005) The Trap of Backwardness: Modernity, Temporality, and the Study of Eastern European Nationalism. Slavic Review, 64 (1) 140–164.
UNDP (2011) Beyond Transition. Towards Inclusive Societies. Regional Bureau for Europe and CIS.
54