Vermont Electric Energy Efficiency Potential Study – Draft Findings April 10, 2006.
39
Vermont Electric Energy Efficiency Potential Study – Draft Findings April 10, 2006
-
Upload
edwin-hutchinson -
Category
Documents
-
view
213 -
download
0
Transcript of Vermont Electric Energy Efficiency Potential Study – Draft Findings April 10, 2006.
Vermont Electric Energy Efficiency Potential Study –
Draft Findings
Vermont Electric Energy Efficiency Potential Study –
Draft Findings
April 10, 2006
GDS Associates, Inc. 2
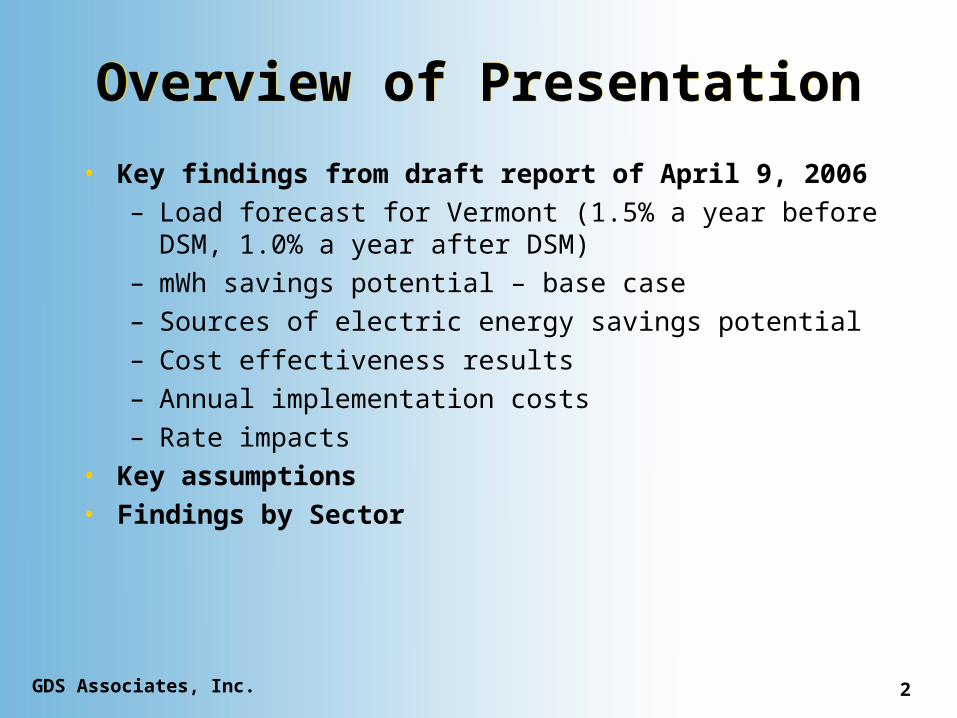
Overview of PresentationOverview of Presentation
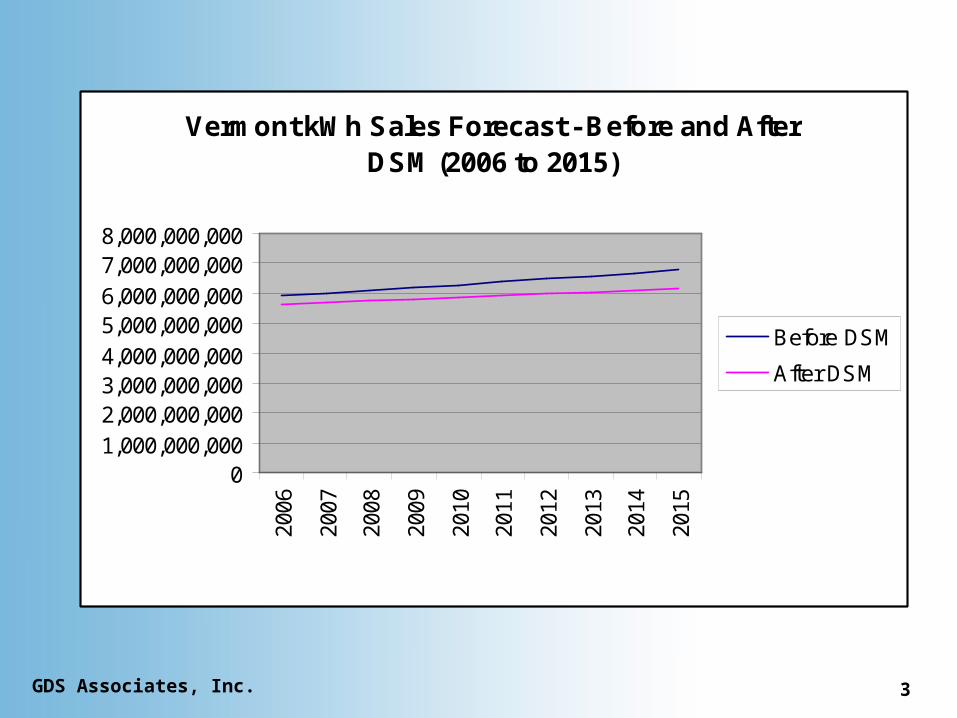
• Key findings from draft report of April 9, 2006– Load forecast for Vermont (1.5% a year before DSM,
1.0% a year after DSM)– mWh savings potential – base case– Sources of electric energy savings potential– Cost effectiveness results– Annual implementation costs– Rate impacts
• Key assumptions• Findings by Sector
GDS Associates, Inc. 3
Vermont kWh Sales Forecast - Before and After DSM (2006 to 2015)
01,000,000,0002,000,000,0003,000,000,0004,000,000,0005,000,000,0006,000,000,0007,000,000,0008,000,000,000
2006
2007
2008
2009
2010
2011
2012
2013
2014
2015
Before DSM
After DSM
GDS Associates, Inc. 4
mWh Savings PotentialmWh Savings Potential
Sector
Maximum Achievable Cost Effective kWh Savings by 2015 from Electric Energy Efficiency
Measures/Programs for Vermont (Cost Effective
According to Societal Test)
2015 kWh Sales Forecast for This
Sector
Percent of Sector 2015 kWh Sales
Forecast
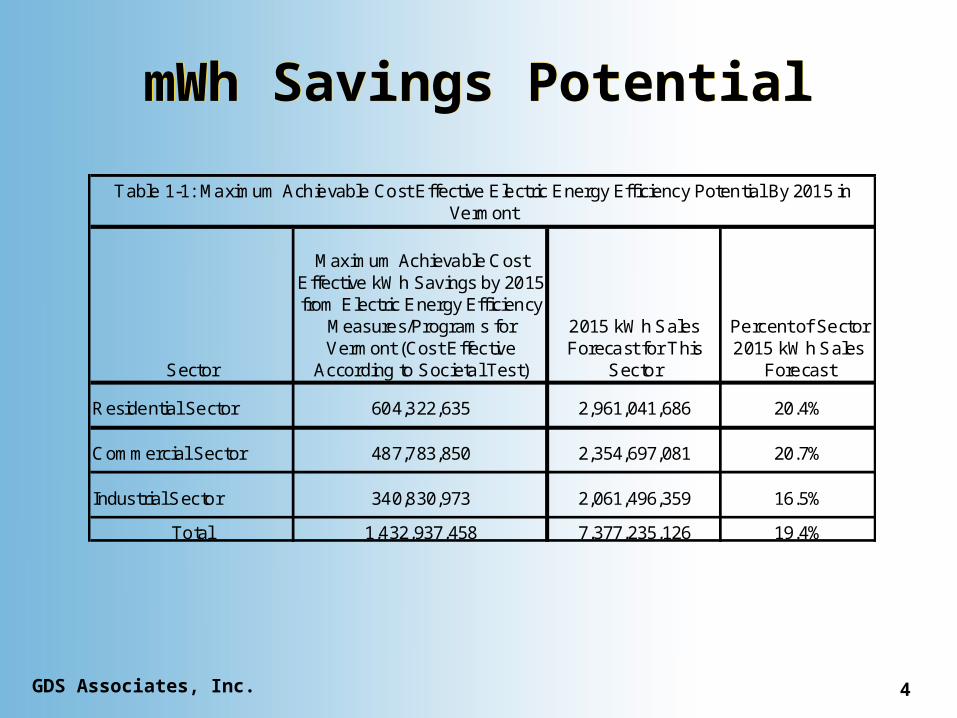
Residential Sector 604,322,635 2,961,041,686 20.4%
Commercial Sector 487,783,850 2,354,697,081 20.7%
Industrial Sector 340,830,973 2,061,496,359 16.5%
Total 1,432,937,458 7,377,235,126 19.4%
Table 1-1: Maximum Achievable Cost Effective Electric Energy Efficiency Potential By 2015 in Vermont
GDS Associates, Inc. 5
Key Sources of Savings Potential for Max. Ach Cost Effective Base
Case
Key Sources of Savings Potential for Max. Ach Cost Effective Base
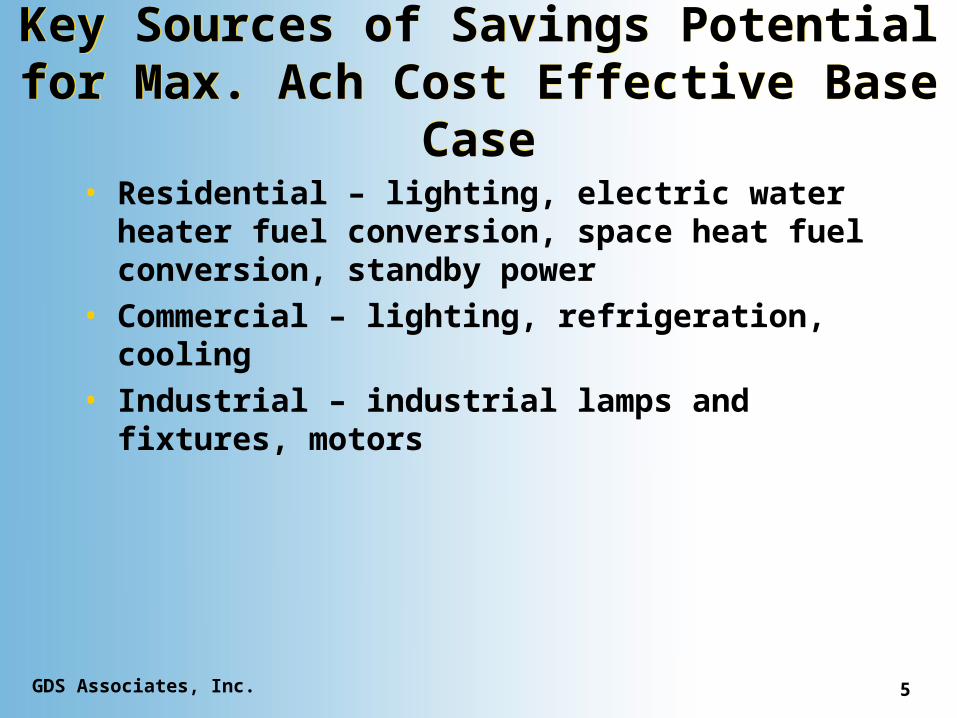
Case• Residential – lighting, electric water
heater fuel conversion, space heat fuel conversion, standby power
• Commercial – lighting, refrigeration, cooling
• Industrial – industrial lamps and fixtures, motors
GDS Associates, Inc. 6
Cost Effectiveness Findings-Societal Test
Cost Effectiveness Findings-Societal Test
Column # 1 2 3 4 5 6
Present Value of Total Resource Benefits ($2006)
Present Value of Total Measure
Incremental Costs ($2006)
Present Value of Vermont
Implementation Costs (Staffing, Marketing, Data
Tracking & Reporting, etc.,
$2006)
Present Value Of Total Costs (Col 2
+ Col 3)
Net Present Value savings
($2006)
Societal Test
Benefit/Cost Ratio
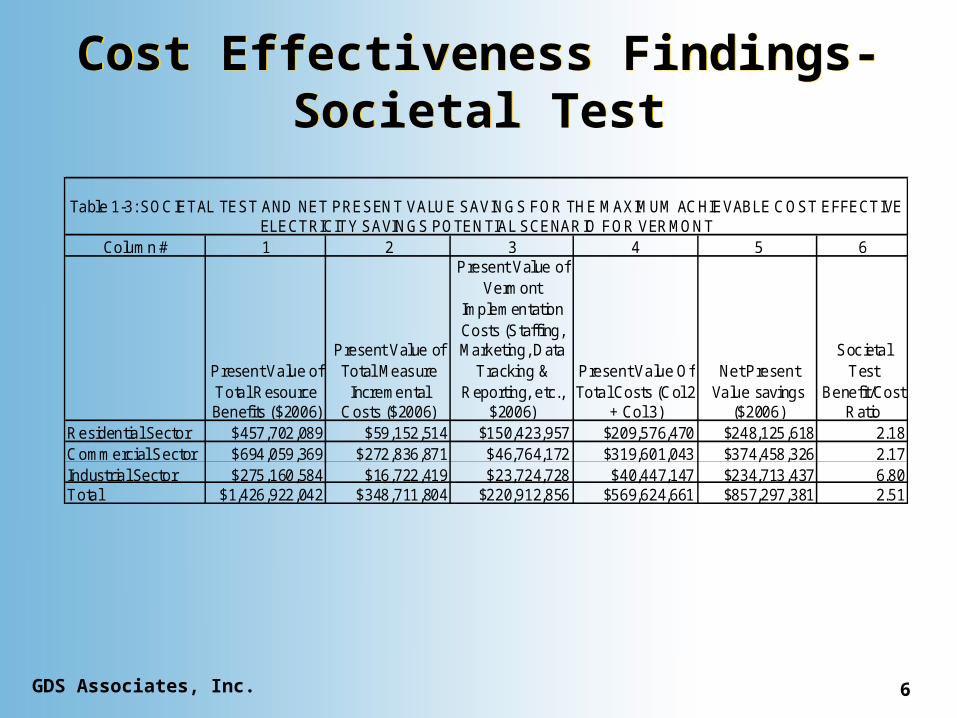
Residential Sector $457,702,089 $59,152,514 $150,423,957 $209,576,470 $248,125,618 2.18Commercial Sector $694,059,369 $272,836,871 $46,764,172 $319,601,043 $374,458,326 2.17Industrial Sector $275,160,584 $16,722,419 $23,724,728 $40,447,147 $234,713,437 6.80Total $1,426,922,042 $348,711,804 $220,912,856 $569,624,661 $857,297,381 2.51
Table 1-3: SOCIETAL TEST AND NET PRESENT VALUE SAVINGS FOR THE MAXIMUM ACHIEVABLE COST EFFECTIVE ELECTRICITY SAVINGS POTENTIAL SCENARIO FOR VERMONT
GDS Associates, Inc. 7
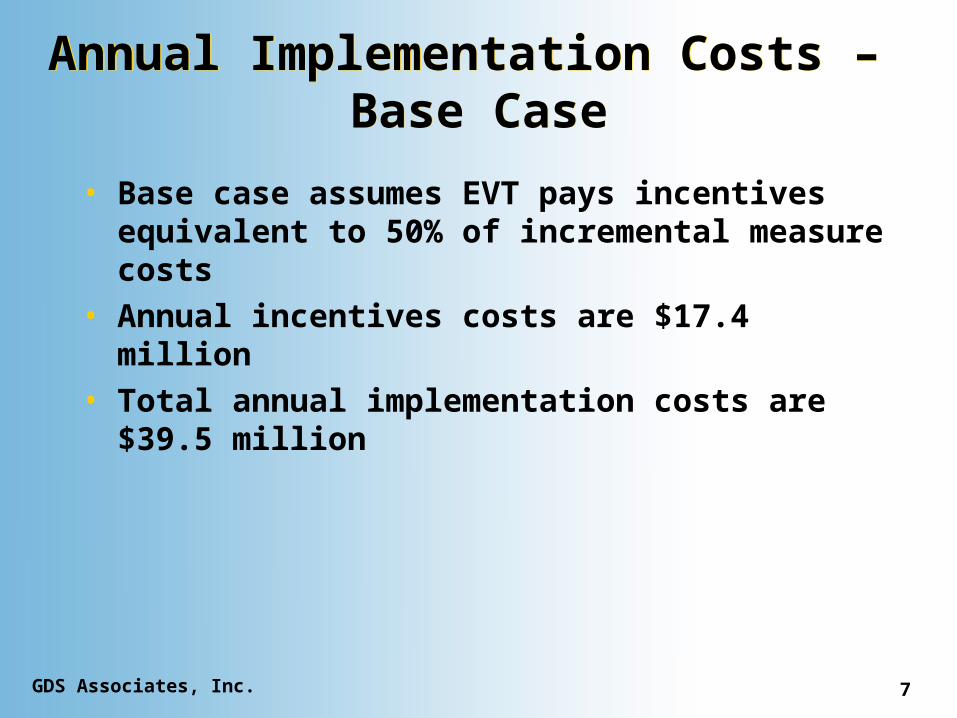
Annual Implementation Costs – Base Case
Annual Implementation Costs – Base Case
• Base case assumes EVT pays incentives equivalent to 50% of incremental measure costs
• Annual incentives costs are $17.4 million• Total annual implementation costs are
$39.5 million
GDS Associates, Inc. 8
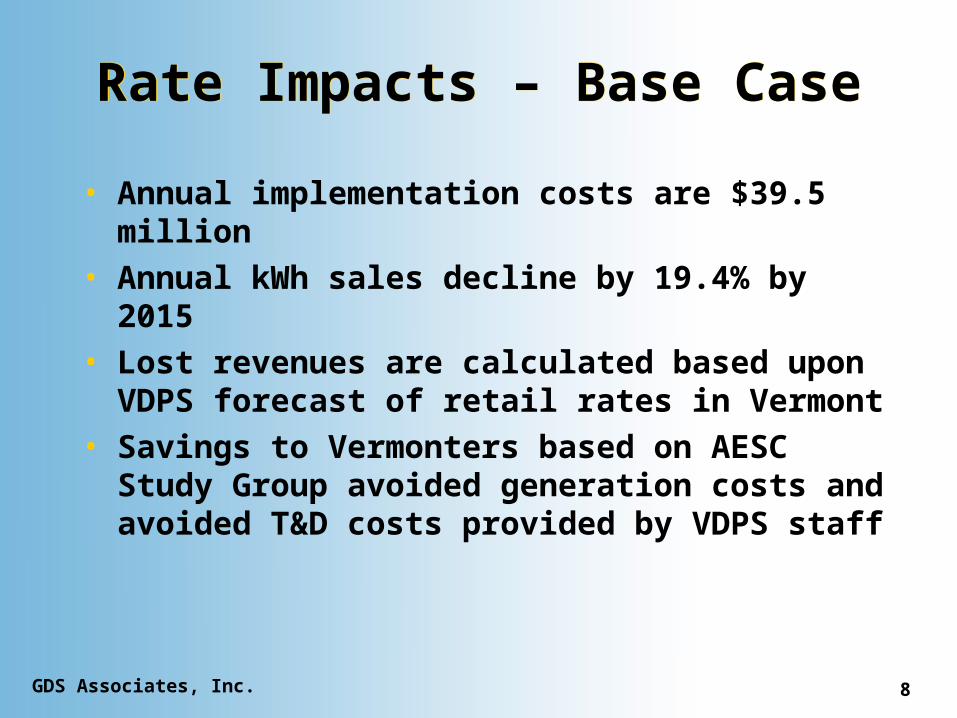
Rate Impacts – Base CaseRate Impacts – Base Case
• Annual implementation costs are $39.5 million
• Annual kWh sales decline by 19.4% by 2015• Lost revenues are calculated based upon
VDPS forecast of retail rates in Vermont• Savings to Vermonters based on AESC
Study Group avoided generation costs and avoided T&D costs provided by VDPS staff
GDS Associates, Inc. 9
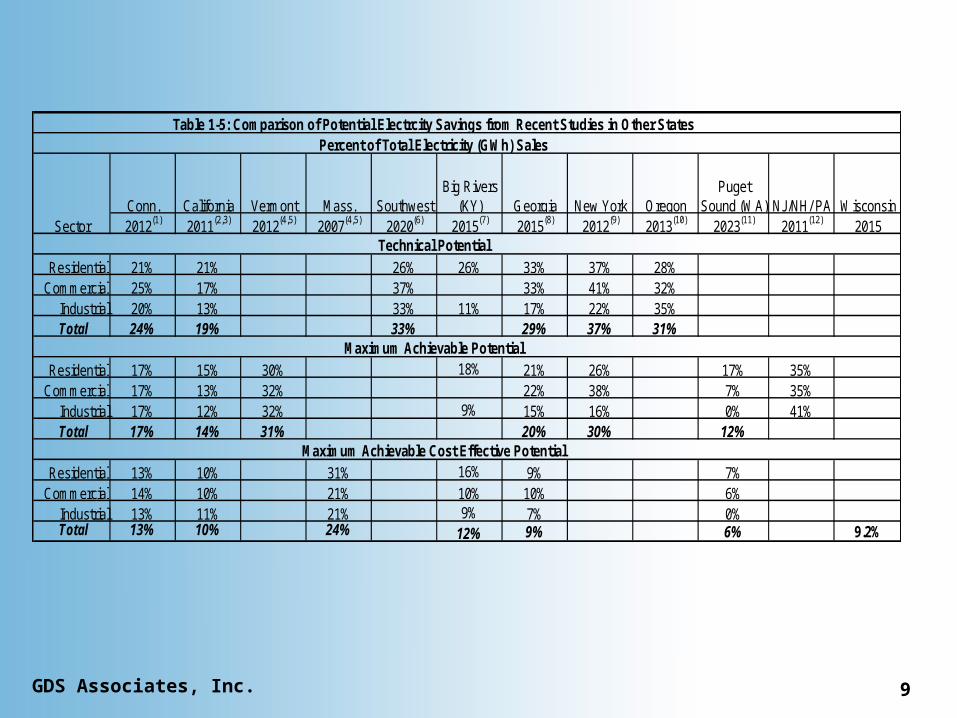
Conn. California Vermont Mass. SouthwestBig Rivers
(KY) Georgia New York OregonPuget
Sound (WA) NJ/NH/ PA Wisconsin2012(1) 2011(2,3) 2012(4,5) 2007(4,5) 2020(6) 2015(7) 2015(8) 2012(9) 2013(10) 2023(11) 2011(12) 2015
Residential 21% 21% 26% 26% 33% 37% 28%
Commercial 25% 17% 37% 33% 41% 32% Industrial 20% 13% 33% 11% 17% 22% 35%
Total 24% 19% 33% 29% 37% 31%
Residential 17% 15% 30% 18% 21% 26% 17% 35%
Commercial 17% 13% 32% 22% 38% 7% 35% Industrial 17% 12% 32% 9% 15% 16% 0% 41%
Total 17% 14% 31% 20% 30% 12%
Residential 13% 10% 31% 16% 9% 7%
Commercial 14% 10% 21% 10% 10% 6% Industrial 13% 11% 21% 9% 7% 0%
Total 13% 10% 24% 12% 9% 6% 9.2%
Table 1-5: Comparison of Potential Electrcity Savings from Recent Studies in Other StatesPercent of Total Electricity (GWh) Sales
Sector
Maximum Achievable Cost Effective Potential
Technical Potential
Maximum Achievable Potential
GDS Associates, Inc. 10
Key Assumptions Key Assumptions
• New benefit/cost screening model• Line losses• Reserve margin• Electric avoided costs and fossil fuel
prices• Externality adders• Maximum achievable penetration rate for
efficiency measures
GDS Associates, Inc. 11
New Benefit-Cost Screening Model
New Benefit-Cost Screening Model
• Built by GDS Associates over the past five years
• Operates in an Excel environment• Has been approved by regulators in other
States• Can handle over 110 energy efficiency
measures• User-friendly and easy to use
GDS Associates, Inc. 12
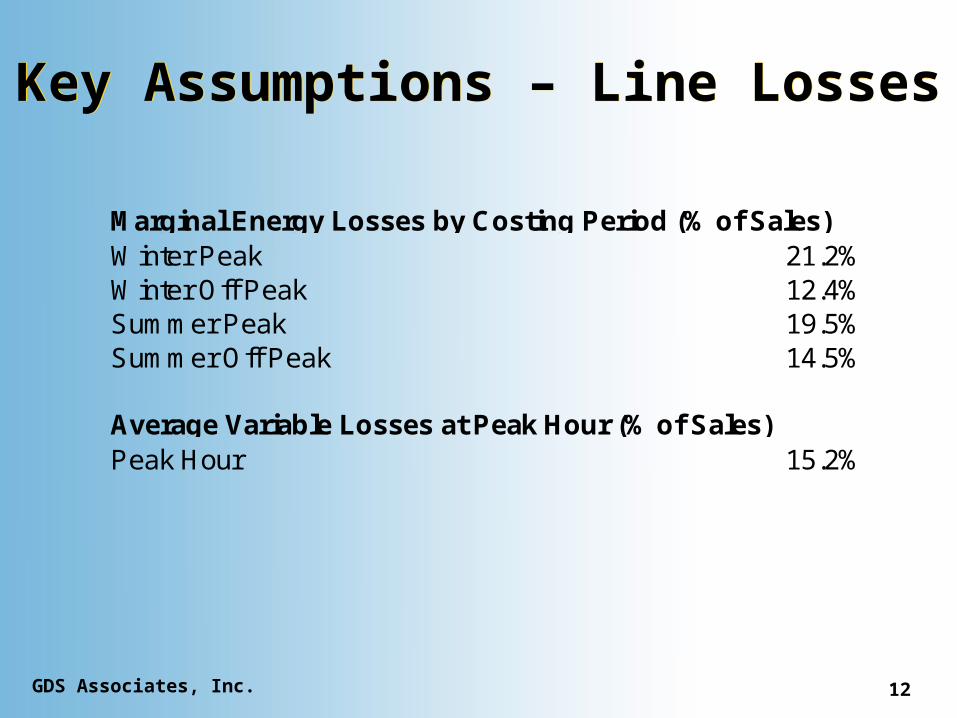
Key Assumptions – Line LossesKey Assumptions – Line Losses
Marginal Energy Losses by Costing Period (% of Sales)Winter Peak 21.2%Winter Off Peak 12.4%Summer Peak 19.5%Summer Off Peak 14.5%
Average Variable Losses at Peak Hour (% of Sales)Peak Hour 15.2%
GDS Associates, Inc. 13
Key Assumptions for Electric Avoided Costs
Key Assumptions for Electric Avoided Costs
• Electric generation avoided costs for Vermont – from December 2005 AESC Study Group report
• Fossil fuel prices - from December 2005 AESC Study Group report
• T&D avoided capacity costs – from VDPS ($163 per kW in 2005 dollars)
• Reserve margin of 13.8% provided by VDPS staff
GDS Associates, Inc. 14
Key Assumptions for Externality Adders for Vermont Societal TestKey Assumptions for Externality Adders for Vermont Societal Test
• Non – energy benefits adder of $.0081 per kWh saved (in 2005 dollars) applied to electricity savings
• Non – energy benefits adder for fossil fuel savings obtained from VDPS staff
• Costs of electric energy efficiency measures reduced by 10%
GDS Associates, Inc. 15
Key Assumptions for Maximum Penetration of Efficiency
Measures
Key Assumptions for Maximum Penetration of Efficiency
Measures
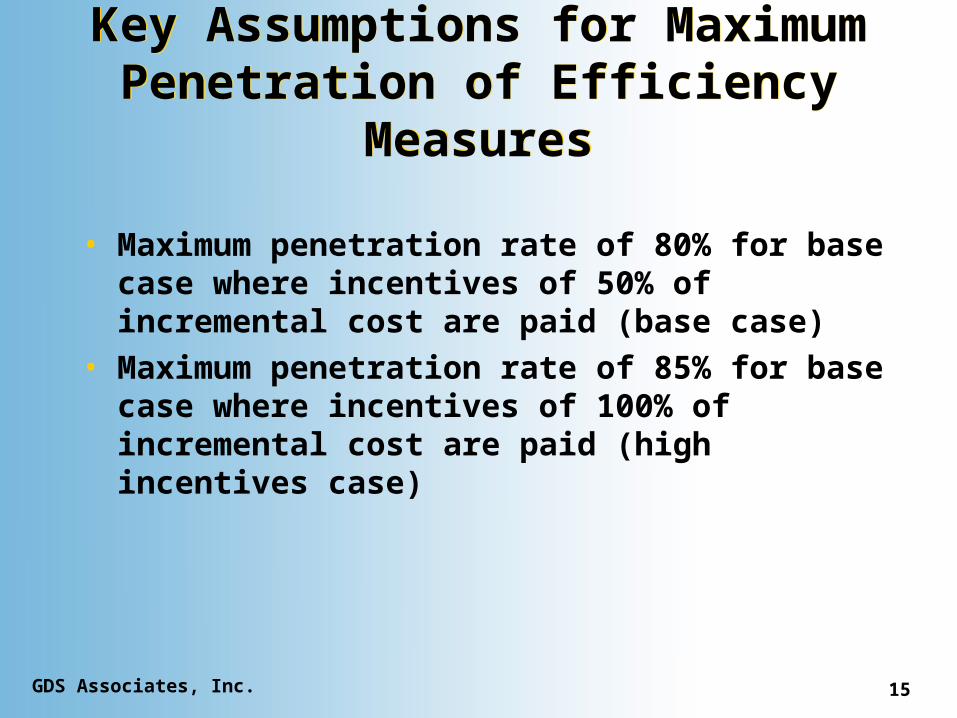
• Maximum penetration rate of 80% for base case where incentives of 50% of incremental cost are paid (base case)
• Maximum penetration rate of 85% for base case where incentives of 100% of incremental cost are paid (high incentives case)
Residential Sector Findings
Residential Sector Findings
April 10, 2006
GDS Associates, Inc. 17
Vermont Residential SectorVermont Residential Sector
• Much has already been accomplished in VT
• EVT has already saved a significant amount of electric energy and demand
• This is equivalent to a significant percentage of 2005 annual kWh sales in Vermont
GDS Associates, Inc. 18
Residential Savings SummaryResidential Savings Summary
• Significant cost effective electricity savings potential still exists
• Important to understand how electricity is used in the residential sector
• Residential sector is forecast to have the fastest kWh sales growth for 2006 to 2015 (1.6%)
• Majority of savings potential is in lighting and electric water heater fuel conversion
GDS Associates, Inc. 19
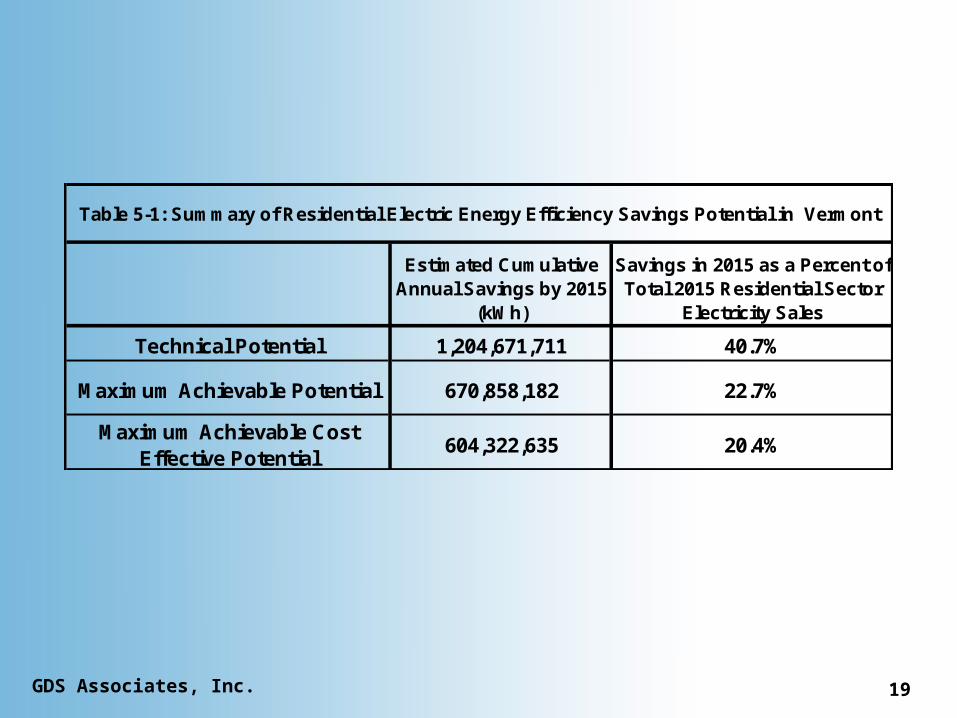
Estimated Cumulative Annual Savings by 2015
(kWh)
Savings in 2015 as a Percent of Total 2015 Residential Sector
Electricity Sales
Technical Potential 1,204,671,711 40.7%
Maximum Achievable Potential 670,858,182 22.7%
Maximum Achievable Cost Effective Potential
604,322,635 20.4%
Table 5-1: Summary of Residential Electric Energy Efficiency Savings Potential in Vermont
GDS Associates, Inc. 20
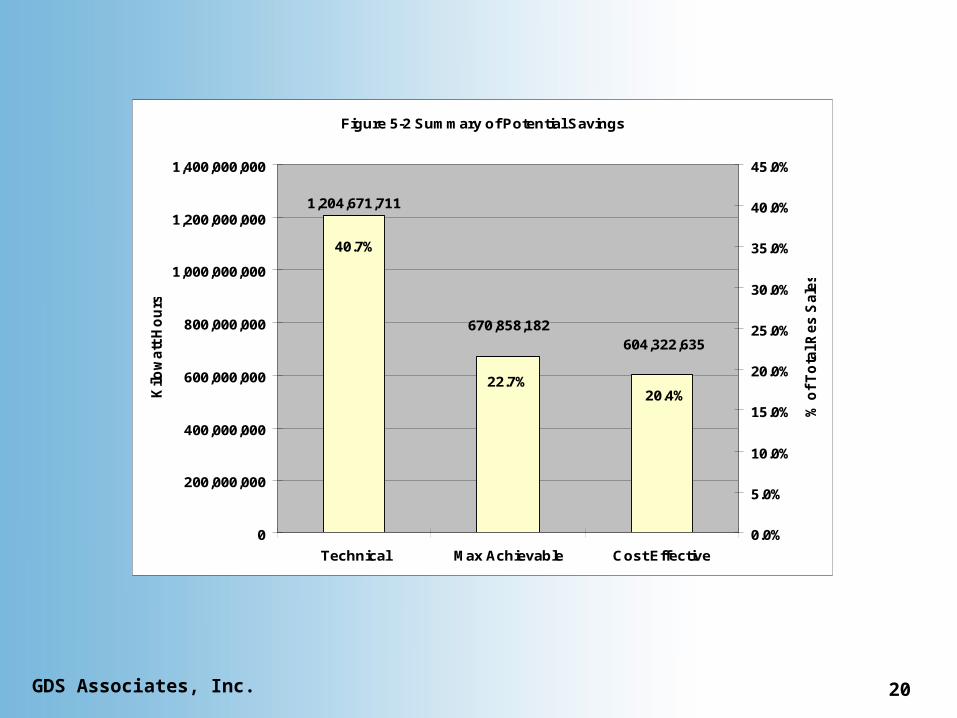
Figure 5-2 Summary of Potential Savings
1,204,671,711
670,858,182604,322,635
20.4%22.7%
40.7%
0
200,000,000
400,000,000
600,000,000
800,000,000
1,000,000,000
1,200,000,000
1,400,000,000
Technical Max Achievable Cost Effective
Kilo
wa
tt H
ou
rs
0.0%
5.0%
10.0%
15.0%
20.0%
25.0%
30.0%
35.0%
40.0%
45.0%
% o
f T
ota
l Re
s S
ale
s
GDS Associates, Inc. 21
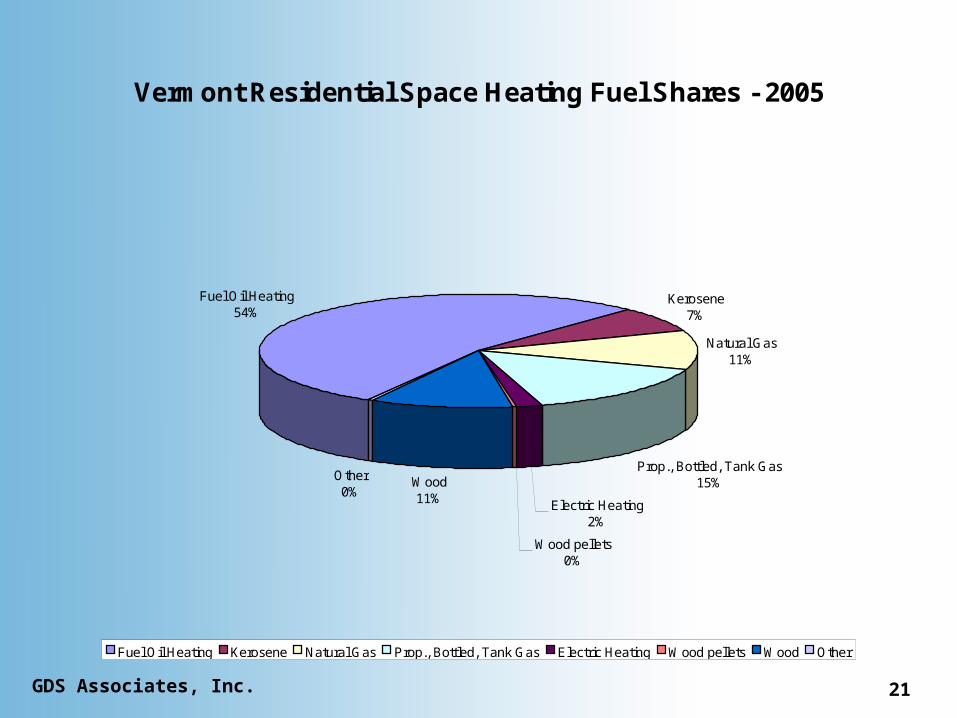
Vermont Residential Space Heating Fuel Shares - 2005
Fuel Oil Heating54%
Kerosene7%
Natural Gas11%
Prop., Bottled, Tank Gas15%
Electric Heating2%
Wood pellets0%
Wood11%
Other0%
Fuel Oil Heating Kerosene Natural Gas Prop., Bottled, Tank Gas Electric Heating Wood pellets Wood Other
GDS Associates, Inc. 22
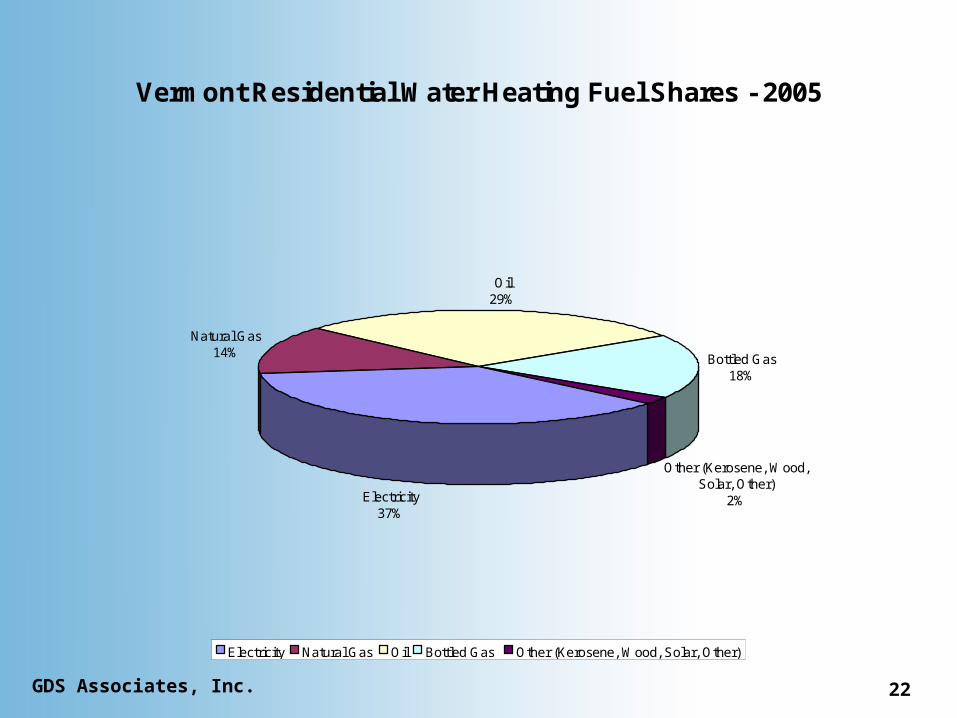
Vermont Residential Water Heating Fuel Shares - 2005
Electricity37%
Natural Gas14%
Oil29%
Bottled Gas 18%
Other (Kerosene, Wood, Solar, Other)
2%
Electricity Natural Gas Oil Bottled Gas Other (Kerosene, Wood, Solar, Other)
GDS Associates, Inc. 23
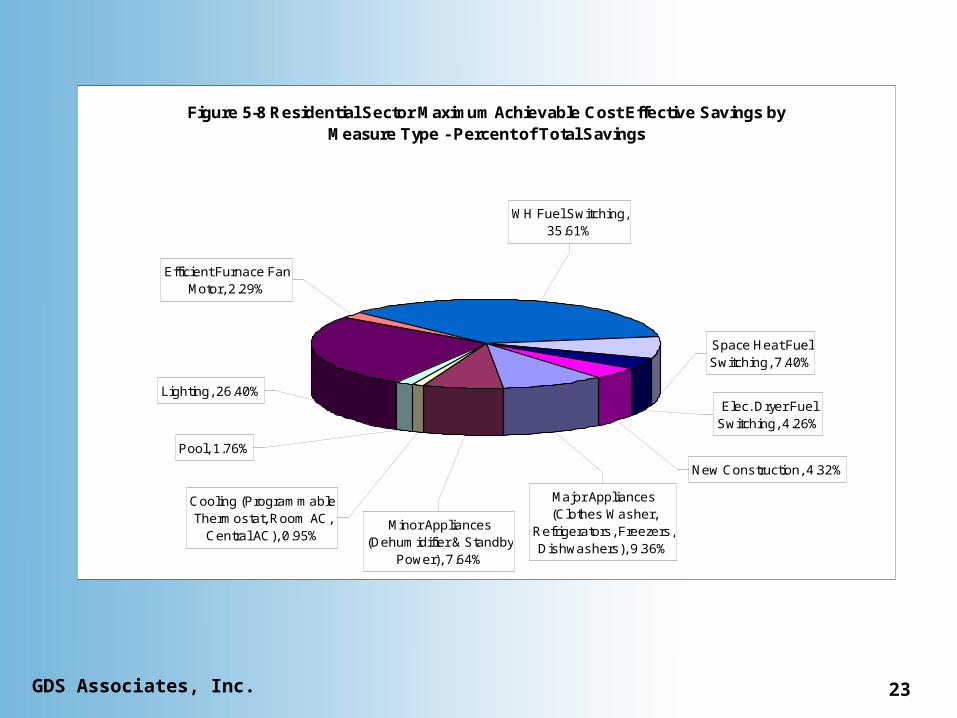
Figure 5-8 Residential Sector Maximum Achievable Cost Effective Savings by Measure Type - Percent of Total Savings
New Construction, 4.32%
Pool, 1.76%
Cooling (Programmable Thermostat, Room AC,
Central AC), 0.95%Minor Appliances
(Dehumidifier & Standby Power), 7.64%
Elec. Dryer Fuel Switching, 4.26%
Major Appliances (Clothes Washer,
Refrigerators, Freezers, Dishwashers), 9.36%
Space Heat Fuel Switching, 7.40%
WH Fuel Switching, 35.61%
Efficient Furnace Fan Motor, 2.29%
Lighting, 26.40%
Commercial Sector Findings
Commercial Sector Findings
April 10, 2006
GDS Associates, Inc. 25
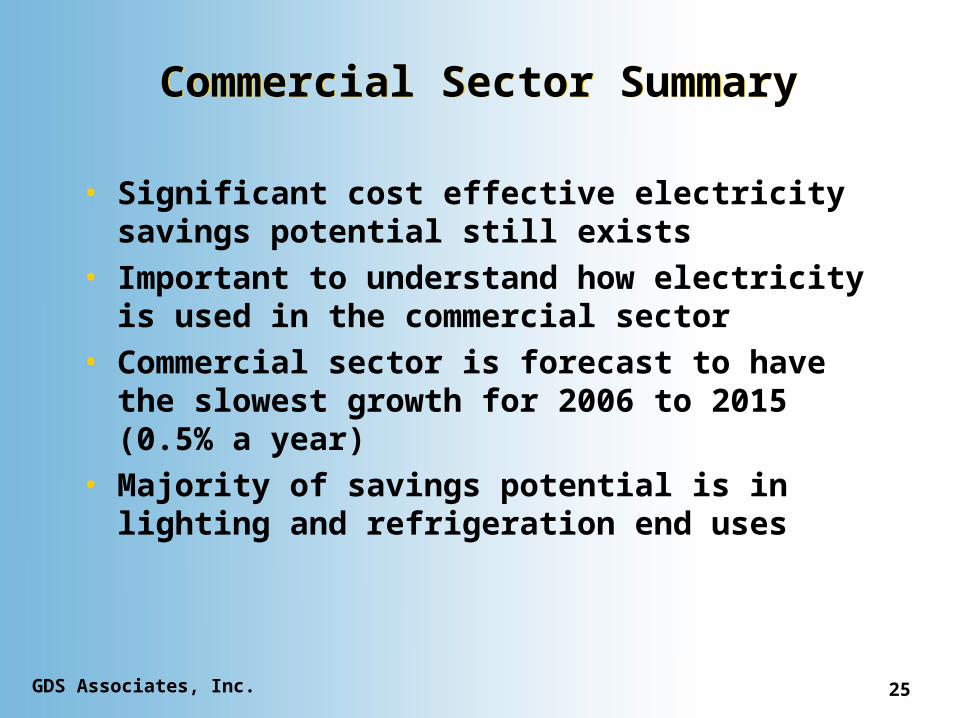
Commercial Sector SummaryCommercial Sector Summary
• Significant cost effective electricity savings potential still exists
• Important to understand how electricity is used in the commercial sector
• Commercial sector is forecast to have the slowest growth for 2006 to 2015 (0.5% a year)
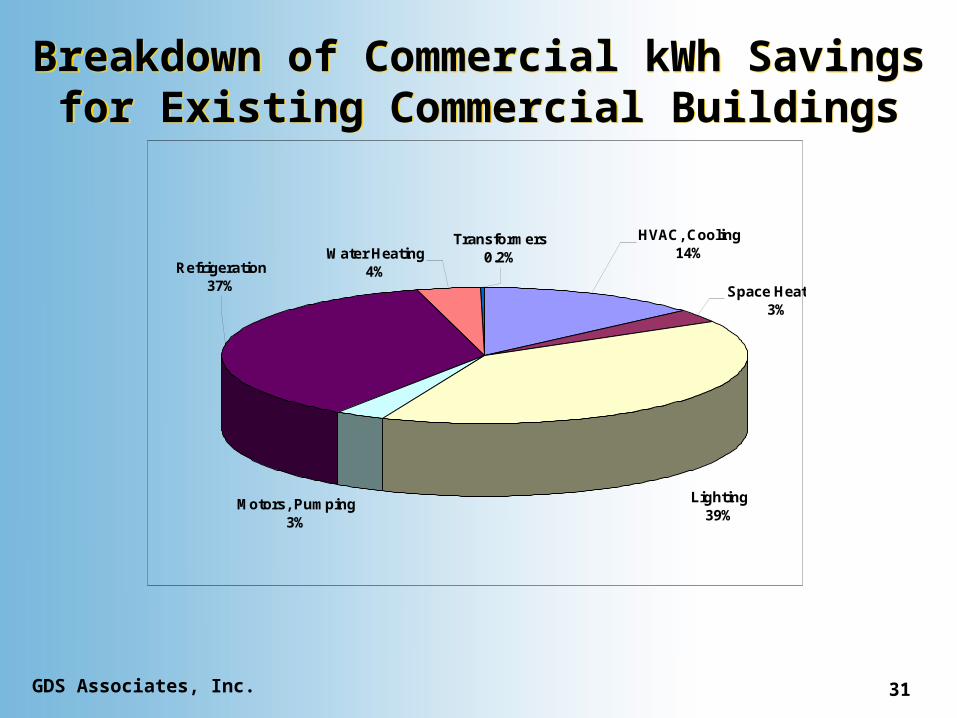
• Majority of savings potential is in lighting and refrigeration end uses
GDS Associates, Inc. 26
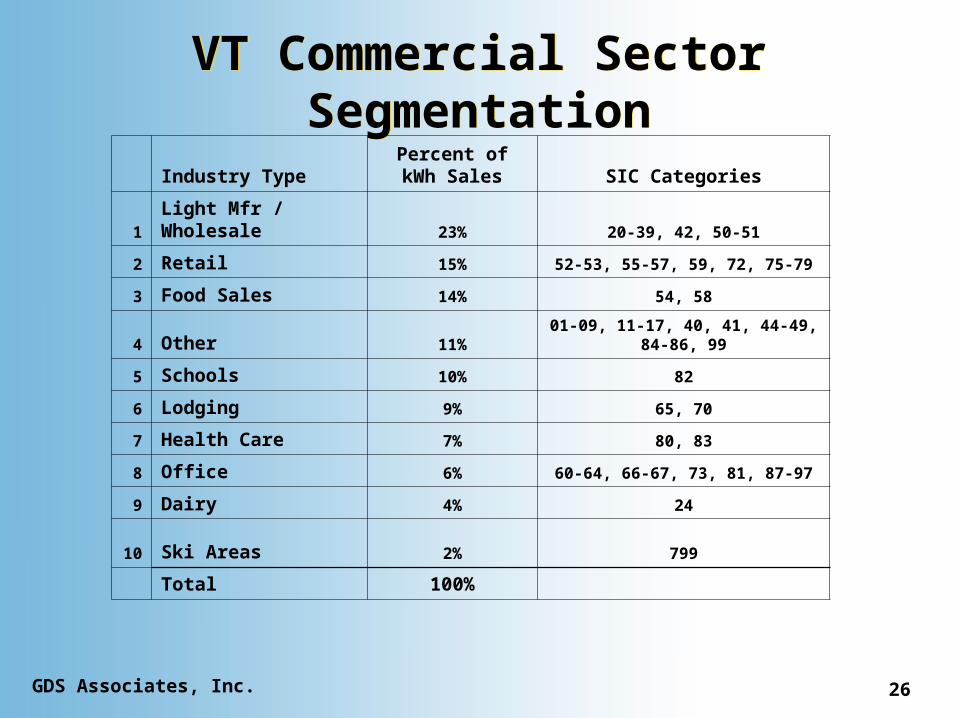
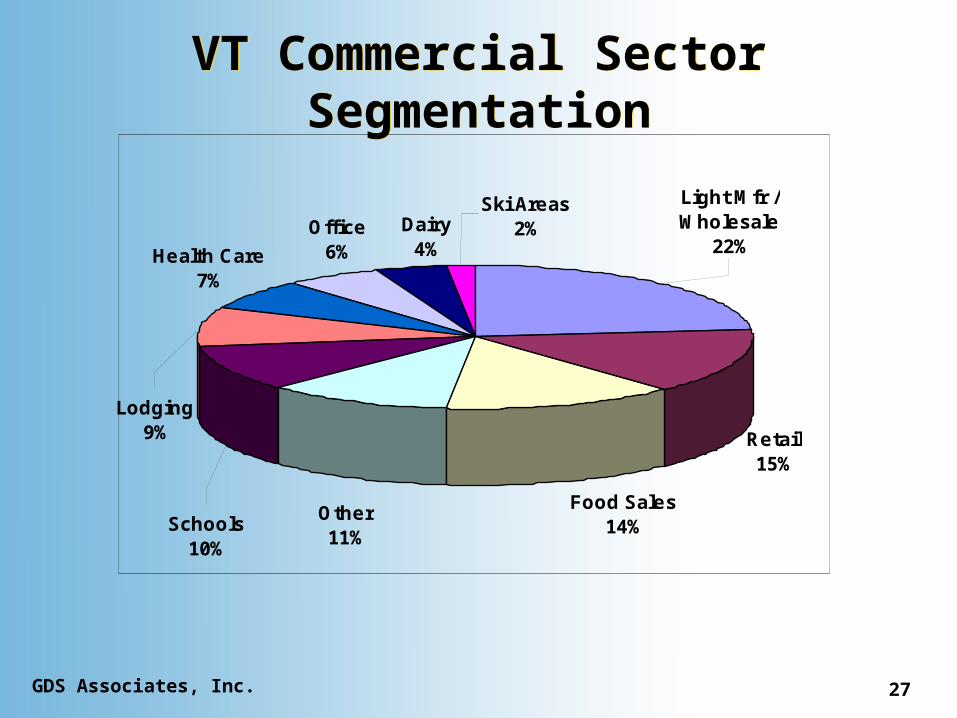
VT Commercial Sector Segmentation
VT Commercial Sector Segmentation
Industry TypePercent of kWh
Sales SIC Categories
1 Light Mfr / Wholesale 23% 20-39, 42, 50-51
2 Retail 15% 52-53, 55-57, 59, 72, 75-79
3 Food Sales 14% 54, 58
4 Other 11% 01-09, 11-17, 40, 41, 44-49, 84-86, 99
5 Schools 10% 82
6 Lodging 9% 65, 70
7 Health Care 7% 80, 83
8 Office 6% 60-64, 66-67, 73, 81, 87-97
9 Dairy 4% 24
10 Ski Areas 2% 799
Total 100%
GDS Associates, Inc. 27
VT Commercial Sector Segmentation
VT Commercial Sector Segmentation
Retail15%
Food Sales14%
Ski Areas2%
Light Mfr / Wholesale
22%
Other11%
Health Care7%
Lodging9%
Schools10%
Office6%
Dairy4%
GDS Associates, Inc. 28
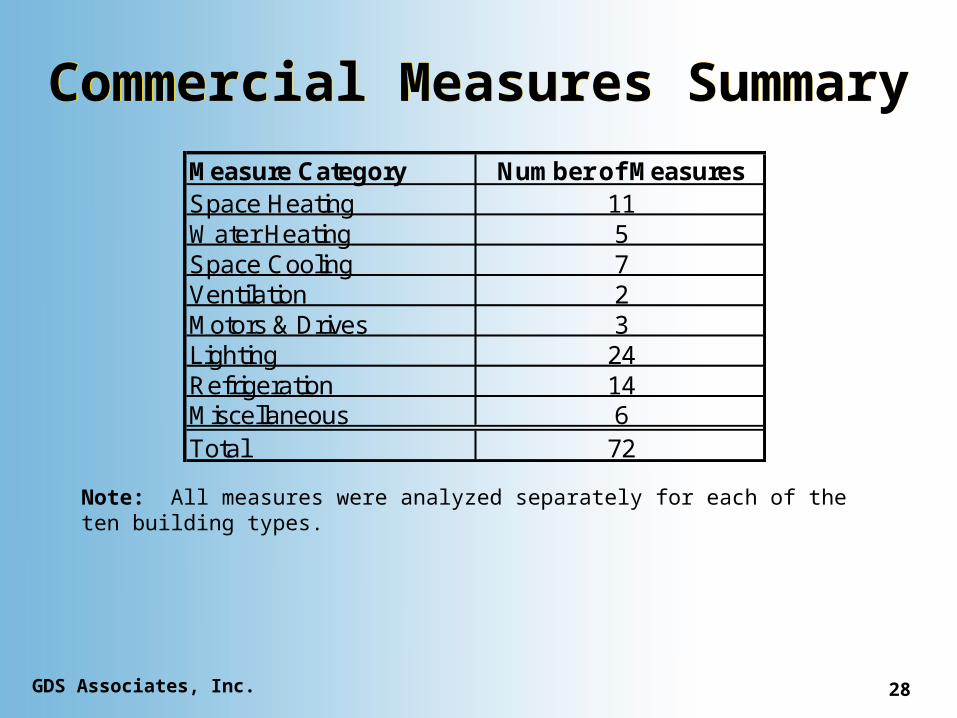
Commercial Measures Summary
Commercial Measures Summary
Measure Category Number of MeasuresSpace Heating 11Water Heating 5Space Cooling 7Ventilation 2Motors & Drives 3Lighting 24Refrigeration 14Miscellaneous 6Total 72
Note: All measures were analyzed separately for each of the ten building types.
GDS Associates, Inc. 29
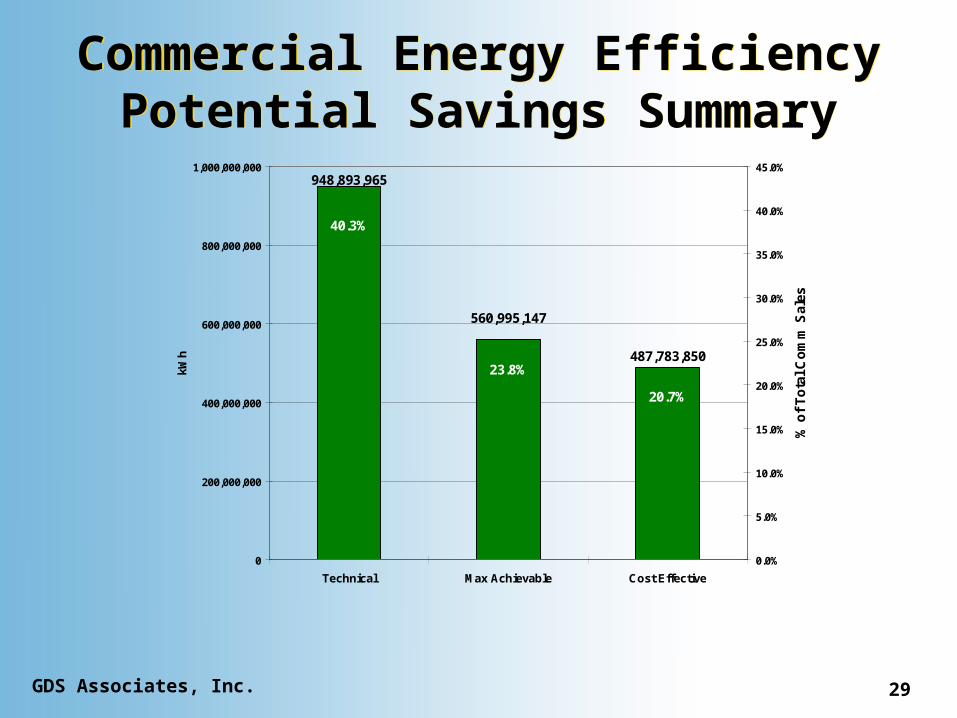
Commercial Energy Efficiency Potential Savings Summary
Commercial Energy Efficiency Potential Savings Summary
487,783,850
560,995,147
948,893,965
40.3%
23.8%
20.7%
0
200,000,000
400,000,000
600,000,000
800,000,000
1,000,000,000
Technical Max Achievable Cost Effective
kWh
0.0%
5.0%
10.0%
15.0%
20.0%
25.0%
30.0%
35.0%
40.0%
45.0%
% o
f T
ota
l C
om
m S
ales
GDS Associates, Inc. 30
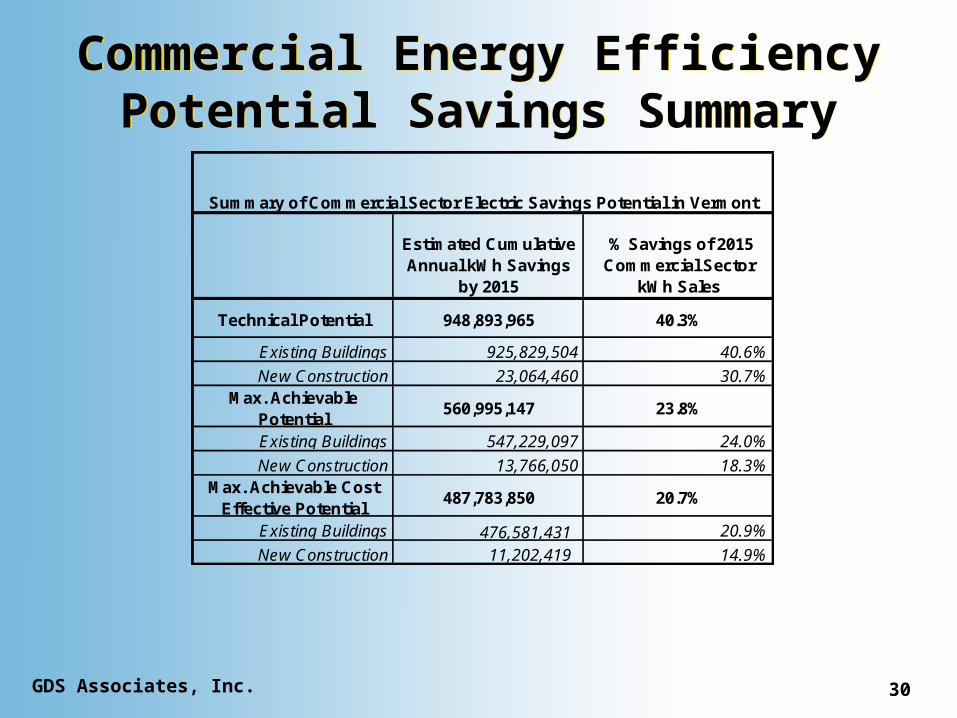
Commercial Energy Efficiency Potential Savings Summary
Commercial Energy Efficiency Potential Savings Summary
Estimated Cumulative Annual kWh Savings
by 2015
% Savings of 2015 Commercial Sector
kWh Sales
Technical Potential 948,893,965 40.3%
Existing Buildings 925,829,504 40.6%
New Construction 23,064,460 30.7%Max. Achievable
Potential560,995,147 23.8%
Existing Buildings 547,229,097 24.0%
New Construction 13,766,050 18.3%Max. Achievable Cost
Effective Potential487,783,850 20.7%
Existing Buildings 476,581,431 20.9%
New Construction 11,202,419 14.9%
Summary of Commercial Sector Electric Savings Potential in Vermont
GDS Associates, Inc. 31
Breakdown of Commercial kWh Savings for Existing Commercial
Buildings
Breakdown of Commercial kWh Savings for Existing Commercial
Buildings
Motors, Pumping3%
Refrigeration37%
HVAC, Cooling14%
Transformers0.2%Water Heating
4%
Lighting39%
Space Heating3%
GDS Associates, Inc. 32
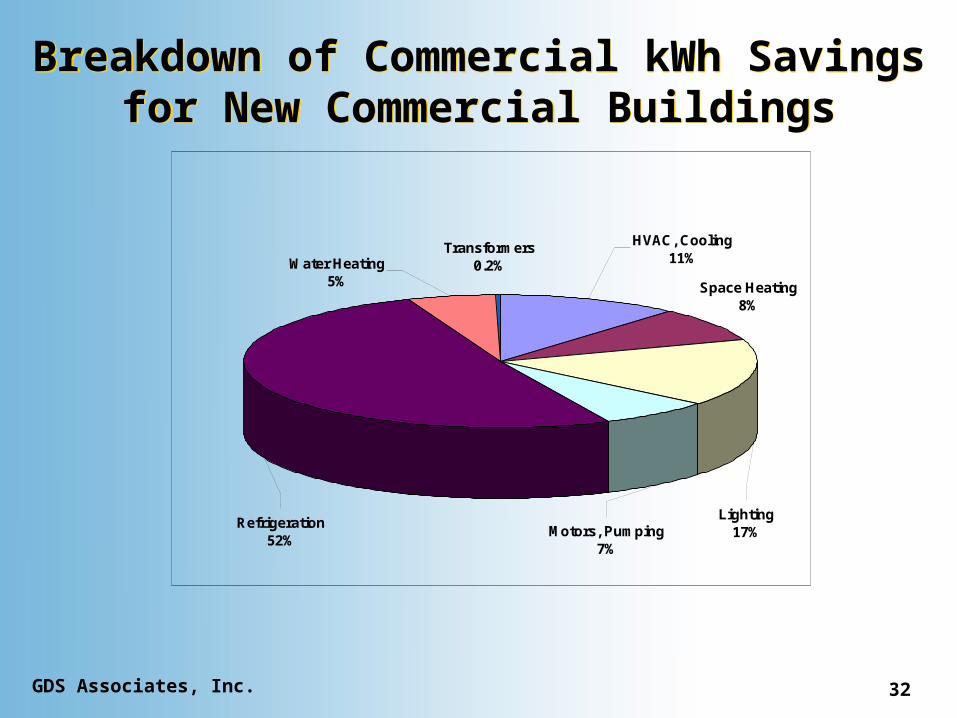
Breakdown of Commercial kWh Savings for New Commercial Buildings
Breakdown of Commercial kWh Savings for New Commercial Buildings
Motors, Pumping7%
Refrigeration52%
HVAC, Cooling11%
Transformers0.2%Water Heating
5%
Lighting17%
Space Heating8%
GDS Associates, Inc. 33
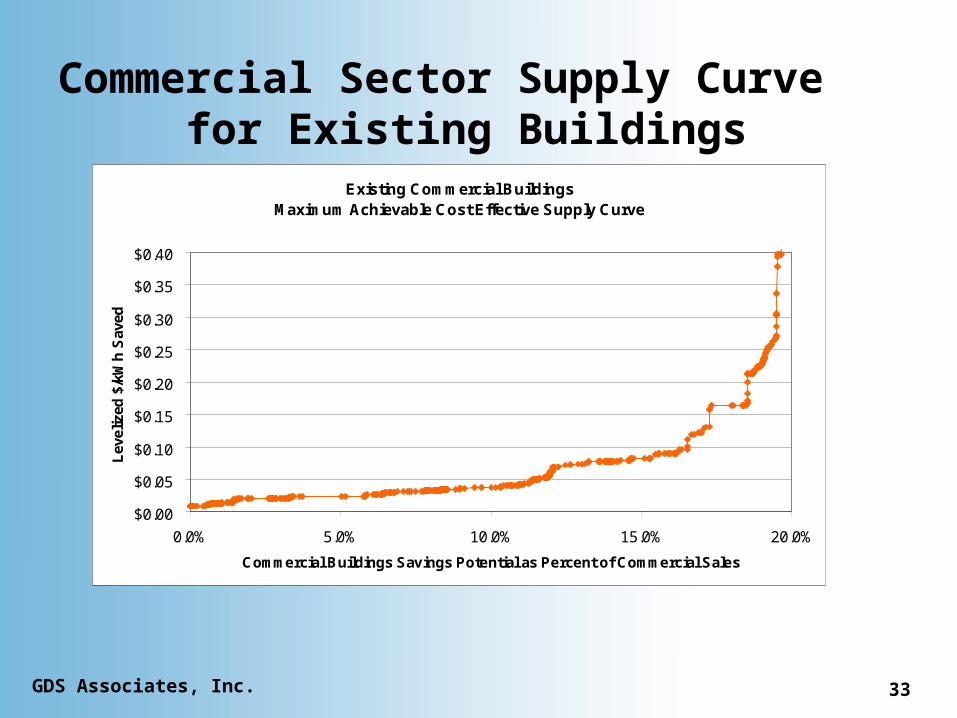
Commercial Sector Supply Curve for Existing Buildings
Existing Commercial Buildings Maximum Achievable Cost Effective Supply Curve
$0.00
$0.05
$0.10
$0.15
$0.20
$0.25
$0.30
$0.35
$0.40
0.0% 5.0% 10.0% 15.0% 20.0%
Commercial Buildings Savings Potential as Percent of Commercial Sales
Lev
eliz
ed $
/kW
h S
aved
GDS Associates, Inc. 34
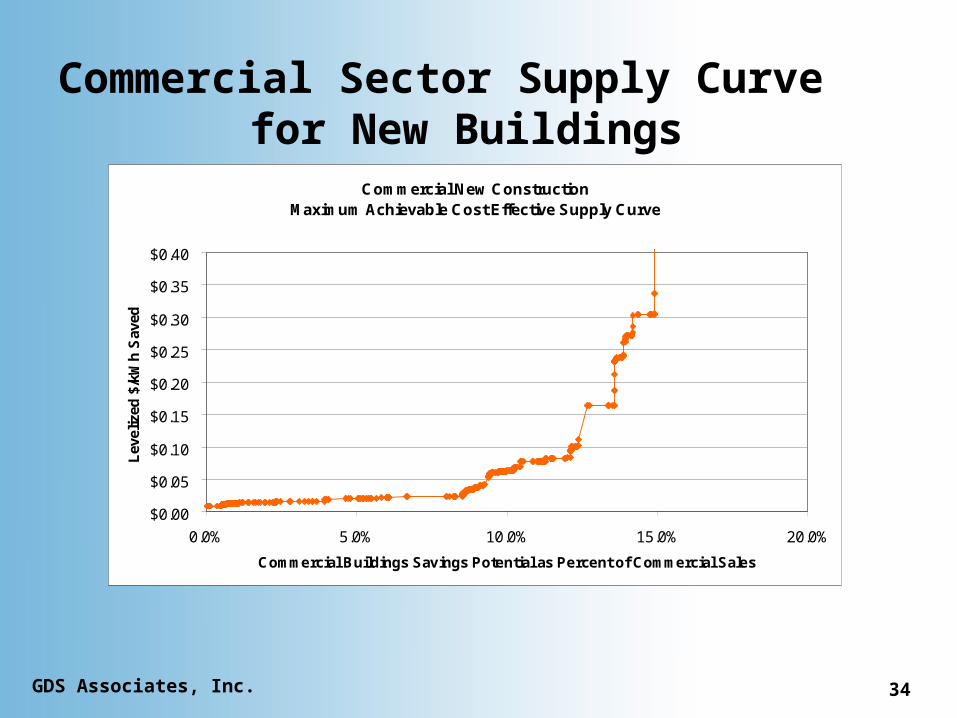
Commercial Sector Supply Curve for New Buildings
Commercial New ConstructionMaximum Achievable Cost Effective Supply Curve
$0.00
$0.05
$0.10
$0.15
$0.20
$0.25
$0.30
$0.35
$0.40
0.0% 5.0% 10.0% 15.0% 20.0%
Commercial Buildings Savings Potential as Percent of Commercial Sales
Lev
eliz
ed $
/kW
h S
aved

Industrial Sector Findings
Industrial Sector Findings
April 10, 2006
GDS Associates, Inc. 36
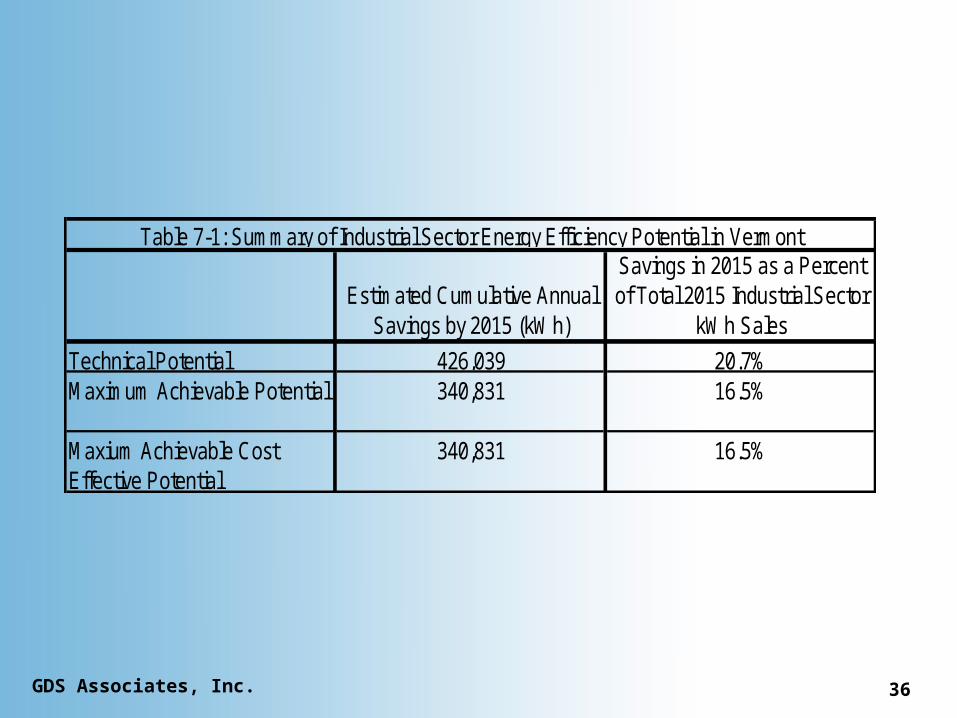
Estimated Cumulative Annual Savings by 2015 (kWh)
Savings in 2015 as a Percent of Total 2015 Industrial Sector
kWh Sales
Technical Potential 426,039 20.7%Maximum Achievable Potential 340,831 16.5%
Maxium Achievable Cost Effective Potential
340,831 16.5%
Table 7-1: Summary of Industrial Sector Energy Efficiency Potential in Vermont
GDS Associates, Inc. 37
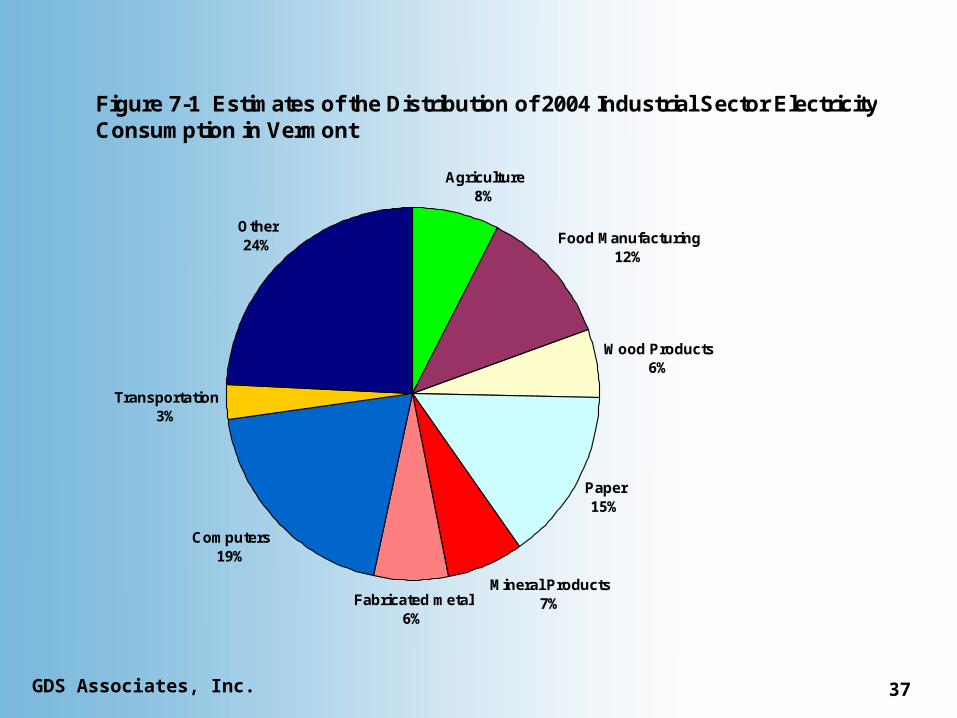
Figure 7-1 Estimates of the Distribution of 2004 Industrial Sector Electricity Consumption in Vermont
Agriculture8%
Food Manufacturing12%
Wood Products6%
Paper15%
Mineral Products7%Fabricated metal
6%
Computers19%
Transportation3%
Other24%
GDS Associates, Inc. 38
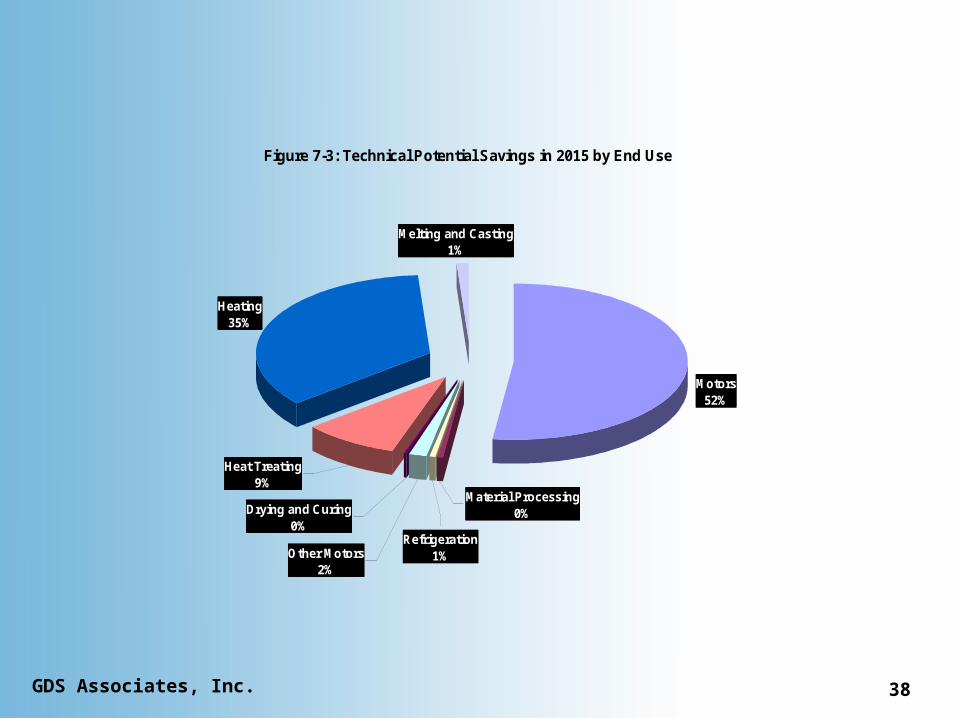
Figure 7-3: Technical Potential Savings in 2015 by End Use
Motors52%
Heating35%
Melting and Casting1%
Heat Treating9%
Refrigeration1%
Drying and Curing0%
Other Motors2%
Material Processing0%
GDS Associates, Inc. 39
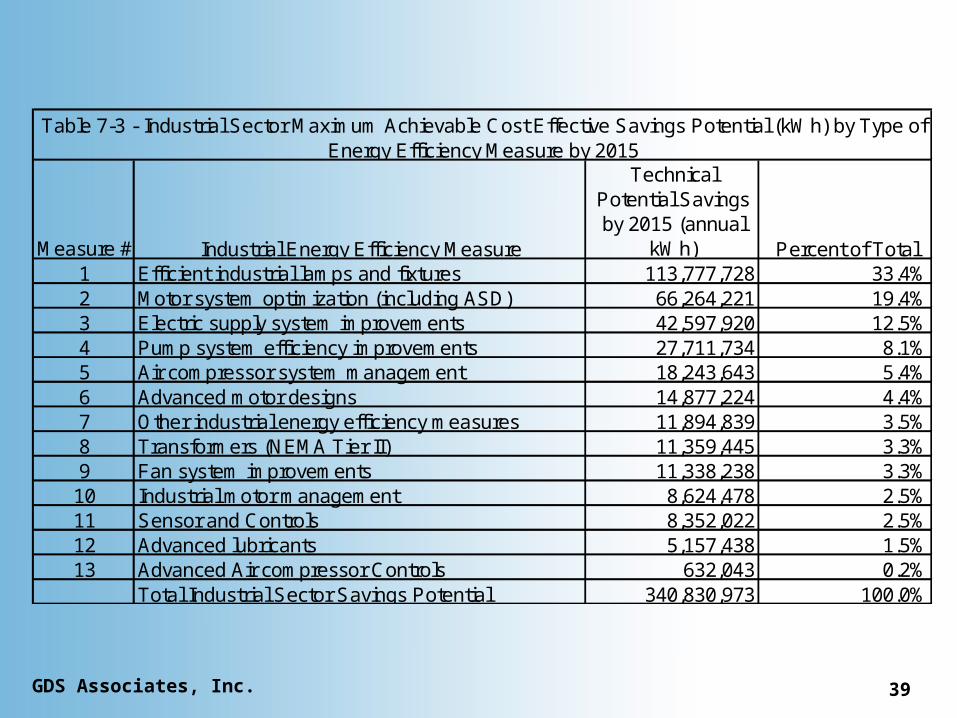
Measure # Industrial Energy Efficiency Measure
Technical Potential Savings by 2015 (annual
kWh) Percent of Total1 Efficient industrial lamps and fixtures 113,777,728 33.4%2 Motor system optimization (including ASD) 66,264,221 19.4%3 Electric supply system improvements 42,597,920 12.5%4 Pump system efficiency improvements 27,711,734 8.1%5 Air compressor system management 18,243,643 5.4%6 Advanced motor designs 14,877,224 4.4%7 Other industrial energy efficiency measures 11,894,839 3.5%8 Transformers (NEMA Tier II) 11,359,445 3.3%9 Fan system improvements 11,338,238 3.3%10 Industrial motor management 8,624,478 2.5%11 Sensor and Controls 8,352,022 2.5%12 Advanced lubricants 5,157,438 1.5%13 Advanced Air compressor Controls 632,043 0.2%
Total Industrial Sector Savings Potential 340,830,973 100.0%
Table 7-3 - Industrial Sector Maximum Achievable Cost Effective Savings Potential (kWh) by Type of Energy Efficiency Measure by 2015