Vermillion River Monitoring Network 2008 Report · Vermillion River Monitoring Network 2008 Report...
13
Vermillion River Monitoring Network 2008 Report Prepared for: Vermillion River Watershed Joint Powers Organization May, 2009 Prepared by: Dakota County Soil and Water Conservation District
Transcript of Vermillion River Monitoring Network 2008 Report · Vermillion River Monitoring Network 2008 Report...
Vermillion River Monitoring Network
2008 Report
Prepared for:
Vermillion River Watershed Joint Powers Organization
May, 2009
Prepared by:
Dakota County Soil and Water Conservation District
Acknowledgments: The results presented in this report would not be complete without contributions made by the following persons:
Brooke Asleson-Minnesota Pollution Control Agency
Andrea Bergman-Minnesota Department of Natural Resources
Melissa Bokman-Scott County
Cassandra Champion-Metropolitan Council Environmental Services
Kim Chapman-Applied Ecological Services, Inc.
Curt Coudron-Dakota County Soil and Water Conservation District
Dave Holmen-Dakota County Soil and Water Conservation District
Karen Jensen-Metropolitan Council
Laura Jester-Dakota County Soil and Water Conservation District
Greg Kruse-Minnesota Department of Natural Resources
Ann Messerschmidt-City of Lakeville, MN
Paul Nelson-Scott County and Vermillion River Watershed Joint Powers Organization Scott County Administrator
Brian Nerbonne-Minnesota Department of Natural Resources
Lisa Pearson-Minnesota Department of Natural Resources
Jaime Rockney-Scott Soil and Water Conservation District
Laurie Sovell-Minnesota Pollution Control Agency
Travis Thiel-Dakota County and Vermillion River Joint Powers Organization
Justin Watkins-Minnesota Pollution Control Agency
Mark Zabel-Dakota County and Vermillion River Joint Powers Organization Dakota County Administrator
Executive Summary: The Vermillion River Monitoring Network was created to collect water quality/quantity information throughout the Vermillion River
Watershed. Samples are analyzed for a variety of parameters including nutrients, bacteria, and sediment. These results are used to
establish long-term water quality and quantity data, provide trend analysis and pollutant loading values. Results for the 2008 monitoring season are compared against state water quality standards or minimally impacted stream eco-region
means, developed by the Minnesota Pollution Control Agency (Appendix A). Results in red text are exceeding state water quality
standards or eco-region means.
Although most parameters are below state standards or minimally impacted stream eco-region means, several parameters did exceed
water quality standards and/or eco-region means. Wastewater treatment plant discharge can contribute to elevated conductivity levels
and may explain the conductivity results for those sites nearest to the Elko/New Market waste water treatment plant. Since the
Vermillion River has been listed as impaired for bacteria, it is not surprising that 2008 E. coli results continued to exceed the state
standard at all locations. A region-wide Total Maximum Daily Load (TMDL) study has been completed to help address elevated
bacteria concentrations (MPCA 2006). Nitrate results were unusually high at the South Branch site, and may warrant further
investigation in view of nitrate groundwater contamination in the eastern portion of the watershed. Mean turbidity (cloudiness) results
at sites VR807 and SB802, located in the trout stream portion of the watershed, are only slightly exceeding the state turbidity standard,
but may still constitute a violation of state water quality standards.
Introduction:
The Vermillion River Watershed is one of the largest watersheds located within the Minneapolis/St. Paul metropolitan area. More
importantly, the watershed is home to a robust and thriving trout population located within two rapidly growing counties in
Minnesota. As a result, numerous water quality monitoring programs are actively assessing the health of this watershed. The purpose
of this report it to concisely summarize the results of the surface water quality monitoring activities sponsored by the Vermillion River
Watershed Joint Powers Organization (VRWJPO) and completed by the Dakota County Soil and Water Conservation District
(DCSWCD) and the Scott Soil and Water Conservation District (SSWCD).
In addition to describing results from 2008, this report includes historical water quality monitoring results from as early as 2000. The
historical results presented here are intended to describe long-term water quality trends apparent in the watershed. The level of
statistical analysis completed here is limited due to a relatively brief water quality record, and results should be considered
preliminary.
Vermillion River Monitoring Network: The Vermillion River Monitoring Network (VRMN) was created in the early 1990’s to a obtain water quality data from the Vermillion
River Watershed and initially consisted of six monitoring stations located in Dakota County. Since then, the network has grown to
include a total of eight permanent monitoring stations (Figure 1) and includes an automated weather station designed to assist with
water quality analysis in the Vermillion River Watershed.
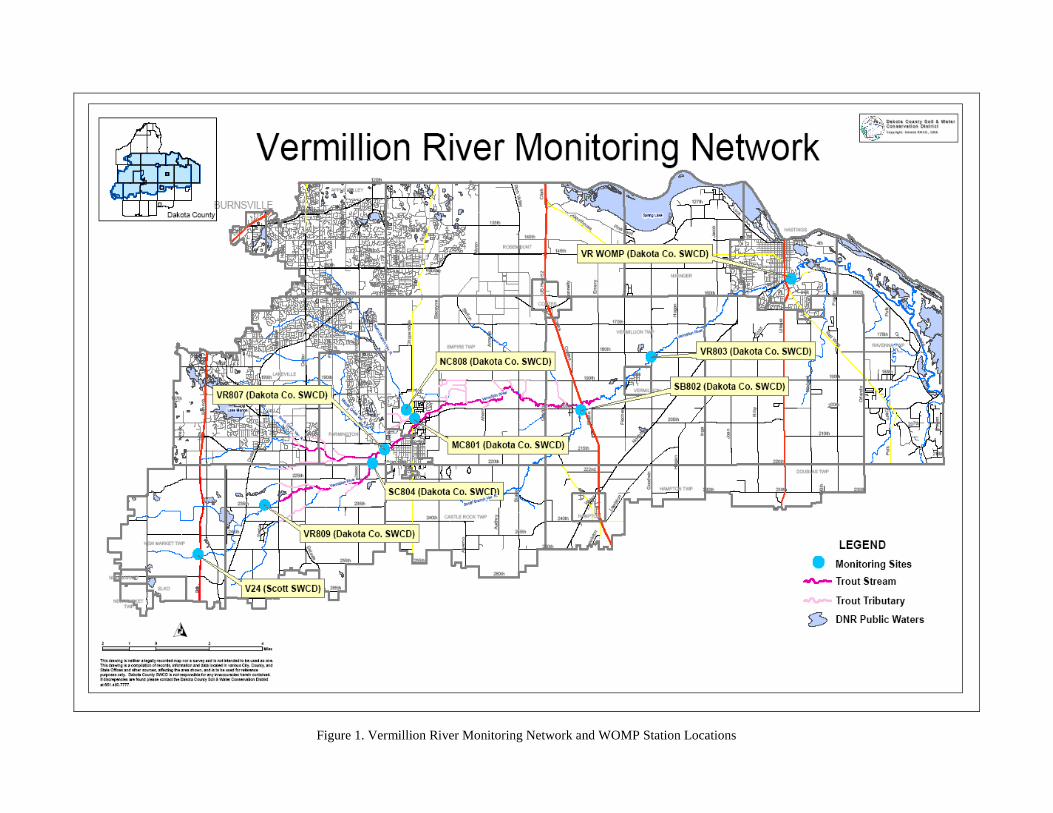
Figure 1. Vermillion River Monitoring Network and WOMP Station Locations
In 2008, the Minnesota Pollution Control Agency (MPCA) listed the
Vermillion River as impaired for turbidity. This new listing extends
along the main channel of the Vermillion River, from Highview
Avenue in Lakeville, MN to just west of Highway 3 in Farmington,
MN. In anticipation of the forthcoming turbidity TMDL study, the
VRWJPO purchased two automated turbidity probes to supplement
existing turbidity data for the impaired reach (Figure 2). This new
equipment will allow for an improved understanding of conditions
contributing to turbidity exceedances of state water quality standards
and will aid in future TMDL load calculations.
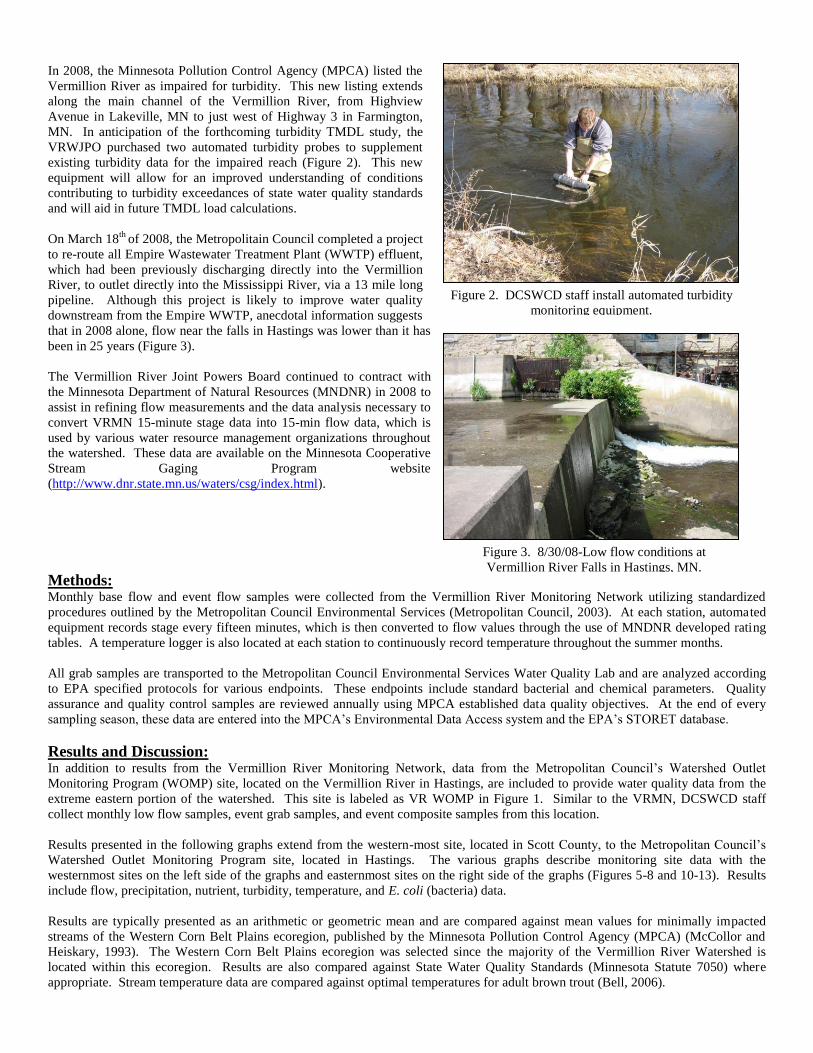
On March 18th
of 2008, the Metropolitain Council completed a project
to re-route all Empire Wastewater Treatment Plant (WWTP) effluent,
which had been previously discharging directly into the Vermillion
River, to outlet directly into the Mississippi River, via a 13 mile long
pipeline. Although this project is likely to improve water quality
downstream from the Empire WWTP, anecdotal information suggests
that in 2008 alone, flow near the falls in Hastings was lower than it has
been in 25 years (Figure 3).
The Vermillion River Joint Powers Board continued to contract with
the Minnesota Department of Natural Resources (MNDNR) in 2008 to
assist in refining flow measurements and the data analysis necessary to
convert VRMN 15-minute stage data into 15-min flow data, which is
used by various water resource management organizations throughout
the watershed. These data are available on the Minnesota Cooperative
Stream Gaging Program website
(http://www.dnr.state.mn.us/waters/csg/index.html).
Methods:
Monthly base flow and event flow samples were collected from the Vermillion River Monitoring Network utilizing standardized
procedures outlined by the Metropolitan Council Environmental Services (Metropolitan Council, 2003). At each station, automated
equipment records stage every fifteen minutes, which is then converted to flow values through the use of MNDNR developed rating
tables. A temperature logger is also located at each station to continuously record temperature throughout the summer months.
All grab samples are transported to the Metropolitan Council Environmental Services Water Quality Lab and are analyzed according
to EPA specified protocols for various endpoints. These endpoints include standard bacterial and chemical parameters. Quality
assurance and quality control samples are reviewed annually using MPCA established data quality objectives. At the end of every
sampling season, these data are entered into the MPCA’s Environmental Data Access system and the EPA’s STORET database.
Results and Discussion: In addition to results from the Vermillion River Monitoring Network, data from the Metropolitan Council’s Watershed Outlet
Monitoring Program (WOMP) site, located on the Vermillion River in Hastings, are included to provide water quality data from the
extreme eastern portion of the watershed. This site is labeled as VR WOMP in Figure 1. Similar to the VRMN, DCSWCD staff
collect monthly low flow samples, event grab samples, and event composite samples from this location.
Results presented in the following graphs extend from the western-most site, located in Scott County, to the Metropolitan Council’s
Watershed Outlet Monitoring Program site, located in Hastings. The various graphs describe monitoring site data with the
westernmost sites on the left side of the graphs and easternmost sites on the right side of the graphs (Figures 5-8 and 10-13). Results
include flow, precipitation, nutrient, turbidity, temperature, and E. coli (bacteria) data.
Results are typically presented as an arithmetic or geometric mean and are compared against mean values for minimally impacted
streams of the Western Corn Belt Plains ecoregion, published by the Minnesota Pollution Control Agency (MPCA) (McCollor and
Heiskary, 1993). The Western Corn Belt Plains ecoregion was selected since the majority of the Vermillion River Watershed is
located within this ecoregion. Results are also compared against State Water Quality Standards (Minnesota Statute 7050) where
appropriate. Stream temperature data are compared against optimal temperatures for adult brown trout (Bell, 2006).
Figure 3. 8/30/08-Low flow conditions at
Vermillion River Falls in Hastings, MN.
Figure 2. DCSWCD staff install automated turbidity
monitoring equipment.
Comparisons with ecoregion mean data and state standards are simple and are only intended to be used as a coarse method to identify
water quality exceedances. These analyses are not intended to be a definitive determination of water quality impairment. Assessment
of impairment is completed bi-annually by the MPCA using a more comprehensive process and assessment methods.
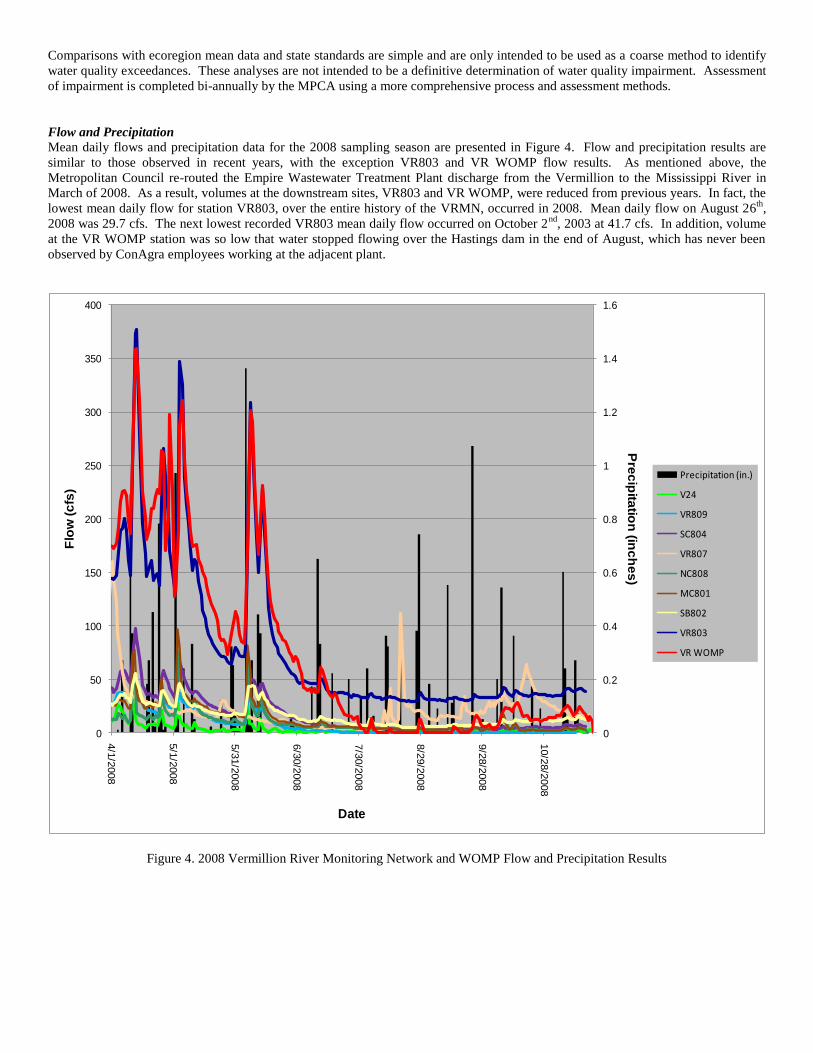
Flow and Precipitation
Mean daily flows and precipitation data for the 2008 sampling season are presented in Figure 4. Flow and precipitation results are
similar to those observed in recent years, with the exception VR803 and VR WOMP flow results. As mentioned above, the
Metropolitan Council re-routed the Empire Wastewater Treatment Plant discharge from the Vermillion to the Mississippi River in
March of 2008. As a result, volumes at the downstream sites, VR803 and VR WOMP, were reduced from previous years. In fact, the
lowest mean daily flow for station VR803, over the entire history of the VRMN, occurred in 2008. Mean daily flow on August 26th
,
2008 was 29.7 cfs. The next lowest recorded VR803 mean daily flow occurred on October 2nd
, 2003 at 41.7 cfs. In addition, volume
at the VR WOMP station was so low that water stopped flowing over the Hastings dam in the end of August, which has never been
observed by ConAgra employees working at the adjacent plant.
0
0.2
0.4
0.6
0.8
1
1.2
1.4
1.6
0
50
100
150
200
250
300
350
400
4/1
/2008
5/1
/2008
5/3
1/2
008
6/3
0/2
008
7/3
0/2
008
8/2
9/2
008
9/2
8/2
008
10/2
8/2
008
Pre
cip
itatio
n (in
ch
es
)
Flo
w (c
fs)
Date
Precipitation (in.)
V24
VR809
SC804
VR807
NC808
MC801
SB802
VR803
VR WOMP
Figure 4. 2008 Vermillion River Monitoring Network and WOMP Flow and Precipitation Results
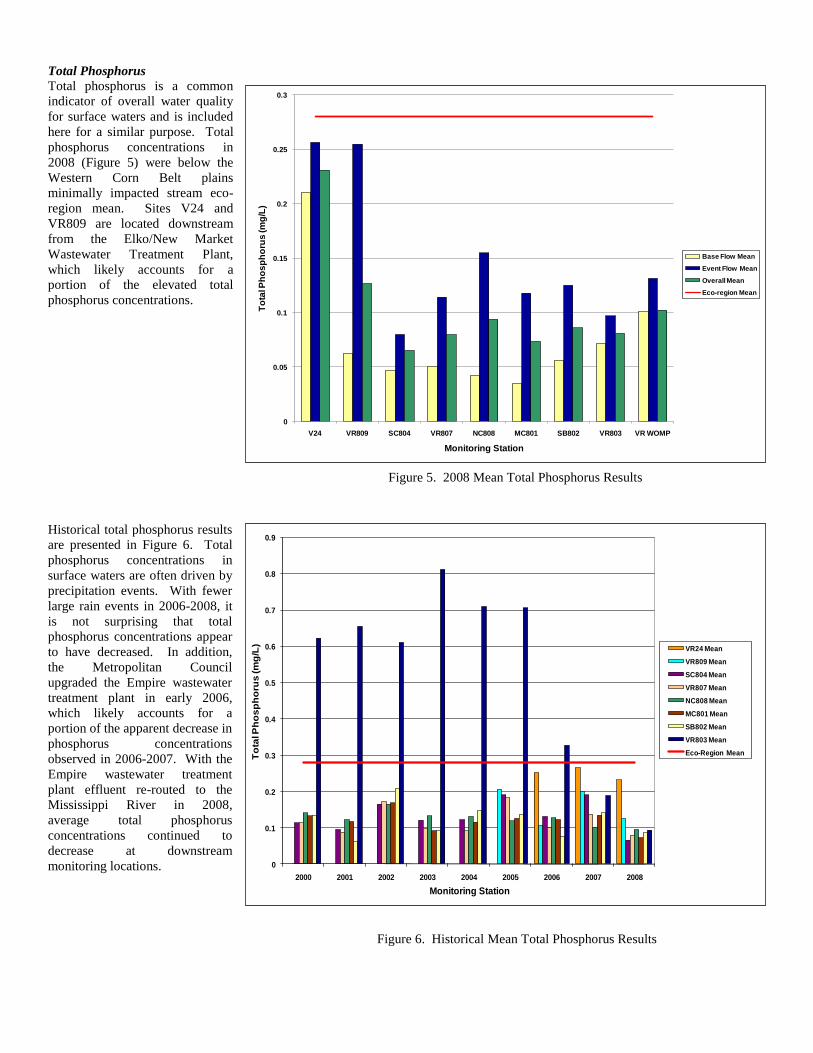
Total Phosphorus
Total phosphorus is a common
indicator of overall water quality
for surface waters and is included
here for a similar purpose. Total
phosphorus concentrations in
2008 (Figure 5) were below the
Western Corn Belt plains
minimally impacted stream eco-
region mean. Sites V24 and
VR809 are located downstream
from the Elko/New Market
Wastewater Treatment Plant,
which likely accounts for a
portion of the elevated total
phosphorus concentrations.
Historical total phosphorus results
are presented in Figure 6. Total
phosphorus concentrations in
surface waters are often driven by
precipitation events. With fewer
large rain events in 2006-2008, it
is not surprising that total
phosphorus concentrations appear
to have decreased. In addition,
the Metropolitan Council
upgraded the Empire wastewater
treatment plant in early 2006,
which likely accounts for a
portion of the apparent decrease in
phosphorus concentrations
observed in 2006-2007. With the
Empire wastewater treatment
plant effluent re-routed to the
Mississippi River in 2008,
average total phosphorus
concentrations continued to
decrease at downstream
monitoring locations.
Figure 6. Historical Mean Total Phosphorus Results
0
0.05
0.1
0.15
0.2
0.25
0.3
V24 VR809 SC804 VR807 NC808 MC801 SB802 VR803 VR WOMP
To
tal P
ho
sp
ho
rus
(m
g/L
)
Monitoring Station
Base Flow Mean
Event Flow Mean
Overall Mean
Eco-region Mean
Figure 5. 2008 Mean Total Phosphorus Results
0
0.1
0.2
0.3
0.4
0.5
0.6
0.7
0.8
0.9
2000 2001 2002 2003 2004 2005 2006 2007 2008
To
tal P
ho
sp
ho
rus
(m
g/L
)
Monitoring Station
VR24 Mean
VR809 Mean
SC804 Mean
VR807 Mean
NC808 Mean
MC801 Mean
SB802 Mean
VR803 Mean
Eco-Region Mean
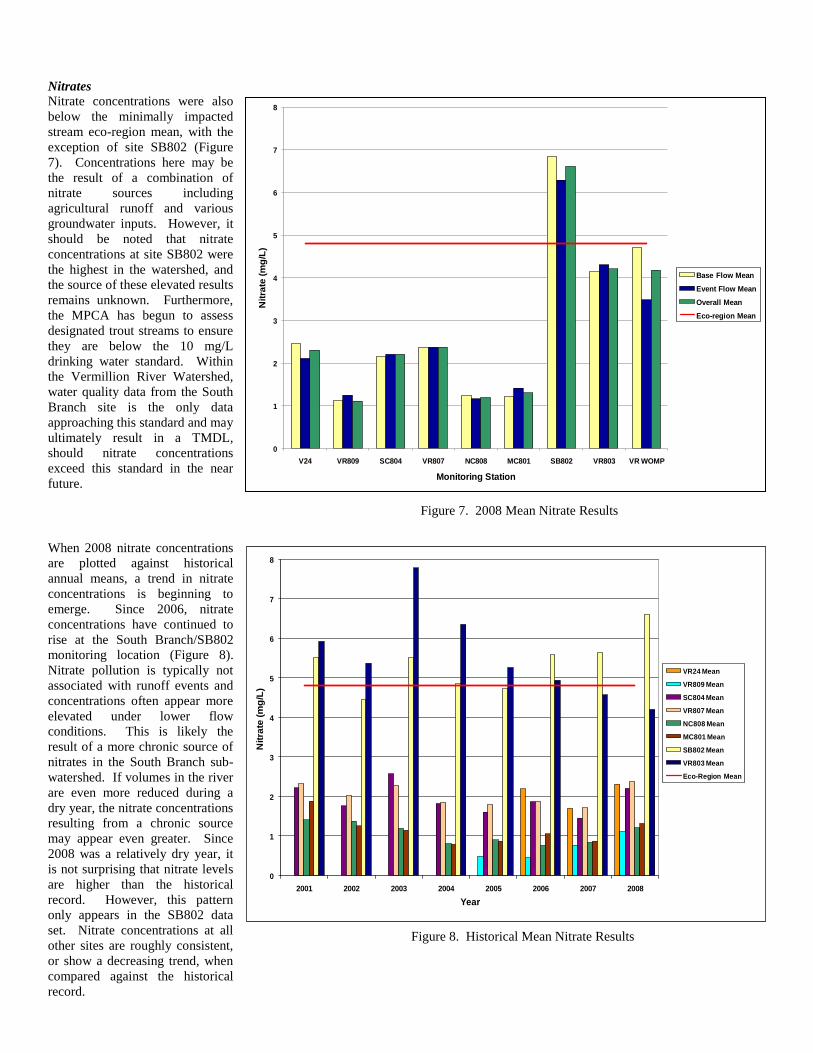
Nitrates Nitrate concentrations were also
below the minimally impacted
stream eco-region mean, with the
exception of site SB802 (Figure
7). Concentrations here may be
the result of a combination of
nitrate sources including
agricultural runoff and various
groundwater inputs. However, it
should be noted that nitrate
concentrations at site SB802 were
the highest in the watershed, and
the source of these elevated results
remains unknown. Furthermore,
the MPCA has begun to assess
designated trout streams to ensure
they are below the 10 mg/L
drinking water standard. Within
the Vermillion River Watershed,
water quality data from the South
Branch site is the only data
approaching this standard and may
ultimately result in a TMDL,
should nitrate concentrations
exceed this standard in the near
future.
When 2008 nitrate concentrations
are plotted against historical
annual means, a trend in nitrate
concentrations is beginning to
emerge. Since 2006, nitrate
concentrations have continued to
rise at the South Branch/SB802
monitoring location (Figure 8).
Nitrate pollution is typically not
associated with runoff events and
concentrations often appear more
elevated under lower flow
conditions. This is likely the
result of a more chronic source of
nitrates in the South Branch sub-
watershed. If volumes in the river
are even more reduced during a
dry year, the nitrate concentrations
resulting from a chronic source
may appear even greater. Since
2008 was a relatively dry year, it
is not surprising that nitrate levels
are higher than the historical
record. However, this pattern
only appears in the SB802 data
set. Nitrate concentrations at all
other sites are roughly consistent,
or show a decreasing trend, when
compared against the historical
record.
0
1
2
3
4
5
6
7
8
V24 VR809 SC804 VR807 NC808 MC801 SB802 VR803 VR WOMP
Nit
rate
(m
g/L
)
Monitoring Station
Base Flow Mean
Event Flow Mean
Overall Mean
Eco-region Mean
Figure 7. 2008 Mean Nitrate Results
0
1
2
3
4
5
6
7
8
2001 2002 2003 2004 2005 2006 2007 2008
Nit
rate
(m
g/L
)
Year
VR24 Mean
VR809 Mean
SC804 Mean
VR807 Mean
NC808 Mean
MC801 Mean
SB802 Mean
VR803 Mean
Eco-Region Mean
Figure 8. Historical Mean Nitrate Results
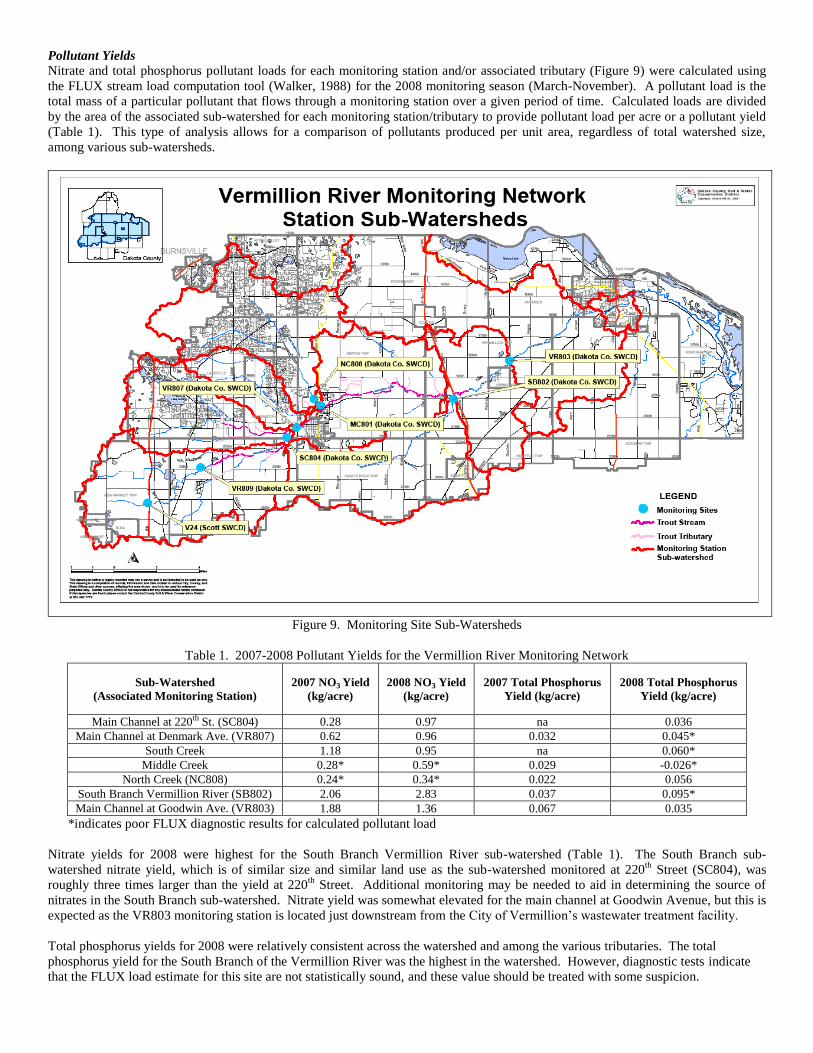
Pollutant Yields
Nitrate and total phosphorus pollutant loads for each monitoring station and/or associated tributary (Figure 9) were calculated using
the FLUX stream load computation tool (Walker, 1988) for the 2008 monitoring season (March-November). A pollutant load is the
total mass of a particular pollutant that flows through a monitoring station over a given period of time. Calculated loads are divided
by the area of the associated sub-watershed for each monitoring station/tributary to provide pollutant load per acre or a pollutant yield
(Table 1). This type of analysis allows for a comparison of pollutants produced per unit area, regardless of total watershed size,
among various sub-watersheds.
Figure 9. Monitoring Site Sub-Watersheds
Table 1. 2007-2008 Pollutant Yields for the Vermillion River Monitoring Network
Sub-Watershed
(Associated Monitoring Station)
2007 NO3 Yield
(kg/acre)
2008 NO3 Yield
(kg/acre)
2007 Total Phosphorus
Yield (kg/acre)
2008 Total Phosphorus
Yield (kg/acre)
Main Channel at 220th St. (SC804) 0.28 0.97 na 0.036
Main Channel at Denmark Ave. (VR807) 0.62 0.96 0.032 0.045*
South Creek 1.18 0.95 na 0.060*
Middle Creek 0.28* 0.59* 0.029 -0.026*
North Creek (NC808) 0.24* 0.34* 0.022 0.056
South Branch Vermillion River (SB802) 2.06 2.83 0.037 0.095*
Main Channel at Goodwin Ave. (VR803) 1.88 1.36 0.067 0.035
*indicates poor FLUX diagnostic results for calculated pollutant load
Nitrate yields for 2008 were highest for the South Branch Vermillion River sub-watershed (Table 1). The South Branch sub-
watershed nitrate yield, which is of similar size and similar land use as the sub-watershed monitored at 220th
Street (SC804), was
roughly three times larger than the yield at 220th
Street. Additional monitoring may be needed to aid in determining the source of
nitrates in the South Branch sub-watershed. Nitrate yield was somewhat elevated for the main channel at Goodwin Avenue, but this is
expected as the VR803 monitoring station is located just downstream from the City of Vermillion’s wastewater treatment facility.
Total phosphorus yields for 2008 were relatively consistent across the watershed and among the various tributaries. The total
phosphorus yield for the South Branch of the Vermillion River was the highest in the watershed. However, diagnostic tests indicate
that the FLUX load estimate for this site are not statistically sound, and these value should be treated with some suspicion.

Turbidity
Turbidity results for 2008 varied
throughout the watershed (Figure
10). Turbidity during base flow
conditions remained well below
the state standards for all sites.
However, during larger
precipitation events, turbidity was
substantially elevated, often
exceeding state standards. Also,
it should be mentioned that 2008
turbidity analysis, for all samples,
was conducted by the
Metropolitan Council
Environmental Services
laboratory which records turbidity
in nephelometric turbidity ratio
units, which are not in the same
units as state water quality
standards (nephelometric
turbidity units). This problem is
not exclusive to the Metropolitan
Council Environmental Services
laboratory and will likely be
addressed by state agencies in the
near future.
Turbidity results are somewhat
variable over the period of record
(Figure 11). Results from 2008
are within the range of previous
years.
0
5
10
15
20
25
30
V24 VR809 SC804 VR807 NC808 MC801 SB802 VR803 VR WOMP
Tu
rbid
ity
(N
TR
U)
Monitoring Station
Base Flow Mean
Event Flow Mean
Overall Mean
Cold Water Standard
Warm Water Standard
Figure 10. 2008 Mean Turbidity Results
Figure 11. Historical Mean Turbidity Results (Cold water turbidity standards
apply only to stations on the trout stream portion of the Vermillion River-SC804,
VR807, NC808, MC801, SB802)
0
5
10
15
20
25
30
35
40
45
2001 2002 2003 2004 2005 2006 2007 2008*
Tu
rbid
ity
(N
TU
)
Monitoring Station
VR24 Mean
VR809 Mean
SC804 Mean
VR807 Mean
NC808 Mean
MC801 Mean
SB802 Mean
VR803 Mean
Warm Water State Standard
Cold Water State Standard
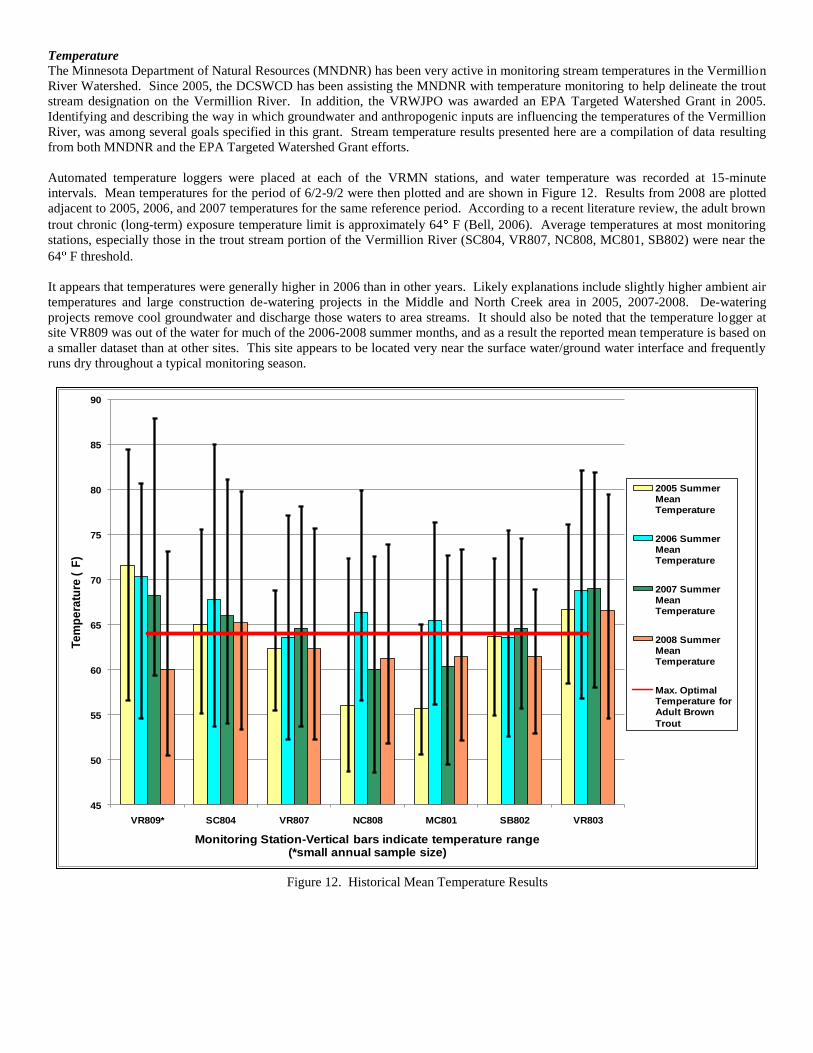
Temperature
The Minnesota Department of Natural Resources (MNDNR) has been very active in monitoring stream temperatures in the Vermillion
River Watershed. Since 2005, the DCSWCD has been assisting the MNDNR with temperature monitoring to help delineate the trout
stream designation on the Vermillion River. In addition, the VRWJPO was awarded an EPA Targeted Watershed Grant in 2005.
Identifying and describing the way in which groundwater and anthropogenic inputs are influencing the temperatures of the Vermillion
River, was among several goals specified in this grant. Stream temperature results presented here are a compilation of data resulting
from both MNDNR and the EPA Targeted Watershed Grant efforts.
Automated temperature loggers were placed at each of the VRMN stations, and water temperature was recorded at 15-minute
intervals. Mean temperatures for the period of 6/2-9/2 were then plotted and are shown in Figure 12. Results from 2008 are plotted
adjacent to 2005, 2006, and 2007 temperatures for the same reference period. According to a recent literature review, the adult brown
trout chronic (long-term) exposure temperature limit is approximately 64 F (Bell, 2006). Average temperatures at most monitoring
stations, especially those in the trout stream portion of the Vermillion River (SC804, VR807, NC808, MC801, SB802) were near the
64 F threshold.
It appears that temperatures were generally higher in 2006 than in other years. Likely explanations include slightly higher ambient air
temperatures and large construction de-watering projects in the Middle and North Creek area in 2005, 2007-2008. De-watering
projects remove cool groundwater and discharge those waters to area streams. It should also be noted that the temperature logger at
site VR809 was out of the water for much of the 2006-2008 summer months, and as a result the reported mean temperature is based on
a smaller dataset than at other sites. This site appears to be located very near the surface water/ground water interface and frequently
runs dry throughout a typical monitoring season.
45
50
55
60
65
70
75
80
85
90
VR809* SC804 VR807 NC808 MC801 SB802 VR803
Te
mp
era
ture
(F
)
Monitoring Station-Vertical bars indicate temperature range (*small annual sample size)
2005 Summer Mean Temperature
2006 Summer Mean Temperature
2007 Summer Mean Temperature
2008 Summer Mean Temperature
Max. Optimal Temperature for Adult Brown
Trout
Figure 12. Historical Mean Temperature Results
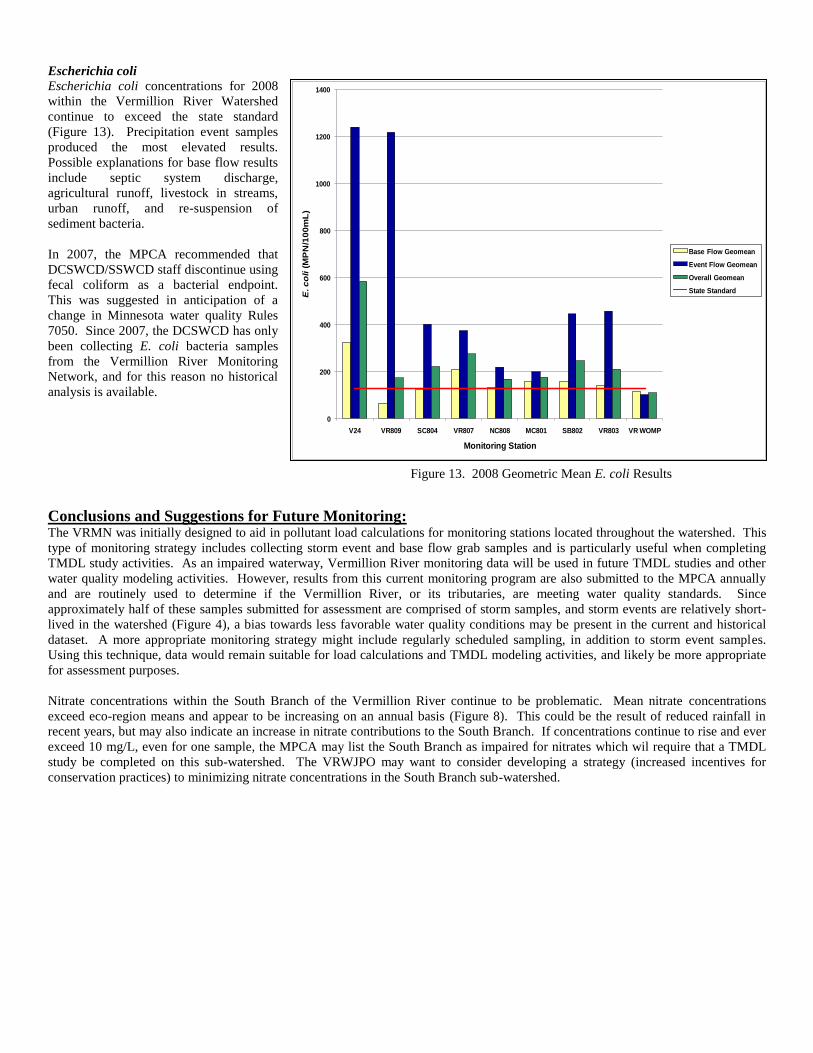
Escherichia coli
Escherichia coli concentrations for 2008
within the Vermillion River Watershed
continue to exceed the state standard
(Figure 13). Precipitation event samples
produced the most elevated results.
Possible explanations for base flow results
include septic system discharge,
agricultural runoff, livestock in streams,
urban runoff, and re-suspension of
sediment bacteria.
In 2007, the MPCA recommended that
DCSWCD/SSWCD staff discontinue using
fecal coliform as a bacterial endpoint.
This was suggested in anticipation of a
change in Minnesota water quality Rules
7050. Since 2007, the DCSWCD has only
been collecting E. coli bacteria samples
from the Vermillion River Monitoring
Network, and for this reason no historical
analysis is available.
Conclusions and Suggestions for Future Monitoring: The VRMN was initially designed to aid in pollutant load calculations for monitoring stations located throughout the watershed. This
type of monitoring strategy includes collecting storm event and base flow grab samples and is particularly useful when completing
TMDL study activities. As an impaired waterway, Vermillion River monitoring data will be used in future TMDL studies and other
water quality modeling activities. However, results from this current monitoring program are also submitted to the MPCA annually
and are routinely used to determine if the Vermillion River, or its tributaries, are meeting water quality standards. Since
approximately half of these samples submitted for assessment are comprised of storm samples, and storm events are relatively short-
lived in the watershed (Figure 4), a bias towards less favorable water quality conditions may be present in the current and historical
dataset. A more appropriate monitoring strategy might include regularly scheduled sampling, in addition to storm event samples.
Using this technique, data would remain suitable for load calculations and TMDL modeling activities, and likely be more appropriate
for assessment purposes.
Nitrate concentrations within the South Branch of the Vermillion River continue to be problematic. Mean nitrate concentrations
exceed eco-region means and appear to be increasing on an annual basis (Figure 8). This could be the result of reduced rainfall in
recent years, but may also indicate an increase in nitrate contributions to the South Branch. If concentrations continue to rise and ever
exceed 10 mg/L, even for one sample, the MPCA may list the South Branch as impaired for nitrates which wil require that a TMDL
study be completed on this sub-watershed. The VRWJPO may want to consider developing a strategy (increased incentives for
conservation practices) to minimizing nitrate concentrations in the South Branch sub-watershed.
0
200
400
600
800
1000
1200
1400
V24 VR809 SC804 VR807 NC808 MC801 SB802 VR803 VR WOMP
E. c
oli (
MP
N/1
00
mL
)
Monitoring Station
Base Flow Geomean
Event Flow Geomean
Overall Geomean
State Standard
Figure 13. 2008 Geometric Mean E. coli Results
References: Bell J.M., 2006. The Assessment of Thermal Impacts on Habitat Selection, Growth, Reproduction, and Mortality in Brown Trout
(Salm trutta L): A Review of the Literature. Prepared for the Vermillion River EPA Grant #WS 97512701-0 and the Vermillion River
Joint Powers Board. Applied Ecological Services, Inc.
McCollar S., and Steve Heiskary, 1993. Selected Water Quality Characteristics of Minimally Impacted Streams from Minnesota’s
Seven Ecoregions. Addendum to: Descriptive Characteristics of the Seven Ecoregions of Minnesota.
Metropolitan Council Environmental Services-Quality Assurance Program Plan: Stream Monitoring (2003). Metropolitan Council. 5
Feb. 2007 http://www.metrocouncil.org/Environment/RiversLakes/Streams/Stream%20Monitoring%20QAPP_Final.pdf
Minnesota Pollution Control Agency, 2006. Revised Regional Total Maximum Daily Load Evaluation of Fecal Coliform Bacteria
Impairments in the Lower Mississippi River Basin in Minnesota.
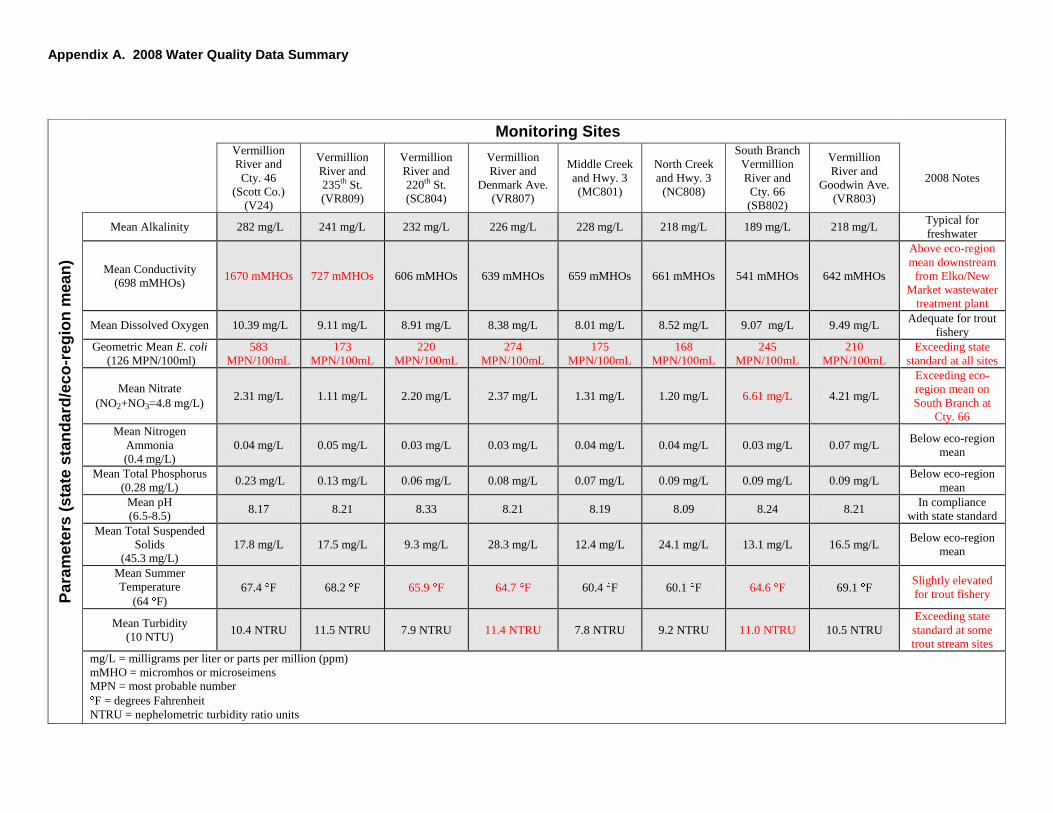
Appendix A. 2008 Water Quality Data Summary
Monitoring Sites
Vermillion
River and
Cty. 46
(Scott Co.)
(V24)
Vermillion
River and
235th St.
(VR809)
Vermillion
River and
220th St.
(SC804)
Vermillion
River and
Denmark Ave.
(VR807)
Middle Creek
and Hwy. 3
(MC801)
North Creek
and Hwy. 3
(NC808)
South Branch
Vermillion
River and
Cty. 66
(SB802)
Vermillion
River and
Goodwin Ave.
(VR803)
2008 Notes
Pa
ram
ete
rs (
sta
te s
tan
dard
/ec
o-r
eg
ion
mea
n)
Mean Alkalinity 282 mg/L 241 mg/L 232 mg/L 226 mg/L 228 mg/L 218 mg/L 189 mg/L 218 mg/L Typical for
freshwater
Mean Conductivity
(698 mMHOs) 1670 mMHOs 727 mMHOs 606 mMHOs 639 mMHOs 659 mMHOs 661 mMHOs 541 mMHOs 642 mMHOs
Above eco-region
mean downstream
from Elko/New
Market wastewater
treatment plant
Mean Dissolved Oxygen 10.39 mg/L 9.11 mg/L 8.91 mg/L 8.38 mg/L 8.01 mg/L 8.52 mg/L 9.07 mg/L 9.49 mg/L Adequate for trout
fishery
Geometric Mean E. coli
(126 MPN/100ml)
583
MPN/100mL
173
MPN/100mL
220
MPN/100mL
274
MPN/100mL
175
MPN/100mL
168
MPN/100mL
245
MPN/100mL
210
MPN/100mL
Exceeding state
standard at all sites
Mean Nitrate
(NO2+NO3=4.8 mg/L) 2.31 mg/L 1.11 mg/L 2.20 mg/L 2.37 mg/L 1.31 mg/L 1.20 mg/L 6.61 mg/L 4.21 mg/L
Exceeding eco-
region mean on
South Branch at
Cty. 66
Mean Nitrogen
Ammonia
(0.4 mg/L)
0.04 mg/L 0.05 mg/L 0.03 mg/L 0.03 mg/L 0.04 mg/L 0.04 mg/L 0.03 mg/L 0.07 mg/L Below eco-region
mean
Mean Total Phosphorus
(0.28 mg/L) 0.23 mg/L 0.13 mg/L 0.06 mg/L 0.08 mg/L 0.07 mg/L 0.09 mg/L 0.09 mg/L 0.09 mg/L
Below eco-region
mean
Mean pH
(6.5-8.5) 8.17 8.21 8.33 8.21 8.19 8.09 8.24 8.21
In compliance
with state standard
Mean Total Suspended
Solids
(45.3 mg/L)
17.8 mg/L 17.5 mg/L 9.3 mg/L 28.3 mg/L 12.4 mg/L 24.1 mg/L 13.1 mg/L 16.5 mg/L Below eco-region
mean
Mean Summer
Temperature
(64 F)
67.4 F 68.2 F 65.9 F 64.7 F 60.4 F 60.1 F 64.6 F 69.1 F Slightly elevated
for trout fishery
Mean Turbidity
(10 NTU) 10.4 NTRU 11.5 NTRU 7.9 NTRU 11.4 NTRU 7.8 NTRU 9.2 NTRU 11.0 NTRU 10.5 NTRU
Exceeding state
standard at some
trout stream sites
mg/L = milligrams per liter or parts per million (ppm)
mMHO = micromhos or microseimens
MPN = most probable number
F = degrees Fahrenheit
NTRU = nephelometric turbidity ratio units