Verifying the HALE measures of the Global Burden of ...
29
*First paper version included in ArXiv.org (26 October 2015) Verifying the HALE measures of the Global Burden of Disease Study: Quantitative Methods Proposed* Christos H Skiadas ManLab, Technical University of Crete, Chania, Crete, Greece Email: [email protected] Abstract To verify the Global Burden of Disease Study and the provided healthy life expectancy (HALE) estimates from the World Health Organization (WHO) we propose a very simple model based on the mortality μx of a population provided in a classical life table and a mortality diagram. We use the abridged life tables provided by WHO. Our estimates are compared with the HALE estimates for the World territories and the WHO countries. Even more we have developed the related simple program in Excel which provides immediately the Life Expectancy, the Loss of Healthy Life Years and the Healthy Life Expectancy estimate. We also apply the health state function theory to have more estimates and comparisons. The results suggest improved WHO estimates in recent years for the majority of the cases. Keywords: Health state function, Healthy life expectancy, Mortality Diagram, Loss of healthy years, LHLY, HALE, DALE, World Health Organization, WHO, Global burden of Disease, Health status. Introduction Starting from the late 80’s a Global Burden of Disease (GBD) study was applied in many countries reflecting the optimistic views of many researchers and policy makers worldwide to quantify the health state of a population or a group of persons. In the time course they succeeded in establishing an international network collecting and providing adequate information to calculate health measures under terms as Loss of Healthy Life Years (LHLY) or Healthy Life Expectancy (HALE). The latter tends to be a serious measure important for the policy makers and national and international health programs. So far the process followed was towards statistical measures including surveys and data collection using questionnaires and disability and epidemiological data as well. They faced many views referring to the definition of health and to the inability to count the various health states and of course the different cultural and societal aspects of the estimation of health by various persons worldwide. Further to any objections posed when trying to quantify health, the scientific community had simply to express with strong and reliable measures that millions of people for centuries and thousands of years expressed and continue to repeat every day: That their health is good, fair, bad or very bad. As for many decades the public opinion is seriously quantified by using well established statistical and poll techniques it is not surprising that a part of these achievements helped to improve, establish and disseminate the health state measures. However, a serious scientific part is missing or it is not very much explored that is to find the model underlying the health state measures. Observing the health state measures by country from 1990 until nowadays it is clear that the observed and estimated health parameters follow a rather
Transcript of Verifying the HALE measures of the Global Burden of ...

*First paper version included in ArXiv.org (26 October 2015)
Verifying the HALE measures of the Global Burden of Disease Study:
Quantitative Methods Proposed*
Christos H Skiadas
ManLab, Technical University of Crete, Chania, Crete, Greece
Email: [email protected]
Abstract
To verify the Global Burden of Disease Study and the provided healthy life expectancy (HALE) estimates
from the World Health Organization (WHO) we propose a very simple model based on the mortality μx
of a population provided in a classical life table and a mortality diagram. We use the abridged life tables
provided by WHO. Our estimates are compared with the HALE estimates for the World territories and
the WHO countries. Even more we have developed the related simple program in Excel which provides
immediately the Life Expectancy, the Loss of Healthy Life Years and the Healthy Life Expectancy
estimate. We also apply the health state function theory to have more estimates and comparisons. The
results suggest improved WHO estimates in recent years for the majority of the cases.
Keywords: Health state function, Healthy life expectancy, Mortality Diagram, Loss of healthy years,
LHLY, HALE, DALE, World Health Organization, WHO, Global burden of Disease, Health status.
Introduction
Starting from the late 80’s a Global Burden of Disease (GBD) study was applied in many countries
reflecting the optimistic views of many researchers and policy makers worldwide to quantify the health
state of a population or a group of persons. In the time course they succeeded in establishing an
international network collecting and providing adequate information to calculate health measures under
terms as Loss of Healthy Life Years (LHLY) or Healthy Life Expectancy (HALE). The latter tends to be a
serious measure important for the policy makers and national and international health programs. So far
the process followed was towards statistical measures including surveys and data collection using
questionnaires and disability and epidemiological data as well. They faced many views referring to the
definition of health and to the inability to count the various health states and of course the different
cultural and societal aspects of the estimation of health by various persons worldwide. Further to any
objections posed when trying to quantify health, the scientific community had simply to express with
strong and reliable measures that millions of people for centuries and thousands of years expressed and
continue to repeat every day: That their health is good, fair, bad or very bad. As for many decades the
public opinion is seriously quantified by using well established statistical and poll techniques it is not
surprising that a part of these achievements helped to improve, establish and disseminate the health
state measures. However, a serious scientific part is missing or it is not very much explored that is to
find the model underlying the health state measures. Observing the health state measures by country
from 1990 until nowadays it is clear that the observed and estimated health parameters follow a rather

systematic way. If so why not to find the process underlying these measures? It will support the
provided health measures with enough documentation while new horizons will open towards better
estimates and data validation.
From the early 90’s we have introduced and applied methods, models and techniques to estimate the
health state of a population. The related results appear in several publications and we have already
observed that our estimates are related or closely related to the provided by the World Health
Organization (WHO) and other agencies as Eurostat or experts as the REVES group. However, our
method based on a difficult stochastic analysis technique, is not easy to use especially by practitioners.
The last four centuries demography and demographers are based on the classical Life Tables. Thus here
we propose a very simple model based on the mortality μx of a population provided in a classical life
table. To compare our results with those provided by WHO we use the μx included in the WHO abridged
life tables. Our estimates are compared with the HALE estimates for all the WHO countries. Even more
we provide the related simple program in Excel which provides immediately the Life Expectancy, the
Loss of Healthy Life Years and the Healthy Life Expectancy estimate. The comparisons suggest an
improved WHO estimate for the majority of the countries. There are countries’ results differing from the
model and need further study.
More Details
The Global Burden of Disease Study explored the health status of the population of all the countries
members of the World Health Organization (WHO). It is a large team work started more than 25 years
ago (see Murray and Lopez, 1997,2000, Mathers et al., 2000, Salomon, et al., 2010, 2012, Murray et al.,
2015, Hausman, 2012, Vos et al., 2012, WHO, 2000, 2001, 2002, 2004, 2013, 2014 and many other
publications). The last years, with the financial support of the Bill and Melinda Gates foundation, the
work was expanded via a large international group of researchers. The accuracy of the data collection
methods was improved along with the data development and application techniques. So far the health
status indicators were developed and gradually were established under terms as healthy life expectancy
and loss of healthy life years. Methods and techniques developed during the seventies and eighties as
the Sullivan method (Sullivan, 1971) were used quite successfully. Several publications are done with the
most important included in The Lancet under the terms DALE and HALE whereas a considerable number
can be found in the WHO and World Bank publications. The same half part of a century several works
appear in the European Union exploring the same phenomenon and providing more insight to the
estimation of the health state of a population and providing tools for the estimation of severe,
moderate and light disability. The use of these estimates from the health systems and the governments
is obvious.
To a surprise the development of the theoretical tools was not so large. The main direction was towards
to surveys and collection of mass health state data instead of developing and using theoretical tools. The
lessons learned during the last centuries were towards the introduction of models in the analysis of
health and mortality. The classical examples are Edmund Halley for Life Tables and Benjamin Gompertz
for the law of mortality and may others. Today our ability to use mass storage tools as the computers
and the extensive application of surveys and polls to many political, social and economic activities

directed the main health state studies. In other words we give much attention to opinions of the people
for their health status followed by extensive health data collection. However, it remains a serious
question: can we validate the health status results? As it is the standard procedure in science a
systematic study as the Global Burden of Disease should be validated by one or more models. Especially
as these studies are today the main tool for the health programs of many countries the need of
verification is more important.
People reply according to their experience. Two main approaches arise: The mortality focus approach
and the health status approach. Although both look similar responds may have significant differences.
The main reason is that health is a rather optimistic word opposed to the pessimistic mortality term.
Twenty years ago we provided a model to express the health state of a population. We developed and
expanded this model leading to a system providing health status indexes. Here we propose a simple but
yet powerful model to estimate the health indexes provided by WHO.
The mortality approach: A simple method
In this case the μx diagram provides a simple but quite useful estimate for the loss of healthy life years
of a population. Mx is provided by the related estimates of the bureau of the census of a country, the
Eurostat, the World Health Organization, the Human Mortality Database and other institutions.
The way people assess disability has also to do with the information collected from the close
environment (relatives, friends, office staff) and the far environment mainly communicated by the mass
media, internet and other information sources.
The simplest way to have an estimate for this information is to ask people directly which of course has a
large degree of uncertainty and it is subject to errors and misunderstandings due to many factors
concerning human communication. An alternative is to count this information by a sort of summation as
is the sum of mortality in the time course. This can be done by estimating the total influence regarding
mortality in the opinions of a population as a sum of μx in an age interval leading to an integral in the
limit as:
∑
∫
Where Ex expresses the area OCABO in the mortality diagram presented in Figure 1.
The classical approach for μx is to assume a Gompertz like formula of the form (where a and b are
parameters):
Then the resulting value for Ex in the interval [0, T] is:

The Simplest Model
Although the Gompertz model is the classical approach in expressing mortality, its form is not
so convenient for expressing the health state estimates as are presented below. We need a
simpler model to express the health status. The best achievement should be to propose a
model in which the health measure should be presented by only one main parameter. We thus
propose a two parameter model with one crucial health parameter and with similar properties
of the Gompertz of the form:
Fig. 1. The mortality diagram
(
)
The parameter T represents the age at which μx=1 and b is a crucial health state parameter
expressing the curvature of μx. As the health state is improved b gets higher values. The main
task is to find the area Ex under the curve OCABO in the mortality diagram (see Figure 1) which
is a measure of the mortality effect. This is done by estimating the integral
∫ (
)
(
)
The resulting value for Ex in the interval [0, T] is given by the simple form:

It is clear that the total information for the mortality is the area provided under the curve μx
and the horizontal axis. The total area Etotal of the healthy and mortality part of the life span is
nothing else but the area included into the rectangle of length T and height 1 that is Etotal=T.
The health area is given by
Then a very simple relation arises for the fraction Ehealth/Emortality that is
This is the simplest indicator for the loss of health status of a population. As we have estimated
by another method it is more close to the severe disability causes indicator.
The relation Etotal/Emortality provides another interesting indicator of the form:
This indicator is more appropriate for the severe and moderate disability causes indicator (It is
compatible with our estimates using the health state approach). It provides larger values for the
disability measures as the Etotal is larger or the Emortality area is smaller by means that as we live
longer the disability period becomes larger.
This method suggests a simple but yet interesting tool for classification of various countries and
populations, for the loss of healthy life years. A correction multiplier λ should be added for
specific situations so that the estimator of the loss of healthy life years should be of the form:
However, for comparisons between countries it is sufficient to select λ=1. Evenmore the
selection of λ=1 is appropriate when we would like to develop a quantitative measure for the
LHLY without introducing the public opinion for the health status and the estimates for the
cause of diseases and other disability measures. From another point of view the influence of
the health status of the society to the public opinions related to health may cause differences in
the values for LHLY estimated with the HALE method thus a value for λ larger or smaller than
unity is needed. By means that we will have to measure not exactly the health status but the
public opinion related to the health status, the latter leading in a variety of health estimates in
connection to socioeconomic and political situation along with crucial health information from

the mass media. Both measures, the standard measure with λ=1 and the flexible one with λ
different from 1 could be useful for decision makes and health policy administrators and
governmental planners.
To our great surprise our model by selecting λ=1 provided results very close to those provided
by WHO as it is presented in the following Tables and in other applications. It is clear that we
have found an interesting estimator for the loss of healthy life years.
Our idea to find the loss of healthy life years as a fraction of surfaces in a mortality diagram was
proven to be quite important for expressing the health state measures. A more detailed
method based on the health state stochastic theory is presented in the book on The Health
State Function of a Population and related publications (see Skiadas and Skiadas 2010, 2012,
2015) where more health estimators are found.
Stability of the coefficients
The simple model proposed is applied to data by using a non-linear regression analysis
technique by using a Levenberg-Marquardt algorithm. The data are obtained from the WHO
database providing abridged life tables of the 0-100 years form. The important part of the
model is the parameter b expressing the loss of healthy life years. Evenmore b can express the
curvature of mortality function μx. Applying the model to data we need a measure for the
selection of the most appropriate value for b.
When b should be accepted:
The simpler is to find if b follows a systematic change versus age. We start by selecting all the n
data points (m0, m1,…, mn) for μx to find b and then we select n-1, n-2,…, n-m for a sufficient
number of m<n. As is presented in Figure 2 the parameter b follows a systematic change. The
example is for USA males and females the year 2000 and the data are from the full life tables of
the Human Mortality Database. As it is expected b is larger for females than for males. In both
cases a distinct maximum value in a specific year of age appears. Accordingly a specific
minimum appears for the other not so important parameter T (see Figure 3). It is clear that only
the specific maximum value for b should be selected. Evenmore the estimates for the maximum
b account for a local minimum for the first difference dx’ of dx provided from the life table.
Next Figure 4 illustrates this case for USA males the year 2000 along with a fit curve from our
model SK-6. The maximum b is at 94 years for males and females the same as for the minimum
of the first difference corresponding to the right inflection point of the death curve dx. Table I
includes the parameter estimates for b and T the year 2000 for USA males and females.

Fig. 2
Fig. 3
Fig. 4

TABLE I
Parameter estimates for the model (USA, 2000)
Age Females Males Age Females Males
Years b T b T Years b T b T 71 5.318 147.5 4.975 142.3 91 8.942 110.7 7.992 109.4
72 5.308 147.5 5.244 136.4 92 9.143 110.0 8.081 109.1
73 5.296 147.5 5.231 136.4 93 9.224 109.8 8.173 108.8
74 5.663 140.0 5.459 132.3 94 9.291 109.6 8.218 108.6
75 5.649 140.0 5.559 130.5 95 9.286 109.6 8.189 108.7
76 5.905 135.6 5.642 129.2 96 9.263 109.6 8.148 108.8
77 5.896 135.6 5.736 127.8 97 9.224 109.7 8.094 109.0
78 6.146 131.9 5.844 126.3 98 9.167 109.9 8.027 109.2
79 6.280 130.1 5.981 124.5 99 9.093 110.1 7.947 109.4
80 6.551 126.8 6.214 121.8 100 9.002 110.3 7.856 109.7
81 6.748 124.6 6.368 120.2 101 8.896 110.6 7.754 110.0
82 6.972 122.5 6.587 118.2 102 8.775 110.8 7.642 110.3
83 7.209 120.4 6.774 116.6 103 8.641 111.2 7.521 110.7
84 7.453 118.5 6.981 115.0 104 8.495 111.5 7.391 111.0
85 7.710 116.8 7.186 113.6 105 8.339 111.9 7.255 111.4
86 7.947 115.3 7.378 112.5 106 8.173 112.3 7.114 111.8
87 8.185 114.0 7.546 111.5 107 8.000 112.7 6.967 112.3
88 8.369 113.1 7.665 110.9 108 7.822 113.1 6.818 112.7
89 8.579 112.2 7.826 110.1 109 7.638 113.5 6.666 113.2
90 8.778 111.3 7.916 109.8 110 7.452 114.0 6.512 113.6
The Health State Model (HSM)
Considering the high importance of the proposed model and the related indicator for the verification of
the GBD results we proceed in the introduction of a second method based on the health state of the
population instead of the previous one which was based on mortality. This model was proposed earlier
(see Skiadas and Skiadas, 2010, 2012, 2013, 2014). These works were based on an earlier publication
modeling the health state of a population via a first exit time stochastic methodology. Here we develop
a special application adapted to WHO data provided as abridged life tables (0 to 100 with 5 year
periods). First we expand the abridged life table to full and then we estimate the health indicators and
finally the loss of healthy life year indicators.

Fig. 5. The impact of the mortality area to health state
By observing the above graph (Figure 5) we can immediately see that the area between the health state
curve and the horizontal axis (OMCO) represents the total health dynamics (THD) of the population. Of
particular importance is also the area of the health rectangle (OABC) which includes the health state
curve. This rectangle is divided in two rectangular parts the smaller (OAMN) indicating the first part of
the human life until reaching the point M at the highest level of health state (usually the maximum is
between 30 to 45 years) and the second part (NMBC) characterized by the gradual deterioration of the
human organism until the zero level of the health state. This zero point health age C is associated with
the maximum death rate. After this point the health state level appears as negative in the graph and
characterizes a part of the human life totally unstable with high mortality; this is also indicated by a
positively increasing form of the logarithm of the force of mortality ln(μx).
We call the second rectangle NMBC as the deterioration rectangle. Instead the first rectangle OAMN is
here called as the development rectangle. For both cases we can find the relative impact of the area
inside each rectangle but outside the health state area to the overall health state. In this study we
analyze the relative impact of the deterioration area MBCM indicated by dashed lines in the
deterioration rectangle. It should be noted that if no-deterioration mechanism was present or the
repairing mechanism was perfect the health state should continue following the straight line AMB
parallel to the X-axis at the level of the maximum health state. The smaller the deterioration area
related to the health state area, the higher the healthy life of the population. This comparison can be
done by estimating the related areas and making a simple division.
However, when trying to expand the human life further than the limits set by the deterioration
mechanisms the percentage of the non-healthy life years becomes higher. This means that we need to
divide the total rectangle area by that of the deterioration area to find an estimate for the “lost healthy
life years”. It is clear that if we don’t correct the deterioration mechanisms the loss of healthy years will
become higher as the expectation of life becomes larger. This is already observed in the estimates of the
World Health Organization (WHO) in the World Health Report for 2000 where the lost healthy years for
The Health State Function and the Relative Impact of
the Mortality Area (USA, males 2000)
O
ln(μ(t))
BA
CN
M
D
E
-15
-10
-5
0
5
10
15
20
25
0 20 40 60 80 100
Age t (Years)
H(t
)

females are higher than the corresponding values for males. The females show higher life expectancy
than males but also higher values for the lost healthy years. The proposed “loss of healthy life years”
indicator is given by:
MBCM
OABC
MBCM
THD
THD
OABCLHLY ideal
ideal
1
Where THDideal is ideal total health dynamics of the population and the parameter λ expresses years and
should be estimated according to the specific case. For comparing the related results in various
countries we can set λ=1. When OABC approaches the THDideal as is the case of several countries in
nowadays the loss of healthy life years indicator LHLY can be expressed by other forms.
Another point is the use of the (ECD) area in improving forecasts especially when using the 5-year life
tables as is the case of the data for all the WHO Countries. In this case the expanded loss of healthy life
years indicator LHLY will take the following two forms:
MBCM
ECDOMCOLHLY
2
MBCM
ECDOABCLHLY
3
It is clear that the last form will give higher values than the previous one. The following scheme applies:
LHLY1<LHLY2<LHLY3. It remains to explore the forecasting ability of the three forms of the “loss of
healthy life years” indicator by applying LHLY to life tables provided by WHO or by the Human Mortality
Database or by other sources.
As for the previous case here important is the loss of health state area MBCM whereas the total area
including the healthy and non-healthy part is included in OABC+ECD.
MBCM
ECDOABCLHLY
3
Details and applications are included in the book on “The Health State Function of a Population”, the
supplement of this book and other publications (see Skiadas and Skiadas 2010, 2012, 2013, 2016). It is
important that we can explore the health state of a population by using the mortality approach with the
Simple Model proposed herewith and the health state function approach as well. The latter method
provides many important health measures than the simple model.

TABLE II
Comparing WHO (HALE) Results
Sex/Region
Healthy Life Expectancy at Birth Life Expectancy at Birth
(LE)
2000 2012 2000 2012
WHO (HALE)
Mortality Model
HSM Model
WHO (HALE)
Mortality Model
HSM Model
WHO
Mortality Model
WHO Mortality Model
Both sexes combined
World 58.0 58.4 58.2 61.7 62.5 61.9 66.2 66.2 70.3 70.3
High income countries 67.3 67.1 67.0 69.8 69.6 69.2 76.0 76.0 78.9 78.9
African Region 43.1 42.8 42.8 49.6 49.9 49.6 50.2 50.2 57.7 57.7
Region of the Americas 64.9 65.7 65.4 67.1 67.7 67.2 73.9 73.9 76.4 76.3
Eastern Mediterranean Region
55.4 56.9 56.6 58.3 59.7 59.4 64.9 64.9 67.8 67.8
European Region 63.9 63.9 63.9 66.9 67.2 67.0 72.4 72.4 76.1 76.0
South East Asian Region 54.2 56.3 55.6 58.5 60.6 60.0 62.9 63.0 67.5 67.5
Western Pacific Region 64.8 63.9 64.2 68.1 67.3 67.5 72.3 72.3 75.9 75.9
Males
World 56.4 56.6 56.2 60.1 60.4 60.0 63.9 63.9 68.1 68.0
High income countries 64.7 64.1 64.2 67.5 67.0 67.0 72.4 72.3 75.8 75.7
African Region 42.4 41.6 42.3 48.8 48.6 48.6 49.0 49.0 56.3 56.3
Region of the Americas 62.7 63.1 62.5 64.9 65.1 64.6 70.8 70.8 73.5 73.5
Eastern Mediterranean Region
54.8 55.7 55.6 57.4 58.2 57.9 63.6 63.6 66.1 66.1
European Region 60.7 60.4 61.1 64.2 64.3 64.5 68.2 68.2 72.4 72.4
South East Asian Region 53.5 55.4 54.6 57.4 59.2 58.6 61.6 61.7 65.7 65.7
Western Pacific Region 63.0 61.8 62.0 66.6 65.2 65.7 70.0 70.0 73.9 73.9
Females
World 59.7 60.3 59.9 63.4 64.3 64.1 68.5 68.5 72.7 72.6
High income countries 70.0 69.7 69.6 72.0 71.8 72.1 79.6 79.5 82.0 81.9
African Region 43.8 43.8 43.5 50.4 51.2 50.5 51.4 51.4 59.0 59.1
Region of the Americas 67.2 68.0 67.8 69.1 69.9 69.8 77.0 76.9 79.3 79.2
Eastern Mediterranean Region
56.1 58.2 57.8 59.2 61.3 61.0 66.4 66.4 69.7 69.6
European Region 67.1 67.6 67.3 69.6 70.0 69.7 76.7 76.6 79.6 79.6
South East Asian Region 55.0 57.2 56.4 59.7 62.0 61.7 64.3 64.4 69.4 69.4
Western Pacific Region 66.7 65.7 66.1 69.8 68.9 69.1 74.8 74.8 78.1 78.0
First Application
The Table II includes our estimates for the healthy life expectancy at birth for the years 2000 and 2012
by applying the proposed mortality model and the health state model (HSM), and the estimates of WHO

referred as HALE and included in the WHO websites (August 2015). Our estimates for the mortality
model are based on LHLY=(b+1)=Etotal/Emortality.
The main finding is that our models verify the WHO (HALE) estimates based on the Global Burden of
Disease Study. Our results are quite close (with less to one year difference) to the estimates for the
World, the High Income Countries, the African region, the European region and Western Pacific and
differ by 1-2 years for the Eastern Mediterranean region and the South East Asian region. In the last two
cases the collection of data and the accuracy of the information sources may lead to high uncertainty of
the related health state estimates. This is demonstrated in the provided confidence intervals for the
estimates in countries of these regions in the studies by Salomon et al. (2012) and the Report of WHO
(2001) for the HLE of the member states (2000). From the Salomon et al. study we have calculated a
mean confidence interval of 5.5 years for males and 6.8 for females for the year 2000. We thus propose
to base the future works on the system we propose and to use it to calibrate the estimates especially for
the countries providing of low accuracy data.
To support future studies we have formulated an easy to use framework in Excel. The only needed is to
insert data for μx in the related column of the program. The program estimates the life expectancy, the
loss of healthy life years and the healthy life expectancy.
The program includes the Figure 1 providing the fit curve (solid line) to the provided data for μx (dotted
line) while the straight dashed line is the limit for μx representing a simple decay process. In the latter
case the parameter b=1.
Second Application
Another application is presented in Table III where the mortality model and the WHO (HALE) results
from 1990 to 2013 are compared for the WHO member countries.
TABLE III
Mean values of the Mortality Model for the Loss of Healthy Life Years (LHLY) and the related results from the HALE method for the WHO countries
Type HALE MODEL HALEb HALE MODEL HALE HALE HALE HALE MODEL HALE MODEL
Year 1990 1990 2000 2000 2000 2001 2002 2010 2012 2012 2013 2013
Males 8.7 7.7 8.4 8.2 7.8 9.7 7.2 9.3 8.8 8.2 8.9 8.3
Females 10.3 8.6 11.0 9.5 8.8 10.0 8.9 10.8 10.2 9.3 10.1 9.3

Fig.6
Figure 6 and Figure 7 illustrate the estimates of the arithmetic mean the loss of healthy life years (LHLY)
for various time periods with the proposed mortality model (circles) versus the HALE method (rhombus)
for the countries of WHO (males). The model estimates and the HALE differ by 1.0 years in 1990, 0.4
years in 2000, 0.6 years in 2012 and 0.6 years in 2013. Several options of the related figures for HALE are
included starting from the first estimates in 190 until the estimates of 2013. The estimates for 1990,
2000, 2012 and 2013 are provided in the last WHO websites and can be accepted as the official
estimates whereas the HALE estimates for 2001, 2002 and 2010 are also included. It should be noted
that significant differences appear in HALE estimates in the group of cases of 2000, 2001 and 2002 and
2010 and 2012 due to improvements in the methodology and the use of new epidemiological data. In
the Annex Table of the World Health Report 2001 and the related of 2002 write:
Healthy life expectancy estimates published here are not directly comparable to those published in the World Health Report 2000, due to improvements in survey methodology and the use of new epidemiological data for some diseases. See Statistical Annex notes (pp.130–135). The figures reported in this Table along with the data collection and estimation methods have been largely developed by WHO and do not necessarily reflect official statistics of Member States. Further development in collaboration with Member States is underway for improved data collection and estimation methods (WHO 2001). Healthy life expectancy estimates published here are not directly comparable to those published in The World Health Report 2001, because of improvements in survey methodology and the use of new epidemiological data for some diseases and revisions of life tables for 2000 for many Member States to take new data into account (see Statistical Annex explanatory notes). The figures reported in this Table along with the data collection and estimation methods have been largely developed by WHO and do not necessarily reflect official statistics of Member States. Further development in collaboration with Member States is under way for improved data collection and estimation methods (WHO 2002).
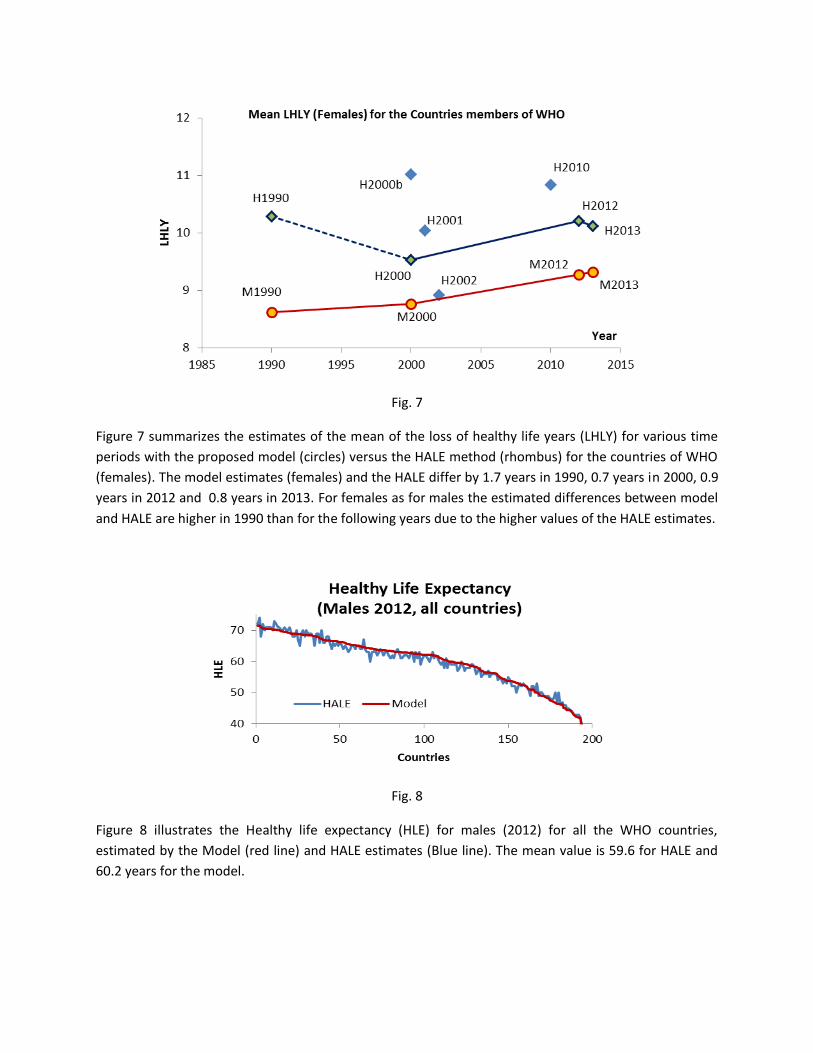
Fig. 7
Figure 7 summarizes the estimates of the mean of the loss of healthy life years (LHLY) for various time
periods with the proposed model (circles) versus the HALE method (rhombus) for the countries of WHO
(females). The model estimates (females) and the HALE differ by 1.7 years in 1990, 0.7 years in 2000, 0.9
years in 2012 and 0.8 years in 2013. For females as for males the estimated differences between model
and HALE are higher in 1990 than for the following years due to the higher values of the HALE estimates.
Fig. 8
Figure 8 illustrates the Healthy life expectancy (HLE) for males (2012) for all the WHO countries,
estimated by the Model (red line) and HALE estimates (Blue line). The mean value is 59.6 for HALE and
60.2 years for the model.
Fig. 9
Figure 9 illustrates the Healthy life expectancy (HLE) for females (2012) for all the WHO countries,
estimated by the Model (red line) and HALE estimates (Blue line). The mean value is 63.1 for HALE and
63.8 years for the model.
The full estimated figures are included in Table IV, Table V and Table VI in the end of the paper.
Discussion and Conclusions
The GBD study critisized by Williams (see Murray et al. 2000) whereas many comments from people
from social sciences and philosophy refer to the impossibility to define health and, as a consequence, to
measure it. The main problem is that we cannot have flexibility in finding an estimate of health the way
we do with other measures of the human organism and related activities. So far if we measure health by
collecting surveys it is clear that the uncertainty is relatively high. Even more if we decide for an
accepted health state estimate (see Sanders, 1964 and related studies during 60’s and 70’) it remains
the problem of accepting a unit of measure. The method we propose overcomes many of the objections
posed while is simple and easy to apply.
References
Hausman, D. M. Health, well-being, and measuring the burden of disease, Population Health Metrics 10:13, 2012. http://www.pophealthmetrics.com/content/10/1/13.
Janssen, J. and Skiadas, C. H. Dynamic modelling of life-table data, Applied Stochastic Models and Data Analysis, 11, 1, 35-49, 1995.
Mathers, et al. Estimates of DALE for 191 countries: methods and results, Global Programme on Evidence for Health Policy Working Paper No. 16, World Health Organization, June 2000.
McDowell, I. Measuring Health: A Guide to Rating Scales and Questionnaires, Third Edition, Oxford University Press, 2006.

Murray, C.J.L. and Alan D. Lopez, A.D. Global mortality, disability, and the contribution of risk factors: Global Burden of Disease Study, Lancet, May 17;349(9063):1436-42, 1997.
Murray, C. J. L. et al. Global, regional, and national disability-adjusted life years (DALYs) for 306 diseases and injuries and healthy life expectancy (HALE) for 188 countries, 1990–2013: quantifying the epidemiological transition, The Lancet, August 2015. DOI: http://dx.doi.org/10.1016/S0140-6736(15)61340-X.
Murray, C. J. L. and Lopez, A. D. Progress and Directions in Refining the Global Burden of Disease Approach: A Response to Williams, Health Economics 9: 69–82, 2000. http://down.cenet.org.cn/upfile/40/2006111211716102.pdf
Robine J. M., Isabelle Romieu I. and Cambois, E. Health expectancy indicators, Bulletin of the World Health Organization, 1999, 77 (2).
Salomon, J. A., Wang, H. et al. Healthy life expectancy for 187 countries, 1990-2010: a systematic analysis for the Global Burden Disease Study. Lancet, 380, 2144–2162, 2012. DOI: http://dx.doi.org/10.1016/S0140-6736(12)61690-0 Sanders, B. S. Measuring Community Health Levels. American Journal of Public Health, 54, 1063-1070, 1964.
Skiadas, C. and Skiadas, C. H. Development, Simulation and Application of First Exit Time Densities to Life Table Data, Communications in Statistics - Theory and Methods, 39, 3, 444-451, 2010.
Skiadas, C. H. and Skiadas, C. Estimating the Healthy Life Expectancy from the Health State Function of a Population in Connection to the Life Expectancy at Birth. In: Skiadas, C. H. and Skiadas, C., The Health State function of a population.1st ed. Athens: ISAST, 2012, 2nd ed. 2013. http://www.amazon.com/The-Health-State-Function-Population/dp/6188046505
Skiadas, C. H. The Health State Function, the Force of Mortality and other characteristics resulting from the First Exit Time Theory applied to Life Table Data. In: Skiadas, C. H. and Skiadas, C., The Health State function of a population.1st ed. Athens: ISAST, 69-92, 2012b, 2nd ed. 2013. http://www.amazon.com/The-Health-State-Function-Population/dp/6188046505.
Skiadas, C. H. and Skiadas, C. The Health State Function of a Population, 1st ed. Athens: ISAST, 2012b, 2nd ed. 2013. http://www.amazon.com/The-Health-State-Function-Population/dp/6188046505 .
Skiadas, C. H. and Skiadas, C. Supplement The Health State Function of a Population, Athens, ISAST, 2013. http://www.amazon.com/Supplement-Health-State-Function-Population/dp/6188069831 .
Skiadas, C. H. and Skiadas, C. The First Exit Time Theory applied to Life Table Data: the Health State Function of a Population and other Characteristics, Communications in Statistics-Theory and Methods, 34, 1585-1600, 2014.
Skiadas, C. H. and Skiadas, C. Exploring the State of a Stochastic System via Stochastic
Simulations: An Interesting Inversion Problem and the Health State Function, Methodology and
Computing in Applied Probability, 17, 973-982, 2015 (published online: June 2014).
Skiadas, C. H. Verifying the Global Burden of Disease Study: Quantitative Methods Proposed, ArXiv.org, October 2015. http://arxiv.org/abs/1510.07346
Salomon, et al. Healthy life expectancy for 187 countries, 1990–2010: a systematic analysis for the Global Burden Disease Study 2010, Lancet 380: 2144–62, 2012.
Sullivan, D. F. A single index of mortality and morbidity, HSMHA Health Reports, 86, 347-354, 1971.

Ting Lee, M-L and Whitmore, G. A. Threshold regression for survival analysis: modelling event times by a stochastic process reaching a boundary, Statistical Science, 21, 4, 501-513, 2006.
Vos, T. M., Flaxman, A. D. et al. Years lived with disability (YLDs) for 1160 sequelae of 289 diseases and injuries 1990–2010: a systematic analysis for the Global Burden of Disease Study 2010. Lancet, 380, 2163–2196, 2012. DOI: http://dx.doi.org/10.1016/S0140-6736(12)61729-2.
WHO. Department of Health Statistics and Information system. “WHO methods and data sources for the global burden of disease estimates 2000-2011”. Global Health Estimates Technical Paper WHO/HIS/HSI/GHE/2013.4. November, 2013. http://www.who.int/healthinfo/statistics/GlobalDALYmethods_2000_2011.pdf
WHO. “WHO methods for life expectancy and healthy life expectancy”. Global Health Estimates Technical Paper WHO/HIS/HSI/GHE/2014.5. March, 2014. http://www.who.int/healthinfo/statistics/LT_method.pdf
WHO, The World Health Report 2001, Statistical Annex, Annex Table 4 Healthy life expectancy (HALE) in all Member States, estimates for 2000. annex4_en_HALE_2000.pdf.
WHO. The World 132 Health Report 2004, Statistical Annex, Annex Table 4 Healthy life expectancy (HALE) in all WHO Member States, estimates for 2002. annex_4_en_2002.pdf.
WHO. The World Health Report 2002, Statistical Annex, Annex Table 4 Healthy life expectancy (HALE) in all Member States, estimates for 2000 and 2001. whr2002_annex4_2001.pdf.
WHO. WHO methods for life expectancy and healthy life expectancy, Global Health Estimates Technical Paper WHO/HIS/HSI/GHE/2014.5, March 2014.

TABLE IV
Country - 2012 - Females HALE MODEL Country - 2012 - Males HALE MODEL
Afghanistan 49 53.4 Afghanistan 49 51.0 Albania 66 65.1 Albania 64 63.9 Algeria 63 64.4 Algeria 62 61.9 Andorra 74 73.0 Andorra 70 68.6 Angola 45 44.5 Angola 43 42.2 Antigua and Barbuda 66 67.4 Antigua and Barbuda 63 64.0 Argentina 69 69.9 Argentina 64 65.2 Armenia 66 66.2 Armenia 60 59.9 Australia 74 72.8 Australia 71 70.4 Austria 73 71.5 Austria 69 68.3 Azerbaijan 65 66.4 Azerbaijan 61 62.2 Bahamas 67 67.1 Bahamas 62 62.9 Bahrain 66 68.5 Bahrain 66 66.9 Bangladesh 61 63.7 Bangladesh 60 62.5 Barbados 69 70.5 Barbados 64 66.2
Belarus 68 68.6 Belarus 59 59.9 Belgium 73 71.4 Belgium 69 67.9 Belize 66 68.1 Belize 61 62.2 Benin 51 51.4 Benin 50 49.1 Bhutan 59 62.1 Bhutan 58 60.3 Bolivia (Plurinational State of) 61 61.2 Bolivia (Plurinational State of) 58 57.5 Bosnia and Herzegovina 70 70.2 Bosnia and Herzegovina 66 66.7 Botswana 53 55.3 Botswana 52 53.4 Brazil 67 69.2 Brazil 62 63.3 Brunei Darussalam 69 69.0 Brunei Darussalam 68 66.8 Bulgaria 68 67.7 Bulgaria 63 63.0
Burkina Faso 51 50.5 Burkina Faso 50 49.0 Burundi 49 49.7 Burundi 46 46.4 Cabo Verde 66 68.2 Cabo Verde 61 62.4 Cambodia 63 66.5 Cambodia 59 62.3 Cameroon 49 49.1 Cameroon 48 47.3 Canada 73 73.0 Canada 71 70.0 Central African Republic 44 43.7 Central African Republic 43 42.1 Chad 44 44.4 Chad 43 42.9 Chile 72 73.2 Chile 68 68.9 China 69 66.7 China 67 64.6
Colombia 70 72.0 Colombia 66 66.6 Comoros 54 55.2 Comoros 53 52.7 Congo 51 51.5 Congo 49 49.0 Cook Islands 66 67.9 Cook Islands 63 65.6 Costa Rica 71 71.9 Costa Rica 68 68.9 Côte d'Ivoire 46 45.9 Côte d'Ivoire 45 44.4 Croatia 70 71.0 Croatia 65 66.5 Cuba 69 71.9 Cuba 65 68.7 Cyprus 76 71.1 Cyprus 73 70.2 Czech Republic 71 70.4 Czech Republic 66 66.2
Democratic People's Republic of Korea 65 63.4 Democratic People's Republic of Korea 59 58.4
Democratic Republic of the Congo 45 45.6 Democratic Republic of the Congo 43 42.4 Denmark 72 72.2 Denmark 69 68.9 Djibouti 53 54.3 Djibouti 52 51.8 Dominica 65 68.0 Dominica 61 63.2 Dominican Republic 67 69.2 Dominican Republic 65 68.1 Ecuador 68 67.7 Ecuador 64 63.1 Egypt 63 65.2 Egypt 60 61.2 El Salvador 66 69.3 El Salvador 59 61.0 Equatorial Guinea 48 48.7 Equatorial Guinea 47 46.2 Eritrea 55 58.1 Eritrea 53 54.4 Estonia 71 71.0 Estonia 63 63.5
Ethiopia 56 56.2 Ethiopia 54 53.7 Fiji 62 64.4 Fiji 58 59.6 Finland 73 71.6 Finland 69 67.7

France 74 72.5 France 69 68.3 Gabon 54 55.1 Gabon 53 53.8 Gambia 53 53.7 Gambia 52 50.9 Georgia 68 68.6 Georgia 62 62.8 Germany 73 71.5 Germany 70 68.5 Ghana 54 52.5 Ghana 53 50.1 Greece 73 71.1 Greece 69 68.7 Grenada 66 67.3 Grenada 60 62.1 Guatemala 65 65.9 Guatemala 60 59.5 Guinea 50 50.3 Guinea 49 48.6 Guinea-Bissau 47 47.4 Guinea-Bissau 46 45.1 Guyana 57 58.9 Guyana 52 52.5 Haiti 53 55.5 Haiti 50 53.1 Honduras 65 67.4 Honduras 62 63.6 Hungary 69 69.1 Hungary 63 64.2 Iceland 73 71.5 Iceland 72 70.2 India 58 60.8 India 56 58.2 Indonesia 64 63.7 Indonesia 61 60.4 Iran (Islamic Republic of) 65 66.1 Iran (Islamic Republic of) 63 63.7
Iraq 63 64.4 Iraq 58 58.4 Ireland 73 73.0 Ireland 70 69.7
Israel 73 72.5 Israel 71 70.3 Italy 74 73.0 Italy 71 70.3
Jamaica 66 66.9 Jamaica 62 62.2 Japan 77 75.0 Japan 72 70.5 Jordan 65 66.2 Jordan 64 63.6
Kazakhstan 64 63.0 Kazakhstan 56 56.5 Kenya 54 53.7 Kenya 52 51.0 Kiribati 60 60.3 Kiribati 56 56.4
Kuwait 67 68.5 Kuwait 68 68.5 Kyrgyzstan 63 64.6 Kyrgyzstan 58 58.7 Lao People's Democratic Republic 58 58.9 Lao People's Democratic Republic 56 56.5 Latvia 68 68.9 Latvia 61 62.0 Lebanon 71 71.7 Lebanon 68 68.3 Lesotho 44 44.5 Lesotho 42 42.0 Liberia 53 54.1 Liberia 52 52.2 Libya 65 67.7 Libya 64 64.5 Lithuania 70 69.6 Lithuania 61 61.8 Luxembourg 73 73.5 Luxembourg 70 70.5 Madagascar 56 58.0 Madagascar 54 55.5 Malawi 51 49.6 Malawi 50 46.8 Malaysia 66 67.1 Malaysia 63 64.3 Maldives 67 68.1 Maldives 66 67.0 Mali 48 48.1 Mali 49 48.4 Malta 72 71.4 Malta 70 69.3 Marshall Islands 61 63.2 Marshall Islands 57 59.6
Mauritania 54 55.5 Mauritania 52 52.9 Mauritius 68 68.3 Mauritius 62 62.2 Mexico 69 70.2 Mexico 65 65.1 Micronesia (Federated States of) 60 61.6 Micronesia (Federated States of) 59 59.7
Monaco 75 72.1 Monaco 70 67.2 Mongolia 63 63.3 Mongolia 56 56.2 Montenegro 67 68.6 Montenegro 65 65.3 Morocco 61 63.6 Morocco 60 60.7 Mozambique 46 45.9 Mozambique 45 44.4 Myanmar 58 59.3 Myanmar 56 56.1 Namibia 59 60.5 Namibia 55 56.4 Nauru 69 73.3 Nauru 64 66.6 Nepal 60 60.9 Nepal 58 59.0 Netherlands 72 72.2 Netherlands 70 70.3 New Zealand 73 71.4 New Zealand 71 69.1
Nicaragua 66 68.6 Nicaragua 61 63.0 Niger 50 50.4 Niger 50 50.2 Nigeria 47 46.3 Nigeria 46 44.9 Niue 66 68.3 Niue 62 63.4

Norway 72 72.2 Norway 70 69.4 Oman 67 71.2 Oman 65 66.4 Pakistan 57 57.9 Pakistan 56 56.4 Palau 64 65.8 Palau 61 62.7 Panama 69 71.1 Panama 65 66.0 Papua New Guinea 55 57.7 Papua New Guinea 52 53.6 Paraguay 67 68.0 Paraguay 63 63.1 Peru 68 69.4 Peru 66 66.5 Philippines 63 63.4 Philippines 57 57.9 Poland 71 71.1 Poland 64 65.5 Portugal 73 73.0 Portugal 69 68.4 Qatar 66 71.6 Qatar 68 71.1 Republic of Korea 75 72.8 Republic of Korea 70 68.8 Republic of Moldova 66 66.5 Republic of Moldova 59 59.9 Romania 69 68.8 Romania 63 62.6 Russian Federation 66 66.3 Russian Federation 57 56.4 Rwanda 56 57.6 Rwanda 55 55.1 Saint Kitts and Nevis 66 68.0 Saint Kitts and Nevis 61 62.9 Saint Lucia 66 70.8 Saint Lucia 60 64.2
Saint Vincent and the Grenadines 65 66.1 Saint Vincent and the Grenadines 61 63.4 Samoa 66 68.4 Samoa 62 62.9
San Marino 73 69.9 San Marino 72 71.5 Sao Tome and Principe 59 60.2 Sao Tome and Principe 56 56.8
Saudi Arabia 66 68.3 Saudi Arabia 64 64.8 Senegal 56 56.6 Senegal 54 54.3 Serbia 67 68.2 Serbia 63 64.3
Seychelles 71 68.8 Seychelles 63 62.0 Sierra Leone 39 38.2 Sierra Leone 39 38.1 Singapore 77 75.3 Singapore 74 71.4
Slovakia 70 69.8 Slovakia 64 64.9 Slovenia 73 72.3 Slovenia 67 68.7 Solomon Islands 60 61.6 Solomon Islands 58 59.2 Somalia 46 47.6 Somalia 44 43.8 South Africa 53 54.3 South Africa 49 49.6 South Sudan 48 48.2 South Sudan 47 46.4 Spain 75 73.3 Spain 71 70.0 Sri Lanka 68 68.6 Sri Lanka 63 63.5 Sudan 54 56.7 Sudan 52 53.6 Suriname 68 67.1 Suriname 63 63.6 Swaziland 47 47.8 Swaziland 44 44.3 Sweden 73 71.7 Sweden 71 69.5 Switzerland 74 72.8 Switzerland 71 70.3 Syrian Arab Republic 65 66.1 Syrian Arab Republic 55 53.7 Tajikistan 60 61.7 Tajikistan 59 59.6 Thailand 68 69.0 Thailand 63 62.5 The former Yugoslav Republic of Macedonia
68 67.9 The former Yugoslav Republic of Macedonia
65 65.3
Timor-Leste 58 59.7 Timor-Leste 55 57.0 Togo 50 48.1 Togo 50 46.4 Tonga 61 61.3 Tonga 64 65.7
Trinidad and Tobago 64 66.3 Trinidad and Tobago 58 60.4 Tunisia 67 68.4 Tunisia 65 65.1 Turkey 67 67.8 Turkey 63 62.4 Turkmenistan 59 59.8 Turkmenistan 53 52.4 Tuvalu 60 62.4 Tuvalu 57 59.3 Uganda 50 50.4 Uganda 49 48.2 Ukraine 67 66.6 Ukraine 59 58.6 United Arab Emirates 66 69.4 United Arab Emirates 66 67.4 United Kingdom 72 72.5 United Kingdom 70 69.6 United Republic of Tanzania 53 54.3 United Republic of Tanzania 51 51.1 United States of America 71 70.7 United States of America 68 66.8 Uruguay 70 71.4 Uruguay 65 66.2 Uzbekistan 62 64.0 Uzbekistan 59 59.4 Vanuatu 63 65.0 Vanuatu 61 62.1 Venezuela (Bolivarian Republic of) 69 70.6 Venezuela (Bolivarian Republic of) 63 62.7

Viet Nam 69 71.5 Viet Nam 62 63.8 Yemen 55 57.4 Yemen 54 54.7 Zambia 50 49.0 Zambia 48 47.5 Zimbabwe 51 51.3 Zimbabwe 48 47.2

TABLE V
Estimates of the Mortality Model for the Loss of Healthy Life Years (LHLY) for males for the WHO member countries and the related results from the HALE method of the World Health Organization
HALE Model HALE HALE Model HALE Model HALE Model
Countries / Year 1990 1990 2000b 2000 2000 2001 2002 2010 2012 2012 2013 2013
Afghanistan 8.9 6.9 9.1 9 7.2 10.0 6.6 9.7 9 7.5 11 7.5
Albania 9.3 8.6 7.9 8 8.6 10.4 7.8 9.5 9 8.6 9 8.6
Algeria 9.8 8.3 9.7 9 8.3 11.9 7.9 10.5 8 8.3 8 8.3
Andorra 10.6 8.8 7.3 9 8.7 7.4 7.0 11.5 10 10.6 9 10.6
Angola 6.4 7.2 8.1 6 7.4 8.4 6.3 8.2 7 7.7 7 7.7
Antigua and Barbuda 9.7 7.6 10.1 9 8.5 11.8 8.9 12.9 10 9.3 10 9.2
Argentina 8.5 7.1 8.4 9 7 9.5 8.3 9.0 9 7.5 9 7.5
Armenia 8.7 6.6 7.5 8 7.4 10.8 7.6 9.0 8 7.2 8 7.3
Australia 9.7 8.1 6.9 9 9.3 7.3 7.0 10.8 10 10.0 9 9.9
Austria 9.1 8.4 6.8 9 9.1 7.0 7.1 10.7 10 9.9 11 10.0
Azerbaijan 8.1 6.9 8.4 8 6.9 10.4 7.2 9.0 8 7.3 9 7.2
Bahamas 10.8 8.6 10.8 8 9.5 14.1 8.4 12.1 10 9.4 11 9.4
Bahrain 9.4 7.9 9.7 10 8 9.9 7.9 10.1 10 9.3 10 9.3
Bangladesh 9.4 7.4 9.8 10 7.2 10.2 7.3 12.4 9 6.9 10 6.9
Barbados 8.1 8.7 9.3 9 8.7 9.5 7.6 7.7 11 8.8 11 8.8
Belarus 9.2 6.9 6.6 8 6.5 9.0 6.1 10.2 9 6.7 9 6.6
Belgium 9.9 7.9 6.9 9 8.8 7.1 6.3 11.6 10 9.8 9 9.8
Belize 8.2 8.7 11.1 10 8.3 11.4 9.0 8.5 11 9.5 11 9.5
Benin 8.6 8.0 8.5 8 8 10.9 6.6 9.4 7 8.3 7 8.3
Bhutan 8.7 6.5 10.3 8 6.8 10.5 7.3 9.6 9 7.3 9 7.3
Bolivia 9.1 7.9 9.5 8 8.1 13.1 8.2 9.7 8 7.9 8 8.0
Bosnia and Herzegovina 9.3 7.1 6.6 9 6.2 9.3 7.0 11.0 10 7.8 9 7.8
Botswana 8.8 9.7 6.5 6 6.7 6.4 4.2 9.4 9 7.7 10 8.0
Brazil 9.1 6.6 9.5 8 6.2 13.3 8.5 9.3 8 6.9 9 6.3
Brunei Darussalam 8.1 8.6 9.6 7 8.4 12.8 9.7 8.6 8 8.8 8 8.9
Bulgaria 7.6 7.5 6.3 8 7.8 7.5 6.2 7.4 9 7.7 9 7.6
Burkina Faso 7.3 7.9 7.2 7 8.1 8.3 5.6 7.5 7 8.2 8 8.2
Burundi 6.6 7.3 6.7 6 7.2 6.8 5.3 7.5 8 7.5 7 7.6
Cambodia 8.5 6.2 7.8 9 6.4 10.3 6.3 8.7 10 7.1 10 7.1
Cameroon 8.4 8.0 8.1 7 7.8 10.1 6.0 8.1 11 8.0 10 8.0
Canada 9.3 7.9 7.7 9 8.8 8.4 7.1 10.2 7 9.5 8 9.6
Cape Verde 9.2 7.7 9.6 9 7.9 13.6 7.9 10.1 10 8.3 9 8.4
Central African Republic 6.6 7.5 6.9 6 7.4 9.7 5.1 5.9 7 7.8 7 7.8
Chad 7.9 7.2 8.7 6 7.3 11.1 6.4 8.2 7 7.5 7 7.5
Chile 8.7 7.2 9 9 7.2 8.7 8.5 9.3 9 7.8 9 7.9
China 7.2 8.0 8 8 8.8 7.7 6.5 7.4 7 9.3 7 9.2
Colombia 8.9 8.4 8.6 9 7.1 11.4 9.7 9.3 11 7.8 10 9.8
Comoros 7.4 7.2 9.1 7 7.3 12.8 7.8 8.2 7 7.5 7 7.5
Congo 7.6 7.9 7.7 7 7.9 10.9 6.3 7.9 8 8.2 8 8.2
Cook Islands 7.8 8.3 10 9.3 11.6 8.6 10 7.7 11 7.7
Costa Rica 9.9 7.1 9.2 10 7.4 11.1 9.5 9.8 9 8.0 9 8.1
Côte d'Ivoire 7.9 7.7 7.2 6 7.5 8.7 5.4 7.4 7 7.9 7 7.9
Croatia 8.8 7.0 9 9 7.3 9.2 7.2 9.8 9 7.5 10 7.5
Cuba 9.5 8.6 8.6 10 7.7 10.0 7.9 12.6 11 7.6 12 8.1
Cyprus 9.9 8.9 8.4 7 10.5 9.4 8.8 10.5 8 9.4 7 9.4
Czech Republic 8.1 7.3 8.6 9 8 8.1 6.6 9.5 9 8.7 9 8.7

Democratic People's Republic of Korea 7.7 7.7 9.6 5 7.1 10.5 6.4 7.7 7 7.5 6 7.5
Democratic Republic of the Congo 8.1 7.7 7.2 7 7.7 9.8 6.0 8.1 7 7.8 8 7.8
Denmark 9.1 7.5 5.3 9 7.9 5.5 6.3 10.5 10 8.7 9 8.7
Djibouti 8.3 7.8 7.8 7 7.8 10.0 6.1 9.3 8 8.0 8 8.1
Dominica 9.4 8.3 9.4 10 8.7 12.2 9.1 11.8 11 8.8 11 8.8
Dominican Republic 9.1 8.8 10.8 9 6.7 11.1 7.7 11.2 12 7.2 11 6.4
Ecuador 9.5 6.7 9.9 9 6.7 11.1 8.1 10.0 9 9.7 9 9.7
Egypt 10.1 7.7 8.3 9 7.6 8.9 7.4 10.5 9 7.6 8 7.6
El Salvador 9.0 6.9 11 8 6 12.7 9.3 9.4 9 6.6 8 6.7
Equatorial Guinea 6.6 7.6 8.7 7 7.6 10.6 7.2 8.0 8 7.8 8 7.9
Eritrea 7.6 5.6 7.7 5 5.3 9.9 6.5 8.7 9 6.4 8 6.4
Estonia 7.6 7.1 9.3 8 6.7 7.7 6.0 8.9 9 7.8 9 7.3
Ethiopia 6.0 7.6 7.1 7 8 10.0 6.1 8.1 8 8.6 9 8.7
Fiji 8.8 7.6 8.3 9 7 11.0 7.7 8.5 9 7.0 9 7.0
Finland 10.0 7.6 7.6 8 8.5 6.8 6.1 11.8 10 9.9 10 9.8
France 9.4 8.6 6.7 8 9.2 6.6 6.7 10.5 10 10.2 10 10.2
Gabon 8.0 8.3 7.8 9 8.2 9.8 7.1 7.6 9 8.6 9 8.5
Gambia 8.1 8.3 8.6 7 8.4 11.1 6.9 8.5 7 8.5 8 8.5
Georgia 8.0 7.4 9.6 8 7.5 7.9 6.2 8.1 8 7.6 9 7.6
Germany 9.1 8.0 6.9 8 8.9 6.8 5.9 10.4 9 9.8 10 9.8
Ghana 8.9 9.9 8.5 8 10.5 10.0 7.2 8.7 8 11.2 9 10.0
Greece 9.5 8.4 5.7 9 8.7 6.5 6.7 10.1 9 9.1 10 9.5
Grenada 9.3 7.3 8.8 9 7 9.7 7.5 11.2 9 7.3 10 7.3
Guatemala 8.6 6.8 10.1 8 8.5 12.2 8.2 8.8 9 8.7 8 8.7
Guinea 7.8 8.2 8.6 7 8.2 10.1 7.0 8.6 8 8.4 8 8.4
Guinea-Bissau 7.4 7.8 7.7 8 8 9.8 6.1 8.1 7 8.0 8 8.0
Guyana 8.5 6.0 10.1 8 6.6 9.7 8.4 10.6 8 7.5 8 7.5
Haiti 8.2 7.7 8.4 8 7.8 7.1 5.6 4.7 11 7.9 11 7.9
Honduras 9.2 8.0 10.6 10 8 12.3 7.9 9.5 10 8.2 10 8.2
Hungary 8.1 7.3 11 10 7.3 9.3 6.8 9.3 10 7.1 10 7.1
Iceland 11.5 8.5 7.3 9 9.3 7.6 6.3 13.1 9 11.0 10 10.3
India 8.0 5.9 7.6 9 6 8.4 6.8 8.3 8 6.2 9 6.2
Indonesia 8.4 7.5 6.9 8 7.8 8.3 7.5 8.4 8 8.1 8 8.1
Iran, Islamic Republic of 9.3 7.4 9.1 9 8.3 10.9 10.4 10.1 9 8.5 9 8.5
Iraq 9.6 8.1 9.2 8 8.2 11.0 10.3 9.8 8 7.7 8 7.7
Ireland 8.8 7.6 6.3 8 8.3 6.1 6.3 10.4 10 9.2 10 9.2
Israel 9.6 8.5 7.3 10 9.1 8.1 6.9 10.9 10 9.8 10 9.7
Italy 9.2 8.2 6.4 9 8.9 7.0 6.0 10.6 9 9.8 9 9.9
Jamaica 9.7 8.9 10 8 9 9.9 6.9 12.3 11 9.4 11 9.3
Japan 8.3 8.9 6.3 8 9 6.5 6.1 8.7 8 9.4 8 9.5
Jordan 9.8 8.1 10.3 8 8.3 11.4 9.0 10.9 8 8.5 8 8.6
Kazakhstan 7.5 6.0 7.5 7 6 9.8 6.1 7.4 7 6.7 7 6.6
Kenya 8.6 8.3 7 6 8 8.7 5.7 8.5 7 8.3 8 8.4
Kiribati 8.4 7.4 7.6 8 7.6 10.6 9.5 8.2 8 7.9 8 7.9
Kuwait 11.0 8.5 9.6 9 9.2 10.8 8.2 10.8 10 9.6 10 9.6
Kyrgyzstan 8.2 5.7 10.4 7 7.4 12.5 8.2 8.1 8 6.8 8 6.8
Lao People's Democratic Republic 7.3 7.1 8.6 8 7.5 11.1 7.0 8.3 8 7.9 9 7.9
Latvia 8.1 6.8 12.8 8 6.6 10.1 6.6 8.9 8 7.0 8 7.0
Lebanon 9.1 8.0 8.9 9 8.6 11.1 8.4 10.3 10 9.3 9 9.4
Lesotho 7.6 7.1 5.9 6 6.7 6.9 3.3 6.4 7 6.9 7 6.9
Liberia 7.4 7.5 8.4 8 7.7 9.3 6.5 8.9 9 8.3 9 8.3
Libyan Arab Jamahiriya 10.5 8.0 9.2 9 8.3 11.4 8.1 10.7 9 8.7 9 8.8
Lithuania 8.4 6.6 13.3 9 6.8 10.8 7.2 8.7 8 6.6 9 6.7
Luxembourg 9.0 7.7 6.3 9 8.3 6.4 6.4 11.1 10 9.1 10 9.2
Madagascar 7.9 7.1 8.5 8 6.8 11.1 7.2 9.2 8 7.0 9 7.0

Malawi 7.2 9.3 5.8 6 9.5 6.7 4.8 7.2 9 10.8 8 11.1
Malaysia 8.9 7.1 8.6 8 7.2 11.7 8.0 8.7 9 7.2 9 7.2
Maldives 9.2 8.3 10.4 8 6.7 14.3 7.5 10.2 10 8.7 10 8.8
Mali 6.8 8.0 7.9 7 8 10.5 6.4 8.1 8 8.5 7 8.5
Malta 9.7 8.2 6.7 9 8.5 8.2 6.2 10.4 10 9.5 9 9.2
Marshall Islands 9.4 7.5 7.9 8 7.9 10.3 7.2 8.8 10 8.3 10 8.3
Mauritania 9.3 8.3 9.6 9 8.4 11.4 6.9 9.8 9 8.6 9 8.6
Mauritius 7.8 7.4 9.1 8 7.6 11.0 8.1 8.5 8 8.1 8 8.1
Mexico 7.8 8.8 7.9 8 8.9 9.0 8.3 7.8 8 7.6 8 8.8
Micronesia, Federated States of 8.4 7.9 8 9 7.9 10.6 7.9 8.2 9 8.1 9 8.1
Monaco 8.7 7.4 9 8.9 7.5 7.1 9 11.4 9 11.4
Mongolia 7.2 7.5 10.9 7 7.4 11.4 6.8 7.3 8 7.3 7 7.3
Morocco 10.3 8.1 10.8 9 8.2 12.6 9.4 10.6 9 8.2 9 8.2
Mozambique 7.2 7.3 6.4 6 7.5 9.3 4.9 7.1 7 7.9 7 7.9
Myanmar 7.3 8.5 8 7.5 8.2 6.3 8 7.7 8 7.7
Namibia 8.3 7.4 6.3 8 7.3 8.6 5.2 8.4 9 7.9 10 8.1
Nauru 7.4 8.3 11 7.8 9.9 6.9 11 8.1 11 8.1
Nepal 8.7 7.2 11 8 7.6 9.9 7.4 10.1 9 7.9 9 8.0
Netherlands 9.3 7.7 7.3 9 9.1 7.1 6.3 10.6 9 9.8 9 9.9
New Zealand 9.7 7.9 6.4 9 8.6 6.9 7.2 10.9 9 9.9 9 9.9
Nicaragua 9.4 8.4 10.6 9 7.6 12.7 8.2 9.6 8 7.4 9 7.4
Niger 6.6 8.0 8.8 7 8.2 10.2 6.8 8.4 9 8.4 8 8.4
Nigeria 8.1 7.9 7.7 7 7.9 10.6 6.8 8.8 7 8.2 7 8.2
Niue 7.8 8.7 10 8 11.3 8.6 10 8.2 10 8.2
Norway 10.7 8.2 6.9 10 9.2 6.8 5.9 12.2 11 10.1 11 9.9
Oman 9.7 7.8 10.3 9 7.7 10.4 8.3 10.2 9 7.8 9 7.8
Pakistan 8.6 8.0 10 9 8 10.7 6.9 8.7 8 8.1 9 8.1
Palau 7.5 8.2 9 7.9 11.4 7.7 10 8.2 10 8.3
Panama 9.7 8.0 8.9 10 8 10.8 8.5 9.3 9 8.1 9 8.2
Papua New Guinea 7.9 5.7 8.5 7 5.9 10.5 7.0 7.9 8 6.2 8 6.2
Paraguay 10.3 8.9 10.3 9 7.5 12.9 9.1 9.7 9 8.6 9 8.6
Peru 9.8 9.0 8.9 9 8.4 11.5 7.9 10.4 10 8.9 10 8.9
Philippines 9.2 7.6 7.7 9 7.8 13.1 8.0 9.2 8 7.3 8 7.3
Poland 8.3 7.1 10 9 7.4 7.8 7.5 9.3 9 7.2 10 7.3
Portugal 8.9 7.9 7.8 8 8.4 8.5 6.9 9.9 9 9.0 10 9.0
Qatar 11.8 9.8 11.1 11 8 11.5 8.2 12.7 11 7.9 11 8.0
Republic of Korea 7.5 7.4 7.3 8 7.7 6.7 6.9 8.6 8 8.9 8 9.2
Republic of Moldova 7.8 6.8 7.7 7 6.6 10.0 6.8 8.0 7 6.6 7 6.7
Romania 8.2 7.5 6.8 8 7.6 9.2 7.0 8.7 8 7.9 8 7.8
Russian Federation 7.7 6.6 9.1 8 6.5 7.4 5.5 7.7 8 6.9 8 6.9
Rwanda 6.8 7.3 6.5 7 8.1 7.3 5.6 8.8 9 8.2 9 8.4
Saint Kitts and Nevis 8.2 8.4 8 9 10.2 8.7 10 8.0 11 8.0
Saint Lucia 9.5 7.8 8.5 9 7 10.7 8.6 11.9 11 7.2 12 7.2
Saint Vincent and the Grenadines 9.3 7.8 8 8 7.8 10.3 7.9 11.6 11 8.2 11 8.2
Samoa 8.7 6.3 8.5 8 6.8 11.0 7.6 8.6 8 7.2 8 7.2
San Marino 9.7 6.5 9 10.5 7.2 6.3 10 10.3 10 10.3
Sao Tome and Principe 9.0 7.9 10 8 8 14.8 7.5 9.7 9 8.2 9 8.2
Saudi Arabia 10.8 8.1 9.7 10 8.2 10.9 8.6 11.1 10 9.1 9 9.1
Senegal 7.9 8.3 8.8 8 8.3 11.3 7.3 8.7 9 8.5 8 8.5
Seychelles 7.4 6.8 9.5 6 8.7 11.3 9.6 7.1 6 7.4 7 7.5
Sierra Leone 7.2 7.1 7.3 5 7 8.6 5.1 8.9 6 7.4 7 7.5
Singapore 8.0 8.1 8.6 6 8.4 8.6 8.6 9.2 6 8.7 6 9.7
Slovakia 8.5 7.3 9.7 9 7.4 7.7 6.7 9.2 9 7.3 9 7.4
Slovenia 8.6 7.9 7.4 9 8.2 7.0 6.1 10.2 11 8.2 11 8.3
Solomon Islands 7.9 7.3 8.6 9 7.6 12.0 8.3 7.5 9 7.9 8 7.9

Somalia 7.1 6.9 8.3 7 7 8.5 6.9 7.8 7 7.1 8 7.2
South Africa 8.1 6.4 6.6 7 6.5 7.7 5.5 8.3 7 6.7 8 6.7
Spain 8.5 8.1 6.6 8 8.5 6.6 6.2 9.6 8 9.1 9 9.0
Sri Lanka 9.4 6.3 9 8 6.1 11.5 8.0 9.3 8 8.0 9 7.9
Sudan 10.1 7.2 9.8 9 7.2 11.2 7.8 11.0 9 7.4 9 7.4
Suriname 9.1 8.9 8.5 10 9.9 10.0 7.6 11.6 12 10.9 11 11.1
Swaziland 8.4 7.6 6 7 7.3 6.4 3.7 7.0 8 7.9 8 7.8
Sweden 9.9 8.6 7.2 10 9.5 7.2 6.2 11.2 10 10.4 10 10.4
Switzerland 9.1 8.8 6.2 9 9.8 6.2 6.6 10.6 11 10.3 10 10.4
Syrian Arab Republic 10.1 8.3 9.7 10 8.5 10.7 8.5 10.5 7 8.5 8 8.7
Tajikistan 8.2 7.7 10.8 7 7.7 12.8 7.9 8.7 8 7.8 8 7.8
Thailand 8.5 7.2 8.4 8 8 9.3 8.4 8.2 8 8.6 8 8.7
The former Yugoslav Republic of Macedonia 8.9 7.7 6.3 9 7.4 8.5 7.2 9.6 9 8.1 10 8.2
Togo 8.4 9.3 7.9 8 10.3 9.7 6.5 8.3 8 10.7 8 10.7
Tonga 9.7 6.9 8.1 8 7.2 11.0 8.2 8.4 10 7.9 10 8.0
Trinidad and Tobago 8.6 6.5 8.2 8 6.5 8.4 7.3 10.5 9 6.6 9 6.6
Tunisia 9.0 8.5 8.2 8 8.5 10.1 8.2 9.5 9 8.5 9 8.6
Turkey 8.4 8.4 10 9 8.9 8.5 6.7 9.4 9 9.3 9 9.3
Turkmenistan 7.5 6.9 8.8 6 6.9 12.1 7.1 8.3 7 7.2 7 7.2
Tuvalu 6.1 7.2 9 6.3 9.9 7.0 9 6.7 9 6.7
Uganda 7.6 7.4 7.2 6 7.3 9.0 6.2 8.2 8 7.9 8 8.0
Ukraine 8.0 6.9 10.3 7 6.8 9.3 6.8 7.9 7 7.1 7 7.1
United Arab Emirates 10.1 7.6 10 9 7.9 9.0 7.8 10.6 10 8.3 9 8.4
United Kingdom 9.5 7.6 6.5 10 8.6 6.6 6.7 10.7 10 9.2 10 9.2
United Republic of Tanzania 8.3 7.8 7.2 7 7.9 9.5 5.5 9.1 8 8.3 9 8.3
United States of America 8.7 7.6 8.2 8 8.5 8.0 7.4 9.7 9 9.4 8 9.4
Uruguay 8.3 8.3 8.4 8 6.7 9.7 8.0 8.6 8 7.2 9 7.2
Uzbekistan 8.4 7.5 9.4 7 7.3 11.7 7.6 8.5 8 7.1 8 7.1
Vanuatu 8.1 7.6 8.2 9 7.9 11.0 8.0 7.9 9 8.2 10 8.2
Venezuela, Bolivarian Republic of 8.9 7.6 10.1 9 7.9 13.7 9.3 8.6 9 9.3 9 9.3
Viet Nam 8.8 6.8 8.5 9 6.7 11.0 7.4 9.0 9 6.8 9 6.8
Yemen 9.5 7.4 10.4 8 7.5 12.9 10.8 10.2 8 7.6 9 7.6
Zambia 7.3 6.7 5.5 5 6.8 6.2 4.3 7.5 7 7.8 8 7.9
Zimbabwe 9.6 8.7 5.8 5 6.7 5.6 3.9 7.8 9 8.7 8 8.9
Method HALE Model HALEb HALE Model HALE HALE HALE HALE Model HALE Model
Year 1990 1990 2000 2000 2000 2001 2002 2010 2012 2012 2013 2013
Mean 8.67 7.69 8.41 8.18 7.83 9.73 7.19 9.33 8.79 8.25 8.88 8.28

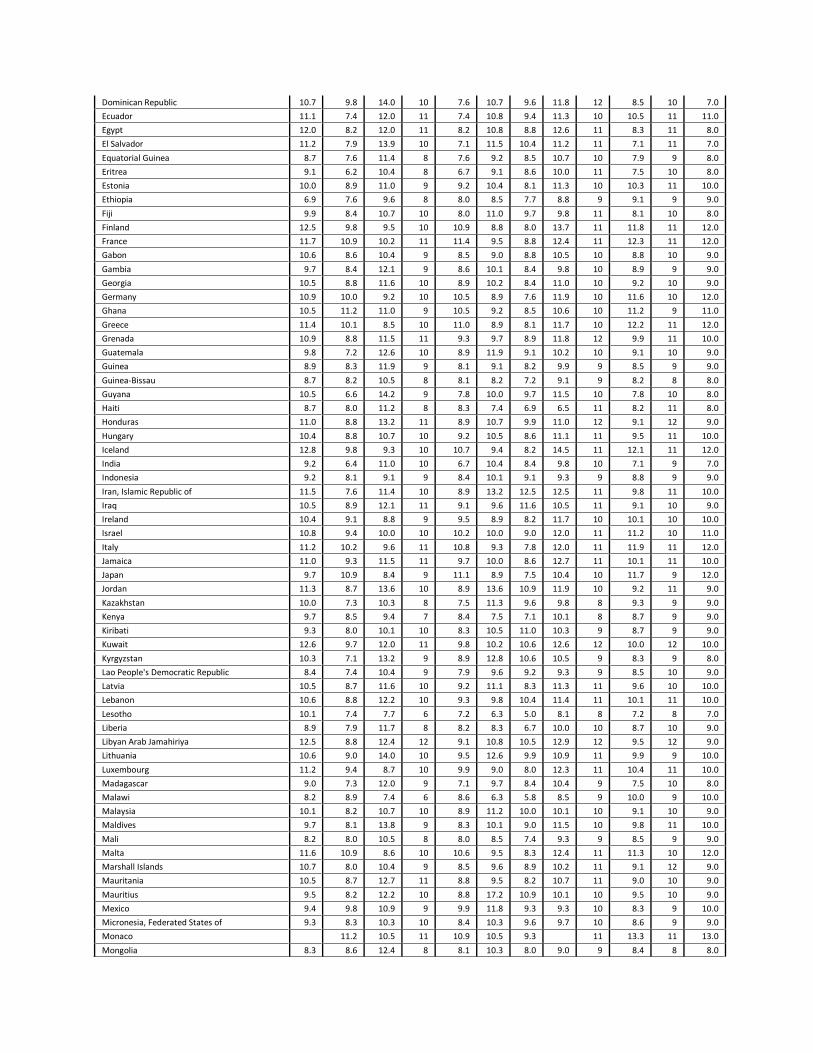
TABLE VI
Estimates of the Mortality Model for the Loss of Healthy Life Years (LHLY) for females for the WHO member countries and the related results from the HALE method of the World Health Organization
HAL
E Model HALE
HALE
Model HALE Model HAL
E Model
Countries / Year 199
0 1990
2000b
2000
2000 200
1 200
2 201
0 201
2 2012
2013
2013
Afghanistan 10.1 7.1 12.5 11 7.5 8.1 7.7 11.1 12 7.9 12 8.0
Albania 11.0 11.3 10.6 9 10.4 11.7 10.8 11.1 9 10.1 10 10.0
Algeria 11.2 8.9 12.9 10 8.9 11.2 9.6 11.9 10 8.9 11 9.0
Andorra 12.5 11.1 10.1 11 11.3 10.0 9.1 13.0 12 12.5 12 13.0
Angola 8.3 7.4 10.8 7 7.6 6.5 6.9 9.9 7 7.9 7 8.0
Antigua and Barbuda 11.2 9.5 14.5 9 9.2 10.9 10.3 13.5 11 9.7 11 10.0
Argentina 10.2 9.0 11.9 10 8.8 12.0 10.0 10.6 10 9.5 11 10.0
Armenia 10.7 7.9 10.1 10 8.3 11.9 10.4 11.3 9 8.9 9 9.0
Australia 11.2 9.7 8.8 11 10.4 9.5 8.7 12.0 11 11.6 11 12.0
Austria 10.7 10.4 8.9 10 11.1 8.8 8.6 12.1 11 11.8 11 12.0
Azerbaijan 10.5 7.8 11.4 9 7.8 11.2 10.0 11.1 10 8.6 10 9.0
Bahamas 12.2 9.7 15.7 11 11.3 12.5 9.7 13.9 12 10.8 11 11.0
Bahrain 9.9 7.9 12.4 12 7.6 12.2 10.1 11.2 12 9.6 12 10.0
Bangladesh 11.5 7.9 12.9 10 7.8 9.2 9.3 12.3 10 7.7 10 8.0
Barbados 10.4 8.4 13.4 12 8.7 10.6 9.8 10.4 13 10.2 13 10.0
Belarus 11.2 8.4 9.2 10 8.1 11.4 9.4 11.7 10 9.1 10 9.0
Belgium 11.7 10.2 9.9 10 10.6 9.4 8.2 12.1 11 11.4 11 11.0
Belize 10.3 9.8 14.3 11 9.5 11.3 10.2 10.8 12 9.8 12 10.0
Benin 9.2 8.5 11.9 9 8.3 9.2 7.9 10.2 9 8.6 9 9.0
Bhutan 9.4 6.0 14.3 8 6.1 9.9 9.5 10.2 10 6.4 9 6.0
Bolivia 11.1 8.5 12.1 9 8.8 10.7 9.4 10.7 9 8.6 9 9.0
Bosnia and Herzegovina 10.8 8.8 9.4 10 7.1 11.5 10.0 12.7 11 9.3 10 9.0
Botswana 10.7 7.9 7.9 6 7.4 5.9 5.2 11.1 10 7.5 10 8.0
Brazil 10.0 8.2 12.7 10 7.7 11.0 9.8 10.5 10 8.1 11 7.0
Brunei Darussalam 9.8 8.5 12.7 10 8.0 12.2 11.9 10.2 9 9.3 10 9.0
Bulgaria 8.9 9.3 9.2 9 9.5 9.6 8.5 8.8 10 10.0 10 10.0
Burkina Faso 8.5 8.2 9.5 7 8.3 7.2 6.3 9.3 8 8.4 8 8.0
Burundi 7.7 7.2 8.5 7 7.3 6.6 6.2 8.4 8 7.6 9 8.0
Cambodia 9.6 6.6 9.8 10 7.0 9.1 7.6 10.1 12 8.0 12 8.0
Cameroon 9.9 8.0 10.5 8 7.8 8.4 7.3 9.7 12 8.1 11 8.0
Canada 11.1 9.5 9.8 10 10.3 10.4 8.3 11.8 8 10.7 9 11.0
Cape Verde 12.0 8.4 12.3 12 9.0 11.3 10.0 12.7 11 9.7 11 10.0
Central African Republic 8.6 7.6 8.9 7 7.2 7.7 6.1 7.6 8 7.9 8 8.0
Chad 9.2 7.4 11.2 7 7.4 8.7 7.6 9.2 8 7.6 8 8.0
Chile 10.2 8.7 12.1 10 8.7 11.7 10.3 10.5 11 9.2 11 9.0
China 8.0 8.7 9.7 7 9.7 8.4 7.6 8.6 8 10.1 8 10.0
Colombia 11.0 8.7 11.8 12 7.5 12.7 10.0 11.2 14 8.4 12 11.0
Comoros 8.6 7.6 12.3 8 7.7 11.0 9.6 9.3 9 7.9 8 8.0
Congo 9.8 8.1 10.1 8 7.9 8.7 7.2 10.0 9 8.4 9 8.0
Cook Islands 7.4 11.0 11 8.1 11.4 11.5 12 10.1 12 10.0
Costa Rica 11.4 9.2 12.4 10 8.8 11.6 10.3 11.4 10 9.2 10 9.0
Côte d'Ivoire 10.1 8.0 9.5 7 7.4 7.7 6.7 9.6 8 7.8 8 8.0
Croatia 11.3 9.3 10.6 10 9.6 10.2 9.3 11.6 11 9.9 11 10.0
Cuba 11.0 10.1 10.9 11 8.2 10.8 9.8 12.9 13 8.7 12 9.0
Cyprus 11.9 11.6 12.7 8 12.6 12.0 10.6 12.3 8 12.7 8 13.0
Czech Republic 10.3 9.2 9.9 9 9.8 9.3 8.1 11.1 10 10.6 10 11.0
Democratic People's Republic of Korea 8.7 9.8 11.2 8 9.2 10.3 7.4 8.9 8 9.6 8 10.0
Democratic Republic of the Congo 9.2 7.7 9.6 8 7.7 8.2 7.0 9.6 8 7.9 8 8.0
Denmark 10.6 9.1 8.4 9 8.9 8.7 8.4 11.5 11 9.6 11 10.0
Djibouti 9.6 8.2 10.1 9 8.2 8.1 7.4 10.3 10 8.5 9 9.0
Dominica 10.7 9.3 12.2 10 9.7 11.2 10.2 12.9 12 9.1 12 9.0
Dominican Republic 10.7 9.8 14.0 10 7.6 10.7 9.6 11.8 12 8.5 10 7.0
Ecuador 11.1 7.4 12.0 11 7.4 10.8 9.4 11.3 10 10.5 11 11.0
Egypt 12.0 8.2 12.0 11 8.2 10.8 8.8 12.6 11 8.3 11 8.0
El Salvador 11.2 7.9 13.9 10 7.1 11.5 10.4 11.2 11 7.1 11 7.0
Equatorial Guinea 8.7 7.6 11.4 8 7.6 9.2 8.5 10.7 10 7.9 9 8.0
Eritrea 9.1 6.2 10.4 8 6.7 9.1 8.6 10.0 11 7.5 10 8.0
Estonia 10.0 8.9 11.0 9 9.2 10.4 8.1 11.3 10 10.3 11 10.0
Ethiopia 6.9 7.6 9.6 8 8.0 8.5 7.7 8.8 9 9.1 9 9.0
Fiji 9.9 8.4 10.7 10 8.0 11.0 9.7 9.8 11 8.1 10 8.0
Finland 12.5 9.8 9.5 10 10.9 8.8 8.0 13.7 11 11.8 11 12.0
France 11.7 10.9 10.2 11 11.4 9.5 8.8 12.4 11 12.3 11 12.0
Gabon 10.6 8.6 10.4 9 8.5 9.0 8.8 10.5 10 8.8 10 9.0
Gambia 9.7 8.4 12.1 9 8.6 10.1 8.4 9.8 10 8.9 9 9.0
Georgia 10.5 8.8 11.6 10 8.9 10.2 8.4 11.0 10 9.2 10 9.0
Germany 10.9 10.0 9.2 10 10.5 8.9 7.6 11.9 10 11.6 10 12.0
Ghana 10.5 11.2 11.0 9 10.5 9.2 8.5 10.6 10 11.2 9 11.0
Greece 11.4 10.1 8.5 10 11.0 8.9 8.1 11.7 10 12.2 11 12.0
Grenada 10.9 8.8 11.5 11 9.3 9.7 8.9 11.8 12 9.9 11 10.0
Guatemala 9.8 7.2 12.6 10 8.9 11.9 9.1 10.2 10 9.1 10 9.0
Guinea 8.9 8.3 11.9 9 8.1 9.1 8.2 9.9 9 8.5 9 9.0
Guinea-Bissau 8.7 8.2 10.5 8 8.1 8.2 7.2 9.1 9 8.2 8 8.0
Guyana 10.5 6.6 14.2 9 7.8 10.0 9.7 11.5 10 7.8 10 8.0
Haiti 8.7 8.0 11.2 8 8.3 7.4 6.9 6.5 11 8.2 11 8.0
Honduras 11.0 8.8 13.2 11 8.9 10.7 9.9 11.0 12 9.1 12 9.0
Hungary 10.4 8.8 10.7 10 9.2 10.5 8.6 11.1 11 9.5 11 10.0
Iceland 12.8 9.8 9.3 10 10.7 9.4 8.2 14.5 11 12.1 11 12.0
India 9.2 6.4 11.0 10 6.7 10.4 8.4 9.8 10 7.1 9 7.0
Indonesia 9.2 8.1 9.1 9 8.4 10.1 9.1 9.3 9 8.8 9 9.0
Iran, Islamic Republic of 11.5 7.6 11.4 10 8.9 13.2 12.5 12.5 11 9.8 11 10.0
Iraq 10.5 8.9 12.1 11 9.1 9.6 11.6 10.5 11 9.1 10 9.0
Ireland 10.4 9.1 8.8 9 9.5 8.9 8.2 11.7 10 10.1 10 10.0
Israel 10.8 9.4 10.0 10 10.2 10.0 9.0 12.0 11 11.2 10 11.0
Italy 11.2 10.2 9.6 11 10.8 9.3 7.8 12.0 11 11.9 11 12.0
Jamaica 11.0 9.3 11.5 11 9.7 10.0 8.6 12.7 11 10.1 11 10.0
Japan 9.7 10.9 8.4 9 11.1 8.9 7.5 10.4 10 11.7 9 12.0
Jordan 11.3 8.7 13.6 10 8.9 13.6 10.9 11.9 10 9.2 11 9.0
Kazakhstan 10.0 7.3 10.3 8 7.5 11.3 9.6 9.8 8 9.3 9 9.0
Kenya 9.7 8.5 9.4 7 8.4 7.5 7.1 10.1 8 8.7 9 9.0
Kiribati 9.3 8.0 10.1 10 8.3 10.5 11.0 10.3 9 8.7 9 9.0
Kuwait 12.6 9.7 12.0 11 9.8 10.2 10.6 12.6 12 10.0 12 10.0
Kyrgyzstan 10.3 7.1 13.2 9 8.9 12.8 10.6 10.5 9 8.3 9 8.0
Lao People's Democratic Republic 8.4 7.4 10.4 9 7.9 9.6 9.2 9.3 9 8.5 10 9.0
Latvia 10.5 8.7 11.6 10 9.2 11.1 8.3 11.3 11 9.6 10 10.0
Lebanon 10.6 8.8 12.2 10 9.3 9.8 10.4 11.4 11 10.1 11 10.0
Lesotho 10.1 7.4 7.7 6 7.2 6.3 5.0 8.1 8 7.2 8 7.0
Liberia 8.9 7.9 11.7 8 8.2 8.3 6.7 10.0 10 8.7 10 9.0
Libyan Arab Jamahiriya 12.5 8.8 12.4 12 9.1 10.8 10.5 12.9 12 9.5 12 9.0
Lithuania 10.6 9.0 14.0 10 9.5 12.6 9.9 10.9 11 9.9 9 10.0
Luxembourg 11.2 9.4 8.7 10 9.9 9.0 8.0 12.3 11 10.4 11 10.0
Madagascar 9.0 7.3 12.0 9 7.1 9.7 8.4 10.4 9 7.5 10 8.0
Malawi 8.2 8.9 7.4 6 8.6 6.3 5.8 8.5 9 10.0 9 10.0
Malaysia 10.1 8.2 10.7 10 8.9 11.2 10.0 10.1 10 9.1 10 9.0
Maldives 9.7 8.1 13.8 9 8.3 10.1 9.0 11.5 10 9.8 11 10.0
Mali 8.2 8.0 10.5 8 8.0 8.5 7.4 9.3 9 8.5 9 9.0
Malta 11.6 10.9 8.6 10 10.6 9.5 8.3 12.4 11 11.3 10 12.0
Marshall Islands 10.7 8.0 10.4 9 8.5 9.6 8.9 10.2 11 9.1 12 9.0
Mauritania 10.5 8.7 12.7 11 8.8 9.5 8.2 10.7 11 9.0 10 9.0
Mauritius 9.5 8.2 12.2 10 8.8 17.2 10.9 10.1 10 9.5 10 9.0
Mexico 9.4 9.8 10.9 9 9.9 11.8 9.3 9.3 10 8.3 9 10.0
Micronesia, Federated States of 9.3 8.3 10.3 10 8.4 10.3 9.6 9.7 10 8.6 9 9.0
Monaco 11.2 10.5 11 10.9 10.5 9.3 11 13.3 11 13.0
Mongolia 8.3 8.6 12.4 8 8.1 10.3 8.0 9.0 9 8.4 8 8.0

Morocco 12.0 8.7 16.0 11 8.8 15.5 11.9 12.5 12 8.9 11 9.0
Mozambique 9.1 7.5 8.4 8 7.6 8.3 6.4 8.8 8 7.9 8 8.0
Myanmar 7.8 10.7 9 8.0 8.5 8.4 10 8.3 9 8.0
Namibia 10.2 8.0 7.9 8 6.7 8.0 6.7 9.8 10 8.1 10 8.0
Nauru 8.1 11.1 13 9.2 9.6 9.0 14 9.6 14 10.0
Nepal 9.1 7.4 13.8 9 7.9 8.8 9.1 10.7 9 8.5 10 9.0
Netherlands 11.6 9.1 9.7 11 10.2 9.6 8.5 12.4 11 11.3 11 11.0
New Zealand 11.0 10.3 8.9 10 10.7 9.4 9.0 12.0 11 11.4 11 11.0
Nicaragua 11.0 8.2 13.0 11 7.2 10.7 9.3 11.2 10 7.5 11 8.0
Niger 7.8 8.2 11.5 8 8.3 8.5 7.5 9.3 9 8.5 8 9.0
Nigeria 9.2 7.9 10.3 7 7.8 8.9 7.8 9.6 8 8.2 8 8.0
Niue 8.9 11.4 11 9.2 11.6 11.3 12 9.4 12 9.0
Norway 12.6 9.7 9.1 12 10.7 9.3 8.1 13.4 12 11.2 12 11.0
Oman 11.8 7.6 13.2 12 7.3 12.9 11.1 12.5 11 7.1 12 7.0
Pakistan 9.3 8.4 14.7 10 8.5 10.0 9.3 9.8 9 8.5 10 8.0
Palau 8.0 10.4 10 8.5 10.7 10.4 11 9.1 11 9.0
Panama 11.6 11.3 11.0 11 8.9 11.1 10.2 11.2 11 9.0 10 9.0
Papua New Guinea 8.3 6.5 10.4 9 6.7 9.5 9.1 8.8 10 6.9 10 7.0
Paraguay 11.5 9.6 12.3 12 8.8 11.0 10.5 11.2 11 9.7 11 10.0
Peru 10.7 9.1 11.8 10 8.6 10.8 9.6 11.0 11 9.4 11 9.0
Philippines 11.0 8.4 10.2 11 9.1 11.7 10.2 10.6 9 8.8 9 9.0
Poland 10.5 9.7 13.4 10 9.6 11.5 10.2 11.2 11 9.8 10 10.0
Portugal 10.9 9.9 10.7 10 10.4 10.7 8.8 11.6 11 10.9 11 11.0
Qatar 13.3 9.2 13.2 12 7.6 11.2 10.0 14.7 14 7.9 13 8.0
Republic of Korea 9.1 8.9 9.5 9 10.1 8.4 8.6 10.1 10 11.6 10 12.0
Republic of Moldova 9.8 7.7 8.9 9 7.7 10.9 9.2 10.0 9 8.0 9 8.0
Romania 9.8 8.7 9.5 9 8.4 11.2 9.7 10.3 9 9.3 9 9.0
Russian Federation 10.3 8.4 11.4 9 8.3 10.4 7.7 10.2 9 8.8 9 9.0
Rwanda 8.1 7.4 8.7 7 8.3 6.8 6.6 10.7 10 8.7 10 9.0
Saint Kitts and Nevis 9.5 10.5 10 10.4 10.0 9.1 12 9.5 12 10.0
Saint Lucia 11.1 7.8 10.9 12 7.2 10.6 10.2 12.4 13 8.0 13 8.0
Saint Vincent and the Grenadines 11.1 8.8 11.3 10 8.8 10.2 9.8 12.0 11 10.0 11 10.0
Samoa 9.9 7.3 11.3 10 7.8 10.4 9.4 10.2 11 8.2 10 8.0
San Marino 12.0 9.5 11 12.2 9.8 8.1 11 13.6 11 14.0
Sao Tome and Principe 10.3 8.1 12.2 10 8.2 10.3 9.0 11.5 11 8.4 10 8.0
Saudi Arabia 12.9 9.6 12.8 12 10.0 11.0 11.0 13.3 12 9.2 12 9.0
Senegal 9.9 8.7 11.6 10 8.7 9.5 8.4 10.6 10 9.0 10 9.0
Seychelles 9.6 9.0 13.8 8 10.1 13.6 12.3 9.1 7 9.6 7 10.0
Sierra Leone 8.9 7.4 9.6 6 7.4 6.9 5.8 10.2 7 7.6 6 8.0
Singapore 9.7 9.1 11.3 8 9.8 11.6 10.4 10.7 8 9.4 7 11.0
Slovakia 11.1 9.3 12.3 9 9.4 10.7 8.9 10.8 10 10.0 10 10.0
Slovenia 11.0 10.0 10.2 11 10.3 9.2 8.2 11.8 11 11.1 12 11.0
Solomon Islands 8.6 7.5 11.3 10 8.0 11.5 10.3 8.7 10 8.5 9 8.0
Somalia 8.3 7.1 11.2 8 7.3 7.9 8.1 9.0 9 7.5 9 7.0
South Africa 10.2 7.7 8.6 9 7.8 7.6 7.3 9.6 9 8.0 10 8.0
Spain 10.4 10.4 9.8 10 11.0 9.6 7.7 11.2 10 11.7 11 12.0
Sri Lanka 11.1 7.7 11.7 10 8.5 11.4 10.3 11.2 10 9.7 10 10.0
Sudan 11.4 7.5 13.4 10 7.7 9.8 9.4 12.6 11 7.9 11 8.0
Suriname 10.7 11.5 11.9 12 13.7 10.0 10.0 12.2 12 13.1 12 13.0
Swaziland 10.2 7.1 8.0 7 7.1 6.1 5.2 8.1 8 7.6 8 8.0
Sweden 11.7 10.4 9.2 10 11.0 9.1 7.9 12.3 11 11.8 11 12.0
Switzerland 11.0 10.9 8.8 11 11.9 8.4 8.1 12.1 11 12.2 11 12.0
Syrian Arab Republic 12.1 8.7 12.9 11 9.1 12.7 10.5 12.7 11 9.5 11 10.0
Tajikistan 9.8 8.0 12.7 8 7.4 13.7 10.1 10.5 9 7.6 9 8.0
Thailand 10.0 8.4 10.5 10 8.7 11.5 10.2 9.7 11 9.5 10 10.0
The former Yugoslav Republic of Macedonia 10.5 8.4 8.9 10 8.6 11.0 10.2 10.8 10 9.7 10 10.0
Togo 10.1 9.5 10.3 9 10.5 8.2 7.7 10.1 9 10.9 9 11.0
Tonga 10.3 7.7 10.8 10 7.9 10.5 9.6 10.6 9 8.0 9 8.0
Trinidad and Tobago 10.8 7.2 10.7 10 7.6 10.6 8.6 12.0 11 7.7 11 8.0
Tunisia 10.7 10.7 11.7 10 9.8 9.8 10.3 11.4 11 9.5 10 10.0
Turkey 10.8 9.1 12.0 11 9.9 10.1 9.3 11.7 11 10.6 12 11.0
Turkmenistan 9.3 7.7 11.9 8 7.4 12.7 9.7 10.4 8 7.6 9 8.0

Tuvalu 6.9 10.0 9 7.0 9.7 8.3 10 7.3 10 7.0
Uganda 8.8 7.7 9.4 6 7.3 7.9 7.2 9.7 8 8.0 9 8.0
Ukraine 10.2 8.9 12.0 8 8.8 11.5 9.4 10.0 9 9.0 9 9.0
United Arab Emirates 11.6 7.7 12.5 11 7.9 11.5 10.9 12.4 11 8.3 11 8.0
United Kingdom 10.9 9.1 8.5 10 9.8 9.0 8.4 11.8 11 10.2 11 10.0
United Republic of Tanzania 9.3 8.0 9.6 7 8.1 7.9 6.8 10.0 10 8.7 10 9.0
United States of America 10.5 9.1 10.7 10 9.6 10.7 8.5 11.0 10 10.3 10 10.0
Uruguay 10.2 10.0 11.4 11 8.8 10.9 9.9 10.4 11 9.4 11 9.0
Uzbekistan 10.5 7.1 12.2 9 6.9 12.4 10.0 10.6 10 7.5 10 8.0
Vanuatu 9.1 8.1 10.8 11 8.5 10.8 9.8 9.5 11 9.0 10 9.0
Venezuela, Bolivarian Republic of 10.5 8.5 12.3 10 8.8 11.5 10.1 10.7 11 9.1 11 9.0
Viet Nam 10.1 8.2 11.3 11 8.5 10.4 9.3 10.5 11 8.6 10 9.0
Yemen 10.3 7.8 12.7 10 7.9 10.2 11.5 11.0 10 8.0 11 8.0
Zambia 8.6 7.4 7.2 6 6.8 5.6 5.3 8.6 8 8.9 9 9.0
Zimbabwe 11.0 8.9 7.9 6 7.3 5.5 4.7 9.0 9 8.8 9 9.0
Method HALE
MODEL
HALEb
HALE
MODEL
HALE
HALE
HALE
HALE
MODEL
HALE
MODEL
Year 199
0 1990 2000
2000
2000 200
1 200
2 201
0 201
2 2012
2013
2013
Mean 10.3 8.6 11 9.5 8.8 10 8.9 10.8 10.2 9.3 10.1 9.3