
Verification of performance scalability and ... - Hitachi Support & Solution Center Software...
32
Verification of performance scalability and availability on Web application systems Oracle Application Server 10g and Oracle Real Application Clusters 10g on Hitachi BladeSymphony Date: Jul 2007 Version: 1.0 Tomotake Nakamura Grid Computing Technologies Department System Products Division Oracle Corporation Japan [email protected] Ryutaro Yada Oracle Support & Solution Center Software Division Hitachi, Ltd. [email protected] - 1 - Copyright © 2007 Hitachi, Ltd. All Rights Reserved. Copyright © 2007 Oracle Corporation Japan. All Rights Reserved.
Transcript of Verification of performance scalability and ... - Hitachi Support & Solution Center Software...

Verification of performance scalability and availability on Web application systems Oracle Application Server 10g and Oracle Real Application Clusters 10g
on Hitachi BladeSymphony Date: Jul 2007 Version: 1.0
Tomotake Nakamura Grid Computing Technologies Department
System Products Division Oracle Corporation Japan
Ryutaro Yada Oracle Support & Solution Center
Software Division Hitachi, Ltd.
- 1 - Copyright © 2007 Hitachi, Ltd. All Rights Reserved.
Copyright © 2007 Oracle Corporation Japan. All Rights Reserved.
1. Introduction As seen in the increasing use of catch phrases such as “Web 2.0” and the descriptive “long-tail,” Internet services — from traditional online shopping to new services such as blogs and social networking services — are becoming more familiar and more widely used by many people. In response to this explosive growth in the use of Web services, all types of businesses are faced with the task of enhancing their service-provision systems. In doing so, rather than replacing existing servers with new “high-spec” servers, service providers commonly adopt a method known as “scaling out” — which refers to the use of clusters of multiple low-cost servers. With the associated advantages of cost and availability, scaling out is an effective means of expanding performance of systems on the Web-server and application-server layers.
In November 2006, Oracle Corp. Japan established the Oracle GRID Center, one of the world’s largest testing facilities, for the purpose of establishing grid-based next-generation business solutions. Hitachi, Ltd. supports the Oracle GRID Center by providing the latest servers and storage devices, and engineers from both Oracle Japan and Hitachi carry out joint verification using actual equipment at the Center. The primary goals of their efforts are to construct optimal systems utilizing Oracle’s latest grid-computing functions and Hitachi’s latest server architectures, to verify these systems through virtualization, and to ensure that customers in Japan and overseas can make effective use of the results of these efforts.
The testing conducted by Oracle Japan and Hitachi at the Oracle GRID Center consisted of benchmark verification of large-scale Web applications using a combination of Hitachi’s high-performance blade server BladeSymphony with Oracle Application Server 10g and Oracle Real Application Clusters 10g. This document reports on the results of verification testing concerning performance in scaled-out Oracle Application Server Cluster and Oracle Real Application Clusters structures of up to eight servers each, as well as the effects on performance of various replication methods to achieve scalability and ensure system availability.
- 2 - Copyright © 2007 Hitachi, Ltd. All Rights Reserved.
Copyright © 2007 Oracle Corporation Japan. All Rights Reserved.
Acknowledgements
In November 2006, Oracle Japan established a partnership with Hitachi and Oracle’s grid-computing strategic partners and opened the Oracle GRID Center (http://www.oracle.co.jp/solutions/grid_center/index.html), where the latest technologies are combined to establish next-generation business solutions that optimize computing infrastructures. This document has been prepared with the support and substantial cooperation of Intel Corp. and Cisco Systems, Inc., both of which help to further the goals of the Oracle GRID Center, through the provision of hardware, software, and engineer services. We are very grateful for the help of all participating companies and engineers.
Note: Unauthorized reproduction of this document, in full or in part, is prohibited. Disclaimer
This document is presented solely to provide information and is subject to change without notice. No guarantee is made concerning the accuracy of this document, nor is any explicit or implicit guarantee or proviso made concerning this document, including implicit guarantees or provisos concerning the document’s commercial practicality or applicability to specific purposes. Neither Oracle Corp. Japan nor Hitachi, Ltd. shall bear any liability for this document. In addition, neither shall bear any contractual obligations arising directly or indirectly from this document. Regardless of format, means (digital or mechanical), or purposes of use, this document may not be copied or reproduced without first obtaining the advance written consent of Oracle Corp. Japan and Hitachi, Ltd. Trademarks
BladeSymphony is a registered trademark of Hitachi, Ltd. Oracle, JD Edwards, PeopleSoft, and Siebel are registered trademarks of Oracle Corporation, its subsidiaries or its affiliates of the United States. Intel and Itanium are trademarks or registered trademarks of Intel Corporation or its subsidiaries in the United States and other countries. Red Hat is a trademark or a registered trademark of Red Hat Inc. in the United States and other countries. Linux is a registered trademark of Linus Torvalds. Cisco is a registered trademark of Cisco Systems, Inc. in the United States and other countries. Other names of companies and products used herein are trademarks or registered trademarks of their respective owners.
- 3 - Copyright © 2007 Hitachi, Ltd. All Rights Reserved.
Copyright © 2007 Oracle Corporation Japan. All Rights Reserved.
2. Contents 1. Introduction .............................................................................................................................................. 2 2. Contents..................................................................................................................................................... 4 3. Objective of verification testing............................................................................................................... 5 4. The Oracle grid infrastructure: Oracle Application Server Cluster 10g and Oracle Real
Application Clusters 10g ....................................................................................................................... 5 5. Hitachi BladeSymphony BS320............................................................................................................... 5 6. Oracle Application Server 10g’s replication feature.............................................................................. 6 7. Verification environment ......................................................................................................................... 8
7-1. System structure .................................................................................................................................. 8 7-2. Hardware used..................................................................................................................................... 8 7-3. Software used...................................................................................................................................... 9 7-4. Network structure................................................................................................................................ 9 7-5. Benchmarking application................................................................................................................. 10 7-6. Apache JMeter configuration ............................................................................................................ 11 7-7. Oracle HTTP Server load-balancing configuration........................................................................... 12
8. Verification details .................................................................................................................................. 12 8-1. Measurement of throughput/response time in a single-node system................................................. 12 8-2. Throughput and scalability in a system with eight nodes maximum................................................. 12 8-3. Differences in throughput and behavior due to session-replication settings ..................................... 13
9. Summary of verification results ............................................................................................................ 15 10. Detailed results of verification............................................................................................................. 17
10-1. Verification of fundamental Oracle Application Server 10g performance ...................................... 17 10-1-1. Changes in behavior due to JVM garbage-collection settings ................................................. 17 10-1-2. Trends in throughput and response time due to differences in load ......................................... 18
10-2. Oracle Application Server 10g scalability....................................................................................... 19 10-3. Differences in throughput and behavior due to replication methods............................................... 20
10-3-1. Differences in behavior due to transmission method (protocol) .............................................. 20 10-3-2. Differences in behavior due to transmission timing (trigger) .................................................. 22 10-3-3. Effects of transmission group (scope) on performance............................................................ 24 10-3-4. Effects of synchronous transmission on performance.............................................................. 26 10-3-5. Effects of write-quota increases on performance ..................................................................... 28
11. Best practices......................................................................................................................................... 31 12. Conclusion............................................................................................................................................. 32
- 4 - Copyright © 2007 Hitachi, Ltd. All Rights Reserved.
Copyright © 2007 Oracle Corporation Japan. All Rights Reserved.
3. Objective of verification testing The objective of this testing is to verify system performance and the scalability of such performance when using J2EE Web applications on a tri-layer Web system structure combining Hitachi BladeSymphony with Oracle Application Server 10g and Oracle Database 10g. Moreover, using the replication function provided by Oracle Application Server 10g to guarantee the permanence of Web application sessions is expected to help identify best practices in system design, through verification of the characteristics of each method subject to testing and their effects on system performance.
One of the major objectives of activities at the Oracle GRID Center is to reduce the time and cost of constructing systems employing Oracle’s grid infrastructure, by deploying broadly in the market the results and knowledge obtained through such verification, with systems integrators and customer systems personnel making use of system structures that have been verified in advance. Today’s information-technology services consist in the main of services provided via the Internet, such as online shopping and e-commerce services. In general, the infrastructure for such services consists of Web servers and application servers on the front end and database servers on the back end. However, large-scale performance verification testing of such Web tri-layer systems has been virtually nonexistent. Traditional benchmarking for these systems has used impractical storage structures and system tuning not suited to ordinary operations. As such, in many cases the performance data from such benchmarking and the data obtained using such structures cannot be applied to practical systems. In the verification testing under discussion here, we employed practical system structures and general-purpose applications, based on the Oracle GRID Center concept.
4. The Oracle grid infrastructure: Oracle Application Server Cluster 10g and Oracle Real Application Clusters 10g Oracle’s grid infrastructure consists of Oracle Application Server Cluster 10g, comprising a cluster of application servers, and Oracle Real Application Clusters 10g, a database employing a clustered structure. Together, these components provide high availability through features such as process monitoring and fail-over systems in the event of trouble, as well as linear performance expansion through scaling out. Beginning with the 10g versions, which are compatible with grid computing, these systems have been capable of appropriate and dynamic allocation to each operation of the resources needed to provide these services. Further, the consolidation of systems and grid-based resource management will enable optimization of service levels and system costs.
Our Web application performance verification testing employed a system structure consisting of respectively eight of Oracle Application Server Clusters and Oracle Real Application Clusters. Performance expandability was verified with the addition of nodes. Due to the nature of the applications used in this testing, greater load was placed on the application servers than on the database. For this reason, the results concerning system throughput and performance expandability obtained through this testing will form a very useful reference in application-server system expansion. For the databases, separate performance verification is underway for client-server applications using transactions similar to those used in this testing. Please refer to the performance data in the relevant white paper.
5. Hitachi BladeSymphony BS320 Hitachi’s BladeSymphony BS320, the application server used in this testing, has the characteristics described below. This blade server is suited to a wide range of uses, including as a Web server, an application server, or a database server within a midrange system.
A blade server offering the highest performance in an ultra-compact, high-density format
This blade server lends itself to easy adoption, with one of the industry’s smallest footprints (10 blades in a height of 6U), a weight of only some 98 kg (with a fully loaded chassis), and a standard power
- 5 - Copyright © 2007 Hitachi, Ltd. All Rights Reserved.
Copyright © 2007 Oracle Corporation Japan. All Rights Reserved.

supply compatible with 100/200 VAC power. In addition, recent models feature dual processors offering the highest performance. High reliability with SAN booting and N+1 standby features
Using the BS320’s SAN booting and N+1 standby features, in the event of any server trouble the affected blade can be switched to a reserve blade automatically, making it possible to increase system availability and maintain service levels even in cases of server problems. Unified, intensive integrated management and administration
BladeSymphony’s administration software enables remote integrated management and administration of all system resources within BladeSymphony — including not only blades but also storage and other components. These features enable unified monitoring of system resources and implementation of additional necessary tasks such as blade-server deployment and backup. These features are essential when administering a very large number of servers in a grid environment. In the current testing, by setting up 16 blade servers we were able to radically reduce system construction costs, using the deployment feature for automated bulk setup of operating-system environments.
6. Oracle Application Server 10g’s replication feature Oracle Application Server Cluster provides a replication feature implemented between OC4J instances for objects and values included in HTTP-session or state-full-session Enterprise JavaBean instances (see Fig. 6 - 1). This feature enables transparent succession of sessions through the point of fail-over; the sessions are passed to a replicated application server during session processing when the application server to which the session is connected goes down (see Fig. 6 - 2).
Oracle Application Server Cluster
Load balancer
Interconnected network Session object
HTTP session
Web client
Oracle Application Server Cluster
Web client
Load balancer
Interconnected network Session object
HTTP session
Redirection
Fig. 6-1: Fig. 6-2:
Replication between application-server clusters
Fail-over between application-server clusters
Policies such as the methods and timing of transfer can be set to control the behavior of the replication feature. In this white paper, we verify the characteristic behavior and the effects on performance of each replication setting.
The replication policies that can be set are described below.
Transfer method (protocol) Peer-to-Peer
Uses the TCP protocol to replicate a session object to another OC4J in the cluster. Selection of the OC4J replication target is determined by referring to cluster information administered by the opmn process.
- 6 - Copyright © 2007 Hitachi, Ltd. All Rights Reserved.
Copyright © 2007 Oracle Corporation Japan. All Rights Reserved.
Multicast
Uses the UDP protocol to replicate a session object to another OC4J in the cluster. Each OC4J uses multicasting to notify other OC4Js of structure information. Each OC4J recognizes cluster information dynamically to determine the OC4J replication target. Database
Stores a session object in the Oracle database. Transmission timing (trigger) onSetAttribute
When a value is changed, replicates each change added to HTTP session attributes. Viewed from a programming perspective, replication is conducted each time setAttribute() is called in an HttpSession object. OnRequestEnd (default setting)
Places all changes added to HTTP session attributes in the queue and replicates all changes immediately prior to the sending of an HTTP response. onShutdown
Replicates the current state of an HTTP session each time the JVM shuts down properly. Transmission group (scope) modifiedAttributes (default setting)
Replicates only changed HTTP session attributes — in other words, only values changed by calling setAttribute() in an HttpSession object. allAttributes
Replicates the values of all attributes set to an HTTP session. Synchronization method Asynchronous
Replication of data is not synchronized with other instances. Synchronous
After replicating data, awaits a response from the target of replication confirming that it has received the data. Write-quota Designates the number of targets of replication. Under the default write-quota value of 1, data is replicated to one other OC4J within the Oracle Application Server cluster. To replicate a session object to all OC4Js within the Oracle Application Server cluster, the value of write-quota must be set to the total number of OC4Js in the cluster.
- 7 - Copyright © 2007 Hitachi, Ltd. All Rights Reserved.
Copyright © 2007 Oracle Corporation Japan. All Rights Reserved.

7. Verification environment
7-1. System structure
FC switch
・・・
Client machines× 8
・・・
・・・
WEB/Application Server:HitachiBladeSymphony BS320× 8 blades
Database Server:HitachiBladeSymphonyBS1000× 8blades
Storage:Hitachi AMS
Cisco Catalyst 3750
CiscoCatalyst 6504
Fig. 7-1: Verification system structure
7-2. Hardware used
Web/application servers Model Hitachi BladeSymphony BS320 x 8 blades CPU 3 GHz dual-core Intel® Xeon® processor
2 sockets/blade Memory 8 GB
Database servers
Model Hitachi BladeSymphony BS1000 x 8 blades CPU 1.6 GHz dual-core Intel® Itanium® 2 processor
2 sockets/blade Memory 16 GB
Client machines
Model Intel White Boxes x 8 CPU 2.66 GHz quad-core Intel® Xeon® processor
1 socket/server Memory 4 GB
Storage
Model Hitachi AMS Hard disk 144 GB x 28 HDDs (+ 2 spare HDDs)
- 8 - Copyright © 2007 Hitachi, Ltd. All Rights Reserved.
Copyright © 2007 Oracle Corporation Japan. All Rights Reserved.

RAID-group structure 1D + 1P x 2 (for OS use) 2D + 1P x 8 (for Oracle database use)
Network switch
Model Catalyst 6504 Catalyst 3750
7-3. Software used Web/application servers
OS Red Hat Enterprise Linux ES release 4 Update 1 Oracle Oracle Application Server 10g 10.1.3.1
Database servers
OS Red Hat Enterprise Linux AS release 4 Update 4 Oracle Oracle Database 10g Enterprise Edition 10.2.0.3
Oracle Real Application Clusters 10g Oracle Partitioning
Client machines
OS Red Hat Enterprise Linux AS release 4 Update 3 Oracle Oracle Client 10.2.0.1 Load-generation tool Apache JMeter 2.2
7-4. Network structure Fig. 7 - 2 shows the network structure in detail. Each blade in the BladeSymphony server has four network interfaces, and all of these interfaces are connected internally to the two network switches built into the chassis. Using the VLAN feature, in this test for eth0, internal switch 1 was used for connecting to the public network; for eth1, internal switch 2 was used for connection to the interconnected network for the transmission of replications. The internal switches are connected to the Cisco switches using gigabit Ethernet cables.
- 9 - Copyright © 2007 Hitachi, Ltd. All Rights Reserved.
Copyright © 2007 Oracle Corporation Japan. All Rights Reserved.

Internal switch 2For interconnected-
network use
BS1000
Internal network switch 2For interconnected-
network use
BS
320
#1
BS
320
#2
BS
320
#3
BS
320
#4
BS
320
#5
BS
320
#6
BS
320
#7
BS
320
#8
BS
320
#9 (r
eser
ve)
BS
320
#10
(rese
rve)
BS320
Cisco CATARIST3750
Application server Database server B
S10
00 #
1
BS
1000
#2
BS
1000
#3
BS
1000
#4
BS
1000
#5
BS
1000
#6
BS
1000
#7
BS
1000
#8
Internal network switch 1For public-network use
Segment A Segment B
Internal switch 1For public-network
use
Fig. 7-2: Network structure
7-5. Benchmarking application In this verification testing, we used JPetStore as the benchmarking application. Prepared as a Spring Framework sample application, JPetStore was designed assuming use on a Web shopping site. JPetStore can be used to execute general OLTP processing, such as logging in, searching products, adding products to a shopping cart, purchasing products (“transaction commitment”), and logging out. The program efficiently applies load to application servers and database servers. In addition, since JPetStore maintains application-generated objects in HttpSessions, this application is best suited for verifying session replication.
Fig. 3: The JPetStore application
- 10 - Copyright © 2007 Hitachi, Ltd. All Rights Reserved.
Copyright © 2007 Oracle Corporation Japan. All Rights Reserved.
7-6. Apache JMeter configuration We used Apache JMeter as a tool for applying load from a client to the JPetStore, which was distributed on the Oracle Application Server. Using Apache JMeter enables execution of the entire series of operations from login through logout by applying scenarios. Furthermore, the amount of load applied to the application server can be adjusted by configuring the number of threads executed simultaneously and by variously setting the standby time.
JPetStore scenarios
In this verification testing, the following scenarios were defined in Apache JMeter and used in all measurements.
1. Login Choosing a user name randomly and using together with its corresponding password to log in.
In OC4J, user information is maintained in an HttpSession.
2. Product searching Using a randomly selected keyword to search products. Adjustments are made to ensure that search results numbered 100 on average.
In OC4J, search results for paging use are maintained in an HttpSession.
3. Product selection Choosing a single item randomly from a list of products searched.
In OC4J, item information is maintained in an HttpSession.
4. Adding selected products to the shopping cart In OC4J, the shopping cart is maintained in an HttpSession.
5. Repetition Repeating steps 2 (product searching) through 4 (adding selected products to the shopping cart) a random number of times ranging from one through five.
6. Purchase Purchasing the items in the shopping cart.
Executing transactions using the database.
7. Logout Invalidating all HttpSessions in OC4J.
Apache JMeter parameters
The following parameters have been configured in Apache JMeter. These parameters are related to the amount of load generated from the client.
Number of threads executed simultaneously
350, 700 The number of threads started up to apply load from the client. Multiple.
Standby time 300 ms ± 100 ms The time on standby with each page shift. A random value within a designated range is selected.
- 11 - Copyright © 2007 Hitachi, Ltd. All Rights Reserved.
Copyright © 2007 Oracle Corporation Japan. All Rights Reserved.
7-7. Oracle HTTP Server load-balancing configuration By setting policies for the feature to balance load through transfer to OC4J from OHS, the feature’s behavior can be controlled. The following eight policies may be set.
Random Round Robin Random with Local Affinity Round Robin with Local Affinity Random using Routing Weight Round Robin using Routing Weight Metric Based Metric Based with Local Affinity
In this verification testing, we set “Round Robin with Local Affinity” as the OHS load balancing policy. This setting gives priority to the OC4J in routing when the OC4J is running on the host executing the OHS. Under this structure, since both OHS and OC4J run on each node, no network is used for communication between the OHS and the OC4J. Thus this structure has the advantages not only of enabling effective utilization of network bandwidth but also of enabling accurate measurement of network traffic volume from the client to the application server, or network traffic volume used in OC4J session replication.
8. Verification details We measured the following items.
8-1. Measurement of throughput/response time in a single-node system A system consisting of N nodes each in the application server and the database server is defined as an N-node system. The testing under discussion measured maximum application throughput in a single-node system. In addition, in verifying performance scalability through an eight-node system, verification was also performed to determine the boundary application load volume at which optimal throughput and response time are maintained in a single-node system. No replication configuration was conducted. 8-2. Throughput and scalability in a system with eight nodes maximum This testing measured throughput and response time from two nodes through a maximum of eight nodes and verified performance scalability when expanding the system through the scaling-out process. The volume of application load per node was used as the boundary application load volume at which optimal throughput and response time were maintained in a single-node system. No replication configuration was conducted.
- 12 - Copyright © 2007 Hitachi, Ltd. All Rights Reserved.
Copyright © 2007 Oracle Corporation Japan. All Rights Reserved.
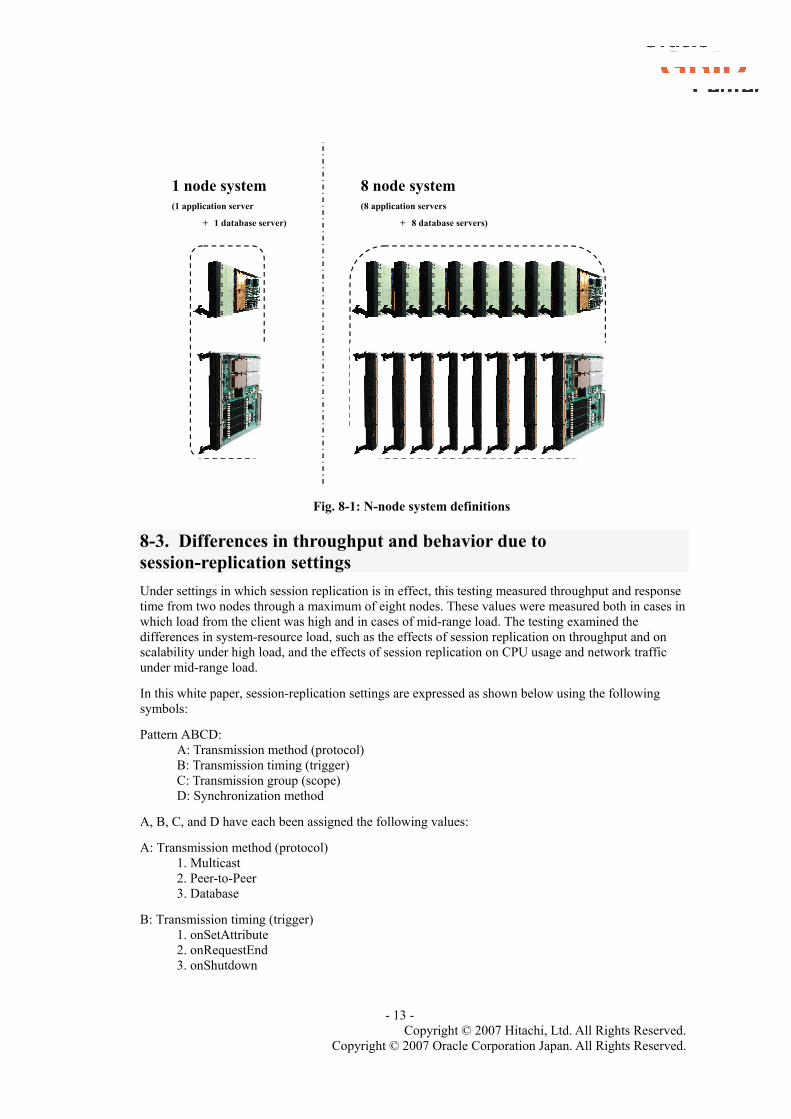
1 node system(1 application server
+ 1 database server)
8 node system(8 application servers
+ 8 database servers)
Fig. 8-1: N-node system definitions
8-3. Differences in throughput and behavior due to session-replication settings Under settings in which session replication is in effect, this testing measured throughput and response time from two nodes through a maximum of eight nodes. These values were measured both in cases in which load from the client was high and in cases of mid-range load. The testing examined the differences in system-resource load, such as the effects of session replication on throughput and on scalability under high load, and the effects of session replication on CPU usage and network traffic under mid-range load.
In this white paper, session-replication settings are expressed as shown below using the following symbols:
Pattern ABCD: A: Transmission method (protocol) B: Transmission timing (trigger) C: Transmission group (scope) D: Synchronization method
A, B, C, and D have each been assigned the following values:
A: Transmission method (protocol) 1. Multicast 2. Peer-to-Peer 3. Database
B: Transmission timing (trigger) 1. onSetAttribute 2. onRequestEnd 3. onShutdown
- 13 - Copyright © 2007 Hitachi, Ltd. All Rights Reserved.
Copyright © 2007 Oracle Corporation Japan. All Rights Reserved.

C: Transmission group (scope) 1. modifiedAttributes 2. allAttributes
D: Synchronization method 1. Asynchronous 2. Synchronous
Ex.: Pattern 2211 (meaning: Peer-to-Peer/onRequestEnd/modifiedAttributes/asynchronous) Pattern 2112 (Peer-to-Peer/onSetAttribute/modifiedAttributes/synchronous)
Table 8 - 1 below shows a list of replication patterns measured in this testing.
Measurement pattern
Transmission method (protocol)
Transmission timing (trigger)
Transmission group (scope)
Synchronization method
Write quota
Pattern 2211 Peer-to-Peer onRequestEnd modifiedAttributes
Asynchronous 1
Pattern 2212 Peer-to-Peer onRequestEnd modifiedAttributes
Synchronous 1
Pattern 2111 Peer-to-Peer onSetAttribute modifiedAttributes
Asynchronous 1
Pattern 2112 Peer-to-Peer onSetAttribute modifiedAttributes
Synchronous 1
Pattern 2121 Peer-to-Peer onSetAttribute allAttributes Asynchronous 1 Pattern 2122 Peer-to-Peer onSetAttribute allAttributes Synchronous 1 Pattern 2221 Peer-to-Peer onRequestEnd allAttributes Asynchronous 1 Pattern 2222 Peer-to-Peer onRequestEnd allAttributes Synchronous 1 Pattern 1211 Multicast onRequestEnd modifiedAttribut
es Asynchronous 1
Pattern 2311 Peer-to-Peer onShutdown modifiedAttributes
Asynchronous 1
Pattern 2211wq2 Peer-to-Peer onRequestEnd modifiedAttributes
Asynchronous 2
Pattern 2211wq3 Peer-to-Peer onRequestEnd modifiedAttributes
Asynchronous 3
Table 8-1: List of measurement patterns
- 14 - Copyright © 2007 Hitachi, Ltd. All Rights Reserved.
Copyright © 2007 Oracle Corporation Japan. All Rights Reserved.
9. Summary of verification results Hitachi, Ltd. and Oracle Corp. Japan conducted joint performance testing running Oracle Grid on Hitachi’s BladeSymphony at the Oracle GRID Center. This white paper reports on the results of this testing.
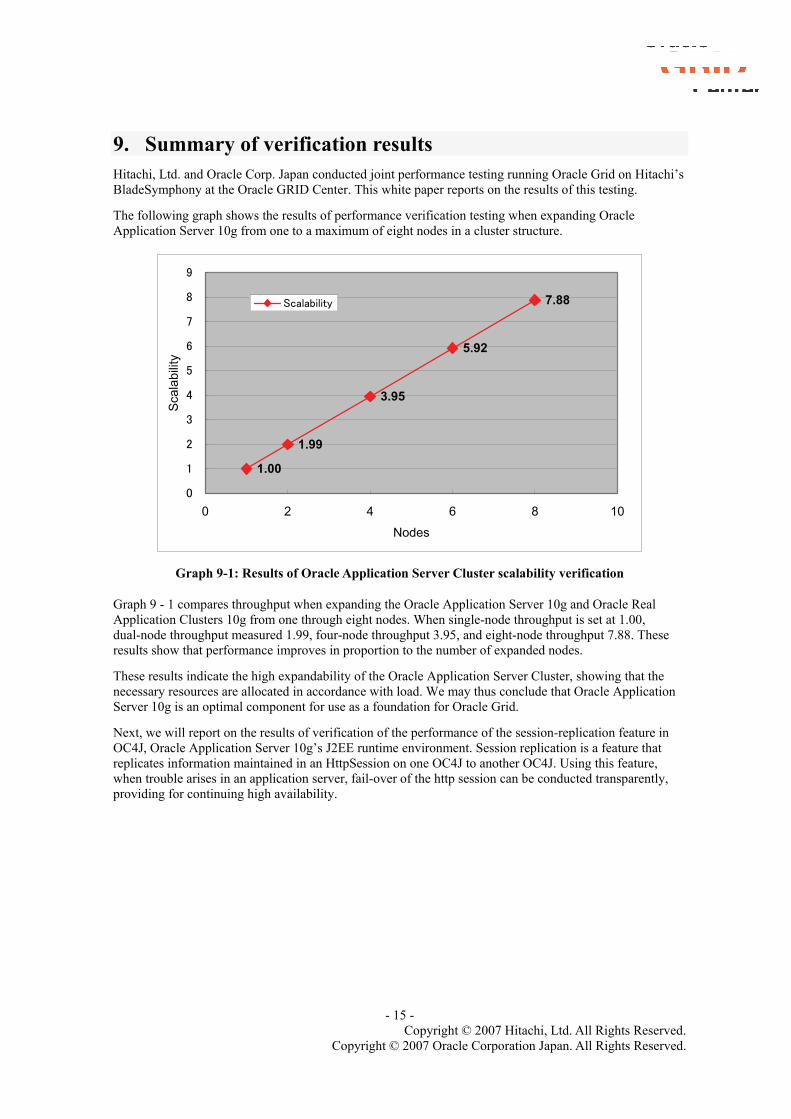
The following graph shows the results of performance verification testing when expanding Oracle Application Server 10g from one to a maximum of eight nodes in a cluster structure.
1.00
1.99
3.95
5.92
7.88
0
1
2
3
4
5
6
7
8
9
0 2 4 6 8
Nodes
Sca
labi
lity
10
Scalability
Graph 9-1: Results of Oracle Application Server Cluster scalability verification
Graph 9 - 1 compares throughput when expanding the Oracle Application Server 10g and Oracle Real Application Clusters 10g from one through eight nodes. When single-node throughput is set at 1.00, dual-node throughput measured 1.99, four-node throughput 3.95, and eight-node throughput 7.88. These results show that performance improves in proportion to the number of expanded nodes.
These results indicate the high expandability of the Oracle Application Server Cluster, showing that the necessary resources are allocated in accordance with load. We may thus conclude that Oracle Application Server 10g is an optimal component for use as a foundation for Oracle Grid.
Next, we will report on the results of verification of the performance of the session-replication feature in OC4J, Oracle Application Server 10g’s J2EE runtime environment. Session replication is a feature that replicates information maintained in an HttpSession on one OC4J to another OC4J. Using this feature, when trouble arises in an application server, fail-over of the http session can be conducted transparently, providing for continuing high availability.
- 15 - Copyright © 2007 Hitachi, Ltd. All Rights Reserved.
Copyright © 2007 Oracle Corporation Japan. All Rights Reserved.
1 .001 .00
5 .61
7 .44
7 .88
5 .92
3 .95
1 .99
3 .76
1 .90
0
1
2
3
4
5
6
7
8
9
0 2 4 6 8 1
Nodes
Scal
abili
ty
0
No Replication
Replication
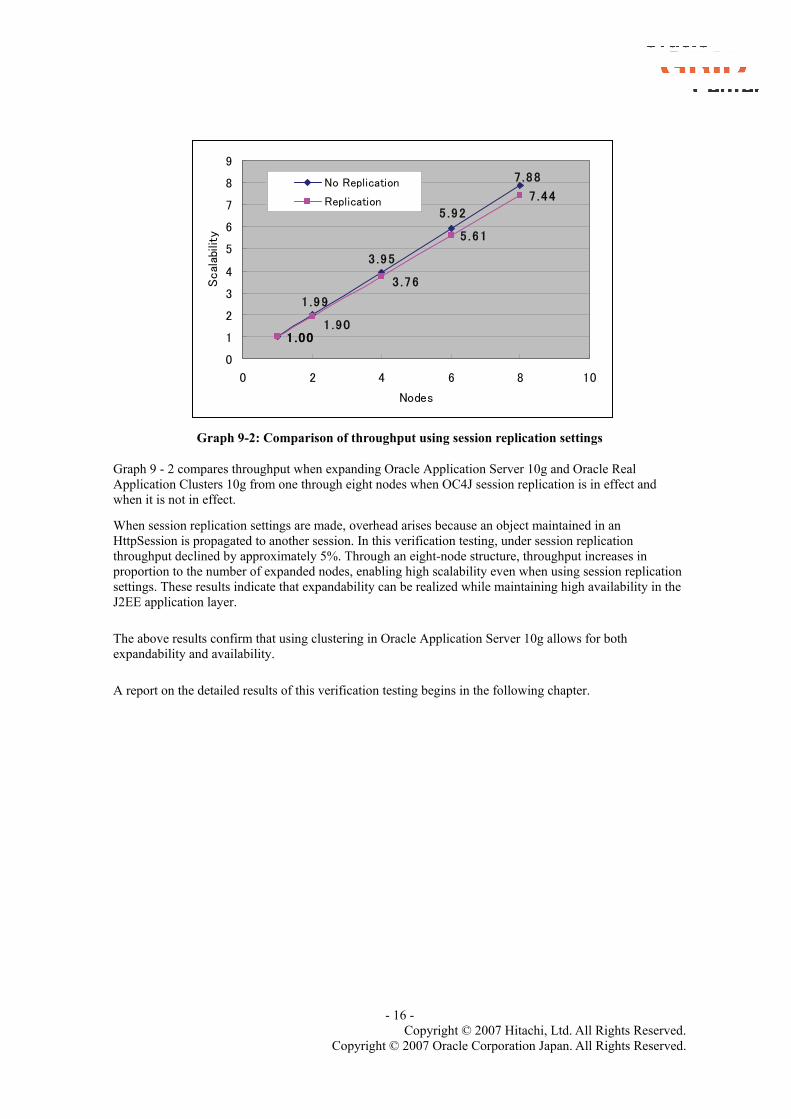
Graph 9-2: Comparison of throughput using session replication settings
Graph 9 - 2 compares throughput when expanding Oracle Application Server 10g and Oracle Real Application Clusters 10g from one through eight nodes when OC4J session replication is in effect and when it is not in effect.
When session replication settings are made, overhead arises because an object maintained in an HttpSession is propagated to another session. In this verification testing, under session replication throughput declined by approximately 5%. Through an eight-node structure, throughput increases in proportion to the number of expanded nodes, enabling high scalability even when using session replication settings. These results indicate that expandability can be realized while maintaining high availability in the J2EE application layer.
The above results confirm that using clustering in Oracle Application Server 10g allows for both expandability and availability.
A report on the detailed results of this verification testing begins in the following chapter.
- 16 - Copyright © 2007 Hitachi, Ltd. All Rights Reserved.
Copyright © 2007 Oracle Corporation Japan. All Rights Reserved.
10. Detailed results of verification
10-1. Verification of fundamental Oracle Application Server 10g performance This testing verified performance in a single-node Oracle Application Server 10g structure. This verification testing was conducted as fundamental verification of scalability. Optimal conditions for a single-node structure were determined by adjusting JVM parameters and the volume of load from the client. By applying these conditions to the cluster structure as well, performance can be compared when changing the node structure.
10-1-1. Changes in behavior due to JVM garbage-collection settings
0
500
1000
1500
2000
2500
0 120 240 360 480 600 720 840 960
Time (second)
Thro
ughp
ut (p
ages
/sec
ond)
NormalGC ConcGC AggressiveGC
0
10
20
30
40
50
60
70
80
90
100
0 120 240 360 480 600 720 840 960
Time (second)
CPU
usa
ge (%
) NormalGC ConcGC AggressiveGC
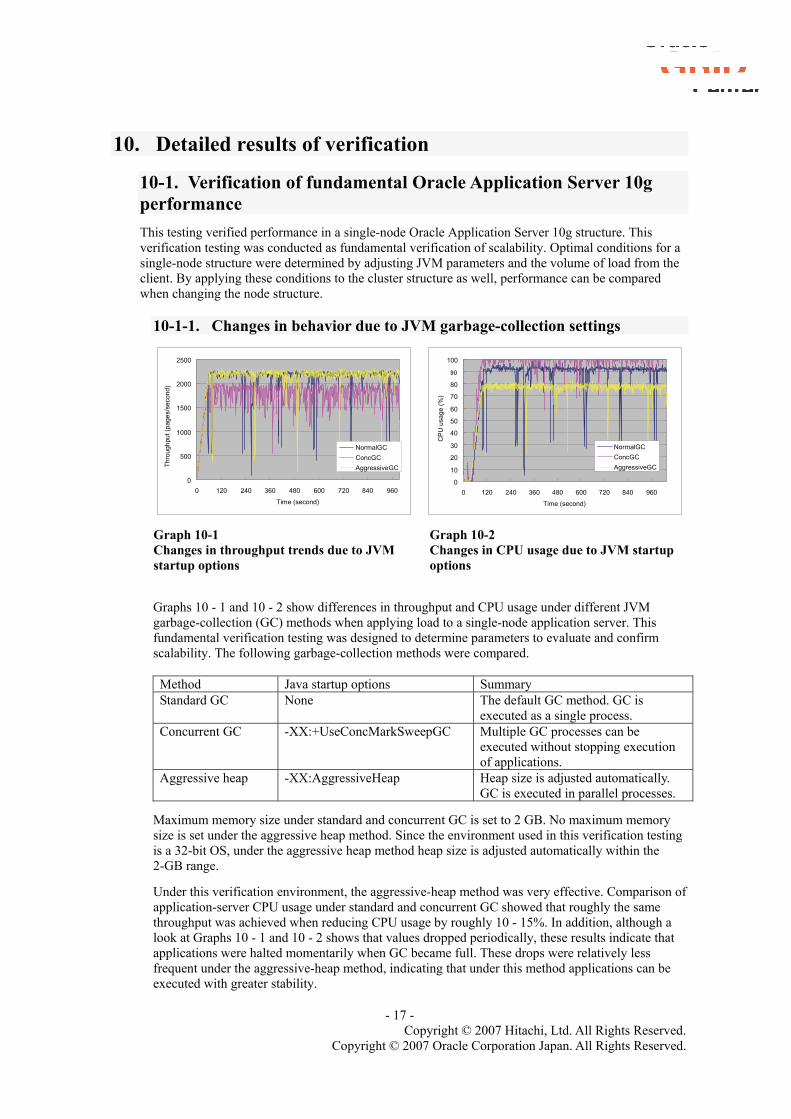
Graph 10-1 Changes in throughput trends due to JVM startup options
Graph 10-2 Changes in CPU usage due to JVM startup options
Graphs 10 - 1 and 10 - 2 show differences in throughput and CPU usage under different JVM garbage-collection (GC) methods when applying load to a single-node application server. This fundamental verification testing was designed to determine parameters to evaluate and confirm scalability. The following garbage-collection methods were compared.
Method Java startup options Summary Standard GC None The default GC method. GC is
executed as a single process. Concurrent GC -XX:+UseConcMarkSweepGC Multiple GC processes can be
executed without stopping execution of applications.
Aggressive heap -XX:AggressiveHeap Heap size is adjusted automatically. GC is executed in parallel processes.
Maximum memory size under standard and concurrent GC is set to 2 GB. No maximum memory size is set under the aggressive heap method. Since the environment used in this verification testing is a 32-bit OS, under the aggressive heap method heap size is adjusted automatically within the 2-GB range.
Under this verification environment, the aggressive-heap method was very effective. Comparison of application-server CPU usage under standard and concurrent GC showed that roughly the same throughput was achieved when reducing CPU usage by roughly 10 - 15%. In addition, although a look at Graphs 10 - 1 and 10 - 2 shows that values dropped periodically, these results indicate that applications were halted momentarily when GC became full. These drops were relatively less frequent under the aggressive-heap method, indicating that under this method applications can be executed with greater stability.
- 17 - Copyright © 2007 Hitachi, Ltd. All Rights Reserved.
Copyright © 2007 Oracle Corporation Japan. All Rights Reserved.

Based on the above results, the following verification testing has been conducted using the aggressive-heap method as the optimal parameter. 10-1-2. Trends in throughput and response time due to differences in load
Graphs 10 - 3 and 10 - 4 show the results of measurement of throughput, response time, and application-server CPU usage when increasing the number of threads executed simultaneously from the client in a single-node system from 500 through 600, 700, 800, 900, and 1,000. When load is increased, throughput increases uniformly together with CPU usage, with CPU usage reaching 100% at a load of 1,000 threads. Although response time increased dramatically when the load exceeded 700 threads, this is thought to result from a marked increase in system overhead due to an increase in the number of sessions. Since response time maintained a stable trend through 700 threads, it can be determined that 700 threads is the boundary load at which optimal services can be provided in a single-node system. On a database server, even when load was at its maximum of 1,000 threads CPU usage was only about 40%, showing that such load did not result in bottlenecking.
0
0.2
0.4
0.6
0.8
1
1.2
1.4
1.6
1.8
500 600 700 800 900 1000
Threads
Thro
ughp
ut ra
tio
0
2
4
6
8
10
12
14A
vera
ge re
spon
se-ti
me
ratio
Throughput ratio Average response-time ratio
0
10
20
30
40
50
60
70
80
90
100
0 120 240 360 480 600 720 840 960 1080 1200
Time (second)
CP
U u
sage
(%)
500 threads
600 threads
700 threads
800 threads
900 threads
1000 threads
Graph 10–3 Throughput and response time in a single-node system
Graph 10–4 CPU usage in a single-node system
In the following verification testing, performance was measured at 700 threads executed simultaneously and at one-half that load: 350 threads executed simultaneously.
- 18 - Copyright © 2007 Hitachi, Ltd. All Rights Reserved.
Copyright © 2007 Oracle Corporation Japan. All Rights Reserved.

10-2. Oracle Application Server 10g scalability Graph 10 - 5 compares throughput and response time when expanding the number of application-server nodes and database-server nodes from one through eight. Application load was 700 threads per node. Throughput increased generally in proportion to number of nodes, while response time remained stable regardless of the number of nodes. In this verification testing, OC4J session replication was not used. The results here show that in an Oracle AS cluster structure with no replication, the cluster structure causes almost no overhead even when the number of nodes increases, indicating that system performance can be expanded by scaling out.
Graph 10 - 6 shows the throughput ratios under each node structure, with throughput under a single-node system set to 1.00. Throughput under a dual-node system was 1.99, with a value of 3.95 under a four-node and 7.88 under an eight-node system.
0123456789
1 2 4 6 8Nodes
Thro
ughp
ut ra
tio
0123456789
10
Aver
age
resp
onse
-tim
e ra
tio
Throughput ratio
Average response-time ratio
Graph 10-5: Comparison of throughput and response time
1.00
1.99
3.95
5.92
7.88
0
1
2
3
4
5
6
7
8
9
0 2 4 6 8 1
Nodes
Sca
labi
lity
0
Scalability
Graph 10-6: Performance scalability
- 19 - Copyright © 2007 Hitachi, Ltd. All Rights Reserved.
Copyright © 2007 Oracle Corporation Japan. All Rights Reserved.

10-3. Differences in throughput and behavior due to replication methods The following is a report on verification of performance with OC4J session replication in effect under dual-node through eight-node cluster structures. Characteristics were ascertained by measuring performance at high and mid-range levels of load from the client and comparing these with performance with no session-replication settings.
10-3-1. Differences in behavior due to transmission method (protocol)
Mid-range load
Graphs 10 - 7 and 10 - 8 compare throughput and response time under mid-range load using no replication and using the peer-to-peer and multicast replication transmission methods. Under mid-range load, in which there is some leeway in terms of CPU resources, there were almost no differences in throughput between transmission methods. Likewise, there were no differences in response time, indicating that application response time is not affected by setting replication using the peer-to-peer and multicast transmission methods.
0
1
2
3
4
5
6
7
8
9
1 2 4 6 8Nodes
Thro
ughp
ut ra
tio
No replication
Peer-to-peer pattern 2211
Multicast pattern 1211
0
0.5
1
1.5
2
2.5
3
3.5
4
4.5
5
1 2 4 6 8 Nodes
Ave
rage
resp
onse
-tim
e ra
tio
No replication
Peer-to-peer pattern 2211
Multicast pattern 1211
Graph 10–7 Differences in throughput (under mid-range load of 350 threads) due to transmission method (protocol)
Graph 10–8 Differences in response time (under mid-range load of 350 threads) due to transmission method (protocol)
Next, Graph 10 - 9 shows CPU usage under each transmission method. Graph 10 - 10 shows differences in interconnected transmission volume. From these results, we were able to confirm that CPU usage increased by approximately 15% when putting the peer-to-peer or multicast replication method into effect. This increase is thought to represent the processing overhead of replicating session objects from any one node to another node.
There was no difference between the peer-to-peer and multicast transmission methods in the transmission volume of replicated session objects. Even when increasing the number of nodes from two through eight, the average interconnected transmission volume remained the same, because — whichever transmission method was used — the destination of session-object replication remained a single node, regardless of the total number of nodes.
These results show that under mid-range load there is no difference in the effects on application performance between the peer-to-peer and multicast transmission methods.
- 20 - Copyright © 2007 Hitachi, Ltd. All Rights Reserved.
Copyright © 2007 Oracle Corporation Japan. All Rights Reserved.

0
10
20
30
40
50
60
70
80
90
100
0 120 240 360 480 600 720 840 960
Time (second)
CP
U u
sage
(%)
No replication
Peer-to-peer pattern 2211
Multicast pattern 1211
0
1000
2000
3000
4000
5000
6000
7000
8000
9000
10000
0 120 240 360 480 600 720 840 960
Time (second)
Ave
rage
inte
rcon
nect
ed tr
ansm
issi
on v
olum
e pe
r nod
e (K
byte
/sec
ond)
No replication
Peer-to-peer pattern 2211
Multicast pattern 1211
Graph 10–9 Differences in CPU usage (under mid-range load of 350 threads) due to transmission method (protocol)
Graph 10–10 Differences in interconnected transmission volume (under mid-range load of 350 threads) due to transmission method (protocol)
High load
Graphs 10 - 11 and 10 - 12 compare throughput and response time under high load using no replication and using the peer-to-peer and multicast replication transmission methods. Under conditions of high load, in which there is no leeway in terms of CPU resources, overhead is apparent as reductions in throughput and in response time. Under the peer-to-peer and multicast transmission methods, throughput declined by approximately 5% in comparison to cases in which no replication was conducted. Response time increased by roughly doubled both under the peer-to-peer method and the multicast method.
0
0.5
1
1.5
2
2.5
3
3.5
4
4.5
5
1 2 4 6 8
Nodes
Ave
rage
resp
onse
tim
e r
atio No replication
Peer-to-Peer pattern 2211
Multicast pattern 1211
0
1
2
3
4
5
6
7
8
9
1 2 4 6 8
Nodes
Thro
ugh
put
ratio
No replication
Peer-to-Peer pattern 2211
Multicast pattern 1211
Graph 10-11 Differences in throughput (under high load of 700 threads) due to transmission method (protocol)
Graph 10–12 Differences in response time (under high load of 700 threads) due to transmission method (protocol)
The following graphs show differences in CPU usage and interconnected transmission volume. As was the case under conditions of mid-range load, there were no significant differences between results under the peer-to-peer and multicast methods.
- 21 - Copyright © 2007 Hitachi, Ltd. All Rights Reserved.
Copyright © 2007 Oracle Corporation Japan. All Rights Reserved.

0
2000
4000
6000
8000
10000
12000
14000
16000
0 240 480 720 960
Time (second)
Ave
rage
int
erco
nnec
ted
trans
mis
sio
n
vol
ume
per
nod
e (K
byt
e/se
cond
)
No replicatoin
Peer-to-Peer pattern 2211
Multicast pattern 1211
0
10
20
30
40
50
60
70
80
90
100
0 240 480 720 960
Time (second)
CPU
usage
(%)
No replication
Peer-to-Peer pattern 2211
Multicast pattern 1211
Graph 10–13 Differences in CPU usage (under high load of 700 threads) due to transmission method (protocol)
Graph 10–14 Differences in interconnected transmission volume (under high load of 700 threads) due to transmission method (protocol)
10-3-2. Differences in behavior due to transmission timing (trigger)
Mid-range load
Graphs 10-15 and 10-16 show the results of measuring throughput and response time under mid-range load with replication transmission timing (trigger) set to onShutdown, onRequestEnd, and onSetAttribute. There were no major differences in throughput or response time under the respective transmission timing settings.
Graph 10 - 17 shows differences in interconnected transmission volume under each setting. Transmission volume was highest under onSetAttribute, at roughly 9 MB/second. Transmission volume under onRequestEnd was approximately 2 MB/second lower than under onSetAttribute. Table 10 - 18 shows that, as a result of this difference in network processing volume, CPU usage was higher under onSetAttribute than under onRequestEnd. When setting multiple session objects in a single http request from the client, replication is conducted once under onRequestEnd. However, under onSetAttribute each individual session object is replicated each time setAttribute() is called, resulting in higher overhead. Since overhead under onSetAttribute depends on the number of setAttribute() calls per request, performance characteristics vary by application.
Under onShutdown, there were almost no changes relative to cases in which no replication was conducted. However, interconnected transmission volume was approximately 70 KB/second. This is due not to replication but to communication of control information between clusters.
- 22 - Copyright © 2007 Hitachi, Ltd. All Rights Reserved.
Copyright © 2007 Oracle Corporation Japan. All Rights Reserved.

0
1
2
3
4
5
6
7
8
9
1 2 4 6 8
Nodes
Thro
ughp
ut ra
tio
No replication onShutdown pattern 2311 onRequestEnd pattern 2211 onSetAttribute pattern 2111
0
0.5
1
1.5
2
2.5
3
3.5
4
4.5
5
1 2 4 6 8
Nodes
Ave
rage
resp
onse
-tim
e ra
tio
No replication
onShutdown pattern 2311
onRequestEnd pattern 2211
onSetAttribute pattern 2111
Graph 10–15 Differences in throughput (under mid-range load of 350 threads) due to transmission timing (trigger)
Graph 10–16 Differences in response time (under mid-range load of 350 threads) due to transmission timing (trigger)
0
1000
2000
3000
4000
5000
6000
7000
8000
9000
10000
0 120 240 360 480 600 720 840 960
Time (second)
Aver
age
inte
rcon
nect
ed tr
ansm
issi
on v
olum
e pe
r nod
e (K
byte
/sec
ond)
No replication shutdown pattern 2311 requestEnd pattern 2211 setAttribute pattern 2111
Graph 10-17: Differences in interconnected transmission volume (under mid-range load of
350 threads) due to transmission timing (trigger)
0
10
20
30
40
50
60
70
80
90
100
0 120 240 360 480 600 720 840 960
Time (second)
CP
U u
sage
(%)
No replication shutdown pattern 2311 requestEnd pattern 2211 setAttribute pattern 2111
Graph 10-18: Differences in CPU usage (under mid-range load of 350 threads) due to
transmission timing (trigger)
- 23 - Copyright © 2007 Hitachi, Ltd. All Rights Reserved.
Copyright © 2007 Oracle Corporation Japan. All Rights Reserved.

High load
Graphs 10 - 19 and 10 - 20 show the results of measuring throughput and response time under high load with replication transmission timing (trigger) set to onShutdown, onRequestEnd, and onSetAttribute. Under onShutdown, there were almost no differences relative to cases in which no replication was used, although under onRequestEnd and onSetAttribute performance showed deterioration of approximately 6% and 16%, respectively, in an eight-node structure. As seen with the results under mid-range load, the high deterioration in performance under onSetAttribute resulted from the demand on CPU resources due to the higher network transmission volume under onSetAttribute. This overhead resulted in an increase of three to four times in response time under onSetAttribute.
0
1
2
3
4
5
6
7
8
9
1 2 4 6 8
Nodes
Thro
ughp
ut ra
tio
No replication
onShutdown pattern 2311
onRequestEnd pattern 2211
onSetAttribute pattern 2111
0
1
2
3
4
5
6
1 2 4 6 8
Nodes
Ave
rage
resp
onse
-tim
e ra
tio
No replication onShutdown pattern 2311 onRequestEnd pattern 2211 onSetAttribute pattern 2111
Graph 10–19 Differences in throughput (under high load of 700 threads) due to transmission timing (trigger)
Graph 10–20 Differences in response time (under high load of 700 threads) due to transmission timing (trigger)
10-3-3. Effects of transmission group (scope) on performance
Mid-range load
Graphs 10 - 21 and 10 - 22 compare throughput and response time under mid-range load when setting transmission group (scope) to modifiedAttributes and allAttributes. Under mid-range load conditions, there were no differences in throughput under each setting.
Under allAttributes, response time deteriorated by several percentage points.
0
1
2
3
4
5
6
7
8
9
1 2 4 6 8
Nodes
Thro
ughpu
t ra
tio
No replication
modifiedAttributes pattern 2211
allAttributes pattern 2221
0
0.5
1
1.5
2
2.5
3
3.5
4
4.5
5
1 2 4 6 8
Nodes
Avera
ge r
esp
onse
tim
e r
atio
No replication
modifiedAttributes pattern 2211
allAttributes pattern 2221
Graph 10–21 Effects of transmission group (scope) on throughput (under mid-range load of 350 threads)
Graph 10–22 Effects of transmission group (scope) on response time (under mid-range load of 350 threads)
- 24 - Copyright © 2007 Hitachi, Ltd. All Rights Reserved.
Copyright © 2007 Oracle Corporation Japan. All Rights Reserved.

Next, Graph 10 - 23 shows differences in CPU usage and Graph 10 - 24 shows differences in interconnected transmission volume. Under allAttributes, CPU usage increases by approximately 25% from its level under modifiedAttributes, indicating that overhead under allAttributes is extremely high. Interconnected transmission volume also increases, by about 27 MB/s. This is because under allAttributes, each time replication is conducted the session transmits all session objects configured up to that point in time. For this reason, overhead varies depending on the number and size of session objects generated by the application.
0
5000
10000
15000
20000
25000
30000
35000
40000
0 240 480 720 960
Time (second)
Avera
ge int
erco
nnecte
d tr
ansm
issi
on
volu
me
per
node
(Kby
te/se
con
d)
No replicatoin
modifiedAttributes pattern 2211
allAttributes pattern 2221
0
10
20
30
40
50
60
70
80
90
100
0 120 240 360 480 600 720 840 960
Time (second)
CPU
Usage
(%)
No replication
modifiedAttributes pattern 2211
allAttributes pattern 2221
Graph 10–23 Effects of transmission group (scope) on CPU usage (under mid-range load of 350 threads)
Graph 10–24 Effects of transmission group (scope) on interconnected transmission volume (under mid-range load of 350 threads)
High load
Graphs 10 - 25 and 10 - 26 compare throughput and response time under high load when setting transmission group (scope) to modifiedAttributes and allAttributes. Overhead under allAttributes was marked, with throughput decreasing by approximately 30%. In addition, response time grew by approximately eight times. These results show how overhead that has affected CPU usage under mid-range load in turn has considerable effects on throughput and response time under high load.
0
2
4
6
8
10
12
14
1 2 4 6 8
Nodes
Ave
rage
res
pons
e tim
e ra
tio
No replication
modifiedAttributes pattern 2211
allAttributes pattern 2221
0
1
2
3
4
5
6
7
8
9
1 2 4 6 8
Nodes
Thro
ughp
ut r
atio
No replication
modifiedAttributes pattern 2211
allAttributes pattern 2221
Graph 10–25 Effects of transmission group (scope) on throughput (under high load of 700 threads)
Graph 10–26 Effects of transmission group (scope) on response time (under high load of 700 threads)
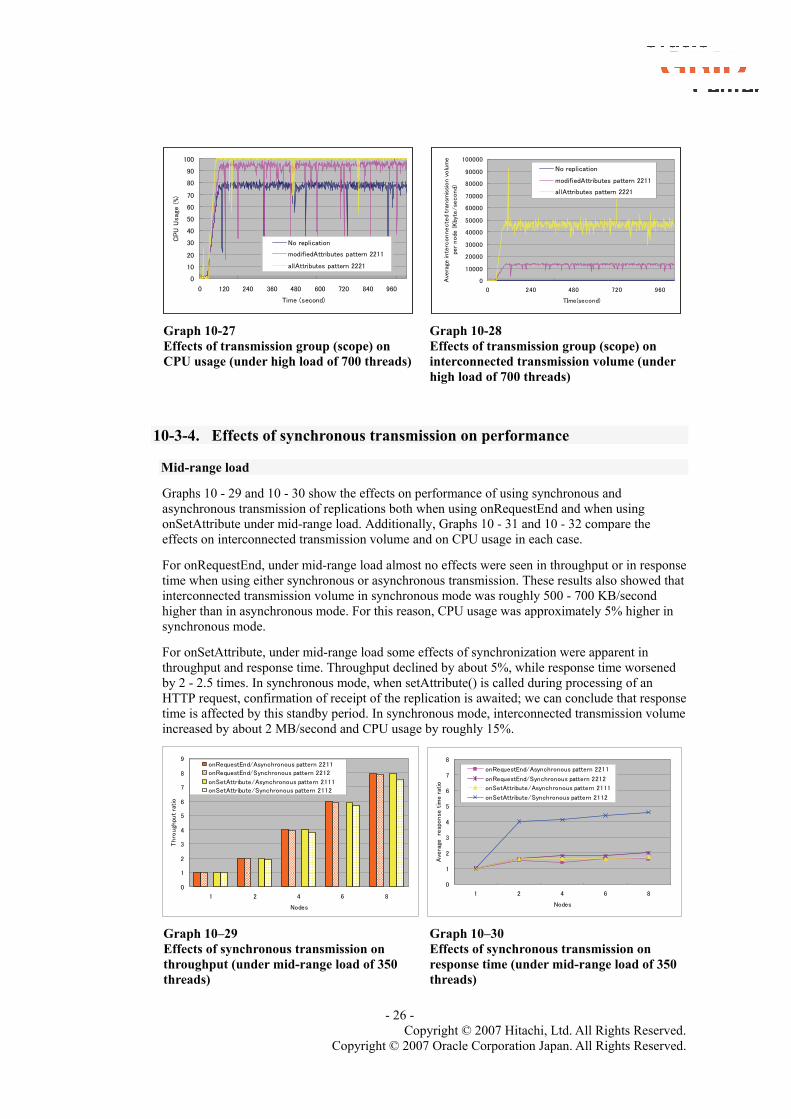
Next, Graphs 10 - 27 and 10-28 show differences in CPU usage and in interconnected transmission volume, respectively. Under allAttributes, CPU usage remained at roughly 100%, indicating full CPU bottlenecking. Interconnected transmission volume also increased, by approximately 33 MB/s, indicating that overhead was as high, as it was under mid-range load.
- 25 - Copyright © 2007 Hitachi, Ltd. All Rights Reserved.
Copyright © 2007 Oracle Corporation Japan. All Rights Reserved.
0
10
20
30
40
50
60
70
80
90
100
0 120 240 360 480 600 720 840 960
Time (second)
CPU
Usa
ge (
%)
No replication
modifiedAttributes pattern 2211
allAttributes pattern 2221
0
10000
20000
30000
40000
50000
60000
70000
80000
90000
100000
0 240 480 720 960
TIme(second)
Ave
rage
inte
rconnecte
d tr
ansm
issi
on v
olu
me
per
node
(K
byte
/se
cond)
No replication
modifiedAttributes pattern 2211
allAttributes pattern 2221
Graph 10-27 Effects of transmission group (scope) on CPU usage (under high load of 700 threads)
Graph 10-28 Effects of transmission group (scope) on interconnected transmission volume (under high load of 700 threads)
10-3-4. Effects of synchronous transmission on performance
Mid-range load
Graphs 10 - 29 and 10 - 30 show the effects on performance of using synchronous and asynchronous transmission of replications both when using onRequestEnd and when using onSetAttribute under mid-range load. Additionally, Graphs 10 - 31 and 10 - 32 compare the effects on interconnected transmission volume and on CPU usage in each case.
For onRequestEnd, under mid-range load almost no effects were seen in throughput or in response time when using either synchronous or asynchronous transmission. These results also showed that interconnected transmission volume in synchronous mode was roughly 500 - 700 KB/second higher than in asynchronous mode. For this reason, CPU usage was approximately 5% higher in synchronous mode.
For onSetAttribute, under mid-range load some effects of synchronization were apparent in throughput and response time. Throughput declined by about 5%, while response time worsened by 2 - 2.5 times. In synchronous mode, when setAttribute() is called during processing of an HTTP request, confirmation of receipt of the replication is awaited; we can conclude that response time is affected by this standby period. In synchronous mode, interconnected transmission volume increased by about 2 MB/second and CPU usage by roughly 15%.
0
1
2
3
4
5
6
7
8
9
1 2 4 6 8
Nodes
Thro
ugh
put
ratio
onRequestEnd/Asynchronous pattern 2211
onRequestEnd/Synchronous pattern 2212
onSetAttribute/Asynchronous pattern 2111
onSetAttribute/Synchronous pattern 2112
0
1
2
3
4
5
6
7
8
1 2 4 6 8
Nodes
Ave
rage
re
sponse
tim
e r
atio
onRequestEnd/Asynchronous pattern 2211
onRequestEnd/Synchronous pattern 2212
onSetAttribute/Asynchronous pattern 2111
onSetAttribute/Synchronous pattern 2112
Graph 10–29 Effects of synchronous transmission on throughput (under mid-range load of 350 threads)
Graph 10–30 Effects of synchronous transmission on response time (under mid-range load of 350 threads)
- 26 - Copyright © 2007 Hitachi, Ltd. All Rights Reserved.
Copyright © 2007 Oracle Corporation Japan. All Rights Reserved.

0
2000
4000
6000
8000
10000
12000
0 120 240 360 480 600 720 840 960
Time (second)
Ave
rage
inte
rcon
nect
ed tr
ansm
issi
on v
olum
e pe
r no
de (K
byte
/sec
ond)
onRequestEnd/Asynchronous pattern 2211 onRequestEnd/Synchronous pattern 2212
onSetAttribute/Asynchronous pattern 2111 onSetAttribute/Synchronous pattern 2112
Graph 10-31: Differences in interconnected transmission volume due to synchronous-mode
transmission (under mid-range load of 350 threads)
0
10
20
30
40
50
60
70
80
90
100
0 120 240 360 480 600 720 840 960
Time (second)
CP
U u
sage
(%)
onRequestEnd/Asynchronous pattern 2211 onRequestEnd/Synchronous pattern 2212 onSetAttribute/Asynchronous pattern 2111 onSetAttribute/Synchronous pattern 2112
Graph 10-32: Differences in CPU usage due to synchronous-mode transmission (under
mid-range load of 350 threads)
High load
Graphs 10 - 33 and 10 - 34 show the effects on performance of using synchronous and asynchronous transmission of replications both when using onRequestEnd and when using onSetAttribute under high load. As well as under mid-range load, the impact on the throughput and the response time growing in the order that are "onRequestEnd and asynchronous", "onRequestEnd and synchronous", "onSetAttribute and asynchronous" and "onSetAttribute and synchronous". The case of "onSetAttribute and synchronous" has the much more impact than the other cases. The actual throughput hardly increase from under mid-range load to high load.
Graph 10-35 and 10-36 show that the CPU usage and interconnected trasmission volume increased more than under mid-range load in all of the case except "onSetAttribute and synchronous". The CPU usage is around 80% under mid-tier in "onSetAttribute and synchronous" but it is around 80% also under high load. Therefore, the throughput doesn't grow under high load. It might be caused by the bottleneck of waiting for acknoledgement of synchronous processing.
- 27 - Copyright © 2007 Hitachi, Ltd. All Rights Reserved.
Copyright © 2007 Oracle Corporation Japan. All Rights Reserved.

Graph 10–33 Effects of synchronous transmission on throughput (under high load of 700 threads)
Graph 10–34 Effects of synchronous transmission on response time (under high load of 700 threads)
0
1
2
3
4
5
6
7
8
1 2 4 6 8
Nodes
Thro
ugh
put
ratio
onRequestEnd/Asynchronous pattern 2211
onRequestEnd/Synchronous pattern 2212
onSetAttribute/Asynchronous pattern 2111
"onSetAttribute/Synchronous pattern 2112
0
5
10
15
20
25
1 2 4 6 8
Nodes
Ave
rage
resp
onse
tim
e r
atio
onRequestEnd/Asynchronous pattern 2211
onRequestEnd/Synchronous pattern 2212
onSetAttribute/Asynchronous pattern 2111
onSetAttribute/Synchronous pattern 2112
0
2000
4000
6000
8000
10000
12000
14000
16000
0 240 480 720 960
Time (second)
Avera
ge inte
rconnecte
d tr
ansm
issio
n
volu
me p
er
node (
Kbyte
/second)
onRequestEnd/Asynchronous pattern 2211
onRequestEnd/Syynchronous pattern 2212
onSetAttribute/Asynchronous pattern 2111
onSetAttribute/Synchronous pattern 2112
0
10
20
30
40
50
60
70
80
90
100
0 120 240 360 480 600 720 840 960
Time (second)
CPU
usage (
%)
onRequestEnd/Asynchronous pattern 2211
onRequestEnd/Synchronous pattern 2212
onSetAttribute/Asynchronous pattern 2111
onSetAttribute/Synchronous pattern 2112
Graph 10–35 Differences in CPU usage due to synchronous transmission (under high load of 700 threads)
Graph 10–36 Differences in interconnected transmission volume due to asynchronous transmission (under high load of 700 threads)
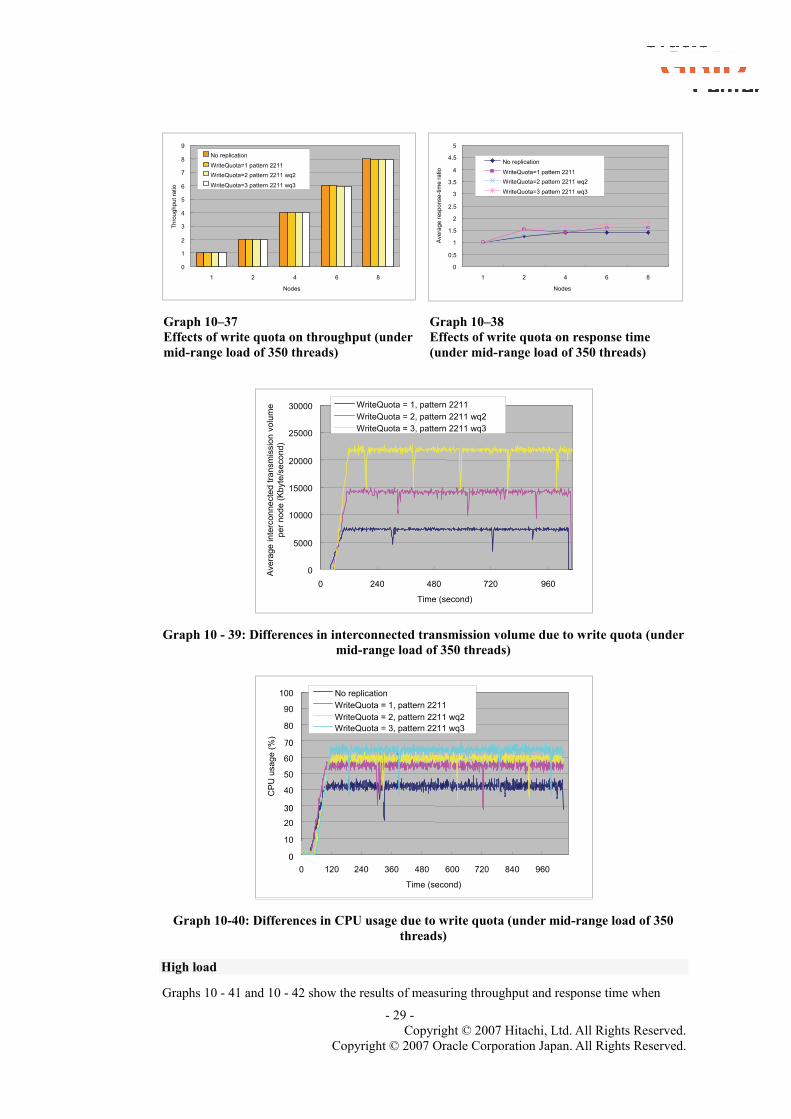
10-3-5. Effects of write-quota increases on performance
Mid-range load
Graphs 10 - 37 and 10 - 38 show the results of measuring throughput and response time when increasing the number of write quotas under mid-range load. Increasing the number of write quotas had no significant effects on throughput or on response time under mid-range load. Under a dual-node structure in particular, when the write quota was set to 1, 2, or 3, absolutely no differences in performance results were seen, because in these cases a given node would replicate a session object to only one other node.
Graphs 10 - 39 and 10 - 40 compare interconnected transmission volume and CPU usage under different write quotas. Interconnected transmission volume doubles or triples in proportion to the write-quota value. CPU usage shows an increase of approximately 5% per write-quota increase.
- 28 - Copyright © 2007 Hitachi, Ltd. All Rights Reserved.
Copyright © 2007 Oracle Corporation Japan. All Rights Reserved.
0
1
2
3
4
5
6
7
8
9
1 2 4 6 8
Nodes
Thro
ughp
ut ra
tio
No replication
WriteQuota=1 pattern 2211 WriteQuota=2 pattern 2211 wq2
WriteQuota=3 pattern 2211 wq3
0
0.5
1
1.5
2
2.5
3
3.5
4
4.5
5
1 2 4 6 8
Nodes
Ave
rage
resp
onse
-tim
e ra
tio
No replication
WriteQuota=1 pattern 2211 WriteQuota=2 pattern 2211 wq2
WriteQuota=3 pattern 2211 wq3
Graph 10–37 Effects of write quota on throughput (under mid-range load of 350 threads)
Graph 10–38 Effects of write quota on response time (under mid-range load of 350 threads)
0
5000
10000
15000
20000
25000
30000
0 240 480 720 960
Time (second)
Ave
rage
inte
rcon
nect
ed tr
ansm
issi
on v
olum
e pe
r nod
e (K
byte
/sec
ond)
WriteQuota = 1, pattern 2211 WriteQuota = 2, pattern 2211 wq2 WriteQuota = 3, pattern 2211 wq3
Graph 10 - 39: Differences in interconnected transmission volume due to write quota (under
mid-range load of 350 threads)
0 10
20
30
40
50
60
70 80
90
100
0 120 240 360 480 600 720 840 960
Time (second)
CP
U u
sage
(%)
No replication WriteQuota = 1, pattern 2211 WriteQuota = 2, pattern 2211 wq2 WriteQuota = 3, pattern 2211 wq3
Graph 10-40: Differences in CPU usage due to write quota (under mid-range load of 350
threads)
High load
Graphs 10 - 41 and 10 - 42 show the results of measuring throughput and response time when
- 29 - Copyright © 2007 Hitachi, Ltd. All Rights Reserved.
Copyright © 2007 Oracle Corporation Japan. All Rights Reserved.
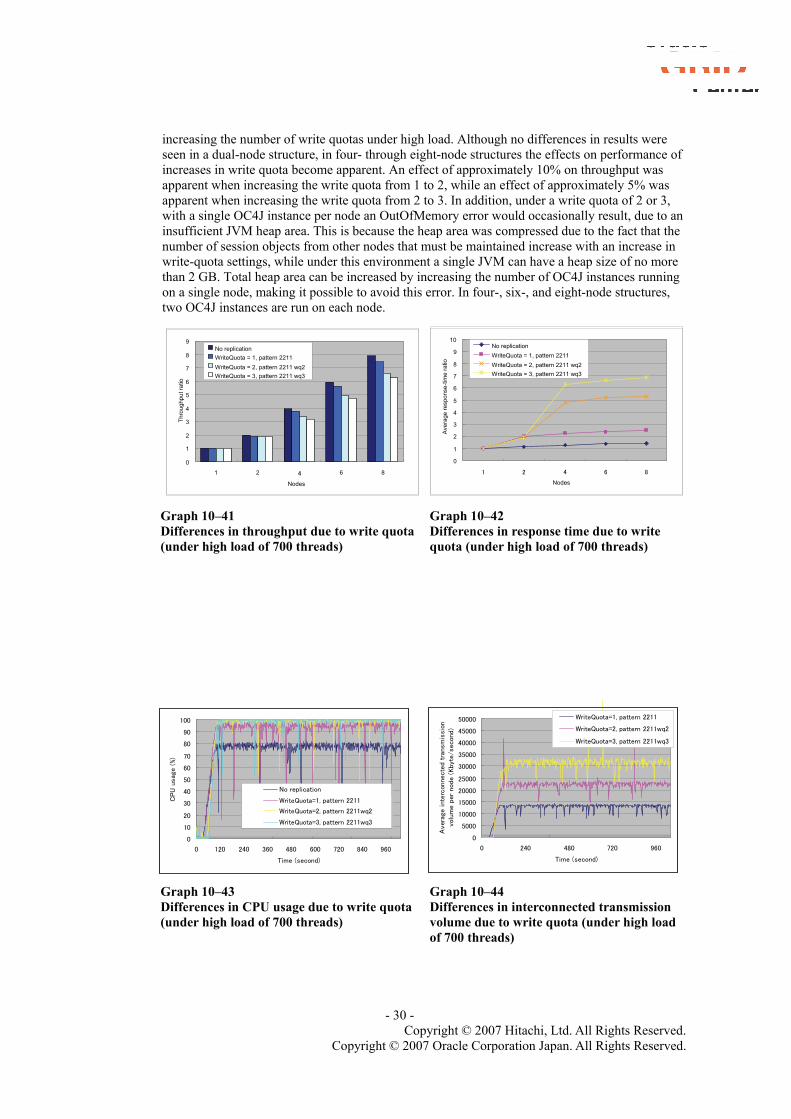
increasing the number of write quotas under high load. Although no differences in results were seen in a dual-node structure, in four- through eight-node structures the effects on performance of increases in write quota become apparent. An effect of approximately 10% on throughput was apparent when increasing the write quota from 1 to 2, while an effect of approximately 5% was apparent when increasing the write quota from 2 to 3. In addition, under a write quota of 2 or 3, with a single OC4J instance per node an OutOfMemory error would occasionally result, due to an insufficient JVM heap area. This is because the heap area was compressed due to the fact that the number of session objects from other nodes that must be maintained increase with an increase in write-quota settings, while under this environment a single JVM can have a heap size of no more than 2 GB. Total heap area can be increased by increasing the number of OC4J instances running on a single node, making it possible to avoid this error. In four-, six-, and eight-node structures, two OC4J instances are run on each node.
0
1
2
3
4
5
6
7
8
9
1 2 4 6 8
Nodes
Thro
ughp
ut ra
tio
No replication WriteQuota = 1, pattern 2211 WriteQuota = 2, pattern 2211 wq2 WriteQuota = 3, pattern 2211 wq3
0
1
2
3
4
5
6
7
8
9
10
1 2 4 6 8 Nodes
Ave
rage
resp
onse
-tim
e ra
tio
No replication WriteQuota = 1, pattern 2211 WriteQuota = 2, pattern 2211 wq2 WriteQuota = 3, pattern 2211 wq3
Graph 10–41 Differences in throughput due to write quota (under high load of 700 threads)
Graph 10–42 Differences in response time due to write quota (under high load of 700 threads)
0
5000
10000
15000
20000
25000
30000
35000
40000
45000
50000
0 240 480 720 960
Time (second)
Aver
age int
erc
onne
cte
d tr
ansm
issi
on
volu
me
per
node
(Kbyt
e/sec
ond
)
WriteQuota=1, pattern 2211
WriteQuota=2, pattern 2211wq2
WriteQuota=3, pattern 2211wq3
0
10
20
30
40
50
60
70
80
90
100
0 120 240 360 480 600 720 840 960
Time (second)
CPU
usa
ge (
%)
No replication
WriteQuota=1, pattern 2211
WriteQuota=2, pattern 2211wq2
WriteQuota=3, pattern 2211wq3
Graph 10–43 Differences in CPU usage due to write quota (under high load of 700 threads)
Graph 10–44 Differences in interconnected transmission volume due to write quota (under high load of 700 threads)
- 30 - Copyright © 2007 Hitachi, Ltd. All Rights Reserved.
Copyright © 2007 Oracle Corporation Japan. All Rights Reserved.

11. Best practices The results of this verification testing indicate best practices from a performance point of view. Although the best practices described here reflect the configurations that can generate the highest performance, in some cases it might not be possible to meet these availability requirements. In the end, the most appropriate settings should be selected in light of both availability requirements and verification of performance reported to date.
JVM startup option: -XX:+UseAgressiveHeap
By designating the Aggressive Heap option as a JVM startup option, the effects of JVM garbage collection on performance can be kept to a minimum.
Replication transmission method: Peer-to-Peer
There are no significant differences in the effects on application performance and availability of using either the peer-to-peer or multicast transmission method. In this verification testing, under conditions of high load some behavior reflecting unstable performance was apparent when using the multicast method. This behavior is thought to result from the multicast method’s employment of the UDP protocol. The peer-to-peer method has thus been chosen as best practice, as in the testing reported in this white paper this method generated stable performance even under high load.
Transmission timing: onRequestEnd
Designating onRequestEnd keeps overhead low. Transmission group: modifiedAttributes
Designating modifiedAttributes keeps overhead low. Synchronous or asynchronous transmission
Designating asynchronous transmission keeps overhead low. Network structure
As the number of nodes in a cluster structure increases, network traffic grows. For this reason, a private network should be prepared exclusively for session-replication use.
- 31 - Copyright © 2007 Hitachi, Ltd. All Rights Reserved.
Copyright © 2007 Oracle Corporation Japan. All Rights Reserved.
12. Conclusion A significant result of this verification testing is the evidence it provides that the combination of Hitachi’s BladeSymphony platform with Oracle’s grid infrastructure provides very high system performance expandability. This evidence is also very important in terms of large-scale performance of the architecture now generally adopted in the enterprise sector, consisting of Java Web applications on a tri-layer Web structure that includes an application-server layer and a database-server layer. Although a wide range of points should be considered in regard to system performance expansion, with hardware-design issues such as network structure and storage becoming particularly important in large-scale structures, we believe the results of this testing have adequately demonstrated that Hitachi’s BladeSymphony is sufficiently applicable to large-scale systems consisting of clusters of up to eight nodes each using Oracle Application Server 10g and Oracle Real Application Clusters.
In addition, through thorough testing of the HTTP session replication feature in such large-scale structures achieved through memory-based communication between nodes, a feature that is unique to Oracle Application Server 10g, we have been able to ascertain the effectiveness of this feature and the characteristics of each replication method. This white paper summarizes best practices for using this platform in ways that maximize both performance and availability. We hope that the contents will serve users well as a set of guidelines for system design. Notes on use of this document
The contents of this white paper are based on the results of verification testing conducted at the Oracle GRID Center. Identical results may not be obtained in all environments. Results may vary with user environment and other factors.
- 32 - Copyright © 2007 Hitachi, Ltd. All Rights Reserved.
Copyright © 2007 Oracle Corporation Japan. All Rights Reserved.