Verification of mid-ocean ballast water exchange using naturally occurring coastal tracers
20
Verification of mid-ocean ballast water exchange using naturally occurring coastal tracers Kathleen Murphy a, * , Jennifer Boehme b , Paula Coble b , Jay Cullen c,1 , Paul Field c , Willard Moore d , Elgin Perry e , Robert Sherrell c , Gregory Ruiz a a Marine Invasions Research Laboratory, Smithsonian Environmental Research Center, 647 Contees Wharf Road, Edgewater, MD 21037, USA b Darling Marine Center, University of Maine, 193 Clark’s Cove Road, Walpole, ME 04573, USA c Institute of Marine and Coastal Sciences, Rutgers University, 71 Dudley Road, New Brunswick, NJ 08901, USA d Department of Geological Sciences, University of South Carolina, Columbia, SC 29208CSC, USA e Statistics Consultant, 2000 Kings Landing Rd., Huntingtown, MD 20639, USA Abstract We examined methods for verifying whether or not ships have performed mid-ocean ballast water exchange (BWE) on four commercial vessels operating in the Pacific and Atlantic Oceans. During BWE, a ship replaces the coastal water in its ballast tanks with water drawn from the open ocean, which is considered to harbor fewer organisms capable of establishing in coastal envi- ronments. We measured concentrations of several naturally occurring chemical tracers (salinity, six trace elements, colored dissolved organic matter fluorescence and radium isotopes) along ocean transects and in ballast tanks subjected to varying degrees of BWE (0– 99%). Many coastal tracers showed significant concentration changes due to BWE, and our ability to detect differences between ex- changed and unexchanged ballast tanks was greatest under multivariate analysis. An expanded dataset, which includes additional geographic regions, is now needed to test the generality of our results. Ó 2003 Elsevier Ltd. All rights reserved. Keywords: Ballast water; Biological invasions; Chemical oceanography; Optical properties; Radioisotopes; Metals; Verification 1. Introduction Successful invasions of nonindigenous species (NIS) can result in unwanted ecological, economic and human health impacts. For example, a recent study estimated the impact of NIS to exceed $100 billion dollars annu- ally in the US alone (Pimentel et al., 2000). Further- more, many analyses suggest that the rate of invasions has increased in recent years in association with human activities (Ruiz et al., 2000). In the US as elsewhere, this has caused considerable public concern and resulted in state, national, and international efforts to reduce the risk of future invasions (McConnell, 2002). In coastal marine ecosystems, ships are considered the transfer mechanism responsible for most historical and recent invasions (Hewitt et al., 1999; Ruiz et al., 2000). Species are transferred unintentionally in the ballast water and on the hulls of ships, and a portion of these organisms are able to establish upon arrival to a new port. Today, ballast water is considered to be the largest single vector whereby organisms are transported from points of origin and released variously at sub- sequent ports of call (Ruiz et al., 1997; Anonymous, 2002). In 1991, the International Maritime Organization (IMO) established voluntary guidelines aimed at mini- mizing such introductions, requesting that ships perform mid-ocean ballast water exchange (BWE). During BWE, a vessel replaces its original ballast water (taken on board while the vessel was in port or near to the coast) with water from the open ocean. Ballast exchange re- duces NIS by (1) discharging a percentage of them into * Corresponding author. E-mail address: [email protected] (K. Murphy). 1 Current address: School of Earth and Ocean Sciences, University of Victoria, P.O. Box 3055, STN Victoria, BC, Canada. 0025-326X/$ - see front matter Ó 2003 Elsevier Ltd. All rights reserved. doi:10.1016/j.marpolbul.2003.10.015 www.elsevier.com/locate/marpolbul Marine Pollution Bulletin 48 (2004) 711–730
-
Upload
kathleen-murphy -
Category
Documents
-
view
215 -
download
2
Transcript of Verification of mid-ocean ballast water exchange using naturally occurring coastal tracers

www.elsevier.com/locate/marpolbul
Marine Pollution Bulletin 48 (2004) 711–730
Verification of mid-ocean ballast water exchangeusing naturally occurring coastal tracers
Kathleen Murphy a,*, Jennifer Boehme b, Paula Coble b, Jay Cullen c,1, Paul Field c,Willard Moore d, Elgin Perry e, Robert Sherrell c, Gregory Ruiz a
a Marine Invasions Research Laboratory, Smithsonian Environmental Research Center, 647 Contees Wharf Road,
Edgewater, MD 21037, USAb Darling Marine Center, University of Maine, 193 Clark’s Cove Road, Walpole, ME 04573, USA
c Institute of Marine and Coastal Sciences, Rutgers University, 71 Dudley Road, New Brunswick, NJ 08901, USAd Department of Geological Sciences, University of South Carolina, Columbia, SC 29208CSC, USA
e Statistics Consultant, 2000 Kings Landing Rd., Huntingtown, MD 20639, USA
Abstract
We examined methods for verifying whether or not ships have performed mid-ocean ballast water exchange (BWE) on four
commercial vessels operating in the Pacific and Atlantic Oceans. During BWE, a ship replaces the coastal water in its ballast tanks
with water drawn from the open ocean, which is considered to harbor fewer organisms capable of establishing in coastal envi-
ronments. We measured concentrations of several naturally occurring chemical tracers (salinity, six trace elements, colored dissolved
organic matter fluorescence and radium isotopes) along ocean transects and in ballast tanks subjected to varying degrees of BWE (0–
99%).
Many coastal tracers showed significant concentration changes due to BWE, and our ability to detect differences between ex-
changed and unexchanged ballast tanks was greatest under multivariate analysis. An expanded dataset, which includes additional
geographic regions, is now needed to test the generality of our results.
� 2003 Elsevier Ltd. All rights reserved.
Keywords: Ballast water; Biological invasions; Chemical oceanography; Optical properties; Radioisotopes; Metals; Verification
1. Introduction
Successful invasions of nonindigenous species (NIS)
can result in unwanted ecological, economic and humanhealth impacts. For example, a recent study estimated
the impact of NIS to exceed $100 billion dollars annu-
ally in the US alone (Pimentel et al., 2000). Further-
more, many analyses suggest that the rate of invasions
has increased in recent years in association with human
activities (Ruiz et al., 2000). In the US as elsewhere, this
has caused considerable public concern and resulted in
state, national, and international efforts to reduce therisk of future invasions (McConnell, 2002).
*Corresponding author.
E-mail address: [email protected] (K. Murphy).1 Current address: School of Earth and Ocean Sciences, University
of Victoria, P.O. Box 3055, STN Victoria, BC, Canada.
0025-326X/$ - see front matter � 2003 Elsevier Ltd. All rights reserved.
doi:10.1016/j.marpolbul.2003.10.015
In coastal marine ecosystems, ships are considered
the transfer mechanism responsible for most historical
and recent invasions (Hewitt et al., 1999; Ruiz et al.,
2000). Species are transferred unintentionally in theballast water and on the hulls of ships, and a portion of
these organisms are able to establish upon arrival to a
new port. Today, ballast water is considered to be the
largest single vector whereby organisms are transported
from points of origin and released variously at sub-
sequent ports of call (Ruiz et al., 1997; Anonymous,
2002).
In 1991, the International Maritime Organization(IMO) established voluntary guidelines aimed at mini-
mizing such introductions, requesting that ships perform
mid-ocean ballast water exchange (BWE). During BWE,
a vessel replaces its original ballast water (taken on
board while the vessel was in port or near to the coast)
with water from the open ocean. Ballast exchange re-
duces NIS by (1) discharging a percentage of them into

712 K. Murphy et al. / Marine Pollution Bulletin 48 (2004) 711–730
the inhospitable environment of the open ocean, and in
some cases, (2) by increasing the salinity level within
the ballast tank to a level such that many species of
freshwater or brackish water origins cannot survive(Taylor et al., 2002).
BWE is now the primary method for reducing the risk
of species transfer by ships throughout the world. In the
US, BWE is voluntary for most vessels arriving from
beyond the exclusive economic zone (EEZ), but federal
law requires BWE for such vessels entering the Great
Lakes and the Hudson River, north of the George
Washington Bridge. Regulations have recently beenenacted in several states (California, Oregon, Washing-
ton) that require BWE for all vessels intending to dis-
charge foreign ballast in their waters. Moreover, the US
Coast Guard intends to extend mandatory regulations
for BWE to all vessels delivering foreign ballast to any
US port. Although other approved ballast water treat-
ment methods may also be used under federal and state
laws, no alternatives to BWE have been approved foruse to date (see discussion by Taylor et al., 2002).
The US Coast Guard’s current ballast water man-
agement regulations specify that BWE is to be per-
formed in water outside the 200 mile EEZ and in depths
greater than 2000 m. Ships can choose between two
types of exchange: Flow-through or empty–refill, either
of which should theoretically result in the removal of
>95% of the original ballast water. Flow through (FT)exchange involves simultaneously uploading ocean
water while allowing excess ballast water to overflow on
to the deck. Due to the mixing of ocean and port water
during this process, three tank-volumes of water (300%)
are required theoretically to remove >95% of the origi-
nal water (Hay and Tanis, 1998). Empty–refill (ER)
exchange involves emptying the ballast tank completely
of port water before uploading ocean water (100%).Since the complete (although temporary) removal of
ballast during ER exchanges may be unsafe for parti-
cular vessel types or in rough weather, some vessels elect
to perform FT in preference to ER ballast water ex-
changes.
Clearly, a reliable procedure for discriminating be-
tween complying and non-complying vessels is a pre-
requisite for monitoring compliance with voluntaryguidelines as well as enforcing mandatory BWE regu-
lations. However, there are currently no established,
quantitative tools available that reliably discriminate
between exchanged and unexchanged ballast tanks.
Overseas, the Australian Quarantine Inspection Service
assesses BWE compliance indirectly by reconciling the
ship’s logs and energy budgets, according to the
‘‘Newcastle Verification Method’’ (Alan Taylor, pers.comm.), on the basis that pump operation during BWE
should be reflected in increased energy usage. In its
favor, the method is relatively inexpensive and rapid.
However, a major disadvantage is that records of energy
budgets can be manipulated by unscrupulous operators,
and are not routinely kept on all types of ships (Murphy
et al., 2002). Furthermore, since the method audits the
attempt at BWE, rather than the outcome, it does notverify that the exchange was successful.
Direct measurement of naturally occurring tracers in
the ballast water to deduce whether the tank was bal-
lasted in a coastal or oceanic location, offers a potentially
powerful approach to BWE verification. There are two
prerequisites for this approach to succeed: first, there is a
measurable and consistent difference between tracer
levels in ballast water of coastal versus oceanic origin;and second, the implementation of BWE according to
the specified guidelines will ensure a predictable water
quality outcome. This approach is both quantitative and
flexible, since it allows us to set criteria for compliance
according to biologically meaningful objectives.
Salinity is a potential indicator of BWE since open
ocean salinities are relatively stable and well defined
(Pacific �33 ppt, Atlantic �35 ppt), whereas coastalsalinities are frequently lowered by river discharge and
terrestrial runoff. However, salinity alone is an insuffi-
cient indicator of ballast water source; whereas the
presence of low salinity water is sufficient to show that a
ballast tank was not exchanged in mid-ocean, the pres-
ence of high-salinity water does not preclude the possi-
bility that the tank contains water from a high-salinity
coastal port (e.g. the port of Los Angeles, California).We implemented research to test whether a suite of
chemical water characteristics or tracers can be used to
discriminate between exchanged and unexchanged bal-
last water, regardless of the salinity of the coastal ballast
source. Our method deduces the source of ballast water
according to the statistical departure of tracer concen-
trations in the ballast water from baseline concentrations
in the open ocean. Our justification for an ocean-refer-enced approach is that in comparison to coastal water,
the surface ocean is a relatively stable environment
within which we would expect much less temporal and
spatial variation in chemical parameters. Furthermore,
reliably identifying the coastal source of a ballast tank
can be very difficult, especially when it is a mixture
drawn from multiple ports over a long period of time.
We examined two questions with reference to sets ofone or more potential tracers.
• Do the tracers, alone or in combination, accurately
discriminate between unexchanged, partially ex-
changed and fully exchanged ballast water?
• Can the tracer(s) be used to detect a vessel which per-
formed BWE in non-compliance with a >200 mile/
>2000 m depth ballast exchange requirement? Inother words, if BWE were performed less than 200
miles from the nearest coast, how close to the coast
might it be performed, before it were possible to tell
that it did not occur in fully oceanic water?

K. Murphy et al. / Marine Pollution Bulletin 48 (2004) 711–730 713
2. Methods
2.1. Experimental design
Verification techniques were tested on four experi-
mental voyages in the North Pacific and North Atlantic
Oceans (Table 1). The first voyage, for convenience
hereafter referred to as ‘‘VSF’’, departed from the low
salinity, highly invaded San Francisco Bay (Cohen and
Carlton, 1995). Because we were specifically interested in
tracers capable of discriminating between high salinity
coastal water and high salinity ocean water, theremaining three cruises departed from high salinity
coastal ports on the US Pacific coast (Los Angeles:
‘‘VLA’’, Puget Sound: ‘‘VPS’’) and the Mediterranean
Sea (Fos Sur Mer, France: ‘‘VFos’’). For the latter three
voyages, source water salinities were close enough to full
oceanic salinities (�33 ppt in the North Eastern Pacificand �35 ppt in the Northern Atlantic) that a salinity-
Table 1
Experimental design and voyage characteristics of the four verification cruis
VSF VLA
Voyage characteristics
Departure Port San Francisco (CA) Los Angel
Destination Port Valdez (AK) Valdez (A
Date November 2000 December
Cruise length (days) 7 7
Vessel type Oil carrier Oil carrier
Cargo Oil Oil
Source salinity (ppt) 20.6–22.5 33.3
Experiment characteristics
Ballast water treatments C, ER, FT C, FT
Tanks per treatment 1 1
Occasions sampled 4 3
Sample characteristics
Depths
Surface (m) 1 <1
Deep (m) 12 11
Replication
Surface samples (N )CDOM 2 2
Trace elements 2 2
Radium 1 2
Salinity
Deep samples (N )CDOM 2 2
Trace elements 2 2
Radium
Salinity
Profile depth (m)
Salinity 0–19 0–20
Tracer characteristics
Ballast water tracers CDOM, trace elements,
radium, salinity
CDOM, tr
radium, sa
Mid-ocean tracers CDOM, trace elements,
radium, salinity
CDOM, tr
radium, sa
Ballast tanks assigned to three treatments: unexchanged control (C), empty–
based verification criterion would be unreliable, partic-
ularly in light of the wide range of ballast exchange
efficiency (75–99%) demonstrated by ‘‘complying’’ ves-
sels (Ruiz et al., in preparation; this study). On theAtlantic voyage, extremely low nutrient levels (Dugdale
and Wilkerson, 1988; Turley, 1999) and low productiv-
ity in the Mediterranean-sourced ballast water made this
cruise a particularly difficult and valuable test case for
ballast water exchange verification.
Work was implemented in two stages. The first stage
focused on experiments in the northern Pacific, and in-
volved three separate vessels that sailed parallel to thecoast of North America (Fig. 1). Participating ships
were asked to fill tanks at the port of departure, desig-
nating 1–2 tanks for ballast water exchange (FT and/or
ER) and 1 as an unexchanged control (C). Samples of
water for tracer analysis were collected from each tank
prior to and following ER exchange, prior to and fol-
lowing partial (100% and 200%) FT exchanges and at
es (VSF, VLA, VPS and VFos)
VPS VFos
es (CA) Puget Sound (WA) Fos Sur Mer (France)
K) Valdez (AK) Norfolk (VA)
2000 May 2001 June 2001
4 14
Oil carrier Bulk carrier
Oil Coal
29.2–29.7 37.2–37.6
C, ER C, ER, FT
1 4
2 4 or 5
1 1
12 4
4 2
4 2
1
2
4 2
4 2
1
2
0–3
ace elements,
linity
CDOM, trace elements,
salinity
CDOM, trace elements,
radium, salinity
ace elements,
linity
none CDOM, trace elements,
salinity
refill (ER) exchange and flow-through (FT) exchange.

Fig. 1. Vessel tracks during the three Pacific cruises (1: VSF, 2: VLA, 3:
VPS). Bold route sections indicate locations of ballast water exchange.
714 K. Murphy et al. / Marine Pollution Bulletin 48 (2004) 711–730
the completion of the voyage. For comparison, 2–6
shipside samples were collected from the ocean in the
region of ballast exchange(s). These voyages were
important to refine sampling and analysis protocols and
streamline measures for subsequent voyages.The second stage involved experiments aboard a
trans-Atlantic voyage (Fig. 2). FT exchange was per-
formed on port (P) or starboard (S) wing ballast tanks
(1S, 2P, 3S and 4P), with the opposite wing tanks (1P,
2S, 3P and 4S) left as unexchanged controls until after
the final exchange of the treatment tanks. Shortly before
arriving in the US, while still >200 miles offshore, these
control tanks were subject to a single ER exchange.Shipside samples were taken in the Mediterranean
ocean, at �200 mile intervals across the Atlantic, at �15mile intervals beginning 180 miles off the east coast of
the USA, and concluding when the ship arrived in
Norfolk.
2.2. Sample collection and analysis
Trace elements, colored dissolved organic matter
(CDOM) and radium were evaluated as verification
Fig. 2. Cruise track during VFos, showing positions of ballast water exchange
conducted at regular intervals during the voyage.
tools and are the focus of this paper (Table 2). Samples
were collected from ballast tanks and from the ambient
ocean according to methods described below. Greater
detail on sampling and analysis techniques are availablefrom Murphy et al. (2002).
All ballast water samples were collected using a
compressed air driven plastic (polypropylene) dia-
phragm pump (Wilden: Pro-Flo P.025) attached to 0.2500
plastic tubing (Cole-Parmer: Chemfluor 367) installed at
fixed depths in the tanks. Prior to each sample collec-
tion, the sampling unit was flushed with ballast water for
at least 2 min (>10 ‘‘dead volumes’’) to remove stalewater in the pump and hoses.
Samples from the ambient ocean (SS) were collected
via the ship’s fire hose (VSF, VLA) or else by tapping
the engine-cooling water pipe at its inlet end (VPS,
VFos). While it is difficult to collect uncontaminated
samples in this manner, these were the only options
available to us, given a vessel speed of 8–14 knots. Both
the fire hose and the engine-cooling pipe are suppliedwith clean ocean water from the side of the ship (intake
depth ca. 7 m). The fire hose was flushed at full pressure
for at least 30 min prior to sampling. The engine cooling
pipe was flushed for 5–60 min before samples were
collected.
Procedural blanks were taken at the conclusion of the
VFos cruise and used to estimate residual CDOM and
trace element levels in the pump and hoses, and hencethe potential for cross-contamination due to the sam-
pling apparatus. To obtain procedural blanks, deionized
(Milli-Q) water was sampled before and after flushing
through the hose and pump system.
All samples were collected by the Smithsonian Envi-
ronmental Research Center (SERC) and analyzed at
three collaborating specialist laboratories in the USA.
Trace elements were analyzed at Rutgers InorganicAnalytical Laboratory, Institute of Marine and Coastal
Sciences, Rutgers the State University of New Jersey.
CDOM samples were analyzed at the Marine Spectro-
chemistry Laboratory, Department of Marine Science,
University of South Florida. Radium samples were
analyzed in the Department of Geological Sciences of
the University of South Carolina.
. Partial exchanges of treatment tanks (� 100% FT,j 100% ER) were
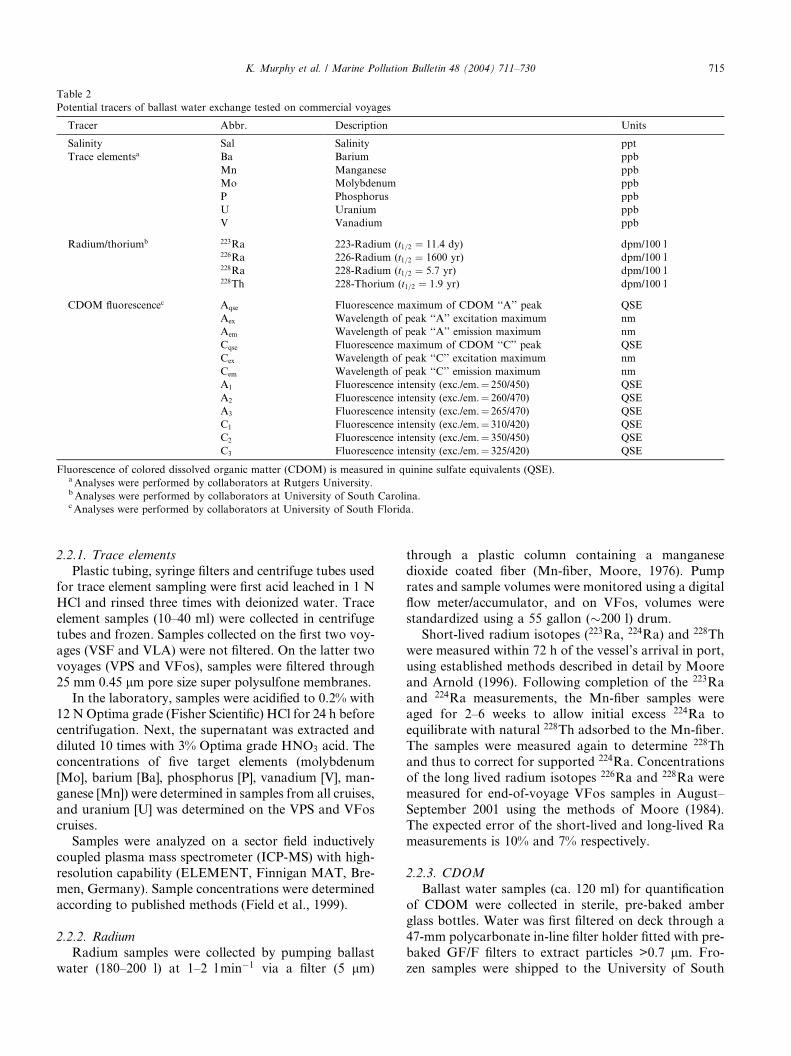
Table 2
Potential tracers of ballast water exchange tested on commercial voyages
Tracer Abbr. Description Units
Salinity Sal Salinity ppt
Trace elementsa Ba Barium ppb
Mn Manganese ppb
Mo Molybdenum ppb
P Phosphorus ppb
U Uranium ppb
V Vanadium ppb
Radium/thoriumb 223Ra 223-Radium (t1=2 ¼ 11:4 dy) dpm/100 l226Ra 226-Radium (t1=2 ¼ 1600 yr) dpm/100 l228Ra 228-Radium (t1=2 ¼ 5:7 yr) dpm/100 l228Th 228-Thorium (t1=2 ¼ 1:9 yr) dpm/100 l
CDOM fluorescencec Aqse Fluorescence maximum of CDOM ‘‘A’’ peak QSE
Aex Wavelength of peak ‘‘A’’ excitation maximum nm
Aem Wavelength of peak ‘‘A’’ emission maximum nm
Cqse Fluorescence maximum of CDOM ‘‘C’’ peak QSE
Cex Wavelength of peak ‘‘C’’ excitation maximum nm
Cem Wavelength of peak ‘‘C’’ emission maximum nm
A1 Fluorescence intensity (exc./em.¼ 250/450) QSE
A2 Fluorescence intensity (exc./em.¼ 260/470) QSE
A3 Fluorescence intensity (exc./em.¼ 265/470) QSE
C1 Fluorescence intensity (exc./em.¼ 310/420) QSE
C2 Fluorescence intensity (exc./em.¼ 350/450) QSE
C3 Fluorescence intensity (exc./em.¼ 325/420) QSE
Fluorescence of colored dissolved organic matter (CDOM) is measured in quinine sulfate equivalents (QSE).aAnalyses were performed by collaborators at Rutgers University.bAnalyses were performed by collaborators at University of South Carolina.c Analyses were performed by collaborators at University of South Florida.
K. Murphy et al. / Marine Pollution Bulletin 48 (2004) 711–730 715
2.2.1. Trace elements
Plastic tubing, syringe filters and centrifuge tubes usedfor trace element sampling were first acid leached in 1 N
HCl and rinsed three times with deionized water. Trace
element samples (10–40 ml) were collected in centrifuge
tubes and frozen. Samples collected on the first two voy-
ages (VSF and VLA) were not filtered. On the latter two
voyages (VPS and VFos), samples were filtered through
25 mm 0.45 lm pore size super polysulfone membranes.
In the laboratory, samples were acidified to 0.2% with12 NOptima grade (Fisher Scientific) HCl for 24 h before
centrifugation. Next, the supernatant was extracted and
diluted 10 times with 3% Optima grade HNO3 acid. The
concentrations of five target elements (molybdenum
[Mo], barium [Ba], phosphorus [P], vanadium [V], man-
ganese [Mn]) were determined in samples from all cruises,
and uranium [U] was determined on the VPS and VFos
cruises.Samples were analyzed on a sector field inductively
coupled plasma mass spectrometer (ICP-MS) with high-
resolution capability (ELEMENT, Finnigan MAT, Bre-
men, Germany). Sample concentrations were determined
according to published methods (Field et al., 1999).
2.2.2. Radium
Radium samples were collected by pumping ballastwater (180–200 l) at 1–2 lmin�1 via a filter (5 lm)
through a plastic column containing a manganese
dioxide coated fiber (Mn-fiber, Moore, 1976). Pumprates and sample volumes were monitored using a digital
flow meter/accumulator, and on VFos, volumes were
standardized using a 55 gallon (�200 l) drum.Short-lived radium isotopes (223Ra, 224Ra) and 228Th
were measured within 72 h of the vessel’s arrival in port,
using established methods described in detail by Moore
and Arnold (1996). Following completion of the 223Ra
and 224Ra measurements, the Mn-fiber samples wereaged for 2–6 weeks to allow initial excess 224Ra to
equilibrate with natural 228Th adsorbed to the Mn-fiber.
The samples were measured again to determine 228Th
and thus to correct for supported 224Ra. Concentrations
of the long lived radium isotopes 226Ra and 228Ra were
measured for end-of-voyage VFos samples in August–
September 2001 using the methods of Moore (1984).
The expected error of the short-lived and long-lived Rameasurements is 10% and 7% respectively.
2.2.3. CDOM
Ballast water samples (ca. 120 ml) for quantification
of CDOM were collected in sterile, pre-baked amber
glass bottles. Water was first filtered on deck through a
47-mm polycarbonate in-line filter holder fitted with pre-
baked GF/F filters to extract particles >0.7 lm. Fro-zen samples were shipped to the University of South
716 K. Murphy et al. / Marine Pollution Bulletin 48 (2004) 711–730
Florida, where CDOM fluorescence and absorbance was
determined by emission-excitation matrix spectrometry
(EEMs).
Samples were analyzed between January and October2001. Excitation emission matrices (EEMs) were gener-
ated across excitation wavelengths of 220–455 nm and
emission wavelengths of 250–710 nm. Readings were
corrected for instrument variability and normalized to
the standard quinine sulfate dihydrate (presented in
quinine sulfate equivalents (QSE)). Further details of
methodologies, peak designation and significance are
available in published references (Coble, 1996; Cobleet al., 1998).
2.2.4. Univariate statistical model
A simple univariate statistical model was used to as-
sess the performance of individual tracers in each tank
on each cruise. Given a single variate Y1, we wish toknow whether it differs from a reference ocean set with
mean l0. If we know that the variance of the ocean set isr, and if the variable is distributed normally, the test is
ðY1 � l0Þ=r
where null hypothesis: Ho¼No difference between
ballast water sample and open ocean samples, degrees
of freedom: df ¼ number of ocean observations)1(2-tailed).
Because a multivariate analysis of variance (MA-
NOVA) test indicated the two oceans were significantly
different (p < 0:001), all ballast samples from the Pacific
voyages were tested against reference set composed ofPacific Ocean samples, while the Mediterranean/Atlantic
samples were tested against an Atlantic Ocean reference
set. While we examined normality, this was inconclusive
because of the small sample size (N 6 15 for the Atlantic,
N 6 10 for the Pacific). However, we believe that further
sampling will demonstrate that most or all of the tracers
targeted in this study behave in a conservative manner
and are normally distributed in the surface open ocean.For tanks containing untreated port water (i.e. 0%
BWE), successful tracers are considered those that ex-
hibit a highly significant result (p < 0:01). Non-signifi-cant results represent Type II errors, in other words,
acceptance of the false null hypothesis of no difference
between open ocean water and unexchanged ballast
water. Conversely, where a tank underwent a complete
exchange (i.e. 300% FT exchange or 100% ER ex-change), successful tracers show a smaller departure
from the ocean reference. When tanks are partially ex-
changed, sensitive tracers should exhibit values inter-
mediate between the results for the untreated and fully
exchanged ballast tanks. In other words, as progres-
sively more ocean water is added to a tank, samples
from the tank should appear progressively less different
from the ocean.
2.2.5. Multivariate statistical model
We compared a vector of discriminating tracers in a
ballast tank with the multivariate distribution of the
same tracers in the open ocean using the Mahalanobisdistance statistic (Johnson and Wichern, 1982). For any
individual sample (whether from a ship’s ballast tank or
from the ambient water along its journey), we can esti-
mate the likelihood that the vector of tracer concentra-
tions falls within the usual range of ocean water. If the
likelihood is small, it is inferred that the ballast tank
contents were not derived from ocean water.
The square of the Mahalanobis distance statistic, Dm,is computed as
ðxi � xÞ0S�1ðxi � xÞ
where xi is a column vector of tracers that are being
tested, x is the column vector of the mean level of tracers
in ocean water, and S�1 is the inverse of the variance-
covariance matrix for the tracers in ocean water.
This multivariate test has the potential to be much
more powerful than a sequence of univariate tests when
the tracers are correlated. However, the opposite can
also be true if some tracers are not informative aboutdifferentiating ocean water from coastal water.
We ran Mahalanobis tests using salinity, trace ele-
ment and CDOM samples collected from (1) the ballast
tanks, and (2) shipside during the Pacific and Atlantic
cruises. First, we developed an ‘‘ocean reference set’’
each for the Pacific and Atlantic oceans, comprising of
all shipside samples collected outside the 200 mile EEZ
and in depths greater than 2000 m. In the first test, wecalculated Dm and its associated Chi-squared probabil-ity for each ballast tank during each sampling occasion,
using average tracer concentrations derived from all
replicate samples. In the second test performed for the
Atlantic ocean only, we calculated Dm and its associatedChi-squared probability for shipside samples collected
within the EEZ, to examine the effect upon Dm of the
proximity of land. Clearly, the two tests relate to dif-ferent questions regarding BWE compliance: first,
whether it is possible to tell if (and to what degree) a
ballast tank has been exchanged in mid-ocean, and
second, where in the ocean BWE was performed.
As a preliminary effort to identify the strongest per-
forming tracers, we examined the performance of all
possible combinations of 2–5 tracers in end-of-voyage
samples. We defined the ‘‘best average set’’ as thecombination of tracers which maximized the average
discrimination factor, DFav, in end-of-voyage samples,
where
DFav ¼ 1=½averageðDm;exchanged=Dm;controlÞ
Since the minimum discriminatory ability of a tracer set
is arguably as important as its average ability, we de-
fined the ‘‘best minimum set’’ as the combination of

Degree of ballast water exchange in treatment (FT) tanks0% 100% 200% 300%
Ba [p
pb] +
/- 1
SD
6
7
8
9
10
11
12
13
14
Fig. 3. Barium concentrations in four pairs of ballast tanks on VFos
K. Murphy et al. / Marine Pollution Bulletin 48 (2004) 711–730 717
tracers with the highest minimum discrimination factor,
DFmin, in end-of-voyage samples, where
DFmin ¼ 1=½maxðDm;exchanged=Dm;controlÞWhile simplistic, comparisons of average and minimum
performance are a useful way to identify tracer sets that
perform consistently well across multiple treatments,
tanks and voyages. Since we expect that it will be sim-pler and cheaper to perform verification using tracers
derived from a single analytical method, we performed
tests separately for combinations drawn from three
tracer pools: (1) salinity + trace elements, (2) salin-
ity +CDOM and (3) salinity + trace elements +CDOM.
Radium was not included in Mahalanobis analyses
since too few radium samples were collected from the
mid-ocean to constitute a reliable ocean reference set(Table 1).
decreased following successive partial ballast water exchanges of the
treatment tanks (FT: (1) ––––; (2) ––O––; (3) ––�––; (4) ––r––), andremained high in the unexchanged controls (C: (1) ––�––; (2) ––.––;(3) ––j––; (4) ––r––).
3. Results3.1. Overview
Most of the tracers we evaluated (see Table 2) dem-onstrated potential to detect ballast water exchange on
one or more voyages. In general, levels of trace elements,
CDOM fluorescence and radium decreased as a result of
exchange with ocean water. For many tracers, including
Ba, significant decreases in concentration were apparent
even after partial ballast water exchanges (Fig. 3). For
the majority of tracers and cruises, concentrations
changed significantly between initial and final samplingin exchanged tanks, but not in control tanks (Figs. 4 and
5). These results are interpreted as a simple dilution ef-
fect of the original ballast water containing terrigenous
tracers with offshore water.
ANOVAs on the effect of within-tank sampling depth
and location on tracer levels showed that in the vast
majority of cases (94% of 549 independent comparisons
of tracer levels by ship, time and tank), data from alldepths and locations demonstrated good agreement,
allowing whole tank concentrations to be estimated
from data pooled by depth and location. An examina-
tion of the components of variance for the VFos dataset
confirmed that within-tank sampling location contrib-
uted less than 0.1% of overall variance for most tracers.
Tracer levels in samples drawn from the ships’ side
during ballast water exchange corresponded well withlevels measured in fully exchanged ballast tanks. In a
transect of 54 shipside samples taken across the North
Atlantic, trace element concentrations and CDOM peak
intensities tended to decrease from coastal maxima to
oceanic minima (Fig. 6). This trend was considerably
more marked in the western Atlantic than in the Med-
iterranean Sea or on the European continental shelf,
illustrating the relative difficulty in determining the
coastal versus oceanic nature of ballast water samples
sourced from Mediterranean ports.
In procedural blank samples from the VFos cruise,trace element levels were less than 0.5 ppb. For Ba, U, V
and Mo, maximum levels in procedural blanks repre-
sented less than 5% of the minimum tracer levels mea-
sured in ballast water samples, compared to 25% for
Mn. Concentrations of P were higher overall and more
variable; in several cases blank concentrations were
comparable to ocean water minima (�1.5 ppb). CDOMpeak fluorescence intensities in blank samples weresimilarly variable; in blanks collected from Tank 1 and
Tank 3, intensities were 50–100% of the levels measured
in fully exchanged ballast water, whereas for the
remaining tanks, CDOM intensities were usually less
than 20% of levels measured in exchanged ballast water.
Trends for individual tracers and voyages are pre-
sented in detail in the relevant subsections below, fol-
lowed by the results of univariate and multivariatestatistical analysis.
3.1.1. Trace elements
Concentrations of the trace elements in unexchanged
(control) tanks were either stable (Ba, Mo, U, V) or
fluctuated (Mn, P) over time. In exchanged tanks, con-
centrations were initially similar to controls, but usually
decreased following mid-ocean exchange to levelsapproaching concentrations in the open ocean (Fig. 4).
Mo, U and V tended to increase or decrease in concert
with salinity. Levels of trace elements in tanks contain-
ing eutrophic, low salinity San Francisco Bay water
(VSF) were 2–6 times higher than on other voyages, a
result which facilitated discrimination between ex-
changed and unexchanged tanks. Conversely, ballast

C ER
Ba
Mn
P
Mo
V
VLA
e0
e1
e2
e3
e4
e-1e0e1e2e3e4
e0e1e2e3e4e5
e0
e1
e2
e3
e0
e1
e2
VSF VPS VFos
[ppb]
223Ra
C FTC ER FT0.00.30.60.91.21.5
C FT ER
[ppb]
[ppb]
[ppb]
[ppb]
[dpm / 100 l]
N = 4N = 4 N = 8 N = 16
N = 4N = 4 N = 8 N = 16
N = 2N = 1
N = 0
N = 8
N = 4N = 4 N = 8 N = 16
N = 4N = 4 N = 8 N = 16
N = 4N = 4 N = 8 N = 16
U[ppb]
N = 8 N = 16
10-3
10-2
10-1
100
N = 0N = 0
(7) (6)(2)
(2)
(2)
(2)
(15)
(6)
(6)
(2)(3)(3)
(3)(3)
(3)(3)
(3)(3)
(3)(3)
(15)
(15)
(15)
(15)
(15)
(7)
(6)
(7)
(7)
(7)
(7)
(7)
(7)
(3) (4)
(7)
(7)
(7)
(7)
(7)
Fig. 4. Concentrations of trace elements (mean±SE) and 223Ra in ships’ ballast tanks on the Pacific and Atlantic cruises. Bars represent concen-
trations before (j) and following ( ) complete exchange of the flow-through (FT) and/or empty–refill (ER) tanks. Control tanks (C) remained
unexchanged throughout. Shipside sample means coinciding with the position of ballast water exchange are indicated by horizontal lines. Where
sample size (N ) deviates from numbers indicated at the top right of each graph, these are specified in parentheses.
718 K. Murphy et al. / Marine Pollution Bulletin 48 (2004) 711–730
water from the Mediterranean Sea was relatively oligo-
trophic and demonstrated subtle changes in tracer levels
due to BWE.
Within ballast tanks, trace element data from all
depths and locations routinely demonstrated good
agreement, indicating reliability of the complete proce-
dure and allowing accurate estimations of whole tankconcentrations. Occasional exceptions to this rule usu-
ally involved the elements Mn and P, and were often
associated with high levels of Fe, Zn and other reactive
metals that were not considered viable tracers in this
study (Murphy et al., 2002).
Concentrations of Ba, Mo, U and V in shipside
samples were comparable to published ranges for sur-
face northeast Pacific and North Atlantic Ocean samples
(Bernat et al., 1972; Chan et al., 1976, 1977; Chen et al.,
1986; Collier, 1984; Morris, 1975; Nozaki et al., 2001;Shaw et al., 1998; Sohrin et al., 1987). Mn levels gen-
erally exceeded published ranges by a factor of 3–10
(Bruland and Franks, 1983; Landing and Bruland, 1980;

C ER FT
C ERC ER FT
[QSE
]
400410420430440450
[QSE
]
e0
e1
e2
e3
A 1 [250/450]
A 2[260/470]
VLA
[QSE
]
e0
e1
e2
e3
[QSE
]
e0
e1
e2
e3
VSF VPS VFos
C ER FT
[QSE
]
e0
e1
e2
e3
C FT C ER FT
N = 4 N = 4 N = 7 N = 16
N = 4 N = 4 N = 7 N = 16
N = 4 N = 4
N = 4 N = 4 N = 7 N = 16
N = 7
C ER
A3[265/470]
C3[325/420]
[ppt
]
152025303540 N > 20 N > 20 N = 2 N > 20Salinity
(15)
(15)
(15)
(15)
(3)
(3)
(3)
(3)
(3)
(3)
(3)
(3)
(3)
(3)(3)(2)(3)
(3)
(2)(3)
(2)(3)
(2)(3)
(8)
(8)
(8)
(8)(2)
(2)
(2)
(2)
(4) (5)
(15)
(3)
(3)
(3)
(3)
(15)
(15)
(15)
(15)
C FT C ER FT
N = 4 N = 4 N = 7Aem
(15)
(3)
(3)(3)
(2)(3)(8)
(2)
(3)
(15)
C ER FT
[QSE
]
e0
e1
e2
e3
C FT
N = 4 N = 4 N = 7
C ER
Aqse
(15)(3)
(3) (3)(2)(3) (8)(2) (3) (15)
N = 16
N = 16
N = 16
Fig. 5. CDOM concentrations (mean±SE) in ballast water samples during four commercial voyages. Bars represent concentrations before (j) and
after ( ) complete exchange of the flow-through (FT) or empty–refill (ER) tanks. Control tanks (C) remained unexchanged throughout. Shipside
sample means coinciding with the position of ballast water exchange are indicated by horizontal lines. Where sample sizes (N ) deviate from numbers
indicated at the top right of each graph, these are specified in parentheses.
K. Murphy et al. / Marine Pollution Bulletin 48 (2004) 711–730 719
Martin et al., 1985; Statham et al., 1998), while levels of
P exceeded expected levels in unfiltered (Pacific) samplesbut were consistent with published data for (filtered)
Atlantic and Mediterranean samples (Karl and
Bj€orkman, 2002, and references therein).
Across all four voyages, Ba concentrations ranged
from 10 to 30 ppb in unexchanged ballast tanks, butwere consistently lower than 7 ppb in fully exchanged
tanks. Mn concentrations were 5–55 ppb in unex-
changed tanks and 0.4–7 ppb in exchanged tanks. Initial

0 5 10 15 20 25 30 35 40 45 50-8
-6
-4
-2
0
Con
cent
ratio
n [p
pb]
20
30
40
05
1015202530
Con
cent
ratio
n [p
pb]
0
1
2
3
4
5
Fluo
resc
ence
[QSE
]
0
5
10
15
20
25
Wat
er d
epth
[km
]
Station Number
A1A2
C3A3
U
V
Aqse
P
Ba
Mn
Mo
Salinity Salinity [ppt]
200 mi
Fig. 6. Salinity, trace element concentration (Ba, Mo, Mn, P, U,V) and CDOM fluorescence intensities (A1, A2, A3, C3) in ship side samples from the
North Atlantic on VFos. The boundary of the ‘‘open ocean’’ (>200 miles offshore, >2000 m deep) enclosing ocean reference data is indicated by
vertical lines (– – –), also, 100 miles offshore boundaries (� � �). Sea floor bathymetry (Smith and Sandwell, 1997) is plotted for comparison.
720 K. Murphy et al. / Marine Pollution Bulletin 48 (2004) 711–730
phosphorus levels were an order of magnitude lower on
VFos [�6 ppb] than on the other voyages [38–140 ppb]but decreased in all exchanged tanks on all voyages.
Initial levels of V ranged from 1.5 to 5 ppb, and de-
creased significantly after BWE except on VFos. Levelsof Mo were 7–14 ppb on all voyages and varied little as a
result of exchange except during VSF, where they in-
creased by approximately 30%. Concentrations of U
were comparable in exchanged and unexchanged ballast
tanks on both voyages for which this tracer was mea-
sured (VFos, VPS), although concentrations were lower
overall in the Pacific samples (�3.0 ppb) than in theAtlantic samples (�3.5 ppb). Since Mo and U are con-servative with salinity, these results indicate that the Ba,
Mn, P and V concentrations were more sensitive indi-
cators than salinity on all voyages.
On the VFos voyage, tracers were measured in rep-
licate ballast tanks. Across all samples of unexchanged
ballast water collected on this cruise (N ¼ 46), the
coefficients of variation (CVs) were less than 6.5% for U
and V, and less than 4.5% for Ba and Mo. In contrast,the CVs for Mn and P were 45% and 26% respectively.
This variability occurred almost entirely at the level of
the tank, thus it reflected real differences between ballast
tanks.
Trace element concentrations at each of 54 ocean
stations sampled sequentially during the voyage from
France to the USA showed slight to moderate offshore
gradients (Fig. 6). Concentrations of Mo, U, and V inMediterranean samples were barely distinguishable
from those in samples collected from 200 miles offshore.
Ba levels exhibited a gradual decline from around 10
Emission Wavelength [nm]
300 350 400 450 500 550 600 650 700
Exci
tatio
n W
avel
engt
h [n
m]
250
300
350
400
450
0 5 10 15 20
A
C
p1
Rhp2
Fluorescence [QSE]
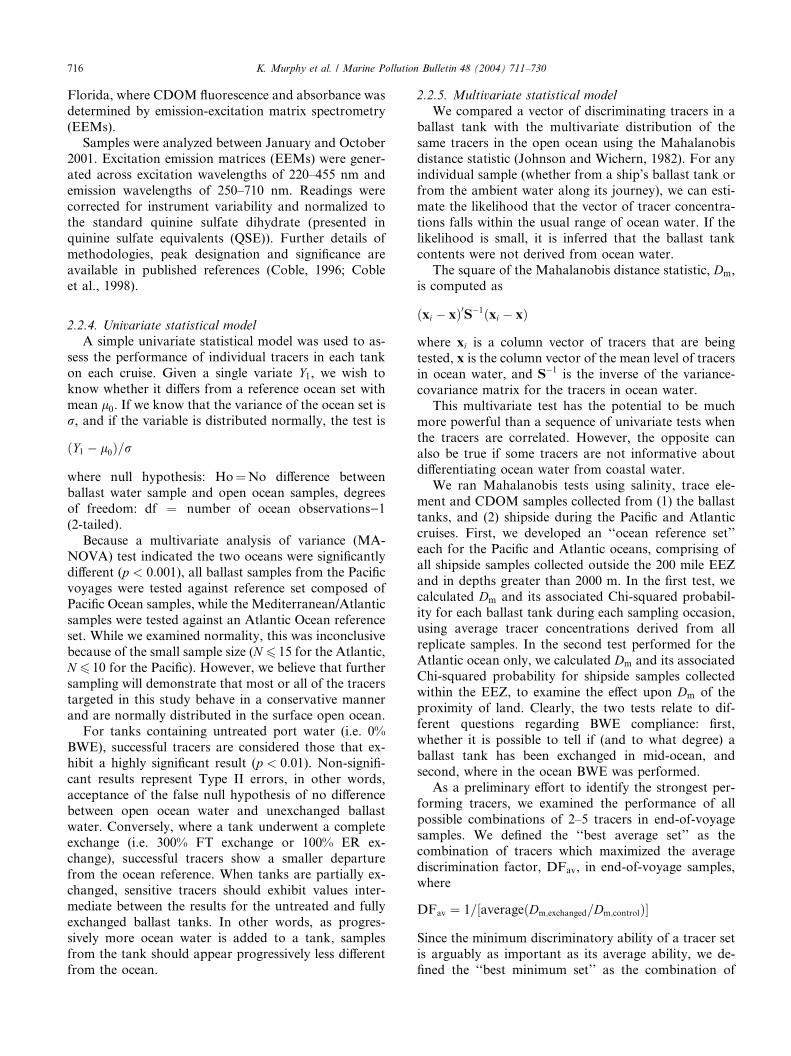
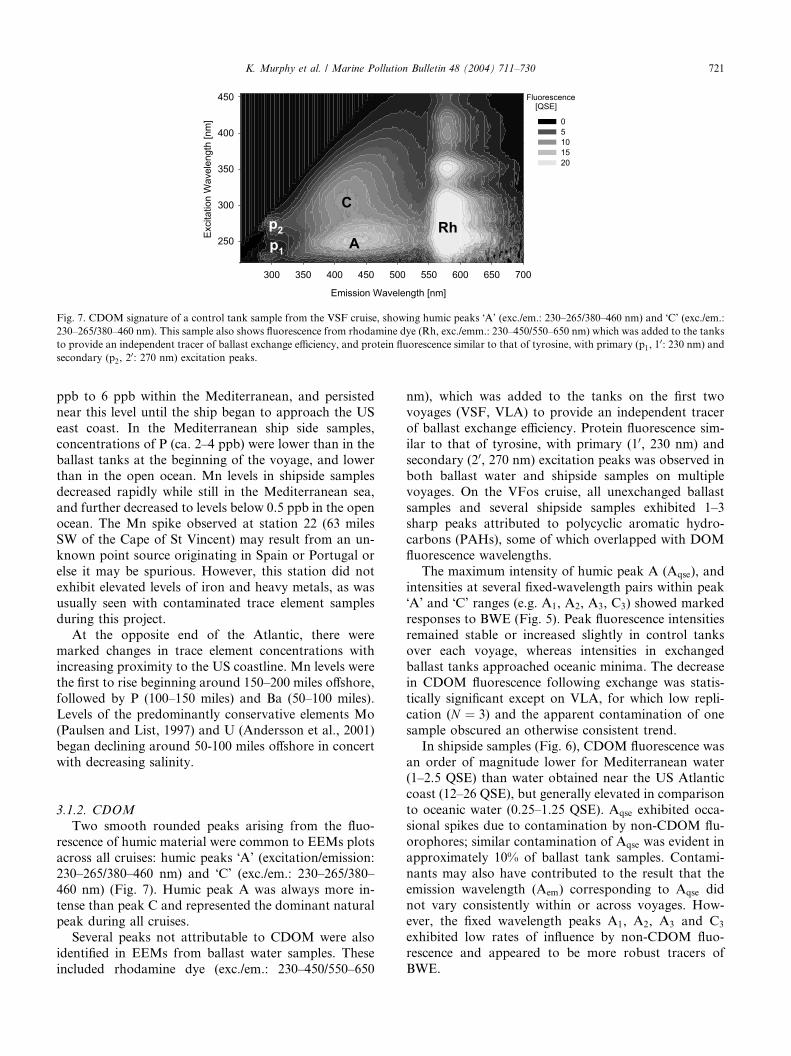
Fig. 7. CDOM signature of a control tank sample from the VSF cruise, showing humic peaks �A’ (exc./em.: 230–265/380–460 nm) and �C’ (exc./em.:230–265/380–460 nm). This sample also shows fluorescence from rhodamine dye (Rh, exc./emm.: 230–450/550–650 nm) which was added to the tanks
to provide an independent tracer of ballast exchange efficiency, and protein fluorescence similar to that of tyrosine, with primary (p1, 10: 230 nm) and
secondary (p2, 20: 270 nm) excitation peaks.
K. Murphy et al. / Marine Pollution Bulletin 48 (2004) 711–730 721
ppb to 6 ppb within the Mediterranean, and persisted
near this level until the ship began to approach the US
east coast. In the Mediterranean ship side samples,
concentrations of P (ca. 2–4 ppb) were lower than in the
ballast tanks at the beginning of the voyage, and lower
than in the open ocean. Mn levels in shipside samples
decreased rapidly while still in the Mediterranean sea,
and further decreased to levels below 0.5 ppb in the openocean. The Mn spike observed at station 22 (63 miles
SW of the Cape of St Vincent) may result from an un-
known point source originating in Spain or Portugal or
else it may be spurious. However, this station did not
exhibit elevated levels of iron and heavy metals, as was
usually seen with contaminated trace element samples
during this project.
At the opposite end of the Atlantic, there weremarked changes in trace element concentrations with
increasing proximity to the US coastline. Mn levels were
the first to rise beginning around 150–200 miles offshore,
followed by P (100–150 miles) and Ba (50–100 miles).
Levels of the predominantly conservative elements Mo
(Paulsen and List, 1997) and U (Andersson et al., 2001)
began declining around 50-100 miles offshore in concert
with decreasing salinity.
3.1.2. CDOM
Two smooth rounded peaks arising from the fluo-
rescence of humic material were common to EEMs plots
across all cruises: humic peaks �A’ (excitation/emission:230–265/380–460 nm) and �C’ (exc./em.: 230–265/380–460 nm) (Fig. 7). Humic peak A was always more in-
tense than peak C and represented the dominant naturalpeak during all cruises.
Several peaks not attributable to CDOM were also
identified in EEMs from ballast water samples. These
included rhodamine dye (exc./em.: 230–450/550–650
nm), which was added to the tanks on the first two
voyages (VSF, VLA) to provide an independent tracer
of ballast exchange efficiency. Protein fluorescence sim-
ilar to that of tyrosine, with primary (10, 230 nm) andsecondary (20, 270 nm) excitation peaks was observed inboth ballast water and shipside samples on multiple
voyages. On the VFos cruise, all unexchanged ballast
samples and several shipside samples exhibited 1–3sharp peaks attributed to polycyclic aromatic hydro-
carbons (PAHs), some of which overlapped with DOM
fluorescence wavelengths.
The maximum intensity of humic peak A (Aqse), and
intensities at several fixed-wavelength pairs within peak
�A’ and �C’ ranges (e.g. A1, A2, A3, C3) showed markedresponses to BWE (Fig. 5). Peak fluorescence intensities
remained stable or increased slightly in control tanksover each voyage, whereas intensities in exchanged
ballast tanks approached oceanic minima. The decrease
in CDOM fluorescence following exchange was statis-
tically significant except on VLA, for which low repli-
cation (N ¼ 3) and the apparent contamination of one
sample obscured an otherwise consistent trend.
In shipside samples (Fig. 6), CDOM fluorescence was
an order of magnitude lower for Mediterranean water(1–2.5 QSE) than water obtained near the US Atlantic
coast (12–26 QSE), but generally elevated in comparison
to oceanic water (0.25–1.25 QSE). Aqse exhibited occa-
sional spikes due to contamination by non-CDOM flu-
orophores; similar contamination of Aqse was evident in
approximately 10% of ballast tank samples. Contami-
nants may also have contributed to the result that the
emission wavelength (Aem) corresponding to Aqse didnot vary consistently within or across voyages. How-
ever, the fixed wavelength peaks A1, A2, A3 and C3exhibited low rates of influence by non-CDOM fluo-
rescence and appeared to be more robust tracers of
BWE.

722 K. Murphy et al. / Marine Pollution Bulletin 48 (2004) 711–730
3.1.3. Radium
Short-lived radium isotopes 223Ra and 224Ra were
recovered in measurable levels from the Mn-fibers on all
three voyages where radium samples were collected (i.e.VSF, VLA and Vfos). We present here only the data for223Ra. The very low final activity of 224Ra on VFos (5–
6% of the source concentration) and the presence of its
parent, 228Th, rendered it an unreliable tracer on this
voyage; moreover its short half life (3.7 days) would
prevent it from being used as a tracer for all voyages
longer than �1 week.Levels of 223Ra in control tanks decreased on VLA
(�30%), increased on VFos (�50%) and remained un-changed on VSF (Fig. 4). Only one ocean sample con-
tained appreciable quantities of 223Ra. This is consistent
with expectation; since the parent of 223Ra, 227Ac, is
exceedingly low in open ocean water (Nozaki et al.,
1990; Shaw et al., 1998), 223Ra is presumed to be vir-
tually zero in both the Atlantic and the Pacific.
Levels of the long lived radium isotopes 226Ra and228Ra were measured in VFos end-of-voyage samples.
After the final exchange of the treatment tanks on this
voyage, levels of both isotopes were significantly lower
in the exchanged tanks than in the control tanks, as
were 223Ra/226Ra and 228Ra/226Ra activity ratios (AR)
(Table 3). Concentrations of 226Ra in exchanged tanks
were similar to levels reported previously in surface
ocean water (Chung and Craig, 1980; Broecker et al.,1976).
On VLA, the decrease in control tanks of 223Ra is
considered an artifact of low replication and sampling
difficulties experienced during this voyage. Conversely,
the significant increase over time of 223Ra in the VFos
control tanks and its finite concentration in the ex-
changed tanks following complete mid-ocean exchange
indicates the presence of a 223Ra source within thetanks. A likely source on this voyage was coal, which
was transported by this vessel and was undoubtedly
present in the water of the source port. Since coal is
normally rich in uranium and 223Ra is produced in the
decay chain of 235U, coal dust in the ballast tanks could
have produced 223Ra over the course of the two week
voyage.
Table 3
Radium and thorium isotope concentrations and activity ratios in
unexchanged (control) versus fully exchanged (300% FT or 100% ER)
ballast water on the VFos cruise (N ¼ 8)
Isotope Control x� SE Exchanged x� SE226Ra 10.13± 0.33 6.50± 0.15228Ra 4.70± 0.16 2.19± 0.09223Ra 1.02± 0.03 0.08± 0.02
228/226 AR 0.46± 0.02 0.34± 0.01
223/226 AR 0.10± 0.01 0.01± 0.00228Th 0.32± 0.03 0.30± 0.01
3.2. Univariate analyses
We examined the abilities of trace element and
CDOM tracers to independently discriminate betweenocean water and ballast tanks subject to different de-
grees of BWE. Each combination of ‘‘ship’’, ‘‘treat-
ment’’, ‘‘% BWE’’ and ‘‘tracer’’ was considered a single
test case (Tables 4 and 5). Where the average amount of
a tracer was significantly different from background
ocean levels, this event was tallied next to the corre-
sponding probability statistic (either p < 0:05, p < 0:01or p < 0:001). Where the tank concentration was notsignificantly different to the ocean set, this event was
tallied next to the abbreviation ‘‘nsd’’.
3.2.1. Pacific cruises
For the majority of tracers, the ability to discriminate
between untreated tank samples and oceanic (shipside)
samples varied between cruises, although Ba and 223Ra
consistently identified unexchanged ballast water acrossall Pacific cruises. For the VSF cruise samples, salinity,
Ba, Mn, Mo, P, V, 223Ra, 228Th and Aqse, each suc-
cessfully discriminated untreated port water from ocean
water. For the VLA cruise, Ba, Ra, Mn and V and Th
were significantly different in the flow-through tank
prior to exchange, while on VPS, salinity, Ba, Mn, Mo
and P were significantly different in the empty–refill tank
prior to exchange. With the occasional exception of Aqseand Cem, none of the CDOM parameters independently
identified unexchanged tanks on any voyage.
While all FT and ER ballast tanks were eventually
exchanged according to IMO guidelines (i.e. 300% FT
or 100% ER), our rhodamine dye measurements on
VLA and VSF indicated that three FT exchanges were
respectively 75% and 93% efficient at replacing the
coastal water in the ballast tanks (Murphy et al., 2002).Salinity, Ba, P, V and Cem levels were significantly ele-
vated following two FT exchanges on VSF. Conversely,223Ra was the only tracer to show significant differences
following two FT exchanges on VLA.
Ba showed a consistently high level of discrimination
between tanks subject to different degrees of exchange.
This was demonstrated clearly by the FT tank on VSF,
for which the probability statistic increased fromp < 0:001 to p < 0:01 to p < 0:05 after three successiveFT exchanges. After the final exchange, Ba was still
present in significantly higher than ocean levels, even
though only 7% San Francisco Bay water remained in
this tank. This indicates that Ba was a highly sensitive
coastal tracer on this voyage.
3.2.2. Atlantic cruise
The sampling of eight ballast tanks on the Atlantic
cruise (VFos) afforded comparisons between replicate
tanks subject to similar levels of exchange (Table 5).
Overall results reflected the trends seen in the Pacific

Table 4
Univariate comparison of ballast water samples (C, FT, ER) on the Pacific voyages
Cruise Treat Time % BWE p Sal Ba Mn Mo P V Aqse Cqse Aem Cem A1 A2 A3 C3223Ra 228Th
VSF C T0–T3 0 0.001 4 4 4 4 4 3 1
0.01 4 1 2
0.05 4 1 4 4 4 1 1
nsd 4 4 3 3
ER T0 0 0.001 1 1 1 1 1 1 1
0.01 1
0.05 1 1 1 1
nsd 1 1 1 1
T1 98 nsd 1 1 1 1 1 1 1 1 1 1 1 1 1 1 1 1
FT T0 0 0.001 1 1 1 1 1 1 1 1
0.05 1 1 1 1 1
nsd 1 1 1
T1 55 Undet. 1 1 1 1 1 1 1 1
0.001 1
0.01 1 1 1 1 1 1 1
T2 83 0.01 1
0.05 1 1 1 1
nsd 1 1 1 1 1 1 1 1 1 1 1
T3 93 0.05 1
nsd 1 1 1 1 1 1 1 1 1 1 1 1 1 1 1
VLA C T0–T2 0 0.001 3
0.01 3 1 1 3
0.05 2 2 2
nsd 3 3 1 3 3 3 3 3 3 3 3
FT T0 0 0.001 1
0.01 1
0.05 1 1 1
nsd 1 1 1 1 1 1 1 1 1 1 1
T1 60 0.05 1
nsd 1 1 1 1 1 1 1 1 1 1 1 1 1 1 1
T2 75 nsd 1 1 1 1 1 1 1 1 1 1 1 1 1 1 1 1
VPS C T0–T1 0 Undet. 2 2
0.01 1 2 1 2
0.05 1 1
nsd 2 2 2 2 2 2 2 2 2 2
ER T0 0 Undet. 1 1
0.01 1 1 1
0.05 1 1
nsd 1 1 1 1 1 1 1 1 1
T1 98 Undet. 1 1
0.01 1
0.05 1
nsd 1 1 1 1 1 1 1 1 1 1 1 1
Numbers in table are a tally of tanks for which average tracer levels are significantly different to ocean levels at specified probability levels (p < 0:05, 0.01, 0.001), not significantly different (nsd) or
undetermined (undet.). Results for exchanged tanks (FT, ER) are separated according to levels of BWE (n ¼ 1) while results for unexchanged tanks (C, 0% BWE) are summarized over entire cruises
(nP 2).
K.Murphyetal./MarinePollutionBulletin
48(2004)711–730
723

Table 5
Univariate comparison of ballast water samples (C, FT, ER) on the Atlantic voyage
Ship Treat Time % BWE p Sal Ba Mn Mo P U V Aem Aqse A1 A2 A3 C3
VFos C T0–T3 0 0.001 16 16 16 15 1 16 16 16 16
0.01 1 11
0.05 4
nsd 16 16 16 16
ER T4 >95 0.001 4 1
0.01 1 1 3 3 1
0.05 3 1 1 3
nsd 4 4 2 4 4 4 4 4
FT T0 0 0.001 4 4 4 2 1 4 4 4 4
0.01 1
0.05 2
nsd 4 1 4 4 4 1
T1 �50(35–60)
0.001 2 4 4 3 1 4 4 4 3
0.01 1 1
0.05 1 1
nsd 4 1 4 4 4 2
T2 �75(65–87)
0.001 2 3 1 4 4 4 1
0.01 3 1 1 1 2
0.05 1 2 1
nsd 4 4 4 4 4
T3 >95 0.001 4
0.01 2 1
0.05 2 1 3 1
nsd 4 4 4 4 4 4 4 4 2 1 3 4
Numbers in table are a tally of tanks for which tracer levels are significantly different to ocean at specified probability levels (p < 0:05, 0.01, 0.001) or
not significantly different (nsd). Results for exchanged tanks (FT, ER) are separated according to levels of BWE (4 tanks per treatment) while results
for unexchanged tanks (C, 0% BWE) are summarized over the entire cruise (4 tanks· 4 times).
724 K. Murphy et al. / Marine Pollution Bulletin 48 (2004) 711–730
cruises, while the magnitude of between-tank variation
ranged from small to substantial depending on the tra-
cer. Concentrations of P were quite variable among
tanks subject to equivalent treatments, with the result
that associated statistical probabilities ranged from sig-
Salinity measurement
coastal water collect sampl
run 223R
223Ra < 0.3 dpm / 100 liters
226Ra < 8 dpm / 100 liters
and228Ra < 4 dpm / 100 liters
and
228/226 AR < 0.5
open ocean water
223Ra =0.3 -1.0
open ocean water
< 33 Atlantic
< 32 Pacific
>
>
run long-liv
Fig. 8. Proposed hierarchical verification sche
nificantly different to the ocean (p < 0:01) to not sig-nificantly different (p > 0:05) in four replicate tanks eachsubject to 95% ER exchange. A wide range of proba-
bilities also resulted from tests on CDOM ‘‘A’’ peak
intensity (Aqse)––of the four FT tanks sampled at the
es for Ra
a
dpm / 100 liters 223Ra > 1.0 dpm / 100 liters
226Ra > 8 dpm / 100 liters
and / or228Ra > 4 dpm / 100 liters
and / or
228/226 AR > 0.4
coastal water
coastal water
33 Atlantic
32 Pacific
ed Ra isotopes
me using salinity and radium isotopes.

Fig. 9. Mahalanobis distance (Dm) of ballast tanks on the VSF cruiseout of San Francisco. Tanks with tracer levels that are significantly
different to ocean levels are indicated with associated probabilities (*:
p < 0:05, **: p < 0:01, ***: p < 0:001). (a) Control, (b) empty–refill
exchange, (c) flow-through exchange.
K. Murphy et al. / Marine Pollution Bulletin 48 (2004) 711–730 725
beginning of the voyage, one corresponded to a proba-
bility of p < 0:001, two to a probability of p < 0:05 andthe other did not appear to be significantly different to
the ocean samples.
3.3. Multivariate analyses
Multivariate analysis using the Mahalanobis distance
statistic Dm was considerably more powerful at detectingballast water exchange than any single tracer. Some
combinations of CDOM fluorescence intensities and
trace element concentrations produced highly significantdifferences between exchanged and unexchanged tanks
on all voyages (see next section).
Too few radium samples were collected from the
ocean to allow its evaluation by multivariate analysis,
however, we were able to develop an hierarchical scheme
for verifying BWE according to levels of salinity and
radioisotopes measured on VSF, VLA and VFos (Fig.
8). In this scheme, tanks with salinity less than 30 ppt aredeemed to be carrying unexchanged ballast water, pre-
cluding the need for further testing. Where salinity ex-
ceeds 30 ppt, short lived radioisotopes (223Ra) are
examined, followed if necessary by long-lived isotopes
(228Ra, 226Ra) and activity ratios. For the VSF, VLA
and VFos cruise data, exchanged and unexchanged
ballast tanks separate on the second tier of the scheme.
Long-lived isotope data collected in this study (VFos,final samples) confirm these determinations.
3.3.1. Degree of ballast water exchange
Increased discrimination corresponding to the incor-
poration of multiple tracers in a multivariate statistical
analysis is demonstrated clearly by the VFS trace ele-
ment data (Fig. 9a–c), using three-dimensional plots of
Dm versus tracers and percent exchange (or time, in thecase of unexchanged control tanks). Moving from left to
right on the tracer axis, one tracer is added to the
analysis (i.e. Sal, (Sal +Ba), (Sal +Ba+Mn), etc.). Since
Dm is a difference measure, tanks which are least ‘‘oce-anic’’ have the tallest bars and lowest probabilities. Plots
for the exchanged tanks on this cruise (Fig. 9a–b)
illustrate two trends operating concurrently, first, an
increase in Dm as progressively more tracers are incor-porated into the analysis and second, a decrease in Dmfollowing each partial or complete ballast exchange.
Only the first of these trends was apparent in samples
taken from the control tank (Fig. 9c), indicating that the
evidence of a coastal source for these tanks became
stronger as the tracer set was expanded, independent of
the timing of sampling. Note that in these figures, the
sequence of tracers was chosen for visual clarity anddoes not reflect a judgement of performance.
To identify the strongest performing tracer sets, we
compared difference factors in end-of-voyage samples
for all possible sets of 2–5 tracers. On the Pacific voy-
ages, a set of five CDOM measures (Aem, Aqse, Cex, C2,
C3) had the highest overall mean and minimum values
of DF (Table 6). On average, there was an 28-fold dif-
ference in Dm for exchanged (ER and FT) and unex-changed end-point samples using this combination of
tracers. Trace element measures showed lesser discrim-
inatory power––the best average set (Ba, V) had a DFavof 8.2 across all voyages, while the best minimum set
(Ba, Sal) had a DFav of 7.6.
On the Atlantic voyage, sets consisting of only two or
three tracers were more successful than larger tracer sets.

Table 6
Discrimination factors (Dm;control=Dm;exchanged) for the tracer sets with the highest average discrimination (DFav) and highest minimum discrimination
(DFmin) between exchanged and unexchanged tanks across all endpoint samples from the Pacific and Atlantic cruises
Ocean Tracer types Best average set Best minimum set
Tracers Tracers
DFav (range of DFav) DFmin (range of DFmin)
Pacific Salinity/trace element Ba, V Ba, Sal
8.2 7.6
(4.2–26.8) (4.6–45.4)
Salinity/CDOM Aem, Aqse, Cex, C2, C3 Same as best average set
28.0
(14.3–588.3)
Salinity/trace element/CDOM Aem, Aqse, Cex, C2, C3 Same as best average set
28.0
(14.3–588.3)
Atlantic Salinity/trace element Ba, U Same as best average set
8.6
(6.1–14.0)
Salinity/CDOM Aqse, C3 Same as best average set
19.9
(13.4–58.4)
Salinity/trace element/CDOM Aqse, C3, Mo Aqse, C320.4 19.9
(12.2–67.2) (13.4–58.4)
100a. Mo, Aqse, C3
726 K. Murphy et al. / Marine Pollution Bulletin 48 (2004) 711–730
A combination of one trace element (Mo) and two
CDOM tracers (Aqse, C3) produced on average a 20-fold
difference in Dm for control and exchanged (ER and FT)end-point samples. Although the best CDOM set (Aqse,
C3) had a marginally lower DFav than the one including
Mo, it had a slightly higher DFmin (13.4 vs 12.2) and is
arguably the set with the best overall performance. A
scatter plot of Aqse vs C3 in samples collected from all
Fig. 10. A scatterplot of two CDOM fluorescence characteristics
(humic peak A maximum intensity, Aqse, and humic peak C3 intensity)
shows separation between ballast water samples collected from unex-
changed tanks at the beginning (––control,M––flow-through) and atthe end (�––control) of the VFos cruise, compared to exchanged tanks(N––flow-through) at the end of the cruise, and to samples collected in
the mid-ocean (s).
tanks at the beginning (time ¼ T0) and end (time ¼ T3)of the flow-through experiment, and from the mid-ocean
on VFos shows clear separation among treatments (Fig.
10). Again, the best trace element set (Ba, U) had lower
Station Number
Dm
0.1
1
10
0.1
1
10
100 b. Ba, U
0 10 20 30 40 50
Kilo
met
ers
-6
-4
-2
0d. Ocean floor elevation
Dm
Fig. 11. Mahalanobis distance (Dm) of shipside samples transecting theAtlantic (––––) using (a) best overall (Mo, Aqse, C1); and (b) and besttrace element (Ba, U) tracer sets. Data plotting above the paired
horizontal lines have Chi-Squared probabilities lower than p ¼ 0:001
(upper line) or p ¼ 0:05 (lower line). Data enclosed by box (Stations
25–39) represent fully oceanic samples, i.e. collected more than 200
miles offshore in more than 2000 m water depth. Ocean floor elevation
is plotted for comparison (– – –).

K. Murphy et al. / Marine Pollution Bulletin 48 (2004) 711–730 727
average (DFav¼ 8.6) and minimum (DFmin¼ 6.1) dis-crimination factors than sets that included CDOM.
3.3.2. Location of ballast water exchange
In samples collected from an ocean transect, we ex-
pect the statistical deviation from ‘‘oceanic’’ character-
istics to be highest for samples close to the European
and North American continents, and lowest for samples
collected in the mid-ocean. For some tracer sets,
including the ‘‘best minimum’’ trace element set (Ba, U)
in the Atlantic ocean, ocean transect samples showed
pronounced onshore–offshore gradients in Dm, suggest-ing that it may be possible to tell where in the ocean
ballast water exchange is performed (Fig. 11). However,
for other tracer sets, including the ‘‘best average’’
Atlantic set (Mo, Aqse, C3), large fluctuations in Dmamong consecutive samples suggested that factors other
than proximity to the coast dominated the response.
These results highlight the need to judge tracers not only
on their maximum discriminatory abilities, but also ontheir robustness to potential contaminants.
4. Discussion
The goal of this research was to test the potential for
various chemical attributes to be used, singly or in
combination, to determine (a) whether, and to whatextent, a ships’ ballast water was subject to mid-ocean
exchange, and (b) whether ships performed exchange in
the open ocean according to guidelines specifying that
the exchange take place 200 miles offshore and in water
over 2000 m deep. Sampling of four commercial ships in
two ocean basins indicated that several tracers were able
to discriminate between fully exchanged, partially ex-
changed and unexchanged ballast tanks. Furthermore,although preliminary, our results suggest that it may be
possible to determine if ballast water was exchanged
closer than 200 miles from the nearest coast.
Trace elements, including some metals, demonstrated
potential as quantitative measures of BWE––a result
which was counter the a priori expectation expressed by
some researchers, who considered contamination by the
ship’s structure would compromise all metal tracers.Trace element levels were elevated in unexchanged bal-
last tanks, and in coastal shipside samples, relative to
ballast tank samples and oceanic shipside samples. In
the Atlantic shipside transect, concentration gradients
were much greater near the US coast than in the Med-
iterranean Sea. Previous work has shown that trace
metal and nutrient concentrations are greatest in coastal
waters which receive elevated inputs from riverine, eo-lian and terrestrial sources (Bruland, 1983; Donat and
Bruland, 1995; Shiller, 1997). The depressed levels of
phosphorus (2–4 ppb) measured in the Mediterranean
shipside samples and in tanks at the beginning of the
VFos voyage are consistent with the unique nutrient
chemistry of the Mediterranean (Bethoux et al., 1998).
When incorporated into multivariate analyses, we
found that CDOM humic fluorescence characteristicsmay be highly effective indicators of ballast water
source. The size and wavelengths of the maximum
fluorescence peak in the range of CDOM (Aqse), com-
bined with the intensity at a fixed wavelength pair (C3exc./em.¼ 325/420), showed large (13–58-fold) differ-
ences in the statistic Dm between exchanged and unex-changed ballast tanks on the Atlantic cruise, despite a
salinity differential of only 2 ppt. For the Pacific cruises,these same tracers combined with Aem, Cex, and C2 re-
vealed 14–588-fold differences.
Our data suggest that certain radioisotopes could be
used to verify ballast water exchange, including con-
centrations and ratios of a short-lived isotope of radium
(223Ra) and two long-lived isotopes (226Ra, 228Ra). For
the VFos cruise, which was conducted on a coal-carrier,
we hoped to use 228Th as a proxy to investigate marineparticulate sources of 223Ra, since thorium is largely
particle-bound in sea water and is not contained in high
quantities in coal. However, there was no difference
between concentrations of 228Th in exchanged and
control tanks on VFos. Given the higher sediment load
of the coastal water, the lack of variation in 228Th be-
tween control and exchanged tanks is surprising. We
suggest that 228Th retained on the Mn fibers was not areliable measure of particulate 223Ra production due to
the cancellation of two effects: (1) the dissolved 228Th/228Ra AR in the coastal water was a factor of 2 lower
than the AR in the open ocean, and (2) 228Ra was a
factor of 2 higher in the coastal water than in the open
ocean. More data are required to confirm these results,
particularly since our ability to test radium measures
was limited due to small sample sizes.Determination of BWE location requires high sensi-
tivity to small offshore concentration gradients, and is a
considerably more difficult task than verifying whether a
ballast tank contains water from a coastal port or the
mid-ocean. A transect of shipside samples across the
Atlantic afforded us the opportunity to examine whether
it may be possible to detect when BWE is performed less
than 200 miles offshore. Seawater sampled off the USeast coast had an obvious coastal signature that was still
detectable nearly 200 miles offshore, reflecting the strong
salinity signal emanating from the Chesapeake Bay.
Near the European coast however, sets of tracers that
were highly successful in verifying BWE did not always
reliably predict the coastal vs. oceanic nature of shipside
samples. While we considered it premature to pursue
verification of BWE location extensively during thisstudy, we believe that it may eventually be possible to
optimize tracer sets for this capability.
We found little evidence to suggest that tracer con-
centrations in our ballast tanks varied by depth (1 m vs

728 K. Murphy et al. / Marine Pollution Bulletin 48 (2004) 711–730
12 m) or horizontal location. The important practical
implication is that for the tracers of interest, it is possible
to obtain an accurate indication of whole-tank tracer
concentrations by taking measurements from a singledepth and location. This would be untrue for a ballast
tank comprised of chemically distinct water masses that
have had insufficient opportunity to mix completely (e.g.
Taylor and Bruce, 2000). However, this situation is
unlikely to arise in ships that have been at sea for more
than a few days.
In this study, ballast water samples from tanks that
had been subject to complete (>99%) ballast water ex-change were significantly different to mid-ocean shipside
samples. Both sample types were in contact with the
ship’s internal structure (engine-cooling pipes and/or fire
hoses), thus the differences are likely to arise from either
of two causes: First, ballast water exchange is never 100
percent efficient at removing all coastal tracers, since
several tons of ballast are commonly trapped in ‘‘empty’’
tanks (Locke et al., 1993; Taylor and Bruce, 2000). Sec-ond, entrainment and holding in ballast tanks may affect
dissolved tracer concentrations. For example, depending
on a tank’s configuration and ballasting history, residual
sediments may contribute significantly to the character-
istics of overlying water.
A plot of CDOM fluorescence intensities Aqse vs
peak C3 at the beginning and end of the VFos cruise
provided evidence of a tank holding effect. In this case,Aqse increased over time with the effect that differences
between the control and treatment tanks were even
greater at the end of the voyage. The tracers Mn and P
exhibited complex dynamics in control tanks on the
same cruise. Both elements have an organic and par-
ticulate source that may demineralize in the tanks and
contribute to the dissolved phase. As a result, they are
likely to be affected by differing levels of sediment andorganic matter in individual ballast tanks. The gradual
increase in phosphorus levels over time during the
Atlantic voyage was suggestive of P efflux from mildly
reducing sediments on the tank bottom, as has been
observed for continental slope/shelf sediments (Schenau
and De Lange, 2001).
Since every ship is a source of numerous potential
contaminants, including metals, oils and chemicalcoatings, a significant challenge exists in defining the
tracer set which contributes the maximum amount of
information and minimum amount of noise to a discri-
minant analysis. In our preliminary analyses, it is
revealing that sets consisting of 2–3 tracers in many
cases outperformed larger sets. This suggests that the
increased signal provided by additional tracers was often
overshadowed by the accompanying increase in noise.We suspect that sediments and coal dust entrained on
the Atlantic voyage contributed to unpredictable fluc-
tuations of some elements (particularly Mn and P),
which reduced their discriminatory power. Similarly,
while Aqse was a powerful tracer in our analyses, we
caution that its magnitude is likely to be affected by the
presence of fluorescent contaminants, such as polycyclic
aromatic hydrocarbons.Although not a component of this study, there is no
doubt that if BWE verification is to be performed rou-
tinely in a regulatory framework, practical issues such as
sampling time and analysis cost are likely to play an
important role in tracer selection. We envisage that a
verification testing program could involve multiple tests
conducted sequentially according to a hierarchical
decision system, in which progressively more costlyanalyses are performed only if the results of cheaper
and/or in situ options are inconclusive.
We have focused on chemical discriminants of ballast
water exchange, in most cases using techniques never
before applied to this purpose. Although it may also be
possible to verify the source of ballast water using bio-
logical tracers (e.g. plankton, bacteria), there are several
complications to this approach. In particular, the speciescomposition and abundance of ballasted communities
are highly variable in space and time, presenting two
types of problems. First, the use of a few standard
taxonomic indicators would be problematic, necessitat-
ing considerable taxonomic expertise for biological
verification of BWE on a global scale. Second, and
critically, the abundance of coastal indicator organisms
from a single port can vary many orders of magnitudeover time, creating significant noise in the starting con-
ditions and consequently in expected concentrations
following BWE.
Our analyses provide a proof of concept for an ap-
proach to verification of ballast water exchange at sea.
Using multivariate analysis methods, we were able to
identify chemical tracers that performed well as dis-
criminators of BWE across ships, tanks and oceans.Prior to implementation of a ballast water verification
program based on these findings, it is necessary to
conduct a full examination of the generality of these
results under variable starting conditions (including a
range of port signatures and vessel types), testing their
utility across a range of practical situations. A com-
ponent of this task would involve expansion of the
geographic scope of our ocean reference datasets inorder to properly characterize the regions in which
ballast exchange may occur. We expect that some
specific conclusions of this research, in particular the
composition of ‘‘best’’ tracer sets, could change as data
are collected encompassing larger temporal and spatial
scales. Further important challenges for future research
will include the development of simple and reliable
sample collection procedures and ways of expeditingsample turn-around, so that regulatory authorities can
respond quickly to the invasive species threat posed by
ships found to be transporting unexchanged ballast
water.

K. Murphy et al. / Marine Pollution Bulletin 48 (2004) 711–730 729
Acknowledgements
The authors wish to acknowledge the cooperation of
Sea River Maritime, the Alaska Tanker Company, BPAmoco PLC and Krupp Seeschiffahrt GmbH; each
company hosted an experiment on one of their ships and
their officers and crew provided invaluable assistance.
Many people contributed ideas to this project during a
workshop held in Edgewater, MD in 2000. Samples
were collected with assistance from B. Steves, A. Bur-
dick, A. Chang, G. Smith and E. Collinetti. Funding for
this research was provided by the Research and Devel-opment Center of the US Coast Guard.
References
Anonymous, 2002. Chesapeake Bay Foundation, NISA recommenda-
tions, Washington, DC.
Andersson, P.S., Porcelli, D., Gustafsson, O., Ingri, J., Wasserburg,
G.J., 2001. The importance of colloids for the behavior of uranium
isotopes in the low-salinity zone of a stable estuary. Geochemica et
Cosmochemica Acta 65, 13–25.
Bernat, M., Church, T., Allegre, C.J., 1972. Barium and strontium
concentrations in Pacific and Mediterranean sea water profiles by
direct isotope dilution mass spectrometry. Earth and Planetary
Science Letters 16, 75–80.
Bethoux, J.P., Morin, P., Chaumery, C., Connan, O., Gentilli, B.,
Ruiz-Pino, D., 1998. Nutrients in the Mediterranean Sea, mass
balance and statistical analysis of concentrations with respect to
environmental change. Marine Chemistry 63, 155–169.
Broecker, W.S., Goddard, J., Sarmiento, J.L., 1976. The distribution
of 226Ra in the Atlantic Ocean. Earth and Planetary Science Letters
32, 220–235.
Bruland, K.W., 1983. Trace Elements in Sea-water. In: Chemi-
cal Oceanography, vol. 8. Academic Press, New York. pp. 157–
220.
Bruland, K.W., Franks, R.P., 1983. Mn, Ni, Cu, Zn and Cd in the
western North Atlantic. In: Wong, C.S., Boyle, E., Bruland, K.W.,
Burton, J.D., Goldberg, E.D. (Eds.), Trace Metals in Seawater.
Plenum Press, New York, pp. 395–414.
Chan, L.H., Drummond, D., Edmond, J.M., Grant, B., 1977. On the
barium data from the Atlantic Geosecs expedition. Deep-Sea
Research 24, 613–649.
Chan, L.H., Edmond, J.M., Stallard, R.F., Broecker, W.S., Chung,
Y.C., Weiss, R.F., Ku, T.L., 1976. Radium and barium at
GEOSECS stations in the Atlantic and Pacific. Earth and
Planetary Science Letters 32, 258–267.
Chen, J.H., Edwards, R.L., Wasserburg, G.J., 1986. 238-U, 234-U and
232-Th in seawater. Earth and Planetary Science Letters 80, 241–
251.
Chung, Y., Craig, H., 1980. 226Ra in the Pacific Ocean. Earth and
Planetary Science Letters 49, 267–292.
Coble, P.G., 1996. Characterization of marine and terrestrial DOM in
seawater using excitation-emission matrix spectroscopy. Marine
Chemistry 51, 325–346.
Coble, P.G., Del Castillo, C.E., Avril, B., 1998. Distribution and
optical properties of CDOM in the Arabian Sea during the 1995
Southwest Monsoon. Deep-Sea Research Pt. II 45, 2195–2223.
Cohen, A.N., Carlton, J.T., 1995. Nonindigenous species in a United
States estuary: a case study of the biological invasions of the San
Francisco bay and delta. Report to US Fish and Wildlife Service
and National Sea Grant College Program, Connecticut.
Collier, R.W., 1984. Particulate and dissolved vanadium in the North
Pacific Ocean. Nature 309, 441–444.
Donat, J.R., Bruland, K.W., 1995. Trace Elements in the Oceans. In:
Salbu, B., Steinnes, E. (Eds.), Trace Elements in Natural Waters.
CRC Press, Boca Raton, pp. 247–281.
Dugdale, R.C., Wilkerson, F.P., 1988. Nutrient sources and primary
production in the Eastern Mediterranean. Oceanologica Acta 9,
179–184.
Field, M.P., Cullen, J.T., Sherrell, R.M., 1999. Direct determination of
10 trace metals in 50 ll samples of coastal seawater usingdesolvating micronebulization sector field ICP-MS. Journal of
Analytical Atomic Spectrometry 14, 1425–1431.
Hay, C.H., Tanis, D., 1998. Mid-ocean ballast water exchange:
procedures, effectiveness and verification. Cawthron Report No.
468. Cawthron Institute, Nelson.
Hewitt, C.L., Campbell, M.L., Thresher, R.E., Martin. R.B., 1999.
Marine biological invasions of Port Phillip Bay, Victoria. CRIMP
Technical Report No. 20, CSIRO Division of Marine Research,
Hobart.
Johnson, R.A., Wichern, D.W., 1982. Applied multivariate analysis.
Prentice-Hall, New Jersey.
Karl, D.M., Bj€orkman, K.M., 2002. Dynamics of DOP. In: Hansell,
D., Carlson, C. (Eds.), Biogeochemistry of Marine Dissolved
Organic Matter. Academic Press, New York, pp. 246–366.
Landing, W.M., Bruland, K.W., 1980. Manganese in the North
Pacific. Earth and Planetary Science Letters 49, 45–56.
Locke, A., Reid, D.M., van Leeuwen, H.C., Sprules, W.G., Carlton,
J.T., 1993. Ballast water exchange as a means of controlling
dispersal of freshwater organisms by ships. Canadian Journal of
Fisheries and Aquatic Science 50, 2086–2093.
Martin, J.H., Knauer, G.A., Broenkow, W.W., 1985. VERTEX: the
lateral transport of manganese in the northeast Pacific. Deep-Sea
Research 32, 1405–1427.
McConnell, M.L., 2002. Globallast Legislative Review––Final Report.
GloBallast Monograph Series No. 1. IMO, London.
Moore, W.S., 1976. Sampling 228Ra in the deep ocean. Deep-Sea
Research 23, 647–651.
Moore, W.S., 1984. Radium isotope measurements using germanium
detectors. Nuclear Instruments and Methods in Physical Research
223, 407–411.
Moore, W.S., Arnold, R., 1996. Measurement of 223Ra and 224Ra in
coastal waters using a delayed coincidence counter. Journal of
Geophysical Research 101, 1321–1329.
Morris, A.W., 1975. Dissolved molybdenum and vanadium in the
northeast Atlantic Ocean. Deep-Sea Research 22, 49–54.
Murphy, K., Ruiz, G., Coble, P., Boehme, J., Field, P., Cullen, J.,
Moore, W., 2002. Mid-ocean ballast water exchange: approach and
methods for verification. Final Report to the US Coast Guard,
Research and Development Center. Smithsonian Environmental
Research Center, Edgewater.
Nozaki, Y., Yamada, M., Nikaido, H., 1990. The marine geochemistry
of actinium-227: evidence for its migration through sediment pore
waters. Geophysical Research Letters 17, 1933–1936.
Nozaki, Y., Yamamoto, Y., Manaka, T., Amakawa, H., Snidvongs,
A., 2001. Dissolved barium and radium isotopes in the Chao
Phraya River estuarine mixing zone in Thailand. Continental Shelf
Research 21, 1435–1448.
Paulsen, S.C., List, E.J., 1997. A study of transport and mixing in
natural waters using ICP-MS: water–particle interactions. Water,
Air and Soil Pollution 99, 149–156.
Pimentel, D., Lach, L., Zuniga, R., Morrison, D., 2000. Environmen-
tal and economic costs of non-indigenous species in the United
States. Bioscience 50, 53–65.
Ruiz, G.M., Carlton, J.T., Grosholz, E.D., Hines, A.H., 1997. Global
invasions of marine and estuarine habitats by non-indigenous
species: Mechanisms, extent, and consequences. Am. Zool. 37, 621–
632.

730 K. Murphy et al. / Marine Pollution Bulletin 48 (2004) 711–730
Ruiz, G.M., Fofonoff, P.W., Carlton, J.T., Wonham, M.J., Hines,
A.H., 2000. Invasion of Coastal Marine Communities in North
America: Apparent patterns, processes and biases. Annual Review
of Ecology and Systematics 31, 481–531.
Schenau, S.J., De Lange, G.J., 2001. Phosphorus regeneration vs.
burial in sediments of the Arabian Sea. Marine Chemistry 75, 201–
217.
Shaw, T.J., Moore, W.S., Kloepfer, J., Sochaski, M.A., 1998. The flux
of barium to the coastal waters of the southeastern USA: the
importance of submarine groundwater discharge. Geochimica et
Cosmochimica Acta 62, 3047–3054.
Shiller, A.M., 1997. Manganese in surface waters of the Atlantic
Ocean. Geophysical Research Letters 24 (12), 1495–1498.
Smith, W.H.F., Sandwell, D.T., 1997. Global seafloor topography
from satellite altimetry and ship depth soundings. Science 277,
1956–1962.
Sohrin, Y., Isshiki, K., Kuwamoto, T., 1987. Tungsten in North Pacific
waters. Marine Chemistry 22, 95–103.
Statham, P., Yeats, P.A., Landing, W.M., 1998. Manganese in the
eastern Atlantic Ocean: processes influencing deep and surface
water distributions. Marine Chemistry 61, 55–68.
Taylor, M., Bruce, E., 2000. Mid ocean ballast water exchange:
Shipboard trials of methods for verifying efficiency. Cawthron
Report No. 524, Cawthron Institute, Nelson.
Taylor, A., Rigby, G., Gollasch, S., Voigt, M., Hallegraeff, G.,
McCollin, T., Jelmert, A., 2002. Preventive Treatment and Control
Techniques for Ballast Water. In: Lepp€akoski, E., Gollasch, S.,
Olenin, S. (Eds.), Invasive Aquatic Species of Europe: Distribu-
tions, Impacts, and Management. Kluwer Academic Publishers,
Dordrecht, pp. 484–507.
Turley, C.M., 1999. The changing Mediterranean Sea––a sensitive
ecosystem? Progress in Oceanography 44, 387–400.