Verification - CSI Documentsdocs.csiamerica.com/manuals/safe/SAFE Verification.pdf · SAFE® DESIGN...
505
Verification
Transcript of Verification - CSI Documentsdocs.csiamerica.com/manuals/safe/SAFE Verification.pdf · SAFE® DESIGN...

Verification

SAFE® DESIGN OF SLABS, BEAMS AND FOUNDATIONIS REINFORCED AND POST-TENSIONED CONCRETE
Verification Manual
ISO SAF112816M6 Rev.0 Proudly developed in the United States of America November 2016
.

Copyright
Copyright Computers & Structures, Inc., 1978-2016 All rights reserved. The CSI Logo® and SAFE® are registered trademarks of Computers & Structures, Inc. Watch & LearnTM is a trademark of Computers & Structures, Inc. Adobe and Acrobat are registered trademarks of Adobe Systems Incorported. AutoCAD is a registered trademark of Autodesk, Inc. The computer program SAFE® and all associated documentation are proprietary and copyrighted products. Worldwide rights of ownership rest with Computers & Structures, Inc. Unlicensed use of this program or reproduction of documentation in any form, without prior written authorization from Computers & Structures, Inc., is explicitly prohibited. No part of this publication may be reproduced or distributed in any form or by any means, or stored in a database or retrieval system, without the prior explicit written permission of the publisher. Further information and copies of this documentation may be obtained from: Computers & Structures, Inc. www.csiamerica.com [email protected] (for general information) [email protected] (for technical support)

DISCLAIMER
CONSIDERABLE TIME, EFFORT AND EXPENSE HAVE GONE INTO THE DEVELOPMENT AND TESTING OF THIS SOFTWARE. HOWEVER, THE USER ACCEPTS AND UNDERSTANDS THAT NO WARRANTY IS EXPRESSED OR IMPLIED BY THE DEVELOPERS OR THE DISTRIBUTORS ON THE ACCURACY OR THE RELIABILITY OF THIS PRODUCT.
THIS PRODUCT IS A PRACTICAL AND POWERFUL TOOL FOR STRUCTURAL DESIGN. HOWEVER, THE USER MUST EXPLICITLY UNDERSTAND THE BASIC ASSUMPTIONS OF THE SOFTWARE MODELING, ANALYSIS, AND DESIGN ALGORITHMS AND COMPENSATE FOR THE ASPECTS THAT ARE NOT ADDRESSED.
THE INFORMATION PRODUCED BY THE SOFTWARE MUST BE CHECKED BY A QUALIFIED AND EXPERIENCED ENGINEER. THE ENGINEER MUST INDEPENDENTLY VERIFY THE RESULTS AND TAKE PROFESSIONAL RESPONSIBILITY FOR THE INFORMATION THAT IS USED.

Software VerificationPROGRAM NAME: SAFE REVISION NO.: 0
CONTENTS
Introduction
Methodology
Acceptance Criteria
Summary of Examples
Analysis Examples
1 Simply Supported Rectangular Plate
2 Rectangular Plate with Built-In Edges
3 Rectangular Plate with Mixed Boundary
4 Rectangular Plate on Elastic Beams
5 Infinite Flat Plate on Equidistant Columns
6 Infinite Flat Plate on Elastic Subgrade
7 Skew Plate with Mixed Boundary
8 ACI Handbook Flat Slab Example 1
9 ACI Handbook Two-Way Slab Example 2
10 PCA Flat Plate Test
11 University of Illinois Flat Plate Test F1
12 University of Illinois Flat Slab Tests F2 and F3
13 University of Illinois Two-way Slab Test T1
14 University of Illinois Two-Way Slab Test T2
15 Temperature Loading
16
17
Cracked Slab Analysis
Crack Width Analysis
CONTENTS - 1

Software Verification PROGRAM NAME: SAFE REVISION NO.: 0
Design Examples ACI 318-14 ACI 318-14 PT-SL 001 Post-Tensioned Slab Design
ACI 318-14 RC-BM-001 Flexural and Shear Beam Design
ACI 318-14 RC-PN-001 Slab Punching Shear Design
ACI 318-14 RC-SL-001 Slab Flexural Design
ACI 318-11 ACI 318-11 PT-SL 001 Post-Tensioned Slab Design
ACI 318-11 RC-BM-001 Flexural and Shear Beam Design
ACI 318-11 RC-PN-001 Slab Punching Shear Design
ACI 318-11 RC-SL-001 Slab Flexural Design
ACI 318-08 ACI 318-08 PT-SL 001 Post-Tensioned Slab Design
ACI 318-08 RC-BM-001 Flexural and Shear Beam Design
ACI 318-08 RC-PN-001 Slab Punching Shear Design
ACI 318-08 RC-SL-001 Slab Flexural Design
AS 3600-09 AS 3600-01 PT-SL-001 Post-Tensioned Slab Design
AS 3600-01 RC-BM-001 Flexural and Shear Beam Design
AS 3600-01 RC-PN-001 Slab Punching Shear Design
AS 3600-01 RC-SL-001 Slab Flexural Design
AS 3600-01 AS 3600-01 PT-SL-001 Post-Tensioned Slab Design
AS 3600-01 RC-BM-001 Flexural and Shear Beam Design
AS 3600-01 RC-PN-001 Slab Punching Shear Design
AS 3600-01 RC-SL-001 Slab Flexural Design
CONTENTS - 2

Software VerificationPROGRAM NAME: SAFE REVISION NO.: 0
BS 8110-97 BS 8110-97 PT-SL-001 Post-Tensioned Slab Design
BS 8110-97 RC-BM-001 Flexural and Shear Beam Design
BS 8110-97 RC-PN-001 Slab Punching Shear Design
BS 8110-97 RC-SL-001 Slab Flexural Design
CSA A23.3-14 CSA 23.3-14 PT-SL-001 Post-Tensioned Slab Design
CSA A23.3-14 RC-BM-001 Flexural and Shear Beam Design
CSA A23.3-14 RC-PN-001 Slab Punching Shear Design
CSA A23.3-14 RC-SL-001 Slab Flexural Design
CSA A23.3-04 CSA 23.3-04 PT-SL-001 Post-Tensioned Slab Design
CSA A23.3-04 RC-BM-001 Flexural and Shear Beam Design
CSA A23.3-04 RC-PN-001 Slab Punching Shear Design
CSA A23.3-04 RC-SL-001 Slab Flexural Design
Eurocode 2-04 Eurocode 2-04 PT-SL-001 Post-Tensioned Slab Design
Eurocode 2-04 RC-BM-001 Flexural and Shear Beam Design
Eurocode 2-04 RC-PN-001 Slab Punching Shear Design
Eurocode 2-04 RC-SL-001 Slab Flexural Design
Hong Kong CP-13 Hong Kong CP-13 PT-SL-001 Post-Tensioned Slab Design
Hong Kong CP-13 RC-BM-001 Flexural and Shear Beam Design
Hong Kong CP-13 RC-PN-001 Slab Punching Shear Design
Hong Kong CP-13 RC-SL-001 Slab Flexural Design
CONTENTS - 3

Software Verification PROGRAM NAME: SAFE REVISION NO.: 0
Hong Kong CP-04 Hong Kong CP-04 PT-SL-001 Post-Tensioned Slab Design
Hong Kong CP-04 RC-BM-001 Flexural and Shear Beam Design
Hong Kong CP-04 RC-PN-001 Slab Punching Shear Design
Hong Kong CP-04 RC-SL-001 Slab Flexural Design
IS 456-00 IS 456-00 PT-SL-001 Post-Tensioned Slab Design
IS 456-00 RC-BM-001 Flexural and Shear Beam Design
IS 456-00 RC-PN-001 Slab Punching Shear Design
IS 456-00 RC-SL-001 Slab Flexural Design
Italian NTC 2008 Italian NTC-2008 PT-SL-001 Post-Tensioned Slab Design
Italian NTC-2008 RC-BM-001 Flexural and Shear Beam Design
Italian NTC-2008 PN-001 Slab Punching Shear Design
Italian NTC-2008 RC-SL-001 Slab Flexural Design
NZS 3101-06 NZS 3101-06 PT-SL-001 Post-Tensioned Slab Design
NZS 3101-06 RC-BM-001 Flexural and Shear Beam Design
NZS 3101-06 RC-PN-001 Slab Punching Shear Design
NZS 3101-06 RC-SL-001 Slab Flexural Design
Singapore CP 65-99 Singapore CP 65-99 PT-SL-001 Post-Tensioned Slab Design
Singapore CP 65-99 RC-BM-001 Flexural and Shear Beam Design
Singapore CP 65-99 RC-PN-001 Slab Punching Shear Design
Singapore CP 65-99 RC- SL-001 Slab Flexural Design
CONTENTS - 4

Software VerificationPROGRAM NAME: SAFE REVISION NO.: 0
Turkish TS 500-2000 Turkish TS 500-2000 PT-SL-001 Post-Tensioned Slab Design
Turkish TS 500-2000 RC-BM-001 Flexural and Shear Beam Design
Turkish TS 500-2000 RC-PN-001 Slab Punching Shear Design
Turkish TS 500-2000 RC- SL-001 Slab Flexural Design
Conclusions
References
CONTENTS - 5

Software VerificationPROGRAM NAME: SAFE REVISION NO.: 0
SAFE Software Verification Log Revision Number Date Description
0 December 02, 2008 Initial release for SAFE v 12.0.0
1 February 19, 2009
Initial release for SAFE v12.1.0. Example 15 and Example 16 were added.
2 December 26, 2009
Revised to reflect results obtained from Version 12.2.0. All examples, including 1 through 16 and all code-specific examples (ACI 318-00, AS 3600-01, BS 8110-97, CSA A23.3-04, Eurocode 2-04, Hong Kong CoP-04, IS 456-00, NZS 3101, and SingaporeCP 65-99 – PS-SL, RC-BM, RC-PN, RC-SL)
3 July 12, 2010
Minor changes have been made to the Examples supplied with the software: (1) The documented results for Analysis Examples 1, 4, 5, 7, and 8 have been updated to correct for truncation error in the reported values. The values actually calculated by the software have not changed for these examples. (2) The input data file for Example 16 has been updated to correct the creep and shrinkage parameters used so that they match those of the benchmark example, and the documented results updated accordingly. The behavior of the software has not changed for this example. (3) All Slab Design examples have been updated to report the slab design forces rather than the strip forces. The design forces account for twisting moment in slab, so their values are more meaningful for design. The behavior of the software has not changed for these examples.
4 December 8, 2010
Minor changes have been made to the Examples supplied with the software: (1) The documented results for Analysis Examples 1 to 7 have been updated to include the results from thin-plate and thick-plate formulation. (2) The input data files for Australian AS 3600-2009 have been added. (3) The Eurocode 2-2004 design verification examples now include the verification for all available National Annexes.
SAFE 2014 Software Verification Log Revision Number Date Description
0 February 2014
Initial release for SAFE 2014 v14.0.0.
New design examples have been added for the following codes: ACI 318-11, Hong Kong CoP-2013, Italian NTC 2008 and
LOG - 1

Software VerificationPROGRAM NAME: SAFE
REVISION NO.: 0
LOG - 2
SAFE Software Verification Log Revision
Number Date Description
Turkish TS 500-2000 (Incident 63082).
Documentation for the punching-shear design examples of the
following codes have been corrected for an error in the
documented calculation of the punching perimeter: CSA A23.3-
04, IS 456-00, and NZS 3101-06. No calculated results have
changed. (Incident 46359)
Documentation for the beam and slab design examples of the AS
3600-09 code have been updated to account for a change made to
the software under Incident 35218 for version 12.3.2 that updated
Equation 8.1.3(2). No calculated results have changed. (Incident
46359)
Results for the area of reinforcing steel have changed for
Eurocode P/T slab example “Eurocode 2-04 PT-SL-001”.
(Incident 62486)
Documentation for analysis Example 17 has been corrected for an
error in the documented cracked width computed by SAFE. No
calculated results have changed. (Incident 63153)
1 June 2015
Initial release for SAFE 2014 v14.1.0.
New design examples have been added for the following codes:
ACI 318-14 (Incident 79838), and CSA A23.3-14 (Incident
71674).
SAFE 2016 Software Verification Log
Revision
Number Date Description
0 November
2016
For Example 5, stiffening elements were updated in the model.
Results have changed slightly.
For Examples 8-14, stiffening elements were updated in the
column areas, and all beam cross-section properties were updated
to reflect values calculated from the actual geometry.
For Examples 10-14, the models were changed to reflect the fact
that the slab should extend to the outside faces of the columns.

Software Verification
PROGRAM NAME: SAFE
REVISION NO.: 0
LOG - 3
SAFE Software Verification Log Revision
Number Date Description
The slight increase in slab area has changed reported results.
For design examples ACI 318-08 RC-PN-001, ACI 318-11 RC-
PN-001 and ACI 318-14 RC-PN-001, incorrectly sized and
redundant stiff areas were removed from the models. Reported
results have changed slightly.
For design examples CSA A23.3-04 RC-SL-001 and CSA A23.3-
14 RC-SL-001, mesh size has been changed to 0.25m to be the
same as in the rest of the international code examples. Results
have changed slightly.
For all changed models, reported results that have changed have
been updated in the corresponding documentation.
Documentation for Example 5 has been updated for incorrect
modeling information regarding the column stiff area dimensions.
Documentation for Example 14 has been updated for incomplete
modeling information in the images.
Documentation for Eurocode 2-04 RC-PN-001was updated to
reflect changes in how the program is determining K2*Med2 and
K3*Med3, which has changed the results.
Documentation for all design examples of type RC-SL has had
wording updated to reflect the current state of the models.
0 November
2016
Minor typo error for units for modulus of elasticity of concrete
(Ec) and modulus of elasticity of steel (Es) and poison ratio value
have been updated.

Software VerificationPROGRAM NAME: SAFE REVISION NO.: 0
INTRODUCTION
SAFE is a software application, based on the finite element method, for the engineering analysis, design and detailing of reinforced-concrete and post-tensioned slabs, beams and foundations.
This document provides example problems used to test various features and capabilities of the SAFE program. Users should supplement these examples as necessary for verifying their particular application of the software.
METHODOLOGY
A comprehensive series of test problems, or examples, designed to test the various analysis and design features of the program have been created. The results produced by SAFE were compared to independent sources, such as hand calculated results and theoretical or published results. The comparison of the SAFE results with results obtained from independent sources is provided in tabular form as part of each example.
To validate and verify SAFE results, the test problems were run on a PC platform that was an Lenovo ThinkCentre machine with a Core i5, 2.67 GHz processor and 8.0 GB of RAM operating on a Windows 7 operating system.
ACCEPTANCE CRITERIA The comparison of the SAFE validation and verification example results with independent results is typically characterized in one of the following three ways.
Exact: There is no difference between the SAFE results and the independentresults within the larger of the accuracy of the typical SAFE output and theaccuracy of the independent result.
Acceptable: For force, moment and displacement values, the difference betweenthe SAFE results and the independent results does not exceed five percent (5%).For internal force and stress values, the difference between the SAFE results andthe independent results does not exceed ten percent (10%). For experimentalvalues, the difference between the SAFE results and the independent results doesnot exceed twenty five percent (25%).
Unacceptable: For force, moment and displacement values, the differencebetween the SAFE results and the independent results exceeds five percent (5%).
INTRODUCTION - 1

Software Verification PROGRAM NAME: SAFE REVISION NO.: 0
For internal force and stress values, the difference between the SAFE results and the independent results exceeds ten percent (10%). For experimental values, the difference between the SAFE results and the independent results exceeds twenty five percent (25%).
The percentage difference between results is typically calculated using the following formula:
SAFE Result - Independent ResultPercent Difference 100Maximum of Independent Result
=
SUMMARY OF EXAMPLES Examples 1 through 7 verify the accuracy of the elements and the solution algorithms used in SAFE. These examples compare displacements and member internal forces computed by SAFE with known theoretical solutions for various slab support and load conditions.
Examples 8 through 14 verify the applicability of SAFE in calculating design moments in slabs by comparing results for practical slab geometries with experimental results and/or results using ACI 318-95 recommendations. Examples 15 and 16 verify the applicability of SAFE for temperature loading and cracked deflection analysis for creep and shrinkage by comparing the results from published examples.
Design examples verify the design algorithms used in SAFE for flexural, shear design of beam; flexural and punching shear of reinforced concrete slab; and flexural design and serviceability stress checks of post-tensioned slab, using ACI 318-14, ACI 318-11, ACI 318-08, AS 3600-09, AS 3600-01, BS 8110-97, CSA A23.3-14, CSA A23.3-04,Eurocode 2-02, Hong Kong CP-13, Hong Kong CP-04, IS 456-00, Italian NTC 2008,NZS 31-01-06, Singapore CP 65-99 and Turkish TS 500-2000 codes, by comparingSAFE results with hand calculations.
Methodology - 2

Software VerificationPROGRAM NAME: SAFE REVISION NO.: 0
EXAMPLE 1 Simply Supported Rectangular Plate
PROBLEM DESCRIPTION A simply supported, rectangular plate is analyzed for three load conditions: uniformly distributed load over the slab (UL), a concentrated point load at the center of the slab (PL), and a line load along a centerline of the slab (LL).
To test convergence, the problem is analyzed employing three mesh sizes, 4 × 4, 8 × 8, and 12 × 12, as shown in Figure 1-2. The slab is modeled using plate elements in SAFE. The simply supported edges are modeled as line supports with a large vertical stiffness. Three load cases are considered. Self weight is not included in these analyses.
To obtain design moments, the plate is divided into three strips ― two edge strips and one middle strip ― each way, based on the ACI 318-95 definition of design strip widths for a two-way slab system as shown in Figure 1-3.
For comparison with the theoretical results, load factors of unity are used and each load case is processed as a separate load combination.
Closed-form solutions to this problem are given in Timoshenko and Woinowsky (1959) employing a double Fourier Series (Navier’s solution) or a single series (Lévy’s solution). The numerically computed deflections, local moments, average strip moments, and local shears obtained from SAFE are compared with the corresponding closed form solutions.
SAFE results are shown for both thin plate and thick plate element formulations. The thick plate formulation is recommended for use in SAFE, as it gives more realistic shear forces for design, especially in corners and near supports and other discontinuities. However, thin plate formulation is consistent with the closed-form solutions.
GEOMETRY, PROPERTIES AND LOADING Plate size, a × b = 360 in × 240 in Plate thickness T = 8 inches Modulus of elasticity E = 3000 ksi Poisson's ratio v = 0.3
EXAMPLE 1 - 1

Software Verification PROGRAM NAME: SAFEREVISION NO.: 0
Load Cases: (UL) Uniform load q = 100 psf (PL) Point load P = 20 kips (LL) Line load q1 = 1 kip/ft
(3)
(2)
(1)
(3) (2) (1)
q1
q1 P
P
y
q
a = 30 '
b =
20 '
x
(3)
(2)
(1)
(3) (2) (1)
q1
q1 P
P
y
q
a = 30 '
b =
20 '
x
Figure 1-1 Simply Supported Rectangular Plate
EXAMPLE 1 - 2

Software VerificationPROGRAM NAME: SAFE REVISION NO.: 0
4 @ 5'
2 @ 10' 5'5'
4x4 Mesh
8 @ 2.5'
4 @ 5'2 @ 2.5' 2 @ 2.5'
8x8 Mesh
12 @ 20"
6 @ 40"3 @ 20" 3 @ 20"
12x12 Mesh
4 @ 5'
2 @ 10' 5'5'
4x4 Mesh
4 @ 5'
2 @ 10' 5'5'
4x4 Mesh
8 @ 2.5'
4 @ 5'2 @ 2.5' 2 @ 2.5'
8x8 Mesh
8 @ 2.5'
4 @ 5'2 @ 2.5' 2 @ 2.5'
8x8 Mesh
12 @ 20"
6 @ 40"3 @ 20" 3 @ 20"
12x12 Mesh
12 @ 20"
6 @ 40"3 @ 20" 3 @ 20"
12 @ 20"
6 @ 40"3 @ 20" 3 @ 20"
12x12 Mesh
Figure 1-2 SAFE Meshes for Rectangular Plate
EXAMPLE 1 - 3

Software Verification PROGRAM NAME: SAFEREVISION NO.: 0
a = 30'
b =
20'
X
Y
X
Y
b/4 = 5'
b/4 = 5'
10'
Edge Strip
Middle Strip
X Strips
Y Strips
Edge StripMiddle Strip
X
Y
20'b/45' 5'
b/4
a = 30'
b =
20'
X
Y
X
Y
b/4 = 5'
b/4 = 5'
10'
Edge Strip
Middle Strip
X Strips
Y Strips
Edge StripMiddle Strip
X
Y
20'b/45' 5'
b/4
Figure 1-3 SAFE Definition of Design Strips
EXAMPLE 1 - 4

Software VerificationPROGRAM NAME: SAFE REVISION NO.: 0
TECHNICAL FEATURES OF SAFE TESTED Deflection of slab at various mesh refinements. Local moments, average strip moments, and local shears
RESULTS COMPARISON Table 1-1 shows the deflections of four different points for three different mesh refinements for the three load cases. The theoretical solutions based on Navier’s formulations also are shown for comparison. It can be observed from Table 1-1 that the deflection obtained from SAFE converges monotonically to the theoretical solution with mesh refinement. Moreover, the agreement is acceptable even for the coarse mesh (4 × 4).
Table 1-2 shows the comparison of the numerically obtained local-moments at critical points with that of the theoretical values. Only results from the 8x8 mesh are reported. The comparison with the theoretical results is acceptable.
Table 1-3 shows the comparison of the numerically obtained local-shears at critical points with that of the theoretical values. The comparison here needs an explanation. The theoretical values were presented for both thin plate and thick plate formulations. The theoretical values are for a thin plate solution where shear strains across the thickness of the plate are ignored. The SAFE results for thick plate are for an element that does not ignore the shear strains. The thin plate theory results in concentrated corner uplift; consideration of the shear strains spreads this uplift over some length of the supports near the corners. The shears reported by SAFE for thick plate are more realistic.
The results of Table 1-3 are plotted in Figures 1-4 to 1-15. In general, it can be seen that the thin plate formulation more closely matches the closed-form solution than does the thick plate solution, as expected. The closed-form solution cannot be used to validate the thick plate shears, since behavior is fundamentally different in the corners. This can be seen clearly in Figures 6, 7, 10, 11, 14 and 15 which show the shear forces trajectories for thin plate and thick plate solutions. The thin plate solution unrealistically carries loads to corners, whereas the thick plate solution carries the load more toward the middle of the sites.
Table 1-4 shows the comparison of the average strip-moments for the load cases with the theoretical average strip-moments. The comparison is excellent. This checks both the accuracy of the finite element analysis and the integration scheme over the elements.
EXAMPLE 1 - 5

Software Verification PROGRAM NAME: SAFEREVISION NO.: 0
It should be noted that in calculating the theoretical solution, a sufficient number of terms from the series is taken into account to achieve the accuracy of the theoretical solutions.
Table 1-1 Comparison of Displacements
Thin-Plate Formulation
Load Case
Location SAFE Displacement (in) Theoretical Displacement
(in) X (in) Y (in) 4×4 Mesh 8×8 Mesh 12×12 Mesh
UL
60 60 0.0491 0.0492 0.0493 0.0492961
60 120 0.0685 0.0684 0.0684 0.0684443
180 60 0.0912 0.0908 0.0907 0.0906034
180 120 0.1279 0.1270 0.1267 0.1265195
PL
60 60 0.0371 0.0331 0.0325 0.0320818
60 120 0.0510 0.0469 0.0463 0.0458716
180 60 0.0914 0.0829 0.0812 0.0800715
180 120 0.1412 0.1309 0.1283 0.1255747
LL
60 60 0.0389 0.0375 0.0373 0.0370825
60 120 0.0593 0.0570 0.0566 0.0562849
180 60 0.0735 0.0702 0.0696 0.0691282
180 120 0.1089 0.1041 0.1032 0.1024610
EXAMPLE 1 - 6

Software VerificationPROGRAM NAME: SAFE REVISION NO.: 0
Thick-Plate formulation
Load Case
Location SAFE Displacement (in) Theoretical Displacement
(in) X (in) Y (in) 4×4 Mesh 8×8 Mesh 12×12 Mesh
UL
60 60 0.0485 0.0501 0.0501 0.0492961
60 120 0.0679 0.0695 0.0694 0.0684443
180 60 0.0890 0.0919 0.0917 0.0906034
180 120 0.1250 0.1284 0.1281 0.1265195
PL
60 60 0.0383 0.0339 0.0330 0.0320818
60 120 0.0556 0.0474 0.0469 0.0458716
180 60 0.0864 0.0834 0.0821 0.0800715
180 120 0.1287 0.1297 0.1293 0.1255747
LL
60 60 0.0387 0.0381 0.0378 0.0370825
60 120 0.0583 0.0579 0.0574 0.0562849
180 60 0.0719 0.0710 0.0703 0.0691282
180 120 0.1060 0.1053 0.1044 0.1024610
EXAMPLE 1 - 7

Software Verification PROGRAM NAME: SAFEREVISION NO.: 0
Table 1-2 Comparison of Local Moments Thin-Plate Formulation
Load Case
Location
Moment (kip-in/in)
M11 M22 M12
X (in) Y (in) SAFE 8×8
Analytical (Navier)
SAFE 8×8
Analytical (Navier)
SAFE 8×8
Analytical (Navier)
UL
150 15 0.42 0.45 0.73 0.81 0.31 0.30
150 45 1.16 1.18 1.95 2.02 0.26 0.26
150 75 1.66 1.69 2.69 2.77 0.17 0.17
150 105 1.92 1.95 3.04 3.12 0.06 0.06
PL
150 15 0.37 0.37 0.36 0.36 0.44 0.47
150 45 1.11 1.13 1.13 1.14 0.48 0.51
150 75 1.92 1.90 2.16 2.20 0.56 0.59
150 105 2.81 2.41 3.85 3.75 0.42 0.47
LL
150 15 0.26 0.26 0.34 0.34 0.24 0.24
150 45 0.77 0.77 1.06 1.08 0.21 0.20
150 75 1.25 1.25 1.91 1.92 0.14 0.14
150 105 1.69 1.68 2.94 3.03 0.05 0.05
EXAMPLE 1 - 8

Software VerificationPROGRAM NAME: SAFE REVISION NO.: 0
Thick-Plate Formulation
Load Case
Location
Moment (kip-in/in)
M11 M22 M12
X (in) Y (in) SAFE 8×8
Analytical (Navier)
SAFE 8×8
Analytical (Navier)
SAFE 8×8
Analytical (Navier)
UL
150 15 0.43 0.45 0.74 0.81 0.31 0.30
150 45 1.16 1.18 1.95 2.02 0.26 0.26
150 75 1.66 1.69 2.69 2.77 0.17 0.17
150 105 1.92 1.95 3.04 3.12 0.06 0.06
PL
150 15 0.29 0.37 0.34 0.36 0.43 0.47
150 45 1.07 1.13 1.14 1.14 0.41 0.51
150 75 1.91 1.90 2.15 2.20 0.42 0.59
150 105 2.83 2.41 3.82 3.75 0.22 0.47
LL
150 15 0.27 0.26 0.34 0.34 0.24 0.24
150 45 0.78 0.77 1.07 1.08 0.21 0.20
150 75 1.25 1.25 1.91 1.92 0.14 0.14
150 105 1.68 1.68 2.94 3.03 0.05 0.05
EXAMPLE 1 - 9

Software Verification PROGRAM NAME: SAFEREVISION NO.: 0
Table 1-3 Comparison of Local Shears Thin-Plate Formulation
Load Case
Location
Shears (×10−3 kip/in)
V13 V23
X (in) Y (in) SAFE (8×8)
Analytical (Navier)
SAFE (8×8)
Analytical (Navier)
UL
15 45 −27.54 −35.2 −5.76 −7.6
45 45 −16.07 −21.2 −17.19 −21.0
90 45 −7.31 −10.5 −28.39 −33.4
150 45 −1.71 −3.0 −36.23 −40.7
PL
15 45 −4.84 −8.7 −2.43 −2.6
45 45 −6.75 −9.8 −8.57 −8.3
90 45 −12.45 −13.1 −20.53 −19.2
150 45 −11.19 −11.2 −34.82 −43.0
LL
15 45 −13.2 −15.7 −4.57 −5.7
45 45 −10.91 −13.0 −13.47 −16.2
90 45 −5.76 −7.6 −22.59 −26.5
150 45 −1.45 −2.2 −29.04 −32.4
EXAMPLE 1 - 10

Software VerificationPROGRAM NAME: SAFE REVISION NO.: 0
Thick-Plate formulation
Load Case
Location
Shears (×10−3 kip/in)
V13 V23
X (in) Y (in) SAFE (8×8)
Analytical (Navier)
SAFE (8×8)
Analytical (Navier)
UL
15 45 −21.27 −35.2 24.75 −7.6
45 45 −7.57 −21.2 −6.35 −21.0
90 45 −2.30 −10.5 −29.83 −33.4
150 45 −0.92 −3.0 −43.13 −40.7
PL
15 45 −0.66 −8.7 18.01 −2.6
45 45 1.83 −9.8 2.33 −8.3
90 45 −8.01 −13.1 −14.89 −19.2
150 45 −18.02 −11.2 −48.18 −43.0
LL
15 45 −7.69 −15.7 19.71 −5.7
45 45 −2.07 −13.0 −4.89 −16.2
90 45 −1.43 −7.6 −23.51 −26.5
150 45 −0.63 −2.2 −34.25 −32.4
EXAMPLE 1 - 11

Software Verification PROGRAM NAME: SAFEREVISION NO.: 0
Table 1-4 Comparison of Average Strip Moments Thin-Plate Formulation
Load Case Moment Direction Strip
SAFE Average Strip Moments (kip-in/in)
Theoretical Average Strip
Moments (kip-in/in) 4×4 Mesh 8×8 Mesh 12×12 Mesh
UL
AMx = 180"
Column 0.758 0.800 0.805 0.810
Middle 1.843 1.819 1.819 1.820
BM
y = 120"
Column 0.974 0.989 0.992 0.994
Middle 2.701 2.769 2.781 2.792
PL
AMx = 180"
Column 0.992 0.958 0.926 0.901
Middle 3.329 3.847 3.963 3.950
BM
y = 120"
Column 0.440 0.548 0.546 0.548
Middle 3.514 3.364 3.350 3.307
LL
AMx = 180"
Column 0.547 0.527 0.522 0.519
Middle 1.560 1.491 1.482 1.475
BM
y = 120"
Column 1.205 1.375 1.418 1.432
Middle 3.077 3.193 3.213 3.200
EXAMPLE 1 - 12

Software VerificationPROGRAM NAME: SAFE REVISION NO.: 0
Thick-Plate Formulation
Load Case Moment Direction Strip
SAFE Average Strip Moments (kip-in/in)
Theoretical Average Strip
Moments (kip-in/in) 4×4 Mesh 8×8 Mesh 12×12 Mesh
UL
AMx = 180"
Column 0.716 0.805 0.799 0.810
Middle 1.757 1.855 1.832 1.820
BM
y = 120"
Column 1.007 0.968 0.984 0.994
Middle 2.65 2.80 2.805 2.792
PL
AMx = 180"
Column 0.969 1.128 1.043 0.901
Middle 2.481 3.346 3.781 3.950
BM
y = 120"
Column 0.763 0.543 0.533 0.548
Middle 3.149 3.381 3.372 3.307
LL
AMx = 180"
Column 0.489 0.526 0.517 0.519
Middle 1.501 1.520 1.493 1.475
BM
y = 120"
Column 1.254 1.338 1.408 1.432
Middle 2.840 3.205 3.233 3.200
EXAMPLE 1 - 13

Software Verification PROGRAM NAME: SAFEREVISION NO.: 0
Uniform Load
-40
-35
-30
-25
-20
-15
-10
-5
0
5
0 20 40 60 80 100 120 140 160
X Ordinates (Inches)
V 13 S
hear
s (x
10-3
kip
/in)
SAFE Thin Plate Analytical Thin Plate SAFE Thick Plate
Figure 1-4 V12 Shear Force for Uniform Loading
Uniform Load
-50
-40
-30
-20
-10
0
10
20
30
0 20 40 60 80 100 120 140 160
X Ordinates (Inches)
V 23 S
hear
s (x
10-3
kip
/in)
SAFE Thin Plate Analytical Thin Plate SAFE Thick Plate
Figure 1-5 V13 Shear Force for Uniform Loading
EXAMPLE 1 - 14

Software VerificationPROGRAM NAME: SAFE REVISION NO.: 0
Figure 1-6 Vmax for Uniform Load for Thin-Plate Formulation
Figure 1-7 Vmax for Uniform Load for Thick-Plate Formulation
EXAMPLE 1 - 15

Software Verification PROGRAM NAME: SAFEREVISION NO.: 0
Point Load
-20
-15
-10
-5
0
5
0 20 40 60 80 100 120 140 160
X Ordinates (Inches)
V 13 S
hear
s (x
10-3
kip
/in)
SAFE Thin Plate Analytical Thin Plate SAFE Thick Plate
Figure 1-8 V12 Shear Force for Point Loading
Point Load
-60
-50
-40
-30
-20
-10
0
10
20
30
0 20 40 60 80 100 120 140 160
X Ordinates (Inches)
V 23 S
hear
s (x
10-3
kip
/in)
SAFE Thin Plate Analytical Thin Plate SAFE Thick Plate
Figure 1-9 V13 Shear Force for Point Loading
EXAMPLE 1 - 16

Software VerificationPROGRAM NAME: SAFE REVISION NO.: 0
Figure 1-10 Vmax for Point Load for Thin-Plate Formulation
Figure 1-11 Vmax for Point Load for Thick-Plate Formulation
EXAMPLE 1 - 17

Software Verification PROGRAM NAME: SAFEREVISION NO.: 0
Line Load
-20
-15
-10
-5
0
5
0 20 40 60 80 100 120 140 160
X Ordinates (Inches)
V 13 S
hear
s (x
10-3
kip
/in)
SAFE Thin Plate Analytical Thin Plate SAFE Thick Plate
Figure 1-12 V12 Shear Force for Line Loading
Line Load
-40
-30
-20
-10
0
10
20
30
0 20 40 60 80 100 120 140 160
X Ordinates (Inches)
V 23 S
hear
s (x
10-3
kip
/in)
SAFE Thin Plate Analytical Thin Plate SAFE Thick Plate
Figure 1-13 V13 Shear Force for Point Loading
EXAMPLE 1 - 18

Software VerificationPROGRAM NAME: SAFE REVISION NO.: 0
Figure 1-14 Vmax for Line Load for Thin-Plate Formulation
Figure 1-15 Vmax for Line Load for Thick-Plate Formulation
EXAMPLE 1 - 19

Software Verification PROGRAM NAME: SAFEREVISION NO.: 0
COMPUTER FILE:S01a-Thin.FDB, S01b-Thin.FDB, S01c-Thin.FDB, S01a-Thick.FDB, S01b-Thick.FDB and S01c-Thick.FDB
CONCLUSION The SAFE results show an acceptable comparison with the independent results.
EXAMPLE 1 - 20

Software VerificationPROGRAM NAME: SAFE REVISION NO.: 0
EXAMPLE 2 Rectangular Plate with Fixed Edges
PROBLEM DESCRIPTION A fully fixed rectangular plate is analyzed for three load conditions. The geometric descriptions and material properties and the load cases are the same as those of Example 1. However, the boundary conditions are different. All edges are fixed, as shown in Figure 2-1. To test convergence, the problem is analyzed using three mesh sizes, as shown in Figure 1-2: 4 × 4, 8 × 8, and 12 × 12. The plate is modeled using plate elements available in SAFE. The fixed edges are modeled as line supports with large vertical and rotational stiffnesses. The self weight of the plate is not included in any of the load cases. The numerical data for this problem are given in the following section.
A theoretical solution to this problem, employing a single series (Lévy’s solution), is given in Timoshenko and Woinowsky (1959). The numerically computed deflections obtained from SAFE are compared with the theoretical values.
GEOMETRY, PROPERTIES AND LOADING Plate size a × b = 360" × 240" Plate thickness T = 8 inches Modulus of Elasticity E = 3000 ksi Poisson's ratio v = 0.3
Load Cases: (UL) Uniform load q = 100 psf (PL) Point load P = 20 kips (LL) Live load q1 = 1 kip/ft
EXAMPLE 2 - 1

Software Verification REVISION NO.: 0
(3)
(2)
(1)
(3) (2) (1)
q1
q1 P
P
y
q
a = 30 '
b =
20 '
x
(3)
(2)
(1)
(3) (2) (1)
q1
q1 P
P
y
q
a = 30 '
b =
20 '
x
Figure 2-1 Rectangular Plate with All Edges Fixed
TECHNICAL FEATURES OF SAFE TESTED Comparison of slab deflection with bench mark solution.
RESULTS COMPARISON The numerical displacements obtained from SAFE are compared with those obtained from the theoretical solution in Table 2-1. The theoretical results are based on tabular values given in Timoshenko and Woinowsky (1959). A comparison of deflections for the three load cases shows a fast convergence to the theoretical values with successive mesh refinement.
EXAMPLE 2 - 2
PROGRAM NAME: SAFE

Software VerificationPROGRAM NAME: SAFE REVISION NO.: 0
Table 2-1 Comparison of Displacements Thin Plate Formulation
Load Case
Location SAFE Displacement (in) Theoretical Displacement
(in) X (in) Y (in) 4×4 Mesh 8×8 Mesh 12×12 Mesh
UL
60 60 0.0098 0.0090 0.0089
60 120 0.0168 0.0153 0.0150
180 60 0.0237 0.0215 0.0210
180 120 0.0413 0.0374 0.0366 0.036036
PL
60 60 0.0065 0.0053 0.0052
60 120 0.0111 0.0100 0.0100
180 60 0.0315 0.0281 0.0272
180 120 0.0659 0.0616 0.0598 0.057453
LL
60 60 0.0079 0.0072 0.0071
60 120 0.0177 0.0161 0.0158
180 60 0.0209 0.0188 0.0184
180 120 0.0413 0.0375 0.0367
EXAMPLE 2 - 3

Software Verification PREVISION NO.: 0
Thick Plate Formulation
Load Case
Location SAFE Displacement (in) Theoretical Displacement
(in) X (in) Y (in) 4×4 Mesh 8×8 Mesh 12×12 Mesh
UL
60 60 0.0085 0.0093 0.0091
60 120 0.0147 0.0156 0.0154
180 60 0.0214 0.0219 0.0215
180 120 0.0397 0.0381 0.0374 0.036036
PL
60 60 0.0083 0.0056 0.0053
60 120 0.0169 0.0101 0.0102
180 60 0.0270 0.0283 0.0278
180 120 0.0545 0.0600 0.0605 0.057453
LL
60 60 0.0072 0.0073 0.0073
60 120 0.0149 0.0165 0.0163
180 60 0.0198 0.0191 0.0188
180 120 0.0399 0.0382 0.0375
COMPUTER FILE:S02a-Thin.FDB. S02b-Thin.FDB, S02c-Thin.FDB, S02a-Thick.FDB. S02b-Thick.FDB, and S02c-Thick.FDB
CONCLUSION The SAFE results show an acceptable comparison with the independent results.
EXAMPLE 2 - 4
PROGRAM NAME: SAFE

Software VerificationPROGRAM NAME: SAFE REVISION NO.: 0
EXAMPLE 3 Rectangular Plate with Mixed Boundary
PROBLEM DESCRIPTION The plate, shown in Figure 3-1, is analyzed for uniform load only. The edges along x = 0 and x = a are simply supported, the edge along y = b is free, and the edge along y = 0 is fully fixed. The geometrical description and material properties of this problem are the same as those of Example 1. To test convergence, the problem is analyzed employing three mesh sizes, as shown in Figure 1-2: 4 × 4, 8 × 8, and 12 × 12. The plate is modeled using plate elements available in SAFE. The two simply supported edges are modeled as line supports with large vertical stiffnesses. The fixed edge is modeled as a line support with large vertical and rotational stiffnesses. The self weight of the plate is not included in the analysis.
An explicit analytical expression for the deflected surface is given in Timoshenko and Woinowsky (1959). The deflections obtained from SAFE are compared with the theoretical values.
GEOMETRY, PROPERTIES AND LOADING Plate size a × b = 360" × 240" Plate thickness T = 8 inches Modulus of elasticity E = 3000 ksi Poisson's ratio v = 0.3 Load Cases:
Uniform load q = 100 psf
TECHNICAL FEATURES OF SAFE TESTED Comparison of deflection with bench-mark solution.
RESULTS COMPARISON The numerical solution obtained from SAFE is compared with the theoretical solution that is given by Lévy (Timoshenko and Woinowsky 1959). Comparison of deflections shows monotonic convergence to the theoretical values with successive mesh refinement as depicted in Table 3-1. It is to be noted that even with a coarse mesh (4 × 4) the agreement is very good.
EXAMPLE 3 - 1

Software Verification PROGRAM NAME: SAFEREVISION NO.: 0
Y
X
Y
X
Figure 3-1 Rectangular Plate with Two Edges Simply Supported, One Edge Fixed and One Edge Free
EXAMPLE 3 - 2

Software VerificationPROGRAM NAME: SAFE REVISION NO.: 0
Table 3-1 Comparison of Displacements Thin Plate Formulation
Location SAFE Displacement (in) Theoretical Displacement
(in) X (in) Y (in) 4×4 Mesh 8×8 Mesh 12×12 Mesh
180 0 0.0000 0.0000 0.0000 0.0000
180 60 0.0849 0.0831 0.0827 0.08237
180 120 0.2410 0.2379 0.2372 0.23641
180 180 0.3971 0.3947 0.3940 0.39309
180 240 0.5537 0.5511 0.5502 0.54908
Thick Plate Formulation
Location SAFE Displacement (in) Theoretical Displacement
(in) X (in) Y (in) 4×4 Mesh 8×8 Mesh 12×12 Mesh
180 0 0.0000 0.0000 0.0000 0.0000
180 60 0.0806 0.0841 0.0839 0.08237
180 120 0.2338 0.2398 0.2392 0.23641
180 180 0.3837 0.3973 0.3970 0.39309
180 240 0.5322 0.5544 0.5542 0.54908
COMPUTER FILE:S03a-Thin.FDB, S03b-Thin.FDB, S03c-Thin.FDB, S03a-Thick.FDB, S03b-Thick.FDB, and S03c-Thick.FDB
CONCLUSION The SAFE results show an acceptable comparison with the independent results.
EXAMPLE 3 - 3

Software Verification PROGRAM NAME: SAFE REVISION NO.: 0
EXAMPLE 4 Rectangular Plate on Elastic Beams
PROBLEM DESCRIPTION The plate, shown in Figure 4-1, is analyzed for a uniformly distributed surface load. The edges along x = 0 and x = a are simply supported, and the other two edges are supported on elastic beams. It is assumed that the beams resist bending in vertical planes only and do not resist torsion. A theoretical solution to this problem is given in Timoshenko and Woinowsky (1959). The deflections of the plate and the moments and shears of the edge beams are compared with both the theoretical solution and the results obtained using the Direct Design Method as outlined in ACI 318-95 for a relative stiffness factor, λ, equal to 4. The relative stiffness, λ, is the ratio of the bending stiffness of the beam and the bending stiffness of the slab with a width equal to the length of the beam and is given by the following equation.
λ = aDEIb , where,
D = ( )2
3
112 vEh−
,
Ib is the moment of inertia of the beam about the horizontal axis,
a is the length of the beam, which also is equal to the one side of the slab, and
h is the thickness of the slab.
To test convergence of results, the problem is analyzed employing three mesh sizes, as shown in Figure 1-2: 4 × 4, 8 × 8, and 12 × 12. The slab is modeled using plate elements. The simply supported edges are modeled as line supports with a large vertical stiffness and zero rotational stiffness. Beam elements, with no torsional rigidity, are defined on edges y = 0 and y = b. The flexural stiffness of edge beams is expressed as a λ factor of the plate flexural stiffness.
EXAMPLE 4 - 1

Software Verification PROGRAM NAME: SAFEREVISION NO.: 0
The subdivision of the plate into column and middle strips and also the definition of tributary loaded areas for shear calculations comply with ACI 318-95 provisions and shown in Figure 4-2. A load factor of unity is used and the self weight of the plate is not included in the analysis.
Y
X
Y
X
Y
X
Figure 4-1 Rectangular Plate on Elastic Beams
EXAMPLE 4 - 2

Software VerificationPROGRAM NAME: SAFE REVISION NO.: 0
Tributary Loaded Area for Shear on Edge Beams
Definition of Strips
Edge Beam
Edge Beam
Plate
Column Strip
MIddle Strip
Column Strip
120"
120"
120"
b = 240"
1 = 240"
a = 360"
Tributary Loaded Area for Shear on Edge Beams
Definition of Strips
Edge Beam
Edge Beam
Plate
Column Strip
MIddle Strip
Column Strip
120"
120"
120"
b = 240"
1 = 240"
a = 360"
Figure 4-2 Definition of Slab Strips and Tributary Areas for Shear on Edge Beams
EXAMPLE 4 - 3

Software Verification PROGRAM NAME: SAFEREVISION NO.: 0
GEOMETRY, PROPERTIES AND LOADING Plate size a × b = 360" × 240" Plate thickness T = 8 inches Modulus of elasticity E = 3000 ksi Poisson's ration v = 0.3 Beam moment of inertia Ib = 4 Relative stiffness parameter λ = 4
Load Case: q = 100 psf (Uniform load)
TECHNICAL FEATURES OF SAFE TESTED Comparisons of deflection with benchmark solution.
RESULTS COMPARISON Table 4-1 shows monotonic convergence of SAFE deflections for λ = 4 to the theoretical values with successive mesh refinement. Table 4-2 shows the variation of bending moment in the edge beam along its length for λ = 4. The theoretical solution and the ACI approximation using the Direct Design Method also are shown.
The value of λ is analogous to the ACI ratio α1l2 / l1 (refer to Sections 13.6.4.4 and 13.6.5.1 of ACI 318-95). The correlation between the numerical results from SAFE and the theoretical results is excellent. For design purposes, the ACI approximation (Direct Design Method) compares well with the theory. For the Direct Design Method, the moments are obtained at the grid points. In obtaining SAFE moments, averaging was performed at the grid points.
In obtaining the ACI moments, the following quantities were computed:
α1 = EcbIb/EcsIs = 6.59375, l2/l1 = 240/360 = 0.667,
α1l2/l1 = 4.3958,
βt = 0, M0 = 2700 k-in.
From ACI section 13.6.4.4 for l2 / l1 = 0.667 and α1l2 / l1 = 4.3958, it is determined that the column strip supports 85% of the total positive moment. The beam and slab do not carry any negative moment about the Y-axis because of the simply supported boundary conditions at x = 0 and x = a.
EXAMPLE 4 - 4

Software VerificationPROGRAM NAME: SAFE REVISION NO.: 0
From ACI section 13.6.5.1 for α1l2 / l1 = 4.3958, it is determined that the beam carries 85% of the total column strip moment. Since one beam supports only one-half of the column strip, the maximum beam positive moment is as follows
Mpositivebeam = 0.85 × 0.85 × 0.5 × M0
= 0.36125 × 2700 = 975.375 k-in
The beam moments at other locations are obtained assuming a parabolic variation along the beam length.
Table 4-3 shows the variation of shear in edge beams for λ = 4. The agreement is good considering that the SAFE element considers shear strains and the theoretical solution does not. The ACI values are calculated based on the definition of loaded tributary areas given in Section 13.6.8.1 of ACI 318-95. The shear forces were obtained at the middle of the grid points. In obtaining SAFE shear, no averaging was required for the shear forces.
Table 4-1 Comparison of Displacements Thin Plate Formulation
Location SAFE Displacement (in) Theoretical Displacement
(in) X (in) Y (in) 4×4 Mesh 8×8 Mesh 12×12 Mesh
180 120 0.1812 0.1848 0.1854 0.18572
180 60 0.1481 0.1523 0.1530 0.15349
180 0 0.0675 0.0722 0.0730 0.07365
Thick Plate Formulation
Location SAFE Displacement (in) Theoretical Displacement
(in) X (in) Y (in) 4×4 Mesh 8×8 Mesh 12×12 Mesh
180 120 0.1792 0.1856 0.1862 0.18572
180 60 0.1467 0.1529 0.1536 0.15349
180 0 0.0677 0.0721 0.0730 0.07365
EXAMPLE 4 - 5

Software Verification PROGRAM NAME: SAFE REVISION NO.: 0
Table 4-2 Variation of Average Bending Moment in an Edge Beam (λ = 4) Thin Plate Formulation
Location Edge Beam Moment (k-in)
Y (in) X (in) 4×4 Mesh 8×8 Mesh 12×12 Mesh ACI Theoretical
0, 240
0 0.571 0.12 0.05 0 0
30 ― 313.0 ― 298.031 313.4984
60 590.8 591.4 591.5 541.875 591.6774
120 ― 984.9 ― 867.000 984.7026
180 1120.9 1120.8 1120.4 975.375 1120.1518
Thick Plate Formulation
Location Edge Beam Moment (k-in)
Y (in) X (in) 4×4 Mesh 8×8 Mesh 12×12 Mesh ACI Theoretical
0, 240
0 5.3 31.5 25.2 0 0
30 ― 309.2 ― 298.031 313.4984
60 591.0 586.8 592.1 541.875 591.6774
120 ― 981.3 ― 867.000 984.7026
180 1120.2 1116.4 1118.4 975.375 1120.1518
EXAMPLE 4 - 6

Software VerificationPROGRAM NAME: SAFE REVISION NO.: 0
Table 4-3 Variation of Shear in an Edge Beam (λ = 4) Thin Plate Formulation
Location Edge Beam Shear (k)
Y (in) X (in) 4×4 Mesh 8×8 Mesh 12×12 Mesh ACI Theoretical
0, 240
10 ― ― 10.58 9.9653 10.6122
15 ― 10.4 ― 9.9219 10.4954
30 9.80 ― 9.96 9.6875 9.9837
45 ―
9.26 ― 9.2969 9.2937
50 ― ―
9.02 9.1319 9.0336
80 ― ―
7.23 7.7778 7.2458
90 4.40 6.55 ― 7.1875 6.5854
120 ― ― 4.48 5.0000 4.4821
150 ― 2.26 ― 2.5000 2.2656
160 ― ― 1.51 1.6667 1.5133
EXAMPLE 4 - 7

Software Verification PROGRAM NAME: SAFEREVISION NO.: 0
Thick Plate Formulation Location Edge Beam Shear (k)
Y (in) X (in) 4×4 Mesh 8×8 Mesh 12×12 Mesh ACI Theoretical
0, 240
10 ― ― 8.04 9.9653 10.6122
15 ― 8.31 ― 9.9219 10.4954
30 9.59 ― 7.91 9.6875 9.9837
45 ―
7.57 ― 9.2969 9.2937
50 ― ―
7.43 9.1319 9.0336
80 ― ―
6.39 7.7778 7.2458
90 4.32 6.03 ― 7.1875 6.5854
120 ― ― 4.06 5.0000 4.4821
150 ― 2.08 ― 2.5000 2.2656
160 ― ― 1.38 1.6667 1.5133
COMPUTER FILE:S04a-Thin.FDB, S04b-Thin.FDB, S04c-Thin.FDB, S04a-Thick.FDB, S04b-Thick.FDB, and S04c-Thick.FDB
CONCLUSION The SAFE results show an acceptable comparison with the independent results.
EXAMPLE 4 - 8

Software VerificationPROGRAM NAME: SAFE REVISION NO.: 0
EXAMPLE 5 Infinite Flat Plate on Equidistant Columns
PROBLEM DESCRIPTION The plate, shown in Figure 5-1, is analyzed for uniform load. The overall dimensions of the plate are significantly larger than the column spacing (a and b in Figure 5-1). Analysis is limited to a single interior panel because it can be assumed that deformation is identical for all panels in the plate. An analytical solution, based on the foregoing assumption, is given in Timoshenko and Woinowsky (1959).
Three mesh sizes, as shown in Figure 1-2, are used to test the convergence property of the model: 4 × 4, 8 × 8, and 12 × 12. The model consists of a panel of uniform thickness supported at four corners point. The effect of column support within a finite area is not modeled. Due to symmetry, the slope of the deflection surface in the direction normal to the boundaries is zero along the edges and the shearing force is zero at all points along the edges of the panel, except at the corners. To model this boundary condition, line supports with a large rotational stiffness about the support line are defined on all four edges. Additional point supports are provided at the corners. The panel is modeled using plate elements in SAFE. In doing so, the effect of shear distortion is included.
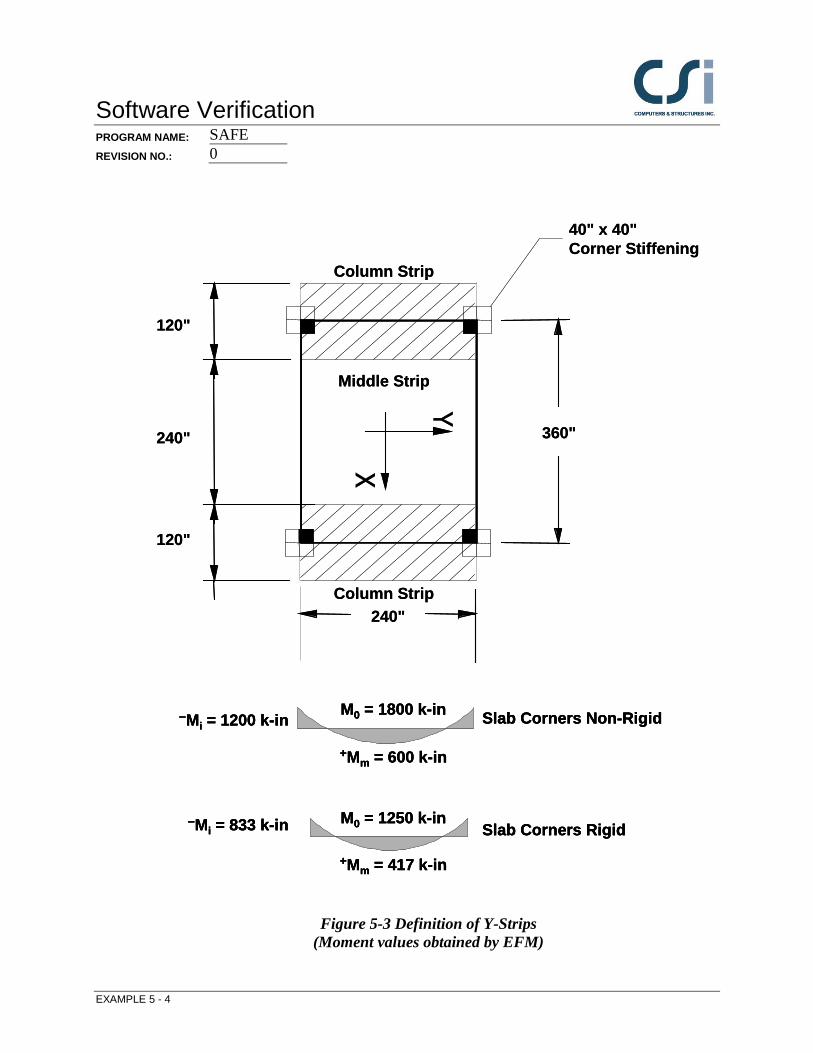
To compare the effects of corner stiffness at the column/slab intersection, a duplicate model of the 12 x 12 mesh was created where this region is approximately modeled. This was done by using a special stiff area section in the region concerned, shown as the 40" × 40" area in Figure 5-2, of which a 20” x 20” portion lies within the modeled region. To obtain design moments, the panel is divided into three strips both ways, two column strips and one middle strip, based on the ACI 318-95 definition of design strip widths, as shown in Figure 5-2 and in Figure 5-3. A load factor of unity is used. The self weight of the panel is not included in the analysis.
Tables 5-1 through 5-3 show the comparison of the numerically computed deflection, local moments, and local shears obtained from SAFE with their theoretical counterparts.
Table 5-4 shows the comparison of the average design strip moments obtained from SAFE with those obtained from the theoretical method and two ACI alternative methods: the Direct Design Method (DDM) and the Equivalent Frame Method (EFM).
EXAMPLE 5 - 1

Software Verification PROGRAM NAME: SAFEREVISION NO.: 0
Floor Plan
A Typical Bay
Point Support at Corner
Point Support at Corner
a = 30'
b =
20'
y
x
Point Support at Corner
Point Support at Corner
Floor Plan
A Typical Bay
Point Support at Corner
Point Support at Corner
a = 30'
b =
20'
y
x
Point Support at Corner
Point Support at Corner
Figure 5-1 Infinite Plate on Equidistant Columns and Detail of Panel used in Analysis
Material Properties and Load Modulus of Elasticity = 3000 ksi Poisson's Ratio = 0.3 Uniform Load = 100 psf
EXAMPLE 5 - 2

Software VerificationPROGRAM NAME: SAFE REVISION NO.: 0
Typical Interior Panel
Column Strip
Middle Strip
Column Strip
360"
240"
120"
120"
120"
40" x 40"Corner Stiffening
M0 = 2700 k-in
+Mm = 900 k-in
−Mi = 1800 k-in Slab Corners Non-Rigid
M0 = 2133 k-in
+Mm = 711 k-in
−Mi = 1422 k-in Slab Corners Rigid
Typical Interior Panel
Column Strip
Middle Strip
Column Strip
360"
240"
120"
120"
120"
40" x 40"Corner Stiffening
M0 = 2700 k-in
+Mm = 900 k-in
−Mi = 1800 k-in Slab Corners Non-RigidM0 = 2700 k-in
+Mm = 900 k-in
−Mi = 1800 k-in Slab Corners Non-Rigid
M0 = 2133 k-in
+Mm = 711 k-in
−Mi = 1422 k-in Slab Corners RigidM0 = 2133 k-in
+Mm = 711 k-in
−Mi = 1422 k-in Slab Corners Rigid
Figure 5-2 Definition of X-Strips (Moment values obtained by EFM)
EXAMPLE 5 - 3
Software Verification PROGRAM NAME: SAFEREVISION NO.: 0
360"240"
120"
240"
120"
40" x 40"Corner Stiffening
Column Strip
Middle Strip
Column Strip
M0 = 1800 k-in
+Mm = 600 k-in
−Mi = 1200 k-in Slab Corners Non-Rigid
M0 = 1250 k-in
+Mm = 417 k-in
−Mi = 833 k-in Slab Corners Rigid
360"240"
120"
240"
120"
40" x 40"Corner Stiffening
Column Strip
Middle Strip
Column Strip
M0 = 1800 k-in
+Mm = 600 k-in
−Mi = 1200 k-in Slab Corners Non-RigidM0 = 1800 k-in
+Mm = 600 k-in
−Mi = 1200 k-in Slab Corners Non-Rigid
M0 = 1250 k-in
+Mm = 417 k-in
−Mi = 833 k-in Slab Corners RigidM0 = 1250 k-in
+Mm = 417 k-in
−Mi = 833 k-in Slab Corners Rigid
Figure 5-3 Definition of Y-Strips (Moment values obtained by EFM)
EXAMPLE 5 - 4

Software VerificationPROGRAM NAME: SAFE REVISION NO.: 0
GEOMETRY, PROPERTIES AND LOADING Plate size a × b = 360" × 240" Plate thickness T = 8 inches Modulus of elasticity E = 3000 ksi Poisson's ration v = 0.3
Load Case: q = 100 psf (Uniform load)
TECHNICAL FEATURES OF SAFE TESTED Comparisons of deflection with benchmark solution.
RESULTS COMPARISON Table 5-1 shows the comparison of the numerical and the theoretical deflections. The data indicates monotonic convergence of the numerical solution to the theoretical values with successive mesh refinement.
The SAFE results for local moment and shear also compare closely with the theoretical values, as shown in Table 5-2 and Table 5-3, respectively.
In Table 5-4 average strip moments obtained from SAFE are compared with both the ACI and the theoretical values. EFM is used to calculate the interior span moments as depicted in Figure 5-2 and Figure 5-3. The agreement between the SAFE and the theoretical solution is excellent. ACI approximations, employing either DDM or EFM, however, deviate from the theory. It should be noted that, regardless of the method used, the absolute sum of positive and negative moments in each direction equals the total static moment in that direction.
Table 5-5 shows the effect of corner rigidity. Comparisons with the EFM method are shown.
EXAMPLE 5 - 5

Software Verification PROGRAM NAME: SAFEREVISION NO.: 0
Table 5-1 Comparison of Displacements
Thin Plate Formulation
Location SAFE Displacement (in) Theoretical Displacement
(in) X (in) Y (in) 4×4 Mesh 8×8 Mesh 12×12 Mesh
0 0 0.263 0.278 0.280 0.280
0 60 0.264 0.274 0.275 0.275
0 120 0.266 0.271 0.271 0.270
120 0 0.150 0.153 0.153 0.152
120 120 0.101 0.101 0.100 0.098
180 0 0.114 0.108 0.106 0.104
180 60 0.072 0.069 0.067 0.065
180 120 0.000 0.000 0.000 0.000
Thick Plate Formulation
Location SAFE Displacement (in) Theoretical Displacement
(in) X (in) Y (in) 4×4 Mesh 8×8 Mesh 12×12 Mesh
0 0 0.249 0.279 0.284 0.280
0 60 0.252 0.276 0.280 0.275
0 120 0.252 0.273 0.275 0.270
120 0 0.139 0.155 0.157 0.152
120 120 0.082 0.101 0.103 0.098
180 0 0.094 0.109 0.110 0.104
180 60 0.052 0.069 0.070 0.065
180 120 0.000 0.000 0.000 0.000
EXAMPLE 5 - 6

Software VerificationPROGRAM NAME: SAFE REVISION NO.: 0
Table 5-2 Comparison of Local Moments Thin Plate Formulation
Location
Moments (k-in/in)
M11 M22
X (in) Y (in) SAFE (8×8) Theoretical
SAFE (8×8) Theoretical
30 15 3.093 3.266 1.398 1.470
30 105 3.473 3.610 0.582 0.580
165 15 −2.948 −3.142 1.887 1.904
165 105 −9.758 −9.804 −7.961 −7.638
Thick Plate Formulation
Location
Moments (k-in/in)
M11 M22
X (in) Y (in) SAFE (8×8) Theoretical
SAFE (8×8) Theoretical
30 15 3.115 3.266 1.394 1.470
30 105 3.446 3.610 0.583 0.580
165 15 −2.977 −3.142 1.846 1.904
165 105 −9.686 −9.804 −7.894 −7.638
EXAMPLE 5 - 7

Software Verification PROGRAM NAME: SAFEREVISION NO.: 0
Table 5-3 Comparison of Local Shears Thin Plate Formulation
Location
Shears (×10−3 k)
V13 V23
X (in) Y (in) SAFE (8×8) Theoretical
SAFE (8×8) Theoretical
30 45 20.9 17.3 8.2 2.2
30 105 21.2 23.5 3.1 5.4
165 15 17.3 14.7 19.1 23.8
165 105 357.1 329.0 350.4 320.0
Thick Plate Formulation
Location
Shears (×10−3 k)
V13 V23
X (in) Y (in) SAFE (8×8) Theoretical
SAFE (8×8) Theoretical
30 45 20.2 17.3 8.7 2.2
30 105 24.3 23.5 8.1 5.4
165 15 26.7 14.7 24.7 23.8
165 105 287.5 329.0 277.6 320.0
EXAMPLE 5 - 8

Software VerificationPROGRAM NAME: SAFE REVISION NO.: 0
Table 5-4 Comparison of Average Strip Moments Thin Plate Formulation
Average Moment Location Strip
SAFE Moments (k-in/in)
Theoretical (k-in/in)
ACI 318-95 (k-in/in)
4 × 4 Mesh
8 × 8 Mesh
12 × 12 Mesh DDM EFM
AM x = 180" Column 4.431 3.999 3.922 3.859 4.725 4.500
Middle 4.302 3.805 3.711 3.641 3.150 3.000
AM x = 360" Column −10.184 −10.865 −10.971 −11.091 −10.968 −11.250
Middle −3.524 −3.777 −3.843 −3.891 −3.656 −3.750
BM y= 120"
Column 2.265 2.028 1.971 1.925 3.150 3.000
Middle 1.674 1.561 1.547 1.538 1.050 1.000
BM y = 240"
Column −8.236 −8.902 −9.000 −9.139 −7.313 −7.500
Middle −0.551 −0.449 −0.442 −0.430 −1.219 −1.250
Thick Plate Formulation
SAFE Moments (k-in/in)
ACI 318-95 (k-in/in)
Average Moment Location Strip
4 × 4 Mesh
8 × 8 Mesh
12 × 12 Mesh
Theoretical (k-in/in) DDM EFM
AM x = 180" Column 4.802 4.079 3.952 3.859 4.725 4.500
Middle 3.932 3.726 3.682 3.641 3.150 3.000
AM x = 360" Column −8.748 −10.691 −10.993 −11.091 −10.968 −11.250
Middle −4.965 −3.954 −3.823 −3.891 −3.656 −3.750
EXAMPLE 5 - 9

Software Verification PROGRAM NAME: SAFEREVISION NO.: 0
Thick Plate Formulation
SAFE Moments (k-in/in)
ACI 318-95 (k-in/in)
Average Moment Location Strip
4 × 4 Mesh
8 × 8 Mesh
12 × 12 Mesh
Theoretical (k-in/in) DDM EFM
BM y= 120"
Column 2.361 2.078 2.000 1.925 3.150 3.000
Middle 1.628 1.537 1.533 1.538 1.050 1.000
BM y = 240"
Column −6.321 −8.670 −9.025 −9.139 −7.313 −7.500
Middle −1.514 −0.567 −0.431 −0.430 −1.219 −1.250
Table 5-5 Comparison of Average Strip Moments : Effect of Corner Rigidity
Thin Plate Formulation
Average Moment Location Strip
SAFE Moments (12×12 Mesh)
(k-in/in)
ACI 318-95 (EFM Method)
(k-in/in)
Slab Corner Non-Rigid
Slab Corner Rigid
Slab Corner Non-Rigid
Slab Corner Rigid
AM x = 180" Column 3.922 3.472 4.500 3.555
Middle 3.711 3.285 3.000 2.370
AM x = 360" Column −10.971 −8.110 — −8.887
Middle −3.843 −2.863 — −2.962
BM y= 120"
Column 1.971 1.470 3.000 2.085
Middle 1.547 1.361 1.000 0.695
BM y = 240"
Column −4.807 −5.489 — −5.206
Middle −0.272 −0.347 — −0.867
EXAMPLE 5 - 10

Software VerificationPROGRAM NAME: SAFE REVISION NO.: 0
Thick Plate Formulation
Average Moment Location Strip
SAFE Moments (12×12 Mesh)
(k-in/in)
ACI 318-95 (EFM Method)
(k-in/in)
Slab Corner Non-Rigid
Slab Corner Rigid
Slab Corner Non-Rigid
Slab Corner Rigid
AM x = 180" Column 3.952 3.459 4.500 3.555
Middle 3.682 3.219 3.000 2.370
AM x = 360" Column −10.993 −8.249 — −8.887
Middle −3.823 −2.806 — −2.962
BM y= 120"
Column 2.000 1.456 3.000 2.085
Middle 1.533 1.327 1.000 0.695
BM y = 240"
Column −9.025 −5.742 — −5.206
Middle −0.431 −0.263 — −0.867
COMPUTER FILE:S05a-Thin.FDB, S05b-Thin.FDB, S05c-Thin.FDB, S05d.FDB, S05a-Thick.FDB, S05b-Thick.FDB, S05c-Thick.FDB, and S05d-Thick.FDB
CONCLUSION The SAFE results show an acceptable comparison with the independent results.
EXAMPLE 5 - 11

Software VerificationPROGRAM NAME: SAFE REVISION NO.: 0
EXAMPLE 6 Infinite Flat Plate on Elastic Subgrade
PROBLEM DESCRIPTION An infinite plate resting on elastic subgrade and carrying equidistant and equal loads, P, is shown in Figure 6-1. Each load is assumed to be distributed uniformly over the area u × v of a rectangle. A theoretical double series solution to this example is given in Timoshenko and Woinowsky (1959).
The numerically computed deflections and local moments obtained from SAFE are compared to the theoretical values, as shown in Table 6-1 and Table 6-2.
Analysis is confined to a single interior panel. To model the panel, three mesh sizes, as shown in Figure 1-2, are used: 4 × 4, 8 × 8, and 12 × 12. The slab is modeled using plate elements and the elastic support is modeled as a surface support with a spring constant of k, the modulus of subgrade reaction. The edges are modeled as line supports with a large rotational stiffness about the support line. Point loads P/4 are defined at the panel corners. In the theoretical formulation (Timoshenko and Woinowsky 1959), each column load P is assumed to be distributed over an area u × v of a rectangle, as shown in Figure 6-1. To apply the theoretical formulation to this problem, concentrated corner loads are modeled as a uniformly distributed load acting over a very small rectangular area where u and v are very small.
GEOMETRY, PROPERTIES AND LOADING Plate size a × b = 360" × 240" Plate thickness T = 15 inches Modulus of elasticity E = 3000 ksi Poisson's ratio v = 0.2 Modulus of subgrade reaction k = 1 ksi/in
Loading: Point Load P = 400 kips (assumed to be uniformly distributed over an area u × v)
EXAMPLE 6 - 1

Software Verification PROGRAM NAME: SAFEREVISION NO.: 0
A Typical Panel
FLOOR PLAN
a = 30'
b =
20'
T = 15" 2u2u
2v
2v
X
Y
k
Puv
Puv
Puv
2u
2u (Typ.)
(Typ.)
2v
2v
A Typical Panel
FLOOR PLAN
a = 30'
b =
20'
T = 15" 2u2u
2v
2v
X
Y
k
Puv
Puv
Puv
2u
2u (Typ.)
(Typ.)
2v
2v
Figure 6-1 Rectangular Plate on Elastic Subgrade
EXAMPLE 6 - 2

Software VerificationPROGRAM NAME: SAFE REVISION NO.: 0
TECHNICAL FEATURES OF SAFE TESTED Comparison of deflection on elastic foundation.
RESULTS COMPARISON Good agreement has been found between the numerical and theoretical deflection for k = 1 ksi/in, as shown in Table 6-1, except near the concentrated load. The consideration of shear strains in the SAFE element makes it deflect more near the concentrated load. As the modulus k is changed, the distribution of pressure between the plate and the subgrade changes accordingly. The particular case, as k approaches 0, corresponds to a uniformly distributed subgrade reaction, i.e., to the case of a “reversed flat slab” uniformly loaded with q = P/ab. In fact the problem changes to that of Example 5, with the direction of vertical axis reversed. In Example 5, for a uniform load of 100 psf (P = 60 kips), the maximum relative deflection is calculated as 0.280. Applying the formulation used here with k = 1 × 10⁻⁶ yields a deflection value of 0.279". Table 6-2 shows the comparison of the SAFE local moments using the 12 × 12 mesh with the theoretical results. The results agree well.
Table 6-1 Comparison of Displacements Thin Plate Formulation
Location SAFE Displacement (in) Theoretical Displacement
(in) X (in) Y (in) 4×4 Mesh 8×8 Mesh 12×12 Mesh
0 0 −0.0493 −0.05410 −0.05405 −0.05308
180 60 0.00091 0.00076 0.00080 0.00096
180 120 0.00040 0.00060 0.00064 0.00067
Thick Plate Formulation
Location SAFE Displacement (in) Theoretical Displacement
(in) X (in) Y (in) 4×4 Mesh 8×8 Mesh 12×12 Mesh
0 0 −0.0436 −0.06011 −0.06328 −0.05308
180 60 0.00130 0.00074 0.00076 0.00096
180 120 −0.0019 0.00050 0.00059 0.00067
EXAMPLE 6 - 3

Software Verification PROGRAM NAME: SAFEREVISION NO.: 0
Table 6-2 Comparison of Local Moments Thin Plate Formulation
Location
Moments (kip-in/in)
M11 M22
X (in) Y (in) SAFE (12×12) Theoretical
SAFE (12×12) Theoretical
10 10 37.99 35.97 37.97 35.56
10 50 7.38 7.70 −6.74 −6.87
10 110 −0.30 −0.27 −5.48 −5.69
80 10 −6.52 −6.89 1.98 1.72
80 50 −3.58 −3.78 −0.93 −1.02
80 110 −0.88 −0.98 −1.86 −1.69
Thick Plate Formulation
Location
Moments (kip-in/in)
M11 M22
X (in) Y (in) SAFE (12×12) Theoretical
SAFE (12×12) Theoretical
10 10 36.77 35.97 36.73 35.56
10 50 7.13 7.70 −6.37 −6.87
10 110 −0.21 −0.27 −5.17 −5.69
80 10 −6.11 −6.89 2.05 1.72
80 50 −3.56 −3.78 −0.82 −1.02
80 110 −0.87 −0.98 −1.86 −1.69
EXAMPLE 6 - 4

Software VerificationPROGRAM NAME: SAFE REVISION NO.: 0
COMPUTER FILE:S06a-Thin.FDB, S06b-Thin.FDB, S06c-Thin.FDB, S06a-Thick.FDB, S06b-Thick.FDB and S06c-Thick.FDB
CONCLUSION The SAFE results show an acceptable comparison with the independent results.
EXAMPLE 6 - 5

Software VerificationPROGRAM NAME: SAFE REVISION NO.: 0
EXAMPLE 7 Skewed Plate with Mixed Boundary
PROBLEM DESCRIPTION A skewed plate under uniform load, as shown in Figure 7-1, is analyzed for two different support configurations. In the first case, all the edges are assumed to be simply supported. In the second case, the edges y = 0 and y = b are released, i.e., the plate is assumed to be supported on its oblique edges only. A theoretical solution to this problem is given in Timoshenko and Woinowsky (1959). In both cases, the maximum deflection and the maximum moment are compared with the corresponding theoretical values.
An 8 × 24 base mesh is used to model the plate, as shown in Figure 7-1. A large vertical stiffness is defined for supports, and support lines are added on all four edges for the first case and along the skewed edges only for the second case. A load factor of unity is used. The self weight of the plate is not included in the analysis.
GEOMETRY, PROPERTIES, AND LOADING Plate size a × b = 480" × 240" Plate thickness T = 8 inches Modulus of elasticity E = 3,000 ksi Poisson’s ratio v = 0.2
Load Cases: Uniform load, q = 100 psf
TECHNICAL FEATURES OF SAFE TESTED
Comparison of deflection and moments on skewed plate.
EXAMPLE 7 - 1

Software Verification PROGRAM NAME: SAFEREVISION NO.: 0
Geometry
XY
Mesh
16 @ 2.5'8 @ 2.5'
8 @ 2.5'
20'
20'
40'
Geometry
XY
XY
Mesh
16 @ 2.5'8 @ 2.5'
8 @ 2.5'
20'
20'
40'
Support Conditions: (1) Simply supported on all edges(2) Simply supported on oblique edges
Figure 7-1 Skew Plate
EXAMPLE 7 - 2

Software VerificationPROGRAM NAME: SAFE REVISION NO.: 0
RESULTS COMPARISON Under the simply supported boundary condition, maximum deflection occurs at the plate center and the maximum principal moment acts nearly in the direction of the short span. Under the simply supported condition on the oblique edges and free boundary conditions on the other two edges, maximum deflection occurs at the free edge as expected.
Table 7-1 Comparison of Deflections and Bending Moments Boundary Condition
Responses SAFE Theoretical
Thin Plate
Thick Plate
Simply supported on all edges
Maximum displacement (inches) 0.156 0.160 0.162
Maximum bending moment (k-in) 3.66 3.75 3.59
Simply supported on oblique edges
Maximum displacement at the free edges (in) 1.51 1.52 1.50
Maximum bending moment of the free edges (k-in) 12.03 12.28 11.84
Simply supported on oblique edges
Displacement at the center (in) 1.21 1.23 1.22
Maximum bending moment at the center (k-in) 11.78 11.81 11.64
COMPUTER FILES S07a-Thin.FDB, S07b-Thin.FDB, S07a-Thick.FDB and S07b-Thick.FDB
CONCLUSION The comparison of SAFE and the theoretical results is acceptable, as shown in Table 7-1.
EXAMPLE 7 - 3

Software VerificationPROGRAM NAME: SAFE REVISION NO.: 0
EXAMPLE 8 ACI Handbook Flat Slab Example 1
PROBLEM DESCRIPTION The flat slab system, arranged three-by-four, is shown in Figure 8-1. The slab consists of twelve 7.5-inch-thick 18' × 22' panels. Edge beams on two sides extend 16 inches below the slab soffit. Details are shown in Figure 8-2. There are three sizes of columns and in some locations, column capitals. Floor to floor heights below and above the slab are 16 feet and 14 feet respectively. A full description of this problem is given in Example 1 of ACI 340.R-97 (ACI Committee 340, 1997). The total factored moments in an interior E-W design frame obtained from SAFE are compared with the corresponding results obtained by the Direct Design Method, the Modified Stiffness Method, and the Equivalent Frame Method.
The computational model uses a 10 × 10 mesh of elements per panel, as shown in Figure 8-3. The mesh contains gridlines at column centerlines, column faces, and the edges of column capitals. The grid lines extend to the slab edges. The regular slab thickness is 7.5". A slab thickness of 21.5" is used to approximately model a typical capital. The slab is modeled using plate elements. The columns are modeled as point supports with vertical and rotational stiffnesses. Stiffness coefficients used in the calculation of support flexural stiffness are all reproduced from ACI Committee 340 (1997). Beams are defined on two slab edges, as shown in Figure 8-1.
The model is analyzed for a uniform factored load of 0.365 ksf (wu = 1.4wd + 1.7 wt) in total, including self weight. To obtain factored moments in an E-W interior design frame, the slab is divided into strips in the X-direction (E-W direction), as shown in Figure 8-4. An interior design frame consists of one column strip and two halves of adjacent middle strips.
EXAMPLE 8 - 1

Software Verification PROGRAM NAME: SAFEREVISION NO.: 0
No edge beams on lines D and 5
Edge beamEd
ge b
eam
Design Frame
S1 S4 S7
S2 S5 S8
S8S5S2
S3 S6 S9
3'-6"
3'-6"
2'-6"
4'-0"
4'-0"
18'-0"
18'-0"
18'-0"
18'-0"
22'-0" 22'-0" 22'-0"
A B C D
1
2
3
4
5
A A
No edge beams on lines D and 5
Edge beamEd
ge b
eam
Design Frame
S1 S4 S7
S2 S5 S8
S8S5S2
S3 S6 S9
3'-6"
3'-6"
2'-6"
4'-0"
4'-0"
18'-0"
18'-0"
18'-0"
18'-0"
22'-0" 22'-0" 22'-0"
A B C D
1
2
3
4
5
A A
Figure 8-1 Flat Slab from ACI Handbook
EXAMPLE 8 - 2

Software VerificationPROGRAM NAME: SAFE REVISION NO.: 0
22'-0"
19'-4"
22'-0"
18'-0"
22'-0"
18'-3"
Detail "a" Detail "b" Detail "c"
SECTION A—A
Col. 16"x18"
Col. 16"x18"
Col. 18"x18"
Col. 20"x20"
Col. 18"x18"
Col. 18"x18"
A B C D
22'-0"
19'-4"
22'-0"
18'-0"
22'-0"
18'-3"
Detail "a" Detail "b" Detail "c"
SECTION A—A
Col. 16"x18"
Col. 16"x18"
Col. 18"x18"
Col. 20"x20"
Col. 18"x18"
Col. 18"x18"
A B C D
Detail "a" Detail "b" Detail "c"
28"16"
23.5"
12"
48"18"
14"
20"
7.5"
30"18"
A B D
Detail "a" Detail "b" Detail "c"
28"16"
23.5"
12"
48"18"
14"
20"
7.5"
30"18"
A B D
Figure 8-2 Sections and Details of ACI Handbook Flat Slab Example
EXAMPLE 8 - 3

Software Verification PROGRAM NAME: SAFEREVISION NO.: 0
Figure 8-3 SAFE Mesh (10 × 10 per panel)
EXAMPLE 8 - 4

Software VerificationPROGRAM NAME: SAFE REVISION NO.: 0
Interior Column StripMiddle Strip
Exterior Column Strip
Interior Design Frame
Exterior Design Frame
18'-0"
9'-8"
5'-3"
7 @ 9'-0"
5'-2"
1
2
3
4
5
A B C D
Interior Column StripMiddle Strip
Exterior Column Strip
Interior Design Frame
Exterior Design Frame
18'-0"
9'-8"
5'-3"
7 @ 9'-0"
5'-2"
1
2
3
4
5
A B C D
Figure 8-4 Definition of E-W Design Frames and Strips
EXAMPLE 8 - 5

Software Verification PROGRAM NAME: SAFEREVISION NO.: 0
Figure 8-5 Comparison of Total Factored Moments (E-W Design Frame)
EXAMPLE 8 - 6

Software VerificationPROGRAM NAME: SAFE REVISION NO.: 0
GEOMETRY, PROPERTIES AND LOADING Materials:
Concrete strength fc' = 3 ksi Yield strength of steel fy = 40 ksi Concrete unit weight γc = 150 pcf Modulus of elasticity Ec = 3320 ksi Poisson's ratio v = 0.2
TECHNICAL FEATURES OF SAFE TESTED Comparison of factored moments in slab.
RESULTS COMPARISON The SAFE results for the total factored moments in an interior E-W design frame are compared in Figure 8-5 with the results obtained by the Direct Design Method (DDM), the Modified Stiffness Method (MSM), and the Equivalent Frame Method (EFM). Only uniform loading with load factors of 1.4 and 1.7 has been considered. The DDM, MSM, and EFM results are all reproduced from Example 1 of ACI Committee 340 (1997), the Alternative Example 1 of ACI Committee 340 (1991), and from Example 3 of ACI Committee 340 (1991), respectively. Moments reported are calculated at the face of column capitals. Overall, they compare well. A noticeable discrepancy is observed in the negative column moment in the west side of the exterior bay (the edge beam side). In contrast to the EFM, the DDM appears to underestimate this moment. The SAFE result are between the two extreme values. The basic cause of this discrepancy is the way in which each method accounts for the combined flexural stiffness of columns framing into the joint. The DDM uses a stiffness coefficient kc of 4 in the calculation of column and slab flexural stiffnesses. The EFM, on the other hand, uses higher value of kc to allow for the added stiffness of the capital and the slab-column joint. The use of MSM affects mainly the exterior bay moments, which is not the case when the DDM is employed. In SAFE, member contributions to joint stiffness are dealt with more systematically than any of the preceding approaches. Hence, the possibility of over designing or under designing a section is greatly reduced.
The factored strip moments are compared in Table 8-1. There is a discrepancy in the end bays, particularly on the edge beam (west) side, where the SAFE and EFM results for exterior negative column strip moment show the greatest difference. This is expected because EFM simplifies a 3D structure to a 2D structure, thereby neglecting the transverse interaction between adjacent strips. Except for this localized difference, the comparison is good.
EXAMPLE 8 - 7

Software Verification PROGRAM NAME: SAFEREVISION NO.: 0
Table 8-1 Comparison of Total Factored Strip Moments (k-ft) (Interior E-W Design Frame)
Strip Method
Factored Strip Moment (k-ft)
Span AB Span BC Span CD
−M +M −M −M +M −M −M +M −M
Column Strip
DDM 86 92 161 130 56 130 143 85 71
MSM 122 83 157 130 56 130 140 72 117
EFM 140 83 157 144 44 145 161 62 125
SAFE 69 85 159 128 58 121 138 72 88
Middle Strip
DDM 6 62 54 43 37 43 48 57 0
MSM 10 55 52 43 37 43 46 48 0
EFM 10 55 53 48 29 48 54 41 0
SAFE 7 78 62 51 48 46 52 62 13
COMPUTER FILE:S08.FDB
CONCLUSION The SAFE results show an acceptable comparison with the independent results.
EXAMPLE 8 - 8
Software VerificationPROGRAM NAME: SAFE REVISION NO.: 0
EXAMPLE 9 ACI Handbook Two-Way Slab Example 2
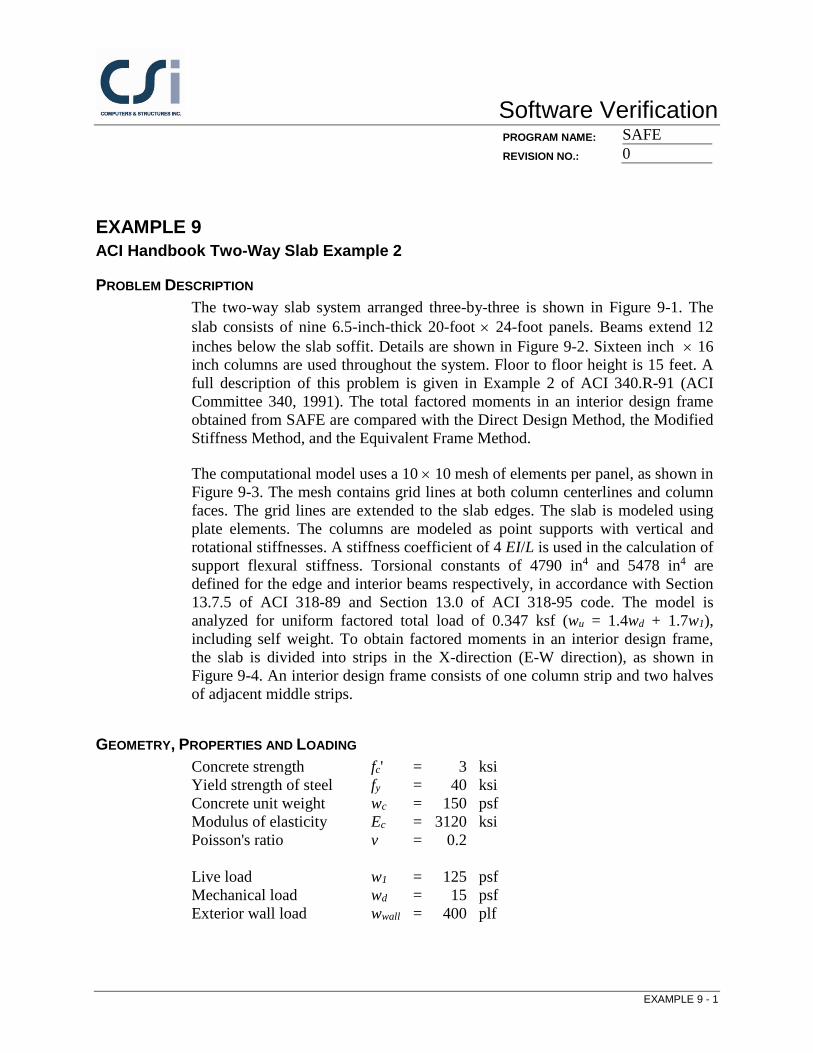
PROBLEM DESCRIPTION The two-way slab system arranged three-by-three is shown in Figure 9-1. The slab consists of nine 6.5-inch-thick 20-foot × 24-foot panels. Beams extend 12 inches below the slab soffit. Details are shown in Figure 9-2. Sixteen inch × 16 inch columns are used throughout the system. Floor to floor height is 15 feet. A full description of this problem is given in Example 2 of ACI 340.R-91 (ACI Committee 340, 1991). The total factored moments in an interior design frame obtained from SAFE are compared with the Direct Design Method, the Modified Stiffness Method, and the Equivalent Frame Method.
The computational model uses a 10 × 10 mesh of elements per panel, as shown in Figure 9-3. The mesh contains grid lines at both column centerlines and column faces. The grid lines are extended to the slab edges. The slab is modeled using plate elements. The columns are modeled as point supports with vertical and rotational stiffnesses. A stiffness coefficient of 4 EI/L is used in the calculation of support flexural stiffness. Torsional constants of 4790 in4 and 5478 in4 are defined for the edge and interior beams respectively, in accordance with Section 13.7.5 of ACI 318-89 and Section 13.0 of ACI 318-95 code. The model is analyzed for uniform factored total load of 0.347 ksf (wu = 1.4wd + 1.7w1), including self weight. To obtain factored moments in an interior design frame, the slab is divided into strips in the X-direction (E-W direction), as shown in Figure 9-4. An interior design frame consists of one column strip and two halves of adjacent middle strips.
GEOMETRY, PROPERTIES AND LOADING Concrete strength fc' = 3 ksi Yield strength of steel fy = 40 ksi Concrete unit weight wc = 150 psf Modulus of elasticity Ec = 3120 ksi Poisson's ratio v = 0.2
Live load w1 = 125 psf Mechanical load wd = 15 psf Exterior wall load wwall = 400 plf
EXAMPLE 9 - 1

Software Verification PROGRAM NAME: SAFEREVISION NO.: 0
20'-0" 20'-0" 20'-0"
A
24'-0"
B C D
Column16"x16"(Typ.)24'-0"
24'-0"
1
2
3
4
A A
20'-0" 20'-0" 20'-0"
A
24'-0"
B C D
Column16"x16"(Typ.)24'-0"
24'-0"
1
2
3
4
A A
Figure 9-1 ACI Handbook Two-Way Slab Example
EXAMPLE 9 - 2

Software VerificationPROGRAM NAME: SAFE REVISION NO.: 0
Detail 'a' Detail 'b'
SECTION A-A
Col. 16"x16"(Typ.)
20'-0" 20'-0" 20'-0"
Detail 'a' Detail 'b'
22"16"
18.5"
10"
16"
6.5"
12" 12"
BA
Detail 'a' Detail 'b'
SECTION A-A
Col. 16"x16"(Typ.)
20'-0" 20'-0" 20'-0"
Detail 'a' Detail 'b'
22"16"
18.5"
10"
16"
6.5"
12" 12"
BA
Figure 9-2 Details of Two-Way Slab Example from ACI Handbook
EXAMPLE 9 - 3

Software Verification PROGRAM NAME: SAFEREVISION NO.: 0
Figure 9-3 SAFE Mesh (10 × 10 per panel)
EXAMPLE 9 - 4

Software VerificationPROGRAM NAME: SAFE REVISION NO.: 0
Interior Column StripMiddle Strip
Exterior Column Strip
Interior Design Frame
Exterior Design Frame
24' - 0"
12' - 8"
14' - 0"
14' - 0"
14' - 0"
10' - 0"
10' - 0"
5' - 8"
5' - 8"
A B C D
1
2
3
4
Interior Column StripMiddle Strip
Exterior Column Strip
Interior Design Frame
Exterior Design Frame
24' - 0"
12' - 8"
14' - 0"
14' - 0"
14' - 0"
10' - 0"
10' - 0"
5' - 8"
5' - 8"
A B C D
1
2
3
4
Figure 9-4 Definition of E-W Design Frames and Strips
EXAMPLE 9 - 5

Software Verification PROGRAM NAME: SAFEREVISION NO.: 0
Figure 9-5 Comparison of Total Factored Moments (k-ft) in an Interior E-W Design Frame
EXAMPLE 9 - 6

Software VerificationPROGRAM NAME: SAFE REVISION NO.: 0
TECHNICAL FEATURES OF SAFE TESTED Calculation of factored moments in slab.
RESULTS COMPARISON The SAFE results for the total factored moments in an interior E-W design frame are compared with the results obtained by the Direct Design Method (DDM), the Modified Stiffness Method (MSM), and the Equivalent Frame Method (EFM) as shown in Figure 9-5. The results are for uniform loading with load factors. The results are reproduced from ACI Committee 340 (1991). Moments reported are calculated at the column face. For all practical purposes they compare well. At the end bays, the MSM appears to overestimate the exterior column negative moments with the consequent reduction in the mid-span moments.
The distribution of total factored moments to the beam, column strip, and middle strip is shown in Table 9-1. The middle strip moments compare well. The total column strip moments also compare well. The distribution of the column strip moments between the slab and the beam has a larger scatter.
EXAMPLE 9 - 7

Software Verification PROGRAM NAME: SAFEREVISION NO.: 0
Table 9-1 Comparison of Total Factored Moments (kip-ft)
Strip Method
Total Factored Moments in an E-W Design Frame(kip-ft)
Exterior Span Interior Span
−M +M −M −M +M −M
Slab Column
Strip
DDM 9 23 28 25 14 25
MSM 13 21 28 25 14 25
EFM 12 21 30 27 11 27
SAFE 22 27 62 58 14 58
Slab Middle Strip
DDM 3 69 84 76 41 76
MSM 5 63 84 76 41 76
EFM 4 63 89 82 34 82
SAFE 6 71 73 73 49 73
Beam
DDM 50 129 160 143 77 143
MSM 72 121 160 143 77 143
EFM 68 119 169 156 66 156
SAFE 62 102 141 122 60 122
COMPUTER FILE:S09.FDB
CONCLUSION The SAFE results show an acceptable comparison with the independent results.
EXAMPLE 9 - 8

Software VerificationPROGRAM NAME: SAFE REVISION NO.: 0
EXAMPLE 10 PCA Flat Plate Test
PROBLEM DESCRIPTION This example models the flat plate structure tested by the Portland Cement Association (Guralnick and LaFraugh 1963). The structure consists of nine 5.25-inch-thick 15-foot × 15-foot panels arranged 3 × 3, as shown in Figure 10-1. Deep and shallow beams are used on the exterior edges. The structure is symmetric about the diagonal line through columns A1, B2, C3, and D4, except the columns themselves are not symmetric about this line. The corner columns are 12 inches × 12 inches and the interior columns are 18 inches × 18 inches. Columns along the edges are 12 inches × 18 inches, with the longer dimension parallel to the plate edge. A typical section of the plate and details of edge beams are given in Figure 10-2. The total moments in an interior frame obtained numerically from SAFE are compared with the test results and the numerical values obtained by the Equivalent Frame Method (EFM).
A finite element model, shown in Figure 10-3, with 6 × 6 mesh per panel is employed in the analysis. The slab is modeled using the plate elements in SAFE. The columns are modeled as point supports with vertical and rotational stiffnesses. The reduced-height columns in the test structure are fixed at the base. Hence, rotational stiffnesses of point supports are calculated using a stiffness coefficient of 4 and an effective height of 39.75 inches (Kc = 4EI / lc). In order to account for rigidity of the slab-column joint, the portion of slab occupying the column area is modeled as rigid by using a special stiff area element. A total uniformly distributed design load of 156 psf (not factored) is applied to all the panels.
To obtain design moment coefficients, the plate is divided into column and middle strips. An interior design frame consists of one column strip and half of each adjacent middle strip. Normalized values of design moments are used in the comparison.
EXAMPLE 10 - 1

Software Verification PROGRAM NAME: SAFEREVISION NO.: 0
Design FrameShallow Beam Side
Design FrameDeep Beam Side
Deep Beam 6" x 15 ¾"
Shallow Beam 12" x 8 ¼"15'−0" 15'−0" 15'−0"
12" 18" 12"18"
12"
18"
18"
15'−0"
15'−0"
15'−0"
Shal
low
Bea
m 1
2" x
8 ¼
"
Dee
p B
eam
6"
x 15
¾"
12"
AA
A B C D
1
2
3
4
Design FrameShallow Beam Side
Design FrameDeep Beam Side
Deep Beam 6" x 15 ¾"
Shallow Beam 12" x 8 ¼"15'−0" 15'−0" 15'−0"
12" 18" 12"18"
12"
18"
18"
15'−0"
15'−0"
15'−0"
Shal
low
Bea
m 1
2" x
8 ¼
"
Dee
p B
eam
6"
x 15
¾"
12"
AA
A B C D
1
2
3
4
Figure 10-1 PCA Flat Plate Example
EXAMPLE 10 - 2

Software Verification PROGRAM NAME: SAFE REVISION NO.: 0
SECTION A-AAnchor Bolts
Deep BeamShallow Beam
2'−9"
12"12" 18" 18"
15'−0"15'−0"15'−0"
15 ¾"
3' −3 ¾"5 ¼"
8 ¼"
A B C D
SECTION A-AAnchor Bolts
Deep BeamShallow Beam
2'−9"
12"12" 18" 18"
15'−0"15'−0"15'−0"
15 ¾"
3' −3 ¾"5 ¼"
8 ¼"
A B C D
Figure 10-2 Section and Details of PCA Flat Plate Example
Figure 10-3 SAFE Mesh (6 × 6 per panel)
EXAMPLE 10 - 3

Software Verification PROGRAM NAME: SAFEREVISION NO.: 0
GEOMETRY, PROPERTIES AND LOADING Concrete strength fc' = 4.1 ksi Yield strength of steel fy = 40 ksi Concrete unit weight wc = 150 pcf Modulus of elasticity Ec = 3670 ksi Poisson's ratio v = 0.2
Live load w1 = 70 psf Dead load wd = 86 psf
TECHNICAL FEATURES OF SAFE TESTED Calculation of factored forces in slab.
RESULTS COMPARISON The SAFE results for the total non-factored moments in an interior frame are compared with test results and the Equivalent Frame Method (EFM). The test and EFM results are all obtained from Corley and Jirsa (1970). The moments are compared in Table 10-1. The negative design moments reported are at the faces of the columns. Overall, the agreement between the SAFE and EFM results is good. The experimental negative moments at exterior sections, however, are comparatively lower. This may be partially the result of a general reduction of stiffness due to cracking in the beam and column connection at the exterior column, which is not accounted for in an elastic analysis. It is interesting to note that even with an approximate representation of the column flexural stiffness, the comparison of negative exterior moments between EFM and SAFE is excellent.
EXAMPLE 10 - 4

Software VerificationPROGRAM NAME: SAFE REVISION NO.: 0
Table 10-1 Comparison of Measured and Computer Moments
Method
Moments in an Interior Design Frame (M / Wl1 *)
End Span (Shallow Beam Side) Middle Span End Span
(Deep Beam Side)
−M +M −M −M +M −M −M +M −M
PCA Test 0.037 0.047 0.068 0.068 0.031 0.073 0.073 0.042 0.031
EFM 0.044 0.048 0.067 0.062 0.038 0.062 0.068 0.049 0.043
SAFE (Shallow Beam Slide) 0.040 0.051 0.069 0.062 0.041 0.062 0.068 0.052 0.039
SAFE (Deep Beam Slide) 0.040 0.051 0.068 0.062 0.041 0.062 0.068 0.052 0.039
* Wl1 = 526.5 kip-ft
COMPUTER FILE:S10.FDB
CONCLUSION The SAFE results show an acceptable comparison with the independent results.
EXAMPLE 10 - 5

Software VerificationPROGRAM NAME: SAFE REVISION NO.: 0
EXAMPLE 11 University of Illinois Flat Plate Test F1
PROBLEM DESCRIPTION This example models the flat plate structure tested at the University of Illinois by Hatcher, Sozen, and Siess (1965). The structure consists of nine 1.75-inch-thick 5-foot × 5-foot panels arranged 3 × 3 as shown in Figure 11-1. Two adjacentedges are supported by 2.00-inch-wide × 5.25-inch-deep beams and the other twoedges by shallow beams, 4 inches wide by 2.75 inches deep, producing a singlediagonal line of symmetry through columns A1, B2, C3, and D4. A typicalsection and details of columns and edge beams are shown in Figure 11-2. Themoments computed numerically using SAFE are compared with the test resultsand the EFM results.
The computational model uses a 6 × 6 mesh of elements per panel, as shown in Figure 11-3. The mesh contains grid lines at column centerlines as well as column faces. The slab is modeled using slab area elements and the columns are modeled as point supports with vertical and rotational stiffnesses. The reduced-height columns in the test structure are pinned at the base. Hence, an approximate value of 3(Kc = 3EI/lc) is used to calculate flexural stiffness of the supports, taking the column height as 9.5 inches. In order to account for rigidity of the slab-column joint, the portion of slab occupying the column area is modeled as rigid by using a special stiff area element. Shallow and deep beams are defined on the edges with properties derived from cross-section geometry. The model is analyzed for uniform total load of 140 psf.
To obtain maximum factored moments in an interior design frame, the plate is divided into columns and middle strips. An interior design frame consists of one column strip and half of each adjacent middle strip.
GEOMETRY, PROPERTIES AND LOADING
Material: Concrete strength f'c = 2.5 ksi Yield strength of steel fy = 36.7 ksi Modulus of elasticity Ec = 2400 ksi Poisson’s ratio v = 0.2
Loading: Total uniform load w = 140 psf
EXAMPLE 11 - 1

Software Verification PROGRAM NAME: SAFEREVISION NO.: 0
Figure 11-1 University of Illinois Flat Plate Test F1
EXAMPLE 11 - 2

Software VerificationPROGRAM NAME: SAFE REVISION NO.: 0
SECTION A-A
Shallow Beam Deep Beam
Side Col. 4"x 6" Interior Col. 6" sq. Corner Col. 4" sq.
4"6"6"4"
5'−0" 5'−0" 5'−0"
5¼"1¾"
2¾"11¼"
A B C D
SECTION A-A
Shallow Beam Deep Beam
Side Col. 4"x 6" Interior Col. 6" sq. Corner Col. 4" sq.
4"6"6"4"
5'−0" 5'−0" 5'−0"
5¼"1¾"
2¾"11¼"
A B C D
Figure 11-2 Sections and Details of University of Illinois Flat Plate Test F1
Figure 11-3 SAFE Mesh (6 × 6 per panel)
EXAMPLE 11 - 3

Software Verification PROGRAM NAME: SAFE REVISION NO.: 0 TECHNICAL FEATURES OF SAFE TESTED
Calculation frame moments for uniform loading.
RESULTS COMPARISON Table 11-1 shows the comparison of the SAFE results for uniform load moments for an interior frame with the experimental and EFM results. The experimental and EFM results are all obtained from Corley and Jirsa (1970).
Table 11-1 Comparison of Measured and Computed Moments
Method
Moments in an Interior Design Frame (M/Wl1 *)
End Span (Shallow Beam Side) Middle Span
End Span (Deep Beam Side)
−M +M −M -M +M −M −M +M −M
TEST F1 0.027 0.049 0.065 0.064 0.040 0.058 0.058 0.047 0.034
EFM 0.047 0.044 0.072 0.066 0.034 0.067 0.073 0.044 0.046
SAFE (Shallow Beam Side) 0.044 0.047 0.066 0.060 0.039 0.059 0.065 0.048 0.043
SAFE (Deep Beam Side) 0.043 0.047 0.064 0.059 0.039 0.058 0.064 0.047 0.042
* Wl1 = 17.5 kip-ft The negative design moments reported are at the faces of the columns. From a practical standpoint, even with a coarse mesh, the agreement between the SAFE and EFM results is good. In general the experimentally obtained moments at exterior sections are low, implying a loss of stiffness in the beam-column joint area.
In comparing absolute moments at a section, the sum of positive and average negative moments in the bay should add up to the total static moment. The SAFE and EFM results comply with this requirement within an acceptable margin of accuracy. The experimental results are expected to show greater discrepancy because of the difficulty in taking accurate strain measurements.
COMPUTER FILE: S11.FDB
CONCLUSION The SAFE results show an acceptable comparison with the independent results.
EXAMPLE 11 - 4

Software VerificationPROGRAM NAME: SAFE REVISION NO.: 0
EXAMPLE 12 University of Illinois Flat Slab Tests F2 and F3
PROBLEM DESCRIPTION This example models F2 and F3, the flat slab structures tested at the University of Illinois by Hatcher, Sozen, and Siess (1969) and Jirsa, Sozen, and Siess (1966) respectively. A typical structure used in tests F2 and F3 is shown in Figure 12-1. The fundamental difference between these two test structures is in the type of reinforcement used. In test F2, the slab is reinforced with medium grade reinforcement, whereas in test F3, welded wire fabrics are used. The structure consists of nine 5-foot × 5-foot panels arranged 3 × 3. Two adjacent edges are supported by deep beams, 2 inches wide by 6 inches deep, and the other two edges by shallow beams, 4.5 inches wide by 2.5 inches deep, producing a single diagonal line of symmetry through columns A1, B2, C3, and D4. A typical section and details of columns, drop panels, and column capitals are shown in Figure 12-2. For both structures, the numerical results obtained for an interior frame by SAFE are compared with the experimental results and the EFM results due to uniformly distributed load.
The computational model uses an 8 × 8 mesh of elements per panel, as shown in Figure 12-3. The mesh contains grid lines at the column centerlines as well as the edges of drop panels and interior column capitals. The slab thickness is increased to 2.5 inches over the drop panels. A thickness of 4.5 inches is used to approximately model the interior capitals. Short deep beams are used to model the edge column capitals. In this model, the slab is modeled using plate elements and the columns are modeled as point supports with vertical and rotational stiffnesses. A stiffness coefficient of 4.91 (Kc = 4.91EIc / lc) is used in the calculation of the support flexural stiffness based on a column height of 21.375 inches, measured from the mid-depth of the slab to the support center. Due to the presence of capitals, columns are treated as non-prismatic. Shallow and deep beams are defined on the edges with properties derived from their cross-section geometry.
The test problems use two different concrete moduli of elasticity, Ec = 2100ksi and Ec = 3700 ksi for the beams and slab. However, both test problems are modeled in SAFE with concrete modulus of elasticity of 2100 ksi. This affects the slab, beam, and column stiffness since the distribution of moment depends on the relative stiffness.
EXAMPLE 12 - 1

Software Verification PROGRAM NAME: SAFEREVISION NO.: 0
Deep Beam
Shallow Beam
Dee
p Be
am
Shal
low
Bea
m
Design FrameDeep Beam Side
Design FrameDeep Beam Side
5'−0" 5'−0" 5'−0"
5'−0"
5'−0"
5'−0"
A
A
A B C D
1
2
3
4Deep Beam
Shallow Beam
Dee
p Be
am
Shal
low
Bea
m
Design FrameDeep Beam Side
Design FrameDeep Beam Side
5'−0" 5'−0" 5'−0"
5'−0"
5'−0"
5'−0"
A
A
A B C D
1
2
3
4
Figure 12-1 University of Illinois Flat Slab Tests F2 and F3
The model is analyzed for uniform load. To obtain maximum factored moments in an interior design frame, the slab is divided into two interior and two exterior design frames spanning in the X direction (E-W direction). Because of symmetry, results are shown for X strips only. An interior design frame consists of one column strip and half of each adjacent middle strip.
EXAMPLE 12 - 2

Software VerificationPROGRAM NAME: SAFE REVISION NO.: 0
SECTION A−A
Shallow Beam Deep Beam
Corner Column3½" sq.
Interior Column3¾" sq.
Side Column3½" x 5"
1¾"
5'−0" 5'−0"5'−0"
2½"
A B C D
1'−10¼"
SECTION A−A
Shallow Beam Deep Beam
Corner Column3½" sq.
Interior Column3¾" sq.
Side Column3½" x 5"
1¾"
5'−0" 5'−0"5'−0"
2½"
A B C D
1'−10¼"
INTERIOR COLUMNS
Drop panel
Capital
20"12"
0.5"1.75"
1C = 17.375"22.25"
INTERIOR COLUMNS
Drop panel
Capital
20"12"
0.5"1.75"
1C = 17.375"22.25"
Figure 12-2 Sections and Details of Flat Slabs F2 and F3
EXAMPLE 12 - 3

Software Verification PROGRAM NAME: SAFEREVISION NO.: 0
Figure 12-3 SAFE Mesh (8 × 8 per mesh)
GEOMETRY, PROPERTIES AND LOADING
Concrete strength:
fc′ = 2.76 ksi (Test F2) fc′ = 3.76 ksi (Test F3)
Yield strength of slab reinforcement: fy = 49 ksi (Test F2) fy = 54 ksi (Test F3)
EXAMPLE 12 - 4

Software VerificationPROGRAM NAME: SAFE REVISION NO.: 0
Modulus of elasticity: Ec = 2100 ksi (Test F2) Ec = 3700 ksi (Test F3)
Poisson’s ratio:
ν = 0.2
Loading: Total uniform design load, w = 280 psf
TECHNICAL FEATURES OF SAFE TESTED Calculation frame moments.
RESULTS COMPARISON Table 12-1 shows the comparison of the SAFE results for moments in an interior frame with the experimental and EFM results for both structures F2 and F3. The experimental and EFM results are all obtained from Corley and Jirsa (1970).
Table 12-1 Comparison of Measured and Computer Moments
Method
Moments in an Interior Design Frame (M / Wl1 *)
End Span (Shallow Beam Side) Middle Span
End Span (Deep Beam Side)
−M +M −M −M +M −M −M +M −M
TEST F2 0.025 0.042 0.068 0.062 0.029 0.061 0.065 0.038 0.025
TEST F3 0.029 0.038 0.057 0.055 0.023 0.058 0.060 0.034 0.024
EFM 0.021 0.044 0.057 0.050 0.026 0.049 0.057 0.044 0.021
SAFE (Shallow Beam Side) 0.026 0.042 0.067 0.058 0.025 0.057 0.066 0.042 0.024
SAFE (Deep Beam Side) 0.026 0.041 0.066 0.057 0.024 0.057 0.066 0.042 0.024
* Wl1 = 35.0 k-ft
EXAMPLE 12 - 5

Software Verification PROGRAM NAME: SAFEREVISION NO.: 0
Moments are compared at the edge of column capitals. Table 12-1 shows that the SAFE and the EFM results are in excellent agreement. In general, the measured positive moments appear to be lower than the SAFE and EFM values.
COMPUTER FILE: S12.FDB
CONCLUSION The SAFE results show an acceptable comparison with the independent results.
EXAMPLE 12 - 6

Software VerificationPROGRAM NAME: SAFE REVISION NO.: 0
EXAMPLE 13 University of Illinois Two-Way Slab Test T1
PROBLEM DESCRIPTION This example models the slab structure tested at the University of Illinois by Gamble, Sozen, and Siess (1969). The structure is a two-way slab, 1.5 inches thick, in which each panel is supported along all four edges by beams, as shown in Figure 13-1. The structure consists of nine 5-foot × 5-foot panels arranged 3 × 3. The edge beams extend 2.75 inches below the soffit of the slab and the interiorbeams have an overall depth of 5 inches. The corner columns are 4 inches × 4inches and the interior columns are 6 inches × 6 inches. Edge columns are 4inches × 6 inches with the longer dimension parallel to the slab edge. A typicalsection of the slab and details are shown in Figure 13-2. The moments in aninterior design frame due to uniform loads obtained from SAFE are comparedwith the corresponding experimental results and the numerical values obtainedfrom the EFM.
The computational model uses a 6 × 6 mesh of elements per panel, as shown in Figure 13-3. Grid lines are defined at column faces as well as the column centerlines. The slab is modeled using the plate elements available in SAFE. The columns are modeled as supports with both vertical and rotational stiffnesses. A stiffness coefficient of 8.0 is used in the calculation of support flexural stiffnesses based on a column height of 15.875 inches, measured from the mid-depth of the slab to the support center. The column is assumed to be infinitely rigid over the full depth of the beams framing into it. The value of 8.0 is 75% of the figure obtained from Table 6.2 of ACI Committee 340 (1997) to approximately account for the pinned end condition at the column base. In order to account for rigidity of the slab-column joint, the portion of slab occupying the column area is modeled as rigid by using a special stiff area element. Edge beam properties are derived from their cross-section geometries.
To obtain maximum factored moments in an interior design frame, the slab is divided into two interior and two exterior design frames spanning in the X direction (E-W direction). Because of double symmetry, comparison is confined to X strips only. An interior design frame consists of one column strip and half of each adjacent middle strip.
EXAMPLE 13 - 1

Software Verification PROGRAM NAME: SAFEREVISION NO.: 0
Typical Design Frames
AA
A B C D
1
2
3
4
5'−0" 5'−0" 5'−0"
5'−0"
5'−0"
5'−0"
Typical Design Frames
AA
A B C D
1
2
3
4
5'−0" 5'−0" 5'−0"
5'−0"
5'−0"
5'−0"
Figure 13-1 University of Illinois Two-Way Slab Example T1
GEOMETRY, PROPERTIES AND LOADING
Concrete strength fc’ = 3 ksi Yield strength of reinforcements fy = 42 ksi Modulus of elasticity Ec = 3000 ksi Poisson’s ratio ν = 0.2
Loading: Total uniform load w = 150 psf
EXAMPLE 13 - 2

Software VerificationPROGRAM NAME: SAFE REVISION NO.: 0
SECTION A-A
5'−0" 5'−0" 5'−0"
Detail 'a' Detail 'b'"5168
A B C D
Interior Col. 6" x 6" Edge Col. 4" x 6"Corner Col. 4" x 4"SECTION A-A
5'−0" 5'−0" 5'−0"
Detail 'a' Detail 'b'"5168
A B C D
Interior Col. 6" x 6" Edge Col. 4" x 6"Corner Col. 4" x 4"
A B
Detail 'a' Detail 'b'
3"
5"
"144 "11
2
3"
"132
A B
Detail 'a' Detail 'b'
3"
5"
"144 "11
2
3"
"132
Figure 13-2 Sections and Details of Slab T1
EXAMPLE 13 - 3

Software Verification PROGRAM NAME: SAFE REVISION NO.: 0
Figure 13-3 SAFE Mesh of Slab T1 (6 × 6 per panel)
TECHNICAL FEATURES OF SAFE TESTED Calculation frame moments and comparison with experimental and FEM
results.
RESULTS COMPARISON Table 13.-1 shows the comparison of the moments in an interior design frame obtained numerically from SAFE with the experimental results and the EFM results. The experimental and EFM results are all obtained from Corley and Jirsa (1970).
EXAMPLE 13 - 4

Software VerificationPROGRAM NAME: SAFE REVISION NO.: 0
Table 13-1 Comparison of Measured and Computer Moments
Method
Moments in an Interior Design Frame ( M / Wl1 *)
Exterior Span Middle Span
−M +M −M −M +M −M
Test T1 0.043 0.046 0.079 0.071 0.036 0.071
EFM 0.035 0.047 0.079 0.066 0.034 0.066
SAFE 0.044 0.049 0.071 0.061 0.041 0.061
* Wl1 = 18.75 k-ft
The negative design moments reported are at the face of columns. The comparison is excellent. The minor discrepancy is attributed to the loss of stiffness due to the development of cracks and the difficulty in measuring strains accurately at desired locations.
COMPUTER FILE: S13.FDB
CONCLUSION The SAFE results show an acceptable comparison with the independent results.
EXAMPLE 13 - 5

Software VerificationPROGRAM NAME: SAFE REVISION NO.: 0
EXAMPLE 14 University of Illinois Two-Way Slab Test T2
PROBLEM DESCRIPTION This example models the slab structure tested at the University of Illinois by Vanderbilt, Sozen, and Siess (1969). The structure is a two-way slab arranged in 3 × 3 panels in which each panel is supported along all four edges by beams, as shown in Figure 14-1. The structure consists of nine 1.5-inch thick 5-foot × 5-foot panels. The edge beams and the interior beams extend 1.5 inches below the soffit of the slab. The corner columns are 4 inches × 4 inches and the interior columns are 6 inches × 6 inches. Edge columns are 4 inches × 6 inches with the longer dimension parallel to the slab edge. A typical section of the slab and details is shown in Figure 14-2.
The computational model uses a 6 × 6 mesh of elements per panel, as shown in Figure 14-3. Grid lines are defined at column faces as well as the column centerlines. The slab is modeled using plate elements and the columns are modeled as supports with both vertical and rotational stiffnesses. A stiffness coefficient of 6.33 is used in the calculation of support flexural stiffnesses based on a column height of 13.125 inches, measured from the mid-depth of the slab to the support center. The column stiffness is assumed to be infinitely rigid over the full depth of the beams framing into it. The value of 6.33 is 75% of the figure obtained from Table A7 of Portland Cement Association (1990) to approximately account for the pinned end condition at the column base. In order to account for rigidity of the slab-column joint, the portion of slab occupying the column area is modeled as rigid by using a special stiff area element. Edge beam properties are derived from their cross-section geometries.
To obtain maximum factored moments in an interior design frame, the slab is divided into two interior and two exterior design frames spanning in the X direction (E-W direction). An interior design frame consists of one column strip and half of each adjacent middle strip.
GEOMETRY, PROPERTIES AND LOADING Concrete strength fc’ = 3 ksi Yield strength of reinforcement fy = 47.6 ksi Modulus of elasticity Ec = 3000 ksi Poisson’s ratio ν = 0.2 Loading: Total uniform load w = 139 psf
EXAMPLE 14 - 1

Software Verification PROGRAM NAME: SAFEREVISION NO.: 0
A B C D
1
2
3
4
A
5'−0"5'−0"
5'−0"
5'−0"
5'−0"
A
5'−0"
Typical Design Frame
A B C D
1
2
3
4
A
5'−0"5'−0"
5'−0"
5'−0"
5'−0"
A
5'−0"
Typical Design Frame
Figure 14-1 University of Illinois Two-Way Floor Slab T2
EXAMPLE 14 - 2

Software VerificationPROGRAM NAME: SAFE REVISION NO.: 0
Detail 'a' Detail 'b'
SECTION A−A
"7138
5'− 0" 5'− 0" 5'− 0"
Interior Col. 6" x 6" Corner Col. 4" x 4"Edge Col. 4" x 6"
A B C D
Detail 'a' Detail 'b'
SECTION A−A
"7138
5'− 0" 5'− 0" 5'− 0"
Interior Col. 6" x 6" Corner Col. 4" x 4"Edge Col. 4" x 6"
A B C D
Detail 'a'
3"
"112
"112
Detail 'b'
3"
3"
A B
Detail 'a'
3"
"112
"112
Detail 'b'
3"
3"
A B
Figure 14-2 Sections and Details of Floor Slab T2
3’’
EXAMPLE 14 - 3

Software Verification PROGRAM NAME: SAFE REVISION NO.: 0
Figure 14-3 SAFE Mesh of Slab T2 (6 × 6 per panel)
TECHNICAL FEATURES OF SAFE TESTED Calculation of frame forces and comparison with experimental and FEM
results.
RESULTS COMPARISON Table 14-1 shows the comparison of the moments in an interior design frame obtained numerically from SAFE with the experimental results and the EFM results. The experimental and EFM results are all obtained from Corley and Jirsa (1970).
EXAMPLE 14 - 4

Software VerificationPROGRAM NAME: SAFE REVISION NO.: 0
Table 14-1 Comparison of Measured and Computer Moments
Method
Moments in an Interior Design Frame (M / Wl1 *)
Exterior Span Middle Span
−M +M −M −M +M −M
TEST T1 0.036 0.056 0.069 0.061 0.045 0.061
EFM 0.046 0.044 0.074 0.066 0.034 0.066
SAFE 0.046 0.047 0.067 0.060 0.039 0.060
* Wl1 = 17.375 kip-ft
The negative design moments reported are at the face of columns. The comparison is excellent except for the negative exterior moments where the experimental results are lower than both the SAFE and the EFM results. The discrepancy is attributed not only to the loss of stiffness due to the development of cracks, but also to the difficulty in taking accurate strain measurements at desired locations.
COMPUTER FILE: S14.FDB
CONCLUSION The SAFE results show an acceptable comparison with the independent results.
EXAMPLE 14 - 5

Software VerificationPROGRAM NAME: SAFE REVISION NO.: 0
EXAMPLE 15 Temperature Loading
PROBLEM DESCRIPTION In SAFE, two types of temperature loads can be applied to slab elements: an overall change in temperature or a temperature gradient across the slab thickness. This example tests each of these temperature loading methods using a 10-inch- deep x 12-inch-wide concrete slab. The slab is restrained in four different ways, and different temperature loads are applied and analyzed using SAFE. The results are compared to hand calculations and summarized in Table 15-1.
Temp, T1 = 100 degrees, F, Temp, T2 = 0 degrees, F, Span = 24 ft
EXAMPLE 15 - 1

Software Verification PROGRAM NAME: SAFEREVISION NO.: 0
Figure 1 One-Way Slab
GEOMETRY, PROPERTIES AND LOADING Slab thickness h = 10 in Slab width b = 12 in Clear span L = 288 in Concrete strength ′cf = 4,000 psi Modulus of elasticity Ec = 3,605 ksi Poisson’s ratio ν = 0.001 Temp, T1 T1 = 100 degrees, F Temp, T2 T2 = 0 degrees, F
TECHNICAL FEATURES OF SAFE TESTED Temperature and Temperature Gradient Loading
RESULTS COMPARISON The force, reaction, or displacements are found using the SAFE program for the cases described previously. The SAFE values were then compared to the independent hand calculations and summarized in Table 15-1.
EXAMPLE 15 - 2

Software VerificationPROGRAM NAME: SAFE REVISION NO.: 0
Table 15-1 Comparison of Results
CASE AND FEATURE TESTED INDEPENDENT RESULTS
SAFE RESULTS
DIFFERENCE
Case 1, Force, F11 (k/ft) 237.93 237.95 0.01%
Case 2, Reaction, RB (k) 1.033 1.032 0.09%
Case 3, Mid-Span Deflection, (in) 0.570 0.570 0.00%
Case 4, Free-End Displacement, (in) −2.281 −2.281 0.00%
COMPUTER FILES: S15a.FDB, S15b.FDB, S15c.FDB, S15d.FDB
CONCLUSION The SAFE results show an exact or nearly exact comparison with the independent hand-calculated results.
COMMENT In Case 4, a stiffness modifier of 100 for V13 and V23 is used to avoid shear deformation in plate.
The vertical offset of a slab can have a significant effect on the thermal loading results. Therefore, it is recommended that users turn off the option to ignore the vertical offsets when temperature loading is considered in a model (see the Run menu > Ignore Vertical Offsets in Non P/T Models command).
EXAMPLE 15 - 3

Software Verification PROGRAM NAME: SAFEREVISION NO.: 0
CALCULATIONS:
Design Parameters: T1 = 100, T2 = 0, h= 10, L = 24 ft (288 in), b = 36, ε = 5.5E-06
Case 1:
Slab Force, 11 0.0000055(100)(10 12)(3605) 237.93 k/ft= ε = × =F tAE
Case 2:
Reaction, ( ) ( )23
3 32 1 2 12 2
ε ε= − = −
EI EIRB T T L T ThL hL
From Roark and Young, p. 107
3(3605)(1000)(0.0000055) (100) 1.033 kips2(10)(288)
= =
Case 3:
Deflection, ( ) ( )2 20.00000552 1 100 (288) 0.5702 in8 8(10)−ε −
= − = − =Z T T Lh
Roark…, p. 108
Case 4:
Deflection, ( ) ( )2 20.00000552 1 100 (288) 2.281in2 2(10)−ε −
= − = − =Z T T Lh
Roark…, p. 108
EXAMPLE 15 - 4

Software VerificationPROGRAM NAME: SAFE REVISION NO.: 0
EXAMPLE 16 Cracked Slab Analysis
CRACKED ANALYSIS METHOD The moment curvature diagram shown in Figure 16-1 depicts a plot of the uncracked and cracked conditions, 1Ψ State 1, and, 2Ψ State 2, for a reinforced beam or slab. Plot A-B-C-D shows the theoretical moment versus curvature of a slab or beam. The slope of the moment curvature between points A and B remains linearly elastic until the cracking moment, Mr, is reached. The increase in moment curvature between B-C at the cracking moment, Mr, accounts for the introduction of cracks to the member cross-section. The slope of the moment curvature between point C-D approaches that of the fully cracked condition, 2ΨState 2, as the moment increases.
Since the moments vary along the span of a slab or beam, it is generally not accurate to assign the same cracked section effective moment of inertia along the entire length of a span. A better approach and the one recently added to the SAFE program is to account for the proper amount of curvature for each distinct finite element of the slab or beam that corresponds to the amount of moment being applied to that element. After the moment curvatures are known for each element, the deflections can be calculated accordingly.
This verification example will compare the results from Example 8.4, Concrete Structures, Stresses and Deformations, Third Edition, A Ghali, R Favre and M Elbadry, pages 285-289, with the results obtained from SAFE. Both the calculations and the SAFE analysis use the cracked analysis methodology described in the preceding paragraphs.
PROBLEM DESCRIPTION The slab used in this example has dimensions b = 0.3 m and h = 0.6 m. The slab spans 8.0 m and has an applied load of 17.1 KN/m.
EXAMPLE 16 - 1

Software Verification PROGRAM NAME: SAFE REVISION NO.: 0
Figure 16-1 Moment versus curvature for a reinforced slab member
Figure 16-2 One-Way Slab
EXAMPLE 16 - 2

Software VerificationPROGRAM NAME: SAFE REVISION NO.: 0
GEOMETRY, PROPERTIES AND LOADING Slab thickness h = 0.65 m Slab width b = 0.3 m Clear span L = 8.0 m Concrete Ultimate Strength h cf ′ = 30 MPa Concrete cracking strength crf = 2.5 MPa Modulus of elasticity, Conc. Es = 30 GPa Modulus of elasticity, Steel Ec = 200 GPa Poisson’s ratio ν = 0.2 Uniform load w = 17.1 KN/m Creep coefficient ( )0t ,tϕ = 2.5
Free shrinkage ( )0CS t ,tε = −250E-6
Note: The concrete cracking strength of crf = 2.5 MPa was used in this example using the Run menu > Cracking Analysis Option command.
TECHNICAL FEATURES OF SAFE TESTED Cracked Slab Analysis
RESULTS COMPARISON SAFE calculated the displacements using a Nonlinear Cracked Load Case (see Figure 16-1). The first nonlinear load case was calculated without creep and shrinkage effects and the second nonlinear load case included creep and shrinkage effects. Table 16-1 shows the results obtained from SAFE compared with the referenced example.
Table 16-1 Comparison of Results
CASE AND FEATURE TESTED INDEPENDENT
RESULTS SAFE
RESULTS DIFFERE
NCE Mid-Span Displacement No Creep / Shrinkage (m) 14.4 mm 13.55 mm 5.90%
Mid-Span Displacement with Creep / Shrinkage (m) 23.9 mm 24.51 mm 2.51%
EXAMPLE 16 - 3

Software Verification PROGRAM NAME: SAFE REVISION NO.: 0
COMPUTER FILES: S16.FDB
CONCLUSION The SAFE results show an acceptable comparison with the independent results.
CALCULATIONS:
Design Parameters: Es = 200 GPa, Ec = 30 GPa, h = 0.65 m, b = 0.3m, As = 1080 mm2, As′ = 270 mm2, Center of reinf. at 0.05 m Span = 8.0 m, Uniform Load = 17.1 KN/m
Figure 16-3 Slab Cross-Section
Case 1 – Nonlinear cracked slab analysis without creep and shrinkage
1.1 Transformed Uncracked Section Properties: Area, A = 0.2027m2 Y = 0.319m I, transformed = 7.436E-03 m4
1.2 Transformed Cracked Section Properties: Area, A = 0.2027 m2 C = 0.145 m I, cracked = 1.809E-03 m4
EXAMPLE 16 - 4

Software VerificationPROGRAM NAME: SAFE REVISION NO.: 0
1.3 Cracked Bending Moment, Mr = 23.3E-03 × 2.5 × 10E6 = 58.3 KN-m
1.4 Interpolation coefficient, 2
1 21ζ β β = − =
rMM
258.31 1.0 0.82136
− =
where 1 1.0β = and 2 1.0β =
1.5 Curvature:
State1: Uncracked
1 9
136E-06 610E-06 / m30 10 7.436E-03
= =× ×
Ψ
State2: Fully Cracked
2 9
136E-06 2506E-06 / m30 10 1.809E-03
= =× ×
Ψ
Interpolated curvature: ( ) ( ) ( ) ( )m 1 21 1 0.82 (610E-06 / m) 0.82 2506E-06 2157E-06 / m= − + = − + =Ψ ζ Ψ ζ Ψ
1.6 Slab Curvature:
Figure 16-4 Span-Curvature Diagram
1.7 Deflection: By assuming a parabolic distribution of curvature across the entire span (see the Mean Curvature over Entire Span plot in Figure 16-4), the deflection can be calculated as,
EXAMPLE 16 - 5
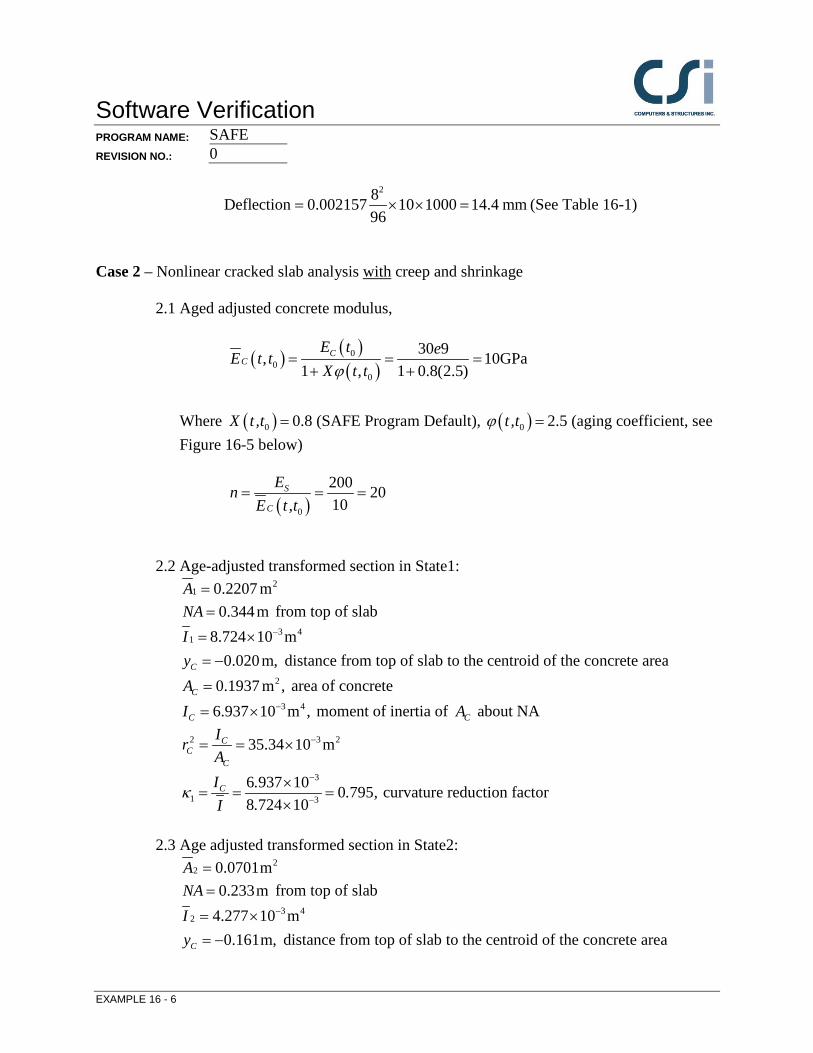
Software Verification PROGRAM NAME: SAFE REVISION NO.: 0
28Deflection 0.002157 10 1000 14.4 mm96
= × × = (See Table 16-1)
Case 2 – Nonlinear cracked slab analysis with creep and shrinkage
2.1 Aged adjusted concrete modulus,
( ) ( )( )0
00
30 9, 10GPa1 , 1 0.8(2.5)ϕ
= = =+ +
CC
E t eE t tX t t
Where ( )0X t,t = 0.8 (SAFE Program Default), ( )0t ,tϕ = 2.5 (aging coefficient, see Figure 16-5 below)
( )0
200 2010
S
C
EnE t,t
= = =
2.2 Age-adjusted transformed section in State1: 2
1 0.2207 m=A 0.344m=NA from top of slab
3 41 8.724 10 m−= ×I
0.020m,= −Cy distance from top of slab to the centroid of the concrete area 20.1937 m ,=CA area of concrete
3 46.937 10 m ,−= ×CI moment of inertia of CA about NA 2 3 235.34 10 m−= = ×C
CC
IrA
3
1 3
6 937 10 0 7958 724 10
κ−
−
×= = =
×CI . . ,
.I curvature reduction factor
2.3 Age adjusted transformed section in State2: 2
2 0.0701m=A 0.233m=NA from top of slab
3 42 4.277 10 m−= ×I
0.161m,= −Cy distance from top of slab to the centroid of the concrete area
EXAMPLE 16 - 6

Software VerificationPROGRAM NAME: SAFE REVISION NO.: 0
20.0431m ,=CA area of concrete 3 41.190 10 m ,−= ×CI moment of inertia of CA about NA
2 3 227.62 10 m−= = ×CC
C
IrA
3
2 3
1 190 10 0 2784 277 10
κ−
−
×= = =
×CI . .
.I
2.4 Changes in curvature due to creep and shrinkage: State 1, Change in curvature between period 0t to t ,
( ) ( ) ( ) ( )0 0 0 0 02 2C C
CSC C
y yDelta t ,t t t t ,tr r
ψ κ ϕ ψ ε ε ε
= + +
( )6 6 63 3
0 020 0 0200 795 2 5 610 10 8 10 250 1035 34 10 35 34 10
− − −− −
− −= × + × + − × ×
. .. .. x .
61299 10 / m−= ×
The curvature at time t (State 1) ( ) ( ) 6 6
1 t 610 1299 x10 / m 1909x10 / m− −= + =Ψ
State 2, Change in curvature between period 0t to t ,
( ) ( ) ( ) ( )0 0 0 0 02 2C C
CSC C
y yDelta t ,t t t t ,tr r
ψ κ ϕ ψ ε ε ε
= + +
( )6 6 63 3
0 161 0 1610 278 2 5 2506 10 222 10 250 1027 62 10 27 62 10
− − −− −
− −= × + × + − × ×
. .. .. x .
61248 10 / m−= ×
The curvature at time t (State 2) ( ) ( ) 6 6
2 2506 1248 10 / m 3754 10 / m− −= + × = ×tΨ
Interpolated curvature: ( ) ( ) ( )( ) ( ) ( )6 6 6
1 21 1 0.91 (1909 10 ) 0.91 3754 10 3584 10 / m− − −= − + = − × + × = ×t t tΨ ζ Ψ ζ Ψ
EXAMPLE 16 - 7

Software Verification PROGRAM NAME: SAFE REVISION NO.: 0
2.5 Deflection at center at time, t: By assuming a parabolic distribution of curvature across the entire span, the deflection can be calculated as,
28Deflection 0.003584 10 1000 23.90mm96
= × × = (See Table 16-1)
2.6 The Load Case Data form for Nonlinear Long-Term Cracked Analysis: The Creep Coefficient and Shrinkage Strain values must be user defined. For this example, a shrinkage strain value of −250E-6 was used. Note that the value is input as a positive value.
Figure 16-5 Load Case Data form for Nonlinear Long-Term Cracked Analysis
EXAMPLE 16 - 8

Software VerificationPROGRAM NAME: SAFE REVISION NO.: 0
EXAMPLE 17 Crack Width Analysis
The crack width, wk, is calculated using the methodology described in the Eurocode EN 1992-1-1:2004, Section 7.3.4, which makes use of the following expressions:
(1) ,max ( )k r sm cmw s= ε − ε (eq. 7.8)
where
sr,max is the maximum crack spacing
εsm is the mean strain in the reinforcement under the relevant combination of loads, including the effect of imposed deformations and taking into account the effects of tension stiffening. Only the additional tensile strain beyond the state of zero strain of the concrete at the same level is considered.
εcm is the mean strain in the concrete between cracks
(2) εsm − εcm may be calculated from the expression
( ),eff.eff
,eff
10.6
cts t e p
p ssm cm
s s
fk
EE E
σ − + α ρρ σ
ε − ε = ≥ (eq. 7.9)
where
σs is the stress in the tension reinforcement assuming a cracked section. For pretensioned members, σs may be replaced by ∆σs, the stress variation in prestressing tendons from the state of zero strain of the concrete at the same level.
αe is the ratio Ec / Ecm
ρp,eff is As / Ac,eff
Ap′ and Ac,eff ; Ap′ is the area of tendons within Ac,eff, and Ac,eff is the area of tension concrete surrounding the reinforcing.
EXAMPLE 17 - 1

Software Verification PROGRAM NAME: SAFEREVISION NO.: 0
kt is a factor dependent on the duration of the load kt = 0.6 for short term loading kt = 0.4 for long-term loading
(3) In situations where bonded reinforcement is fixed at reasonably closecenters within the tension zone [spacing ≤ 5(c + φ / 2)], the maximum finalcrack spacing may be calculated from
sr,max = k3c + k1k2k4φ / ρp,eff (eq. 7.11)
where
φ is the bar diameter. Where a mixture of bar diameters is used in a section, an equivalent diameter, φeq, should be used. For a section with n1 bars of diameter φ1 and n2 bars of diameter φ2, the following equation should be used:
2 21 1 2 2
1 1 2 2eq
n nn nφ + φ
φ =φ + φ
(eq. 7.12)
where
c is the cover to the longitudinal reinforcement
k1 is a coefficient that takes into account the bond properties of the bonded reinforcement: = 0.8 for high bond bars = 1.6 for bars with an effectively plain surface (e.g., prestressing
tendons)
k2 is a coefficient that takes into account the distribution of strain: = 0.5 for bending = 1.0 for pure tension
k3 and k4 are recommended as 3.4 and 0.425 respectively. See the National Annex for more information.
For cases of eccentric tension or for local areas, intermediate values of k2 should be used that may be calculated from the relation:
k2 = (ε1 + ε2) / 2ε1 (eq. 7.13)
where ε1 is the greater and ε2 is the lesser tensile strain at the boundaries of the section considered, assessed on the basis of a cracked section.
EXAMPLE 17 - 2

Software VerificationPROGRAM NAME: SAFE REVISION NO.: 0
PROBLEM DESCRIPTION The purpose of this example is to verify that the crack width calculation performed by SAFE is consistent with the methodology described above. Hand calculations using the Eurocode EN 1992-1-1:2004, Section 7.3.4 are shown below as well as a comparison of the SAFE and hand calculated results.
A one-way, simply supported slab is modeled in SAFE. The modeled slab is 254 mm thick by 914 mm wide and spans 9,754 mm, as shown in Figure 17-1, and is the same slab used to validate the Eurocode PT design (see design verification example Eurocode 2-04 PT-SL-001). To test the crack width calculation, seven #5 longitudinal bars have been added to the slab. The total area of mild steel reinforcement is 1,400mm2. Currently, SAFE will account for some of the PT effects. SAFE accounts for the PT effects on the moments and reinforcing stresses but the tendon areas are not considered effective to resist cracking.
Length, L = 9754 mm
Elevation Section
Prestressing tendon, Ap
Mild Steel, As
914 mm25 mm
229 mm
254 mm
Length, L = 9754 mm
Elevation Section
Prestressing tendon, Ap
Mild Steel, As
914 mm25 mm
229 mm
254 mm
Figure 17-1 One-Way Slab
EXAMPLE 17 - 3

Software Verification PROGRAM NAME: SAFEREVISION NO.: 0
A 254-mm-wide design strip is centered along the length of the slab and has been defined as an A-Strip. B-strips have been placed at each end of the span, perpendicular to Strip-A (the B-Strips are necessary to define the tendon profile). A tendon with two strands, each having an area of 99 mm2, was added to the A-Strip. The loads are as follows:
Loads: Dead = self weight
GEOMETRY, PROPERTIES AND LOADING Thickness T, h = 254 mm Effective depth d = 229 mm Clear span L = 9754 mm
Concrete strength f 'c = 30 MPa Yield strength of steel fy = 400 MPa Prestressing, ultimate fpu = 1862 MPa Prestressing, effective fe = 1210 MPa Area of Prestress (single strand) Ap = 198 mm2 Concrete unit weight wc = 23.56 KN/m3 Modulus of elasticity Ec = 25000 N/mm3 Modulus of elasticity Es = 200,000 N/mm3 Poisson’s ratio ν = 0
Dead load wd = self KN/m2
TECHNICAL FEATURES OF SAFE TESTED Calculation of the reported crack widths.
RESULTS COMPARISON Table 1 shows the comparison of the SAFE crack widths to those calculated by hand.
EXAMPLE 17 - 4

Software VerificationPROGRAM NAME: SAFE REVISION NO.: 0
Table 1 Comparison of Results
FEATURE TESTED INDEPENDENT RESULTS
SAFE RESULTS DIFFERENCE
Crack Widths (mm) 0.151mm 0.161mm 6.62%
COMPUTER FILE: S17.FDB
CONCLUSION The SAFE results show an acceptable comparison with the independent results.
EXAMPLE 17 - 5

Software Verification PROGRAM NAME: SAFEREVISION NO.: 0
HAND CALCULATIONS:
Design Parameters:
Mild Steel Reinforcing Post-Tensioning
f’c = 30MPa fpu = 1862 MPa fy = 400MPa fpy = 1675 MPa
Stressing Loss = 186 MPa Long-Term Loss = 94 MPa
fi = 1490 MPa fe = 1210 MPa
Length, L = 9754 mm
Elevation Section
Prestressing tendon, Ap
Mild Steel, As
914 mm25 mm
229 mm
254 mm
Length, L = 9754 mm
Elevation Section
Prestressing tendon, Ap
Mild Steel, As
914 mm25 mm
229 mm
254 mm
Loads: Dead, self-wt = 0.254 m x 23.56 kN/m3 = 5.984 kN/m2 (D)
ω =5.984 kN/m2 x 0.914 m = 5.469 kN/m
Ultimate Moment, 2
1
8UwlM = = 5.469 x (9.754)2/8 = 65.0 kN-m
Reinforcing steel stress, 2207N / mmσ = (calculated but not reported by SAFE)
EXAMPLE 17 - 6
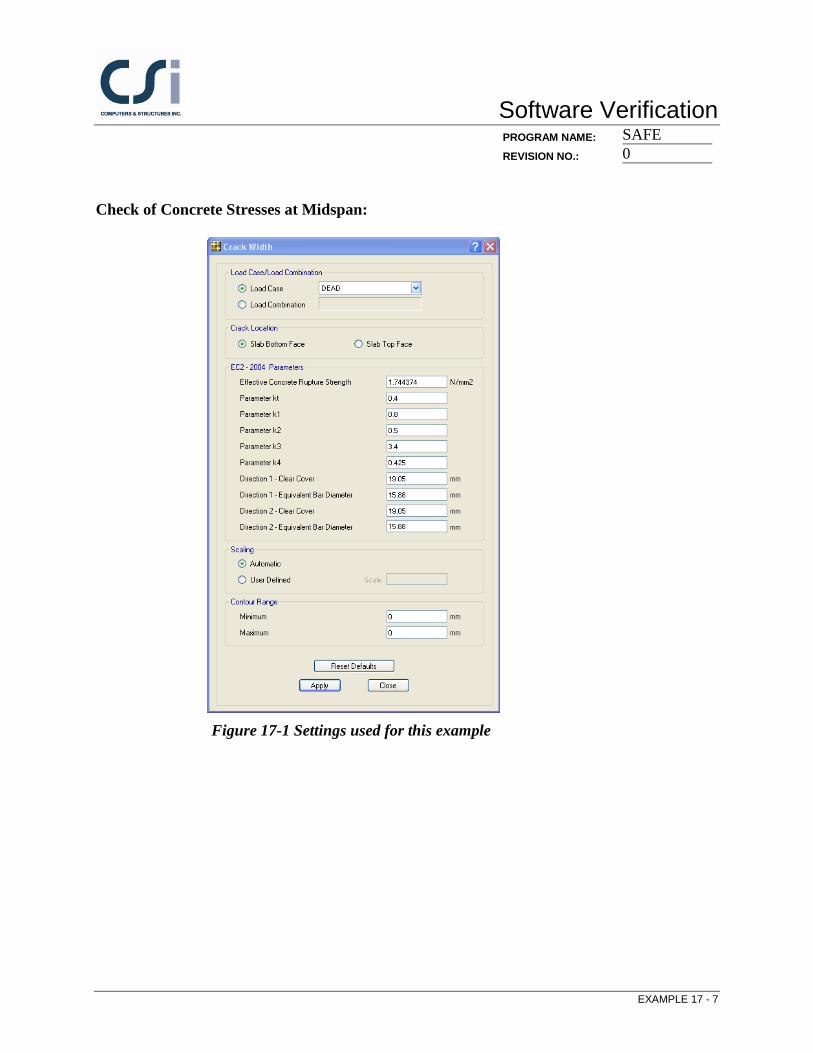
Software VerificationPROGRAM NAME: SAFE REVISION NO.: 0
Check of Concrete Stresses at Midspan:
Figure 17-1 Settings used for this example
EXAMPLE 17 - 7

Software Verification PROGRAM NAME: SAFEREVISION NO.: 0
Calculation of Crack Width:
,max ( )= ε − εk r sm cmw swhere
( ),eff,eff
,eff
10.6
σ − +α ρρ σ
ε − ε = ≥
cts t e p
p ssm cm
s s
fk
E E, where
( )2 2,eff .eff/ 1.53mm / mm / 60mm / mmρ = =p cAs A
0 026p ,eff .ρ =
( )( )2
2 1.744 / mm206 / mm 0.4 1 8 0.026 2060.026 0.6199948 199948
− +ε − ε = ≥sm cm
NN
0 0009 0 0006ε ε− = ≥sm cm . .
,max 3 1 2 4 ,eff/= + φ ρr ps k c k k k ( ) ( )( )3.4 19.0mm 0.8 0.5 0.425 15.8mm / 0.026= + 168mm=
Total crack width, k r ,max sm cmw s ( )ε ε= − = ( )168mm 0.0009 0.151mm=
EXAMPLE 17 - 8

Software VerificationPROGRAM NAME: SAFE REVISION NO.: 0
EXAMPLE ACI 318-14 PT-SL 001 Design Verification of Post-Tensioned Slab using the ACI 318-14 code
PROBLEM DESCRIPTION The purpose of this example is to verify the slab stresses and the required area of mild steel strength reinforcing for a post-tensioned slab.
A one-way, simply supported slab is modeled in SAFE. The modeled slab is 10 inches thick by 36 inches wide and spans 32 feet, as shown in shown in Figure 1. A 36-inch-wide design strip was centered along the length of the slab and was defined as an A-Strip. B-strips were placed at each end of the span perpendicular to the Strip-A (the B-Strips are necessary to define the tendon profile). A tendon, with two strands having an area of 0.153 square inches each, was added to the A-Strip. The self weight and live loads were added to the slab. The loads and post-tensioning forces are shown below. The total factored strip moments, required area of mild steel reinforcement, and slab stresses are reported at the mid-span of the slab. Independent hand calculations were compared with the SAFE results and summarized for verification and validation of the SAFE results.
Loads: Dead = self weight, Live = 100psf
EXAMPLE ACI 318-14 PT-SL 001 - 1

Software Verification PROGRAM NAME: SAFEREVISION NO.: 0
Figure 1 One-Way Slab
GEOMETRY, PROPERTIES AND LOADING Thickness, T, h = 10 in Effective depth, d = 9 in Clear span, L = 384 in Concrete strength, Cf ' = 4,000 psi Yield strength of steel, yf = 60,000 psi Prestressing, ultimate puf = 270,000 psi Prestressing, effective ef = 175,500 psi Area of Prestress (single strand), PA = 0.153 sq in Concrete unit weight, wc = 0.150 pcf Modulus of elasticity, Ec = 3,600 ksi Modulus of elasticity, Es = 29,000 ksi Poisson’s ratio, ν = 0 Dead load, wd = self psf Live load, wl = 100 psf
TECHNICAL FEATURES OF SAFE TESTED Calculation of the required flexural reinforcement Check of slab stresses due to the application of dead, live and post-tensioning
loads.
EXAMPLE ACI 318-14 PT-SL 001 - 2

Software VerificationPROGRAM NAME: SAFE REVISION NO.: 0
RESULTS COMPARISON The SAFE total factored moments, required mild steel reinforcing and slab stresses are compared to the independent hand calculations in Table 1.
Table 1 Comparison of Results
FEATURE TESTED INDEPENDENT RESULTS
SAFE RESULTS DIFFERENCE
Factored moment, Mu (Ultimate) (k-in)
1429.0 1428.3 0.05%
Area of Mild Steel req’d, As (sq-in) 2.20 2.20 0.00%
Transfer Conc. Stress, top (D+PTI), ksi −0.734 −0.735 0.14%
Transfer Conc. Stress, bot (D+PTI), ksi 0.414 0.414 0.00%
Normal Conc. Stress, top (D+L+PTF), ksi −1.518 −1.519 0.07%
Normal Conc. Stress, bot (D+L+PTF), ksi 1.220 1.221 0.08%
Long-Term Conc. Stress, top (D+0.5L+PTF(L)), ksi −1.134 −1.135 0.09%
Long-Term Conc. Stress, bot (D+0.5L+PTF(L)), ksi 0.836 0.837 0.12%
COMPUTER FILE: ACI 318-14 PT-SL-001.FDB
CONCLUSION The SAFE results show an acceptable comparison with the independent results.
EXAMPLE ACI 318-14 PT-SL 001 - 3

Software Verification PROGRAM NAME: SAFEREVISION NO.: 0
CALCULATIONS:
Design Parameters: φ =0.9
Mild Steel Reinforcing Post-Tensioning
f′c = 4000 psi fj = 216.0 ksi fy = 60,000 psi Stressing Loss = 27.0 ksi
Long-Term Loss = 13.5 ksi fi = 189.0 ksi fe = 175.5 ksi
Loads: Dead, self-wt = 10 12/ ft × 0.150 kcf = 0.125 ksf (D) × 1.2 = 0.150 ksf (Du) Live, 0.100 ksf (L) × 1.6 = 0.160 ksf (Lu)
Total =0.225 ksf (D+L) 0.310 ksf (D+L)ult
ω =0.225 ksf × 3 ft = 0.675 klf, uω = 0.310 ksf × 3ft = 0.930 klf
Ultimate Moment, 2
1
8UwlM = = 0.310 klf × 322/8 = 119.0 k-ft = 1429.0 k-in
EXAMPLE ACI 318-14 PT-SL 001 - 4
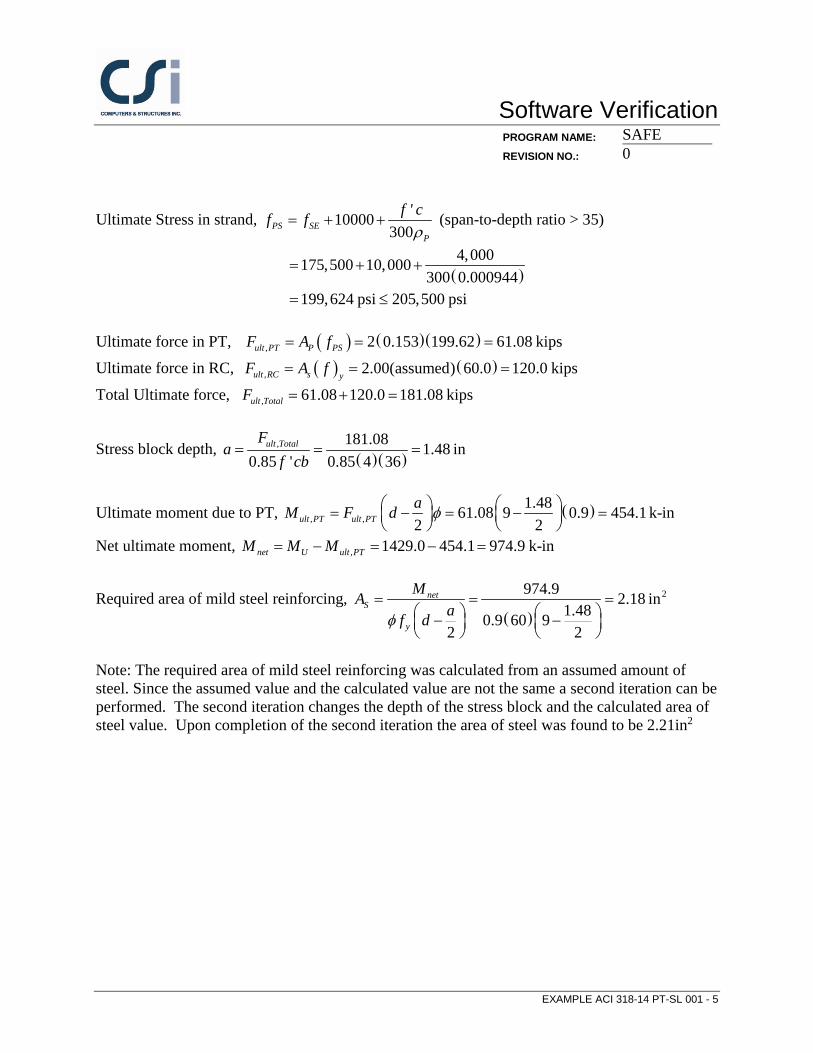
Software VerificationPROGRAM NAME: SAFE REVISION NO.: 0
Ultimate Stress in strand, 10000300PS SE
P
f ' cf fρ
= + + (span-to-depth ratio > 35)
( )4,000175,500 10,000
300 0.000944199,624 psi 205,500 psi
= + +
= ≤
Ultimate force in PT, ( ) ( )( ), 2 0.153 199.62 61.08 kips= = =ult PT P PSF A fUltimate force in RC, ( ) ( ), 2.00(assumed) 60.0 120.0 kips= = =ult RC s yF A f
Total Ultimate force, , 61.08 120.0 181.08 kips= + =ult TotalF
Stress block depth, ( )( )
, 181.08 1.48 in0.85 ' 0.85 4 36
= = =ult TotalFa
f cb
Ultimate moment due to PT, ( ), ,1.4861.08 9 0.9 454.1 k-in
2 2φ = − = − =
ult PT ult PTaM F d
Net ultimate moment, , 1429.0 454.1 974.9 k-in= − = − =net U ult PTM M M
Required area of mild steel reinforcing, ( )
2974.9 2.18 in1.480.9 60 9
2 2φ
= = = − −
netS
y
MAaf d
Note: The required area of mild steel reinforcing was calculated from an assumed amount of steel. Since the assumed value and the calculated value are not the same a second iteration can be performed. The second iteration changes the depth of the stress block and the calculated area of steel value. Upon completion of the second iteration the area of steel was found to be 2.21in2
EXAMPLE ACI 318-14 PT-SL 001 - 5

Software Verification PROGRAM NAME: SAFEREVISION NO.: 0
Check of Concrete Stresses at Mid-Span:
Initial Condition (Transfer), load combination (D + L + PTi) = 1.0D + 1.0PTI
The stress in the tendon at transfer = jacking stress − stressing losses = 216.0 − 27.0 = 189.0 ksi
The force in the tendon at transfer, = ( )( )189.0 2 0.153 57.83= kips Moment due to dead load, ( )( )20.125 3 32 8 48.0 k-ft 576 k-in= = =DMMoment due to PT, ( )(sag) 57.83 4 in 231.3 k-in= = =PT PTIM F
Stress in concrete,( )
57.83 576.0 231.310 36 600
− − −= ± = ±PTI D PTF M Mf
A S, where S = 600 in3
0 161 0 5745= − ±f . . 0.735(Comp)max,0.414(Tension)maxf
Normal Condition, load combinations: (D + L + PTF) = 1.0D + 1.0L + 1.0PTF
Tendon stress at normal = jacking − stressing − long-term = 216.0 − 27.0 − 13.5 = 175.5 ksi The force in tendon at Normal, = ( )( )175.5 2 0.153 53.70= kips Moment due to dead load, ( )( )20.125 3 32 8 48.0 k-ft 576 k-in= = =DM
Moment due to dead load, ( )( )20.100 3 32 8 38.4 k-ft 461 k-in= = =LM Moment due to PT, ( )(sag) 53.70 4 in 214.8 k-in= = =PT PTIM F
Stress in concrete for (D + L+ PTF),( )
53.70 1037.0 214.810 36 600
+ − − −= ± = ±PTI D L PTF M Mf
A S0 149 1 727 0 358f . . .= − ± ± 1.518(Comp) max,1.220(Tension) max= −f
Long-Term Condition, load combinations: (D + 0.5L + PTF(L)) = 1.0D + 0.5L + 1.0PTF
Tendon stress at normal = jacking − stressing − long-term = 216.0 − 27.0 − 13.5 = 175.5 ksi The force in tendon at Normal, = ( )( )175.5 2 0.153 53.70= kips Moment due to dead load, ( )( )20.125 3 32 8 48.0 k-ft 576 k-in= = =DM
Moment due to dead load, ( )( )20.100 3 32 8 38.4 k-ft 460 k-in= = =LMMoment due to PT, ( )(sag) 53.70 4 in 214.8 k-in= = =PT PTIM F
EXAMPLE ACI 318-14 PT-SL 001 - 6

Software VerificationPROGRAM NAME: SAFE REVISION NO.: 0
Stress in concrete for (D + 0.5L + PTF(L)),
( )0.5 53.70 806.0 214.8
10 36 600+ − − −
= ± = ±D L PTPTI M MFfA S0 149 0 985f . .= − ± 1.134(Comp) max,0.836(Tension) max= −f
EXAMPLE ACI 318-14 PT-SL 001 - 7

Software VerificationPROGRAM NAME: SAFE REVISION NO.: 0
EXAMPLE ACI 318-14 RC-BM-001 Flexural and Shear Beam Design
PROBLEM DESCRIPTION The purpose of this example is to verify the beam flexural design in SAFE. The load level is adjusted for the case corresponding to the following conditions:
The stress-block extends below the flange but remains within the balancedcondition permitted by ACI 318-14.
The average shear stress in the beam falls below the maximum shear stressallowed by ACI 318-14, requiring design shear reinforcement.
A simple-span, 20-foot-long, 12-inch-wide, and 18-inch-deep T beam with a flange 4 inches thick and 24 inches wide is modeled using SAFE. The beam is shown in Figure 1. The computational model uses a finite element mesh of frame elements, automatically generated by SAFE. The maximum element size is specified as 6 inches. The beam is supported by columns without rotational stiffnesses and with very large vertical stiffness (1 × 10²⁰ kip/in).
The beam is loaded with symmetric third-point loading. One dead load (DL02) case and one live load (LL30) case, with only symmetric third-point loads of magnitudes 3, and 30 kips, respectively, are defined in the model. One load combination (COMB30) is defined using the ACI 318-14 load combination factors of 1.2 for dead load and 1.6 for live load. The model is analyzed for both of these load cases and the load combination.
The beam moment and shear force are computed analytically. The total factored moment and shear force are compared with the SAFE results and found to be identical. After completing the analysis, the design is performed using the ACI 318-14 code in SAFE and also by hand computation. Table 1 shows thecomparison of the design longitudinal reinforcement. Table 2 shows thecomparison of the design shear reinforcement.
EXAMPLE ACI 318-14 RC-BM-001 - 1

Software Verification PROGRAM NAME: SAFEREVISION NO.: 0
Beam Section
75 mm 100 mm
300 mm
600 mm
75 mm
500 mm
Shear Force
Bending Moment
2000 mm 2000 mm 2000 mm
Beam Section
75 mm 100 mm
300 mm
600 mm
75 mm
500 mm
Shear Force
Bending Moment
2000 mm 2000 mm 2000 mm
Figure 1 The Model Beam for Flexural and Shear Design
EXAMPLE ACI 318-14 RC-BM-001 - 2

Software VerificationPROGRAM NAME: SAFE REVISION NO.: 0
GEOMETRY, PROPERTIES AND LOADING Clear span l = 240 in Overall depth h = 18 in Flange thickness ds = 4 in Width of web bw = 12 in Width of flange, bf = 24 in Depth of tensile reinf. dc = 3 in Effective depth d = 15 in Depth of comp. reinf. d' = 3 in
Concrete strength f'c = 4,000 psi
Yield strength of steel fy = 60,000 psi Concrete unit weight wc = 0 pcf Modulus of elasticity Ec = 3,600 ksi Modulus of elasticity Es = 29,000 ksi Poisson’s ratio v = 0.2
Dead load Pd = 2 kips Live load Pl = 30 kips
TECHNICAL FEATURES OF SAFE TESTED Calculation of flexural and shear reinforcement Application of minimum flexural and shear reinforcement
RESULTS COMPARISON Table 1 shows the comparison of the SAFE total factored moments in the beam with the moments obtained by the analytical method. They match exactly for this problem. Table 1 also shows the comparison of the design reinforcement.
Table 1 Comparison of Moments and Flexural Reinforcements
Method Moment
(k-in)
Reinforcement Area (sq-in)
As+
SAFE 4032 5.808
Calculated 4032 5.808
,mins+A = 0.4752 sq-in
EXAMPLE ACI 318-14 RC-BM-001 - 3

Software Verification PROGRAM NAME: SAFEREVISION NO.: 0
Table 2 Comparison of Shear Reinforcements
Shear Force (kip)
Reinforcement Area, s
Av
(sq-in/ft)
SAFE Calculated
50.40 0.592 0.592
COMPUTER FILE: ACI 318-14 RC-BM-001.FDB
CONCLUSION The SAFE results show an exact comparison with the independent results.
EXAMPLE ACI 318-14 RC-BM-001 - 4

Software VerificationPROGRAM NAME: SAFE REVISION NO.: 0
HAND CALCULATION
Flexural Design The following quantities are computed for all the load combinations:
ϕ = 0.9 Ag = 264 sq-in As,min = 0.0018Ag = 0.4752 sq-in
140000.85 0.05 0.85
1000cfβ′ − = − =
max0.003
0.003 0.005c d= =
+5.625 in
max 1 maxa cβ= = 4.78125 in
As = min[As,min, (4/3) As,required] = min[0.4752, (4/3)5.804] = 0.4752 sq-in
COMB30 Pu = (1.2Pd + 1.6Pt) = 50.4 k
3u
uP lM = = 4032 k-in
The depth of the compression block is given by:
2'
20.85
u
c f
Ma d d
f bϕ= − − = 4.2671 in (a > ds)
Calculation for As is performed in two parts. The first part is for balancing the compressive force from the flange, Cf, and the second part is for balancing the compressive force from the web, Cw. Cf is given by:
Cf = 0.85fc' (bf − bw) ds = 163.2 k
The portion of Mu that is resisted by the flange is given by:
Muf = Cf
−2
sdd ϕ = 1909.44 k-in
EXAMPLE ACI 318-14 RC-BM-001 - 5

Software Verification PROGRAM NAME: SAFEREVISION NO.: 0
Therefore, the area of tensile steel reinforcement to balance flange compression is:
As1 = ( ) ϕ− 2sy
uf
ddfM
= 2.7200 sq-in
The balance of the moment to be carried by the web is given by:
Muw = Mu − Muf = 2122.56 k-in
The web is a rectangular section with dimensions bw and d, for which the design depth of the compression block is recalculated as
a1 = d − 2 20.85
uw
c w
Mdf bϕ
−′
= 4.5409 in (a1 ≤ amax)
The area of tensile steel reinforcement to balance the web compression is then given by:
As2 = ϕ
−ϕ2
1adf
M
y
uw = 3.0878 sq-in
The area of total tensile steel reinforcement is then given by:
As = As1 + As2 = 5.808 sq-in
Shear Design The following quantities are computed for all of the load combinations:
ϕ = 0.75
Check the limit of cf ′ :
cf ′ = 63.246 psi < 100 psi
The concrete shear capacity is given by:
ϕ Vc = ϕ 2 cf ′ bwd = 17.076 k
The maximum shear that can be carried by reinforcement is given by:
EXAMPLE ACI 318-14 RC-BM-001 - 6
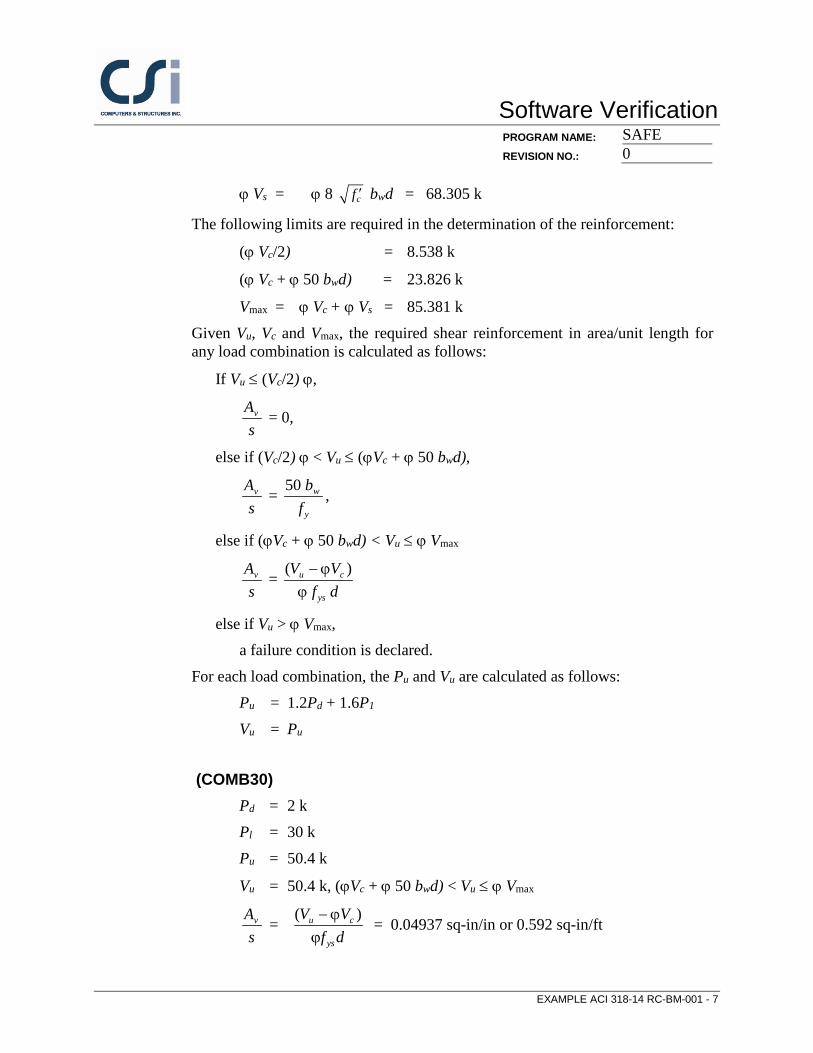
Software VerificationPROGRAM NAME: SAFE REVISION NO.: 0
ϕ Vs = ϕ 8 cf ′ bwd = 68.305 k
The following limits are required in the determination of the reinforcement:
(ϕ Vc/2) = 8.538 k
(ϕ Vc + ϕ 50 bwd) = 23.826 k
Vmax = ϕ Vc + ϕ Vs = 85.381 k Given Vu, Vc and Vmax, the required shear reinforcement in area/unit length for any load combination is calculated as follows:
If Vu ≤ (Vc/2) ϕ,
sAv = 0,
else if (Vc/2) ϕ < Vu ≤ (ϕVc + ϕ 50 bwd),
sAv =
y
w
fb50 ,
else if (ϕVc + ϕ 50 bwd) < Vu ≤ ϕ Vmax
sAv =
dfVV
ys
cu
ϕϕ− )(
else if Vu > ϕ Vmax, a failure condition is declared.
For each load combination, the Pu and Vu are calculated as follows: Pu = 1.2Pd + 1.6P1
Vu = Pu
(COMB30) Pd = 2 k Pl = 30 k Pu = 50.4 k
Vu = 50.4 k, (ϕVc + ϕ 50 bwd) < Vu ≤ ϕ Vmax
sAv =
dfVV
ys
cu
ϕϕ− )(
= 0.04937 sq-in/in or 0.592 sq-in/ft
EXAMPLE ACI 318-14 RC-BM-001 - 7

Software VerificationPROGRAM NAME: SAFE REVISION NO.: 0
EXAMPLE ACI 318-14 RC-PN-001 Slab Punching Shear Design
PROBLEM DESCRIPTION The purpose of this example is to verify slab punching shear design in SAFE.
The numerical example is a flat slab that has three 24-foot-long spans in each direction, as shown in Figure 1.
4
A
3
2
1
B C D
X
Y
1'1' 24'24'24'2'
2'
24'
24'
24'
10" thick flat slab
LoadingDL = Self weight + 20 psfLL = 80 psf
Columns are 12" x 36"with long side parallel to the Y-axis, typical
Concrete PropertiesUnit weight = 150 pcff'c = 4000 psi
5 6 7 8
9 10 11 12
13 14 15
17 18 19 204
A
3
2
1
B C D
X
Y
1'1' 24'24'24'2'
2'
24'
24'
24'
10" thick flat slab
LoadingDL = Self weight + 20 psfLL = 80 psf
Columns are 12" x 36"with long side parallel to the Y-axis, typical
Concrete PropertiesUnit weight = 150 pcff'c = 4000 psi
5 6 7 8
9 10 11 12
13 14 15
17 18 19 20
Figure 1: Flat Slab For Numerical Example
EXAMPLE ACI 318-14 RC-PN-001 - 1

Software Verification PROGRAM NAME: SAFEREVISION NO.: 0
The slab overhangs the face of the column by 6 inches along each side of the structure. The columns are typically 12 inches wide by 36 inches long, with the long side parallel to the Y-axis. The slab is typically 10 inches thick. Thick plate properties are used for the slab.
The concrete has a unit weight of 150 pcf and an f 'c of 4000 psi. The dead load consists of the self weight of the structure plus an additional 20 psf. The live load is 80 psf.
TECHNICAL FEATURES OF SAFE TESTED Calculation of punching shear capacity, shear stress, and D/C ratio.
RESULTS COMPARISON Table 1 shows the comparison of the SAFE punching shear capacity, shear stress ratio, and D/C ratio with the punching shear capacity, shear stress ratio and D/C ratio obtained by the analytical method. They match exactly for this example.
Table 1 Comparison of Design Results for Punching Shear at Grid B-2
Method Shear Stress
(ksi) Shear Capacity
(ksi) D/C ratio
SAFE 0.192 0.158 1.21
Calculated 0.193 0.158 1.22
COMPUTER FILE: ACI 318-14 RC-PN-001.FDB
CONCLUSION The SAFE results show an exact comparison with the independent results.
EXAMPLE ACI 318-14 RC-PN-001 - 2

Software VerificationPROGRAM NAME: SAFE REVISION NO.: 0
HAND CALCULATION Hand Calculation for Interior Column Using SAFE Method d = [(10 - 1) + (10 - 2)] / 2 = 8.5" Refer to Figure 2. b0 = 44.5 + 20.5 + 44.5 + 20.5 = 130"
4.25"
18"
18"
4.25"
6" 6" 4.25"4.25"
X
Y
44.5"
20.5"
Side 2
Side
3A B
CD
Column
Side
1
Side 4
Center of column is point (x1, y1). Set this equal to (0,0).
Critical section for punching shear shown dashed.
4.25"
18"
18"
4.25"
6" 6" 4.25"4.25"
X
Y
44.5"
20.5"
Side 2
Side
3A B
CD
Column
Side
1
Side 4
Center of column is point (x1, y1). Set this equal to (0,0).
Critical section for punching shear shown dashed.
Figure 2: Interior Column, Grid B-2 in SAFE Model
211 0.4955
2 44.513 20.5
Vγ = − = +
311 0.3115
2 20.513 44.5
Vγ = − = +
The coordinates of the center of the column (x1, y1) are taken as (0, 0).
EXAMPLE ACI 318-14 RC-PN-001 - 3

Software Verification PROGRAM NAME: SAFEREVISION NO.: 0
The following table is used for calculating the centroid of the critical section for punching shear. Side 1, Side 2, Side 3, and Side 4 refer to the sides of the critical section for punching shear, as identified in Figure 2.
Item Side 1 Side 2 Side 3 Side 4 Sum x2 −10.25 0 10.25 0 N.A. y2 0 22.25 0 −22.25 N.A. L 44.5 20.5 44.5 20.5 b0 = 130 d 8.5 8.5 8.5 8.5 N.A.
Ld 378.25 174.25 378.25 174.25 1105 Ldx2 −3877.06 0 3877.06 0 0 Ldy2 0 3877.06 0 −3877.06 0
23
0 0"1105
Ldxx
Ld= = =∑
23
0 0"1105
Ldyy
Ld= = =∑
The following table is used to calculate IXX, IYY and IXY. The values for IXX, IYY and IXY are given in the “Sum” column.
Item Side 1 Side 2 Side 3 Side 4 Sum L 44.5 20.5 44.5 20.5 N.A. d 8.5 8.5 8.5 8.5 N.A.
x2 - x3 −10.25 0 10.25 0 N.A. y2 - y3 0 22.25 0 −22.25 N.A.
Parallel to Y-Axis X-axis Y-Axis X-axis N.A. Equations 5b, 6b, 7 5a, 6a, 7 5b, 6b, 7 5a, 6a, 7 N.A.
IXX 64696.5 86264.6 64696.5 86264.6 301922.3 IYY 39739.9 7151.5 39739.9 7151.5 93782.8 IXY 0 0 0 0 0
From the SAFE output at Grid B-2: VU = 189.45 k
2 2V UMγ = −156.39 k-in
3 3V UMγ = 91.538 k-in
EXAMPLE ACI 318-14 RC-PN-001 - 4

Software VerificationPROGRAM NAME: SAFE REVISION NO.: 0
At the point labeled A in Figure 2, x4 = −10.25 and y4 = 22.25, thus:
( ) ( )( )
( ) ( )( )( )( ) ( )
2
2
156.39 93782.8 22.25 0 0 10.25 0189.45130 8.5 (301922.3)(93782.8) (0)
91.538 301922.3 10.25 0 0 22.25 0
301922.3 93782.8 0
− − − − = − −• −
− − − − −
Uv
vU = 0.1714 − 0.0115 − 0.0100 = 0.1499 ksi at point A
At the point labeled B in Figure 2, x4 = 10.25 and y4 = 22.25, thus:
( ) ( )( )( )( ) ( )
( ) ( )( )( )( ) ( )
2
2
156.39 93782.8 22.25 0 0 10.25 0189.45130 8.5 301922.3 93782.8 0
91.538 301922.3 10.25 0 0 22.25 0
301922.3 93782.8 0
− − − = − −• −
− − − −
Uv
vU = 0.1714 − 0.0115 + 0.0100 = 0.1699 ksi at point B
At the point labeled C in Figure 2, x4 = 10.25 and y4 = −22.25, thus:
( ) ( )( )( )( ) ( )
( ) ( )( )( )( ) ( )
2
2
156.39 93782.8 22.25 0 0 10.25 0189.45130 8.5 301922.3 93782.8 0
91.538 301922.3 10.25 0 0 22.25 0
301922.3 93782.8 0
− − − − = − −• −
− − − − −
Uv
vU = 0.1714 + 0.0115 + 0.0100 = 0.1930 ksi at point C
At the point labeled D in Figure 2, x4 = −10.25 and y4 = −22.25, thus:
( ) ( )( )( )( ) ( )
( ) ( )( )( )( ) ( )
2
2
156.39 93782.8 22.25 0 0 10.25 0189.45130 8.5 301922.3 93782.8 0
91.538 301922.3 10.25 0 0 22.25 0
301922.3 93782.8 0
− − − − − = − −• −
− − − − − −
Uv
vU = 0.1714 + 0.0115 - 0.0100 = 0.1729 ksi at point D
EXAMPLE ACI 318-14 RC-PN-001 - 5

Software Verification PROGRAM NAME: SAFEREVISION NO.: 0
Point C has the largest absolute value of vu, thus vmax = 0.1930 ksi
The shear capacity is calculated based on the smallest of ACI 318-14 equations 11-34, 11-35 and 11-36 with the b0 and d terms removed to convert force to stress.
40.75 2 400036 /12 0.1581000
Cvϕ
+ = = ksi in accordance with equation 11-34
40 8.50.75 2 4000130 0.219
1000Cvϕ
• + = = ksi in accordance with equation 11-35
ϕ • •= =
0 75 4 4000 0 1901000
C.v . ksi in accordance with equation 11-36
Equation 11-34 yields the smallest value of φvC = 0.158 ksi and thus this is the shear capacity.
0.193 1.220.158
U
C
vShear Ratiovϕ
= = =
EXAMPLE ACI 318-14 RC-PN-001 - 6

Software VerificationPROGRAM NAME: SAFE REVISION NO.: 0
EXAMPLE ACI 318-14 RC-SL-001 Slab Flexural Design
PROBLEM DESCRIPTION The purpose of this example is to verify slab flexural design in SAFE
A one-way, simple-span slab supported by walls on two opposite edges is modeled using SAFE. The slab is 6 inches thick and spans 12 feet between walls. The slab is modeled using thin plate elements. The walls are modeled as line supports. The computational model uses a finite element mesh, automatically generated by SAFE. The maximum element size is specified to be 36 inches. To obtain factored moments and flexural reinforcement in a design strip, one one-foot-wide strip is defined in the X-direction on the slab, as shown in Figure 1.
Figure 1 Plan View of One-Way Slab
One dead load case (DL80) and one live load case (LL100) with uniformly distributed surface loads of magnitudes 80 and 100 psf, respectively, are defined in the model. A load combination (COMB100) is defined using the ACI 318-14 load combination factors, 1.2 for dead loads and 1.6 for live loads. The model is analyzed for both load cases and the load combination.
The slab moment on a strip of unit width is computed analytically. The total factored strip moments are compared with the SAFE results. After completing the analysis, design is performed in accordance with ACI 318-14 using SAFE and also by hand computation. Table 1 shows the comparison of the moments and design reinforcements computed using the two methods.
GEOMETRY, PROPERTIES AND LOADING Thickness T, h = 6 in
EXAMPLE ACI 318-14 RC-SL-001 - 1

Software Verification PROGRAM NAME: SAFEREVISION NO.: 0
Depth of tensile reinf. dc = 1 in Effective depth d = 5 in Clear span ln, l1 = 144 in
Concrete strength fc = 4,000 psi Yield strength of steel fy = 60,000 psi Concrete unit weight wc = 0 pcf Modulus of elasticity Ec = 3,600 ksi Modulus of elasticity Es = 29,000 ksi Poisson’s ratio ν = 0
Dead load wd = 80 psf Live load wl = 100 psf
TECHNICAL FEATURES OF SAFE TESTED Calculation of flexural reinforcement Application of minimum flexural reinforcement
RESULTS COMPARISON Table 1 shows the comparison of the SAFE total factored moments in the design strip with the moments obtained by the hand computation method. Table 1 also shows the comparison of the design reinforcements.
Table 1 Comparison of Design Moments and Reinforcements
Load Level Method
Strip Moment
(k-in)
Reinforcement Area (sq-in)
As+
Medium SAFE 55.22 0.213
Calculated 55.22 0.213
,minA s+ = 0.1296 sq-in
COMPUTER FILE: ACI 318-14 RC-SL-001.FDB
CONCLUSION The SAFE results show an acceptable comparison with the independent results.
EXAMPLE ACI 318-14 RC-SL-001 - 2

Software VerificationPROGRAM NAME: SAFE REVISION NO.: 0
HAND CALCULATION The following quantities are computed for the load combination:
ϕ = 0.9 b = 12 in As,min = 0.0018bh = 0.1296 sq-in
140000.85 0.05 0.85
1000β
′− = − =
cf
max0.003
0.003 0.005c d= =
+1.875 in
amax = β1cmax = 1.59375 in For the load combination, w and Mu are calculated as follows:
w = (1.2wd + 1.6wt) b / 144
8
21wlMu =
As = min[As,min, (4/3) As,required] = min[0.1296, (4/3)2.11] = 0.1296 sq-in
COMB100 wd = 80 psf wt = 100 psf w = 21.33 lb/in Mu-strip = 55.22 k-in Mu-design = 55.629 k-in
The depth of the compression block is given by:
bfM
ddac
u
ϕ'2
85.02
−−= = 0.3128 in < amax
The area of tensile steel reinforcement is then given by:
−
=
2adf
MA
y
us
ϕ = 0.213 sq-in > As,min
As = 0.2114 sq-in
EXAMPLE ACI 318-14 RC-SL-001 - 3

Software VerificationPROGRAM NAME: SAFE REVISION NO.: 0
EXAMPLE ACI 318-11 PT-SL 001 Design Verification of Post-Tensioned Slab using the ACI 318-11 code
PROBLEM DESCRIPTION The purpose of this example is to verify the slab stresses and the required area of mild steel strength reinforcing for a post-tensioned slab.
A one-way, simply supported slab is modeled in SAFE. The modeled slab is 10 inches thick by 36 inches wide and spans 32 feet, as shown in shown in Figure 1. A 36-inch-wide design strip was centered along the length of the slab and was defined as an A-Strip. B-strips were placed at each end of the span perpendicular to the Strip-A (the B-Strips are necessary to define the tendon profile). A tendon, with two strands having an area of 0.153 square inches each, was added to the A-Strip. The self weight and live loads were added to the slab. The loads and post-tensioning forces are shown below. The total factored strip moments, required area of mild steel reinforcement, and slab stresses are reported at the mid-span of the slab. Independent hand calculations were compared with the SAFE results and summarized for verification and validation of the SAFE results.
Loads: Dead = self weight , Live = 100psf
EXAMPLE ACI 318-11 PT-SL 001 - 1

Software Verification PROGRAM NAME: SAFEREVISION NO.: 0
Figure 1 One-Way Slab
GEOMETRY, PROPERTIES AND LOADING Thickness, T, h = 10 in Effective depth, d = 9 in Clear span, L = 384 in Concrete strength, Cf ' = 4,000 psi Yield strength of steel, yf = 60,000 psi Prestressing, ultimate puf = 270,000 psi Prestressing, effective ef = 175,500 psi Area of Prestress (single strand), PA = 0.153 sq in Concrete unit weight, wc = 0.150 pcf Modulus of elasticity, Ec = 3,600 ksi Modulus of elasticity, Es = 29,000 ksi Poisson’s ratio, ν = 0 Dead load, wd = self psf Live load, wl = 100 psf
TECHNICAL FEATURES OF SAFE TESTED Calculation of the required flexural reinforcement Check of slab stresses due to the application of dead, live and post-tensioning
loads.
EXAMPLE ACI 318-11 PT-SL 001 - 2

Software VerificationPROGRAM NAME: SAFE REVISION NO.: 0
RESULTS COMPARISON The SAFE total factored moments, required mild steel reinforcing and slab stresses are compared to the independent hand calculations in Table 1.
Table 1 Comparison of Results
FEATURE TESTED INDEPENDENT RESULTS
SAFE RESULTS DIFFERENCE
Factored moment, Mu (Ultimate) (k-in)
1429.0 1428.3 0.05%
Area of Mild Steel req’d, As (sq-in) 2.20 2.20 0.00%
Transfer Conc. Stress, top (D+PTI), ksi −0.734 −0.735 0.14%
Transfer Conc. Stress, bot (D+PTI), ksi 0.414 0.414 0.00%
Normal Conc. Stress, top (D+L+PTF), ksi −1.518 −1.519 0.07%
Normal Conc. Stress, bot (D+L+PTF), ksi 1.220 1.221 0.08%
Long-Term Conc. Stress, top (D+0.5L+PTF(L)), ksi −1.134 −1.135 0.09%
Long-Term Conc. Stress, bot (D+0.5L+PTF(L)), ksi 0.836 0.837 0.12%
COMPUTER FILE: ACI 318-11 PT-SL-001.FDB
CONCLUSION The SAFE results show an acceptable comparison with the independent results.
EXAMPLE ACI 318-11 PT-SL 001 - 3

Software Verification PROGRAM NAME: SAFEREVISION NO.: 0
CALCULATIONS:
Design Parameters: φ =0.9
Mild Steel Reinforcing Post-Tensioning
f′c = 4000 psi fj = 216.0 ksi fy = 60,000 psi Stressing Loss = 27.0 ksi
Long-Term Loss = 13.5 ksi fi = 189.0 ksi fe = 175.5 ksi
Loads: Dead, self-wt = 10 12/ ft × 0.150 kcf = 0.125 ksf (D) × 1.2 = 0.150 ksf (Du) Live, 0.100 ksf (L) × 1.6 = 0.160 ksf (Lu)
Total =0.225 ksf (D+L) 0.310 ksf (D+L)ult
ω =0.225 ksf × 3 ft = 0.675 klf, uω = 0.310 ksf × 3ft = 0.930 klf
Ultimate Moment, 2
1
8UwlM = = 0.310 klf × 322/8 = 119.0 k-ft = 1429.0 k-in
EXAMPLE ACI 318-11 PT-SL 001 - 4

Software VerificationPROGRAM NAME: SAFE REVISION NO.: 0
Ultimate Stress in strand, 10000300PS SE
P
f ' cf fρ
= + + (span-to-depth ratio > 35)
( )4,000175,500 10,000
300 0.000944199,624 psi 205,500 psi
= + +
= ≤
Ultimate force in PT, ( ) ( )( ), 2 0.153 199.62 61.08 kips= = =ult PT P PSF A fUltimate force in RC, ( ) ( ), 2.00(assumed) 60.0 120.0 kips= = =ult RC s yF A f
Total Ultimate force, , 61.08 120.0 181.08 kips= + =ult TotalF
Stress block depth, ( )( )
, 181.08 1.48 in0.85 ' 0.85 4 36
= = =ult TotalFa
f cb
Ultimate moment due to PT, ( ), ,1.4861.08 9 0.9 454.1 k-in
2 2φ = − = − =
ult PT ult PTaM F d
Net ultimate moment, , 1429.0 454.1 974.9 k-in= − = − =net U ult PTM M M
Required area of mild steel reinforcing, ( )
2974.9 2.18 in1.480.9 60 9
2 2φ
= = = − −
netS
y
MAaf d
Note: The required area of mild steel reinforcing was calculated from an assumed amount of steel. Since the assumed value and the calculated value are not the same a second iteration can be performed. The second iteration changes the depth of the stress block and the calculated area of steel value. Upon completion of the second iteration the area of steel was found to be 2.21in2
EXAMPLE ACI 318-11 PT-SL 001 - 5

Software Verification PROGRAM NAME: SAFEREVISION NO.: 0
Check of Concrete Stresses at Mid-Span:
Initial Condition (Transfer), load combination (D + L + PTi) = 1.0D + 1.0PTI
The stress in the tendon at transfer = jacking stress − stressing losses = 216.0 − 27.0 = 189.0 ksi
The force in the tendon at transfer, = ( )( )189.0 2 0.153 57.83= kips Moment due to dead load, ( )( )20.125 3 32 8 48.0 k-ft 576 k-in= = =DMMoment due to PT, ( )(sag) 57.83 4 in 231.3 k-in= = =PT PTIM F
Stress in concrete,( )
57.83 576.0 231.310 36 600
− − −= ± = ±PTI D PTF M Mf
A S, where S = 600 in3
0 161 0 5745= − ±f . . 0.735(Comp)max,0.414(Tension)maxf
Normal Condition, load combinations: (D + L + PTF) = 1.0D + 1.0L + 1.0PTF
Tendon stress at normal = jacking − stressing − long-term = 216.0 − 27.0 − 13.5 = 175.5 ksi The force in tendon at Normal, = ( )( )175.5 2 0.153 53.70= kips Moment due to dead load, ( )( )20.125 3 32 8 48.0 k-ft 576 k-in= = =DM
Moment due to dead load, ( )( )20.100 3 32 8 38.4 k-ft 461 k-in= = =LM Moment due to PT, ( )(sag) 53.70 4 in 214.8 k-in= = =PT PTIM F
Stress in concrete for (D + L+ PTF),( )
53.70 1037.0 214.810 36 600
+ − − −= ± = ±PTI D L PTF M Mf
A S0 149 1 727 0 358f . . .= − ± ± 1.518(Comp) max,1.220(Tension) max= −f
Long-Term Condition, load combinations: (D + 0.5L + PTF(L)) = 1.0D + 0.5L + 1.0PTF
Tendon stress at normal = jacking − stressing − long-term = 216.0 − 27.0 − 13.5 = 175.5 ksi The force in tendon at Normal, = ( )( )175.5 2 0.153 53.70= kips Moment due to dead load, ( )( )20.125 3 32 8 48.0 k-ft 576 k-in= = =DM
Moment due to dead load, ( )( )20.100 3 32 8 38.4 k-ft 460 k-in= = =LMMoment due to PT, ( )(sag) 53.70 4 in 214.8 k-in= = =PT PTIM F
EXAMPLE ACI 318-11 PT-SL 001 - 6

Software VerificationPROGRAM NAME: SAFE REVISION NO.: 0
Stress in concrete for (D + 0.5L + PTF(L)),
( )0.5 53.70 806.0 214.8
10 36 600+ − − −
= ± = ±D L PTPTI M MFfA S0 149 0 985f . .= − ± 1.134(Comp) max,0.836(Tension) max= −f
EXAMPLE ACI 318-11 PT-SL 001 - 7

Software VerificationPROGRAM NAME: SAFE REVISION NO.: 0
EXAMPLE ACI 318-11 RC-BM-001 Flexural and Shear Beam Design
PROBLEM DESCRIPTION The purpose of this example is to verify the beam flexural design in SAFE. The load level is adjusted for the case corresponding to the following conditions:
The stress-block extends below the flange but remains within the balancedcondition permitted by ACI 318-11.
The average shear stress in the beam falls below the maximum shear stressallowed by ACI 318-11, requiring design shear reinforcement.
A simple-span, 20-foot-long, 12-inch-wide, and 18-inch-deep T beam with a flange 4 inches thick and 24 inches wide is modeled using SAFE. The beam is shown in Figure 1. The computational model uses a finite element mesh of frame elements, automatically generated by SAFE. The maximum element size is specified as 6 inches. The beam is supported by columns without rotational stiffnesses and with very large vertical stiffness (1 × 10²⁰ kip/in).
The beam is loaded with symmetric third-point loading. One dead load (DL02) case and one live load (LL30) case, with only symmetric third-point loads of magnitudes 3, and 30 kips, respectively, are defined in the model. One load combination (COMB30) is defined using the ACI 318-11 load combination factors of 1.2 for dead load and 1.6 for live load. The model is analyzed for both of these load cases and the load combination.
The beam moment and shear force are computed analytically. The total factored moment and shear force are compared with the SAFE results and found to be identical. After completing the analysis, the design is performed using the ACI 318-11 code in SAFE and also by hand computation. Table 1 shows thecomparison of the design longitudinal reinforcement. Table 2 shows thecomparison of the design shear reinforcement.
EXAMPLE ACI 318-11 RC-BM-001 - 1

Software Verification PROGRAM NAME: SAFEREVISION NO.: 0
Beam Section
75 mm 100 mm
300 mm
600 mm
75 mm
500 mm
Shear Force
Bending Moment
2000 mm 2000 mm 2000 mm
Beam Section
75 mm 100 mm
300 mm
600 mm
75 mm
500 mm
Shear Force
Bending Moment
2000 mm 2000 mm 2000 mm
Figure 1 The Model Beam for Flexural and Shear Design
EXAMPLE ACI 318-11 RC-BM-001 - 2

Software VerificationPROGRAM NAME: SAFE REVISION NO.: 0
GEOMETRY, PROPERTIES AND LOADING Clear span l = 240 in Overall depth h = 18 in Flange thickness ds = 4 in Width of web bw = 12 in Width of flange, bf = 24 in Depth of tensile reinf. dc = 3 in Effective depth d = 15 in Depth of comp. reinf. d' = 3 in
Concrete strength f'c = 4,000 psi
Yield strength of steel fy = 60,000 psi Concrete unit weight wc = 0 pcf Modulus of elasticity Ec = 3,600 ksi Modulus of elasticity Es = 29,000 ksi Poisson’s ratio v = 0.2
Dead load Pd = 2 kips Live load Pl = 30 kips
TECHNICAL FEATURES OF SAFE TESTED Calculation of flexural and shear reinforcement Application of minimum flexural and shear reinforcement
RESULTS COMPARISON Table 1 shows the comparison of the SAFE total factored moments in the beam with the moments obtained by the analytical method. They match exactly for this problem. Table 1 also shows the comparison of the design reinforcement.
Table 1 Comparison of Moments and Flexural Reinforcements
Method Moment
(k-in)
Reinforcement Area (sq-in)
As+
SAFE 4032 5.808
Calculated 4032 5.808
,mins+A = 0.4752 sq-in
EXAMPLE ACI 318-11 RC-BM-001 - 3

Software Verification PROGRAM NAME: SAFEREVISION NO.: 0
Table 2 Comparison of Shear Reinforcements
Shear Force (kip)
Reinforcement Area, s
Av
(sq-in/ft)
SAFE Calculated
50.40 0.592 0.592
COMPUTER FILE: ACI 318-11 RC-BM-001.FDB
CONCLUSION The SAFE results show an exact comparison with the independent results.
EXAMPLE ACI 318-11 RC-BM-001 - 4

Software VerificationPROGRAM NAME: SAFE REVISION NO.: 0
HAND CALCULATION
Flexural Design The following quantities are computed for all the load combinations:
ϕ = 0.9 Ag = 264 sq-in As,min = 0.0018Ag = 0.4752 sq-in
140000.85 0.05 0.85
1000cfβ′ − = − =
max0.003
0.003 0.005c d= =
+5.625 in
max 1 maxa cβ= = 4.78125 in
As = min[As,min, (4/3) As,required] = min[0.4752, (4/3)5.804] = 0.4752 sq-in
COMB30 Pu = (1.2Pd + 1.6Pt) = 50.4 k
3u
uP lM = = 4032 k-in
The depth of the compression block is given by:
2'
20.85
u
c f
Ma d d
f bϕ= − − = 4.2671 in (a > ds)
Calculation for As is performed in two parts. The first part is for balancing the compressive force from the flange, Cf, and the second part is for balancing the compressive force from the web, Cw. Cf is given by:
Cf = 0.85fc' (bf − bw) ds = 163.2 k
The portion of Mu that is resisted by the flange is given by:
Muf = Cf
−2
sdd ϕ = 1909.44 k-in
EXAMPLE ACI 318-11 RC-BM-001 - 5

Software Verification PROGRAM NAME: SAFEREVISION NO.: 0
Therefore, the area of tensile steel reinforcement to balance flange compression is:
As1 = ( ) ϕ− 2sy
uf
ddfM
= 2.7200 sq-in
The balance of the moment to be carried by the web is given by:
Muw = Mu − Muf = 2122.56 k-in
The web is a rectangular section with dimensions bw and d, for which the design depth of the compression block is recalculated as
a1 = d − 2 20.85
uw
c w
Mdf bϕ
−′
= 4.5409 in (a1 ≤ amax)
The area of tensile steel reinforcement to balance the web compression is then given by:
As2 = ϕ
−ϕ2
1adf
M
y
uw = 3.0878 sq-in
The area of total tensile steel reinforcement is then given by:
As = As1 + As2 = 5.808 sq-in
Shear Design The following quantities are computed for all of the load combinations:
ϕ = 0.75
Check the limit of cf ′ :
cf ′ = 63.246 psi < 100 psi
The concrete shear capacity is given by:
ϕ Vc = ϕ 2 cf ′ bwd = 17.076 k
The maximum shear that can be carried by reinforcement is given by:
EXAMPLE ACI 318-11 RC-BM-001 - 6

Software VerificationPROGRAM NAME: SAFE REVISION NO.: 0
ϕ Vs = ϕ 8 cf ′ bwd = 68.305 k
The following limits are required in the determination of the reinforcement:
(ϕ Vc/2) = 8.538 k
(ϕ Vc + ϕ 50 bwd) = 23.826 k
Vmax = ϕ Vc + ϕ Vs = 85.381 k Given Vu, Vc and Vmax, the required shear reinforcement in area/unit length for any load combination is calculated as follows:
If Vu ≤ (Vc/2) ϕ,
sAv = 0,
else if (Vc/2) ϕ < Vu ≤ (ϕVc + ϕ 50 bwd),
sAv =
y
w
fb50 ,
else if (ϕVc + ϕ 50 bwd) < Vu ≤ ϕ Vmax
sAv =
dfVV
ys
cu
ϕϕ− )(
else if Vu > ϕ Vmax, a failure condition is declared.
For each load combination, the Pu and Vu are calculated as follows: Pu = 1.2Pd + 1.6P1
Vu = Pu
(COMB30) Pd = 2 k Pl = 30 k Pu = 50.4 k
Vu = 50.4 k, (ϕVc + ϕ 50 bwd) < Vu ≤ ϕ Vmax
sAv =
dfVV
ys
cu
ϕϕ− )(
= 0.04937 sq-in/in or 0.592 sq-in/ft
EXAMPLE ACI 318-11 RC-BM-001 - 7

Software VerificationPROGRAM NAME: SAFE REVISION NO.: 0
EXAMPLE ACI 318-11 RC-PN-001 Slab Punching Shear Design
PROBLEM DESCRIPTION The purpose of this example is to verify slab punching shear design in SAFE.
The numerical example is a flat slab that has three 24-foot-long spans in each direction, as shown in Figure 1.
4
A
3
2
1
B C D
X
Y
1'1' 24'24'24'2'
2'
24'
24'
24'
10" thick flat slab
LoadingDL = Self weight + 20 psfLL = 80 psf
Columns are 12" x 36"with long side parallel to the Y-axis, typical
Concrete PropertiesUnit weight = 150 pcff'c = 4000 psi
5 6 7 8
9 10 11 12
13 14 15
17 18 19 204
A
3
2
1
B C D
X
Y
1'1' 24'24'24'2'
2'
24'
24'
24'
10" thick flat slab
LoadingDL = Self weight + 20 psfLL = 80 psf
Columns are 12" x 36"with long side parallel to the Y-axis, typical
Concrete PropertiesUnit weight = 150 pcff'c = 4000 psi
5 6 7 8
9 10 11 12
13 14 15
17 18 19 20
Figure 1: Flat Slab For Numerical Example
EXAMPLE ACI 318-11 RC-PN-001 - 1

Software Verification PROGRAM NAME: SAFEREVISION NO.: 0
The slab overhangs the face of the column by 6 inches along each side of the structure. The columns are typically 12 inches wide by 36 inches long, with the long side parallel to the Y-axis. The slab is typically 10 inches thick. Thick plate properties are used for the slab.
The concrete has a unit weight of 150 pcf and an f 'c of 4000 psi. The dead load consists of the self weight of the structure plus an additional 20 psf. The live load is 80 psf.
TECHNICAL FEATURES OF SAFE TESTED Calculation of punching shear capacity, shear stress, and D/C ratio.
RESULTS COMPARISON Table 1 shows the comparison of the SAFE punching shear capacity, shear stress ratio, and D/C ratio with the punching shear capacity, shear stress ratio and D/C ratio obtained by the analytical method. They match exactly for this example.
Table 1 Comparison of Design Results for Punching Shear at Grid B-2
Method Shear Stress
(ksi) Shear Capacity
(ksi) D/C ratio
SAFE 0.192 0.158 1.21
Calculated 0.193 0.158 1.22
COMPUTER FILE: ACI 318-11 RC-PN-001.FDB
CONCLUSION The SAFE results show an exact comparison with the independent results.
EXAMPLE ACI 318-11 RC-PN-001 - 2

Software VerificationPROGRAM NAME: SAFE REVISION NO.: 0
HAND CALCULATION Hand Calculation for Interior Column Using SAFE Method d = [(10 - 1) + (10 - 2)] / 2 = 8.5" Refer to Figure 2. b0 = 44.5 + 20.5 + 44.5 + 20.5 = 130"
4.25"
18"
18"
4.25"
6" 6" 4.25"4.25"
X
Y
44.5"
20.5"
Side 2
Side
3A B
CD
Column
Side
1
Side 4
Center of column is point (x1, y1). Set this equal to (0,0).
Critical section for punching shear shown dashed.
4.25"
18"
18"
4.25"
6" 6" 4.25"4.25"
X
Y
44.5"
20.5"
Side 2
Side
3A B
CD
Column
Side
1
Side 4
Center of column is point (x1, y1). Set this equal to (0,0).
Critical section for punching shear shown dashed.
Figure 2: Interior Column, Grid B-2 in SAFE Model
211 0.4955
2 44.513 20.5
Vγ = − = +
311 0.3115
2 20.513 44.5
Vγ = − = +
The coordinates of the center of the column (x1, y1) are taken as (0, 0).
EXAMPLE ACI 318-11 RC-PN-001 - 3

Software Verification PROGRAM NAME: SAFEREVISION NO.: 0
The following table is used for calculating the centroid of the critical section for punching shear. Side 1, Side 2, Side 3, and Side 4 refer to the sides of the critical section for punching shear, as identified in Figure 2.
Item Side 1 Side 2 Side 3 Side 4 Sum x2 −10.25 0 10.25 0 N.A. y2 0 22.25 0 −22.25 N.A. L 44.5 20.5 44.5 20.5 b0 = 130 d 8.5 8.5 8.5 8.5 N.A.
Ld 378.25 174.25 378.25 174.25 1105 Ldx2 −3877.06 0 3877.06 0 0 Ldy2 0 3877.06 0 −3877.06 0
23
0 0"1105
Ldxx
Ld= = =∑
23
0 0"1105
Ldyy
Ld= = =∑
The following table is used to calculate IXX, IYY and IXY. The values for IXX, IYY and IXY are given in the “Sum” column.
Item Side 1 Side 2 Side 3 Side 4 Sum L 44.5 20.5 44.5 20.5 N.A. d 8.5 8.5 8.5 8.5 N.A.
x2 - x3 −10.25 0 10.25 0 N.A. y2 - y3 0 22.25 0 −22.25 N.A.
Parallel to Y-Axis X-axis Y-Axis X-axis N.A. Equations 5b, 6b, 7 5a, 6a, 7 5b, 6b, 7 5a, 6a, 7 N.A.
IXX 64696.5 86264.6 64696.5 86264.6 301922.3 IYY 39739.9 7151.5 39739.9 7151.5 93782.8 IXY 0 0 0 0 0
From the SAFE output at Grid B-2: VU = 189.45 k
2 2V UMγ = −156.39 k-in
3 3V UMγ = 91.538 k-in
EXAMPLE ACI 318-11 RC-PN-001 - 4

Software VerificationPROGRAM NAME: SAFE REVISION NO.: 0
At the point labeled A in Figure 2, x4 = −10.25 and y4 = 22.25, thus:
( ) ( )( )
( ) ( )( )( )( ) ( )
2
2
156.39 93782.8 22.25 0 0 10.25 0189.45130 8.5 (301922.3)(93782.8) (0)
91.538 301922.3 10.25 0 0 22.25 0
301922.3 93782.8 0
− − − − = − −• −
− − − − −
Uv
vU = 0.1714 − 0.0115 − 0.0100 = 0.1499 ksi at point A
At the point labeled B in Figure 2, x4 = 10.25 and y4 = 22.25, thus:
( ) ( )( )( )( ) ( )
( ) ( )( )( )( ) ( )
2
2
156.39 93782.8 22.25 0 0 10.25 0189.45130 8.5 301922.3 93782.8 0
91.538 301922.3 10.25 0 0 22.25 0
301922.3 93782.8 0
− − − = − −• −
− − − −
Uv
vU = 0.1714 − 0.0115 + 0.0100 = 0.1699 ksi at point B
At the point labeled C in Figure 2, x4 = 10.25 and y4 = −22.25, thus:
( ) ( )( )( )( ) ( )
( ) ( )( )( )( ) ( )
2
2
156.39 93782.8 22.25 0 0 10.25 0189.45130 8.5 301922.3 93782.8 0
91.538 301922.3 10.25 0 0 22.25 0
301922.3 93782.8 0
− − − − = − −• −
− − − − −
Uv
vU = 0.1714 + 0.0115 + 0.0100 = 0.1930 ksi at point C
At the point labeled D in Figure 2, x4 = −10.25 and y4 = −22.25, thus:
( ) ( )( )( )( ) ( )
( ) ( )( )( )( ) ( )
2
2
156.39 93782.8 22.25 0 0 10.25 0189.45130 8.5 301922.3 93782.8 0
91.538 301922.3 10.25 0 0 22.25 0
301922.3 93782.8 0
− − − − − = − −• −
− − − − − −
Uv
vU = 0.1714 + 0.0115 - 0.0100 = 0.1729 ksi at point D
EXAMPLE ACI 318-11 RC-PN-001 - 5

Software Verification PROGRAM NAME: SAFEREVISION NO.: 0
Point C has the largest absolute value of vu, thus vmax = 0.1930 ksi
The shear capacity is calculated based on the smallest of ACI 318-11 equations 11-34, 11-35 and 11-36 with the b0 and d terms removed to convert force to stress.
40.75 2 400036 /12 0.1581000
Cvϕ
+ = = ksi in accordance with equation 11-34
40 8.50.75 2 4000130 0.219
1000Cvϕ
• + = = ksi in accordance with equation 11-35
ϕ • •= =
0 75 4 4000 0 1901000
C.v . ksi in accordance with equation 11-36
Equation 11-34 yields the smallest value of φvC = 0.158 ksi and thus this is the shear capacity.
0.193 1.220.158
U
C
vShear Ratiovϕ
= = =
EXAMPLE ACI 318-11 RC-PN-001 - 6
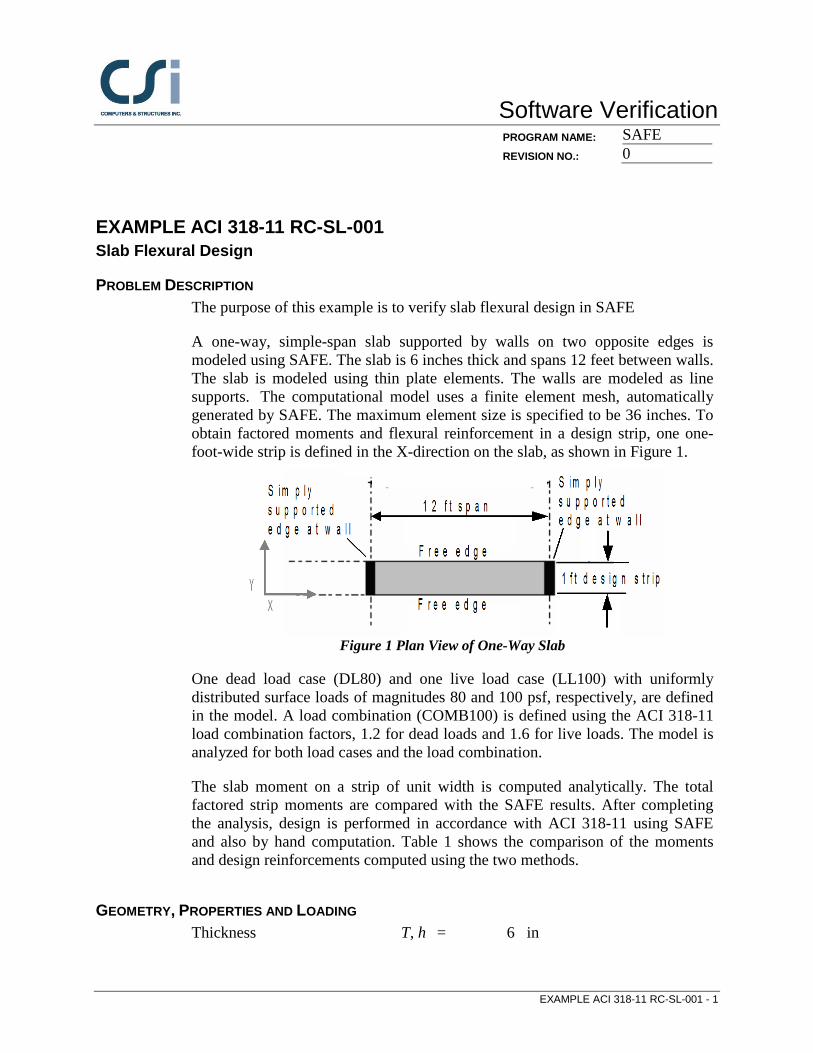
Software VerificationPROGRAM NAME: SAFE REVISION NO.: 0
EXAMPLE ACI 318-11 RC-SL-001 Slab Flexural Design
PROBLEM DESCRIPTION The purpose of this example is to verify slab flexural design in SAFE
A one-way, simple-span slab supported by walls on two opposite edges is modeled using SAFE. The slab is 6 inches thick and spans 12 feet between walls. The slab is modeled using thin plate elements. The walls are modeled as line supports. The computational model uses a finite element mesh, automatically generated by SAFE. The maximum element size is specified to be 36 inches. To obtain factored moments and flexural reinforcement in a design strip, one one-foot-wide strip is defined in the X-direction on the slab, as shown in Figure 1.
Figure 1 Plan View of One-Way Slab
One dead load case (DL80) and one live load case (LL100) with uniformly distributed surface loads of magnitudes 80 and 100 psf, respectively, are defined in the model. A load combination (COMB100) is defined using the ACI 318-11 load combination factors, 1.2 for dead loads and 1.6 for live loads. The model is analyzed for both load cases and the load combination.
The slab moment on a strip of unit width is computed analytically. The total factored strip moments are compared with the SAFE results. After completing the analysis, design is performed in accordance with ACI 318-11 using SAFE and also by hand computation. Table 1 shows the comparison of the moments and design reinforcements computed using the two methods.
GEOMETRY, PROPERTIES AND LOADING Thickness T, h = 6 in
EXAMPLE ACI 318-11 RC-SL-001 - 1

Software Verification PROGRAM NAME: SAFEREVISION NO.: 0
Depth of tensile reinf. dc = 1 in Effective depth d = 5 in Clear span ln, l1 = 144 in
Concrete strength fc = 4,000 psi Yield strength of steel fy = 60,000 psi Concrete unit weight wc = 0 pcf Modulus of elasticity Ec = 3,600 ksi Modulus of elasticity Es = 29,000 ksi Poisson’s ratio ν = 0
Dead load wd = 80 psf Live load wl = 100 psf
TECHNICAL FEATURES OF SAFE TESTED Calculation of flexural reinforcement Application of minimum flexural reinforcement
RESULTS COMPARISON Table 1 shows the comparison of the SAFE total factored moments in the design strip with the moments obtained by the hand computation method. Table 1 also shows the comparison of the design reinforcements.
Table 1 Comparison of Design Moments and Reinforcements
Load Level Method
Strip Moment
(k-in)
Reinforcement Area (sq-in)
As+
Medium SAFE 55.22 0.213
Calculated 55.22 0.213
,minA s+ = 0.1296 sq-in
COMPUTER FILE: ACI 318-11 RC-SL-001.FDB
CONCLUSION The SAFE results show an acceptable comparison with the independent results.
EXAMPLE ACI 318-11 RC-SL-001 - 2

Software VerificationPROGRAM NAME: SAFE REVISION NO.: 0
HAND CALCULATION The following quantities are computed for the load combination:
ϕ = 0.9 b = 12 in As,min = 0.0018bh = 0.1296 sq-in
140000.85 0.05 0.85
1000β
′− = − =
cf
max0.003
0.003 0.005c d= =
+1.875 in
amax = β1cmax = 1.59375 in For the load combination, w and Mu are calculated as follows:
w = (1.2wd + 1.6wt) b / 144
8
21wlMu =
As = min[As,min, (4/3) As,required] = min[0.1296, (4/3)2.11] = 0.1296 sq-in
COMB100 wd = 80 psf wt = 100 psf w = 21.33 lb/in Mu-strip = 55.22 k-in Mu-design = 55.629 k-in
The depth of the compression block is given by:
bfM
ddac
u
ϕ'2
85.02
−−= = 0.3128 in < amax
The area of tensile steel reinforcement is then given by:
−
=
2adf
MA
y
us
ϕ = 0.213 sq-in > As,min
As = 0.2114 sq-in
EXAMPLE ACI 318-11 RC-SL-001 - 3

Software VerificationPROGRAM NAME: SAFE REVISION NO.: 0
EXAMPLE ACI 318-08 PT-SL 001 Design Verification of Post-Tensioned Slab using the ACI 318-08 code
PROBLEM DESCRIPTION The purpose of this example is to verify the slab stresses and the required area of mild steel strength reinforcing for a post-tensioned slab.
A one-way, simply supported slab is modeled in SAFE. The modeled slab is 10 inches thick by 36 inches wide and spans 32 feet, as shown in shown in Figure 1. A 36-inch-wide design strip was centered along the length of the slab and was defined as an A-Strip. B-strips were placed at each end of the span perpendicular to the Strip-A (the B-Strips are necessary to define the tendon profile). A tendon, with two strands having an area of 0.153 square inches each, was added to the A-Strip. The self weight and live loads were added to the slab. The loads and post-tensioning forces are shown below. The total factored strip moments, required area of mild steel reinforcement, and slab stresses are reported at the mid-span of the slab. Independent hand calculations were compared with the SAFE results and summarized for verification and validation of the SAFE results.
Loads: Dead = self weight , Live = 100psf
EXAMPLE ACI 318-08 PT-SL 001 - 1

Software Verification PROGRAM NAME: SAFEREVISION NO.: 0
Figure 1 One-Way Slab
GEOMETRY, PROPERTIES AND LOADING Thickness, T, h = 10 in Effective depth, d = 9 in Clear span, L = 384 in Concrete strength, Cf ' = 4,000 psi Yield strength of steel, yf = 60,000 psi Prestressing, ultimate puf = 270,000 psi Prestressing, effective ef = 175,500 psi Area of Prestress (single strand), PA = 0.153 sq in Concrete unit weight, wc = 0.150 pcf Modulus of elasticity, Ec = 3,600 ksi Modulus of elasticity, Es = 29,000 ksi Poisson’s ratio, ν = 0 Dead load, wd = self psf Live load, wl = 100 psf
TECHNICAL FEATURES OF SAFE TESTED Calculation of the required flexural reinforcement Check of slab stresses due to the application of dead, live and post-tensioning
loads.
EXAMPLE ACI 318-08 PT-SL 001 - 2

Software VerificationPROGRAM NAME: SAFE REVISION NO.: 0
RESULTS COMPARISON The SAFE total factored moments, required mild steel reinforcing and slab stresses are compared to the independent hand calculations in Table 1.
Table 1 Comparison of Results
FEATURE TESTED INDEPENDENT RESULTS
SAFE RESULTS DIFFERENCE
Factored moment, Mu (Ultimate) (k-in)
1429.0 1428.3 0.05%
Area of Mild Steel req’d, As (sq-in) 2.20 2.20 0.00%
Transfer Conc. Stress, top (D+PTI), ksi −0.734 −0.735 0.14%
Transfer Conc. Stress, bot (D+PTI), ksi 0.414 0.414 0.00%
Normal Conc. Stress, top (D+L+PTF), ksi −1.518 −1.519 0.07%
Normal Conc. Stress, bot (D+L+PTF), ksi 1.220 1.221 0.08%
Long-Term Conc. Stress, top (D+0.5L+PTF(L)), ksi −1.134 −1.135 0.09%
Long-Term Conc. Stress, bot (D+0.5L+PTF(L)), ksi 0.836 0.837 0.12%
COMPUTER FILE: ACI 318-05 PT-SL-001.FDB
CONCLUSION The SAFE results show an acceptable comparison with the independent results.
EXAMPLE ACI 318-08 PT-SL 001 - 3

Software Verification PROGRAM NAME: SAFEREVISION NO.: 0
CALCULATIONS:
Design Parameters: φ =0.9
Mild Steel Reinforcing Post-Tensioning
f′c = 4000 psi fj = 216.0 ksi fy = 60,000 psi Stressing Loss = 27.0 ksi
Long-Term Loss = 13.5 ksi fi = 189.0 ksi fe = 175.5 ksi
Loads: Dead, self-wt = 10 12/ ft × 0.150 kcf = 0.125 ksf (D) × 1.2 = 0.150 ksf (Du) Live, 0.100 ksf (L) × 1.6 = 0.160 ksf (Lu)
Total =0.225 ksf (D+L) 0.310 ksf (D+L)ult
ω =0.225 ksf × 3 ft = 0.675 klf, uω = 0.310 ksf × 3ft = 0.930 klf
Ultimate Moment, 2
1
8UwlM = = 0.310 klf × 322/8 = 119.0 k-ft = 1429.0 k-in
EXAMPLE ACI 318-08 PT-SL 001 - 4

Software VerificationPROGRAM NAME: SAFE REVISION NO.: 0
Ultimate Stress in strand, 10000300PS SE
P
f ' cf fρ
= + + (span-to-depth ratio > 35)
( )4,000175,500 10,000
300 0.000944199,624 psi 205,500 psi
= + +
= ≤
Ultimate force in PT, ( ) ( )( ), 2 0.153 199.62 61.08 kips= = =ult PT P PSF A fUltimate force in RC, ( ) ( ), 2.00(assumed) 60.0 120.0 kips= = =ult RC s yF A f
Total Ultimate force, , 61.08 120.0 181.08 kips= + =ult TotalF
Stress block depth, ( )( )
, 181.08 1.48 in0.85 ' 0.85 4 36
= = =ult TotalFa
f cb
Ultimate moment due to PT, ( ), ,1.4861.08 9 0.9 454.1 k-in
2 2φ = − = − =
ult PT ult PTaM F d
Net ultimate moment, , 1429.0 454.1 974.9 k-in= − = − =net U ult PTM M M
Required area of mild steel reinforcing, ( )
2974.9 2.18 in1.480.9 60 9
2 2φ
= = = − −
netS
y
MAaf d
Note: The required area of mild steel reinforcing was calculated from an assumed amount of steel. Since the assumed value and the calculated value are not the same a second iteration can be performed. The second iteration changes the depth of the stress block and the calculated area of steel value. Upon completion of the second iteration the area of steel was found to be 2.21in2
EXAMPLE ACI 318-08 PT-SL 001 - 5

Software Verification PROGRAM NAME: SAFEREVISION NO.: 0
Check of Concrete Stresses at Mid-Span:
Initial Condition (Transfer), load combination (D + L + PTi) = 1.0D + 1.0PTI
The stress in the tendon at transfer = jacking stress − stressing losses = 216.0 − 27.0 = 189.0 ksi
The force in the tendon at transfer, = ( )( )189.0 2 0.153 57.83= kips Moment due to dead load, ( )( )20.125 3 32 8 48.0 k-ft 576 k-in= = =DMMoment due to PT, ( )(sag) 57.83 4 in 231.3 k-in= = =PT PTIM F
Stress in concrete,( )
57.83 576.0 231.310 36 600
− − −= ± = ±PTI D PTF M Mf
A S, where S = 600 in3
0 161 0 5745= − ±f . . 0.735(Comp)max,0.414(Tension)maxf
Normal Condition, load combinations: (D + L + PTF) = 1.0D + 1.0L + 1.0PTF
Tendon stress at normal = jacking − stressing − long-term = 216.0 − 27.0 − 13.5 = 175.5 ksi The force in tendon at Normal, = ( )( )175.5 2 0.153 53.70= kips Moment due to dead load, ( )( )20.125 3 32 8 48.0 k-ft 576 k-in= = =DM
Moment due to dead load, ( )( )20.100 3 32 8 38.4 k-ft 461 k-in= = =LM Moment due to PT, ( )(sag) 53.70 4 in 214.8 k-in= = =PT PTIM F
Stress in concrete for (D + L+ PTF),( )
53.70 1037.0 214.810 36 600
+ − − −= ± = ±PTI D L PTF M Mf
A S0 149 1 727 0 358f . . .= − ± ± 1.518(Comp) max,1.220(Tension) max= −f
Long-Term Condition, load combinations: (D + 0.5L + PTF(L)) = 1.0D + 0.5L + 1.0PTF
Tendon stress at normal = jacking − stressing − long-term = 216.0 − 27.0 − 13.5 = 175.5 ksi The force in tendon at Normal, = ( )( )175.5 2 0.153 53.70= kips Moment due to dead load, ( )( )20.125 3 32 8 48.0 k-ft 576 k-in= = =DM
Moment due to dead load, ( )( )20.100 3 32 8 38.4 k-ft 460 k-in= = =LMMoment due to PT, ( )(sag) 53.70 4 in 214.8 k-in= = =PT PTIM F
EXAMPLE ACI 318-08 PT-SL 001 - 6

Software VerificationPROGRAM NAME: SAFE REVISION NO.: 0
Stress in concrete for (D + 0.5L + PTF(L)),
( )0.5 53.70 806.0 214.8
10 36 600+ − − −
= ± = ±D L PTPTI M MFfA S0 149 0 985f . .= − ± 1.134(Comp) max,0.836(Tension) max= −f
EXAMPLE ACI 318-08 PT-SL 001 - 7

Software VerificationPROGRAM NAME: SAFE REVISION NO.: 0
EXAMPLE ACI 318-08 RC-BM-001 Flexural and Shear Beam Design
PROBLEM DESCRIPTION The purpose of this example is to verify the beam flexural design in SAFE. The load level is adjusted for the case corresponding to the following conditions:
The stress-block extends below the flange but remains within the balancedcondition permitted by ACI 318-08.
The average shear stress in the beam falls below the maximum shear stressallowed by ACI 318-08, requiring design shear reinforcement.
A simple-span, 20-foot-long, 12-inch-wide, and 18-inch-deep T beam with a flange 4 inches thick and 24 inches wide is modeled using SAFE. The beam is shown in Figure 1. The computational model uses a finite element mesh of frame elements, automatically generated by SAFE. The maximum element size is specified as 6 inches. The beam is supported by columns without rotational stiffnesses and with very large vertical stiffness (1 × 10²⁰ kip/in).
The beam is loaded with symmetric third-point loading. One dead load (DL02) case and one live load (LL30) case, with only symmetric third-point loads of magnitudes 3, and 30 kips, respectively, are defined in the model. One load combination (COMB30) is defined using the ACI 318-08 load combination factors of 1.2 for dead load and 1.6 for live load. The model is analyzed for both of these load cases and the load combination.
The beam moment and shear force are computed analytically. The total factored moment and shear force are compared with the SAFE results and found to be identical. After completing the analysis, the design is performed using the ACI 318-08 code in SAFE and also by hand computation. Table 1 shows thecomparison of the design longitudinal reinforcement. Table 2 shows thecomparison of the design shear reinforcement.
EXAMPLE ACI 318-08 RC-BM-001 - 1

Software Verification PROGRAM NAME: SAFEREVISION NO.: 0
Beam Section
75 mm 100 mm
300 mm
600 mm
75 mm
500 mm
Shear Force
Bending Moment
2000 mm 2000 mm 2000 mm
Beam Section
75 mm 100 mm
300 mm
600 mm
75 mm
500 mm
Shear Force
Bending Moment
2000 mm 2000 mm 2000 mm
Figure 1 The Model Beam for Flexural and Shear Design
EXAMPLE ACI 318-08 RC-BM-001 - 2

Software VerificationPROGRAM NAME: SAFE REVISION NO.: 0
GEOMETRY, PROPERTIES AND LOADING Clear span l = 240 in Overall depth h = 18 in Flange thickness ds = 4 in Width of web bw = 12 in Width of flange, bf = 24 in Depth of tensile reinf. dc = 3 in Effective depth d = 15 in Depth of comp. reinf. d' = 3 in
Concrete strength f'c = 4,000 psi
Yield strength of steel fy = 60,000 psi Concrete unit weight wc = 0 pcf Modulus of elasticity Ec = 3,600 ksi Modulus of elasticity Es = 29,000 ksi Poisson’s ratio v = 0.2
Dead load Pd = 2 kips Live load Pl = 30 kips
TECHNICAL FEATURES OF SAFE TESTED Calculation of flexural and shear reinforcement Application of minimum flexural and shear reinforcement
RESULTS COMPARISON Table 1 shows the comparison of the SAFE total factored moments in the beam with the moments obtained by the analytical method. They match exactly for this problem. Table 1 also shows the comparison of the design reinforcement.
Table 1 Comparison of Moments and Flexural Reinforcements
Method Moment
(k-in)
Reinforcement Area (sq-in)
As+
SAFE 4032 5.808
Calculated 4032 5.808
,mins+A = 0.4752 sq-in
EXAMPLE ACI 318-08 RC-BM-001 - 3

Software Verification PROGRAM NAME: SAFEREVISION NO.: 0
Table 2 Comparison of Shear Reinforcements
Shear Force (kip)
Reinforcement Area, s
Av
(sq-in/ft)
SAFE Calculated
50.40 0.592 0.592
COMPUTER FILE: ACI 318-08 RC-BM-001.FDB
CONCLUSION The SAFE results show an exact comparison with the independent results.
EXAMPLE ACI 318-08 RC-BM-001 - 4

Software VerificationPROGRAM NAME: SAFE REVISION NO.: 0
HAND CALCULATION
Flexural Design The following quantities are computed for all the load combinations:
ϕ = 0.9 Ag = 264 sq-in As,min = 0.0018Ag = 0.4752 sq-in
140000.85 0.05 0.85
1000cfβ′ − = − =
max0.003
0.003 0.005c d= =
+5.625 in
max 1 maxa cβ= = 4.78125 in
As = min[As,min, (4/3) As,required] = min[0.4752, (4/3)5.804] = 0.4752 sq-in
COMB30 Pu = (1.2Pd + 1.6Pt) = 50.4 k
3u
uP lM = = 4032 k-in
The depth of the compression block is given by:
2'
20.85
u
c f
Ma d d
f bϕ= − − = 4.2671 in (a > ds)
Calculation for As is performed in two parts. The first part is for balancing the compressive force from the flange, Cf, and the second part is for balancing the compressive force from the web, Cw. Cf is given by:
Cf = 0.85fc' (bf − bw) ds = 163.2 k
The portion of Mu that is resisted by the flange is given by:
Muf = Cf
−2
sdd ϕ = 1909.44 k-in
EXAMPLE ACI 318-08 RC-BM-001 - 5

Software Verification PROGRAM NAME: SAFEREVISION NO.: 0
Therefore, the area of tensile steel reinforcement to balance flange compression is:
As1 = ( ) ϕ− 2sy
uf
ddfM
= 2.7200 sq-in
The balance of the moment to be carried by the web is given by:
Muw = Mu − Muf = 2122.56 k-in
The web is a rectangular section with dimensions bw and d, for which the design depth of the compression block is recalculated as
a1 = d − 2 20.85
uw
c w
Mdf bϕ
−′
= 4.5409 in (a1 ≤ amax)
The area of tensile steel reinforcement to balance the web compression is then given by:
As2 = ϕ
−ϕ2
1adf
M
y
uw = 3.0878 sq-in
The area of total tensile steel reinforcement is then given by:
As = As1 + As2 = 5.808 sq-in
Shear Design The following quantities are computed for all of the load combinations:
ϕ = 0.75
Check the limit of cf ′ :
cf ′ = 63.246 psi < 100 psi
The concrete shear capacity is given by:
ϕ Vc = ϕ 2 cf ′ bwd = 17.076 k
The maximum shear that can be carried by reinforcement is given by:
EXAMPLE ACI 318-08 RC-BM-001 - 6

Software VerificationPROGRAM NAME: SAFE REVISION NO.: 0
ϕ Vs = ϕ 8 cf ′ bwd = 68.305 k
The following limits are required in the determination of the reinforcement:
(ϕ Vc/2) = 8.538 k
(ϕ Vc + ϕ 50 bwd) = 23.826 k
Vmax = ϕ Vc + ϕ Vs = 85.381 k Given Vu, Vc and Vmax, the required shear reinforcement in area/unit length for any load combination is calculated as follows:
If Vu ≤ (Vc/2) ϕ,
sAv = 0,
else if (Vc/2) ϕ < Vu ≤ (ϕVc + ϕ 50 bwd),
sAv =
y
w
fb50 ,
else if (ϕVc + ϕ 50 bwd) < Vu ≤ ϕ Vmax
sAv =
dfVV
ys
cu
ϕϕ− )(
else if Vu > ϕ Vmax, a failure condition is declared.
For each load combination, the Pu and Vu are calculated as follows: Pu = 1.2Pd + 1.6P1
Vu = Pu
(COMB30) Pd = 2 k Pl = 30 k Pu = 50.4 k
Vu = 50.4 k, (ϕVc + ϕ 50 bwd) < Vu ≤ ϕ Vmax
sAv =
dfVV
ys
cu
ϕϕ− )(
= 0.04937 sq-in/in or 0.592 sq-in/ft
EXAMPLE ACI 318-08 RC-BM-001 - 7

Software VerificationPROGRAM NAME: SAFE REVISION NO.: 0
EXAMPLE ACI 318-08 RC-PN-001 Slab Punching Shear Design
PROBLEM DESCRIPTION The purpose of this example is to verify slab punching shear design in SAFE.
The numerical example is a flat slab that has three 24-foot-long spans in each direction, as shown in Figure 1.
4
A
3
2
1
B C D
X
Y
1'1' 24'24'24'2'
2'
24'
24'
24'
10" thick flat slab
LoadingDL = Self weight + 20 psfLL = 80 psf
Columns are 12" x 36"with long side parallel to the Y-axis, typical
Concrete PropertiesUnit weight = 150 pcff'c = 4000 psi
5 6 7 8
9 10 11 12
13 14 15
17 18 19 204
A
3
2
1
B C D
X
Y
1'1' 24'24'24'2'
2'
24'
24'
24'
10" thick flat slab
LoadingDL = Self weight + 20 psfLL = 80 psf
Columns are 12" x 36"with long side parallel to the Y-axis, typical
Concrete PropertiesUnit weight = 150 pcff'c = 4000 psi
5 6 7 8
9 10 11 12
13 14 15
17 18 19 20
Figure 1: Flat Slab For Numerical Example
EXAMPLE ACI 318-08 RC-PN-001 - 1

Software Verification PROGRAM NAME: SAFEREVISION NO.: 0
The slab overhangs the face of the column by 6 inches along each side of the structure. The columns are typically 12 inches wide by 36 inches long, with the long side parallel to the Y-axis. The slab is typically 10 inches thick. Thick plate properties are used for the slab.
The concrete has a unit weight of 150 pcf and an f 'c of 4000 psi. The dead load consists of the self weight of the structure plus an additional 20 psf. The live load is 80 psf.
TECHNICAL FEATURES OF SAFE TESTED Calculation of punching shear capacity, shear stress, and D/C ratio.
RESULTS COMPARISON Table 1 shows the comparison of the SAFE punching shear capacity, shear stress ratio, and D/C ratio with the punching shear capacity, shear stress ratio and D/C ratio obtained by the analytical method. They match exactly for this example.
Table 1 Comparison of Design Results for Punching Shear at Grid B-2
Method Shear Stress
(ksi) Shear Capacity
(ksi) D/C ratio
SAFE 0.192 0.158 1.21
Calculated 0.193 0.158 1.22
COMPUTER FILE: ACI 318-08 RC-PN-001.FDB
CONCLUSION The SAFE results show an exact comparison with the independent results.
EXAMPLE ACI 318-08 RC-PN-001 - 2

Software VerificationPROGRAM NAME: SAFE REVISION NO.: 0
HAND CALCULATION Hand Calculation for Interior Column Using SAFE Method d = [(10 - 1) + (10 - 2)] / 2 = 8.5" Refer to Figure 2. b0 = 44.5 + 20.5 + 44.5 + 20.5 = 130"
4.25"
18"
18"
4.25"
6" 6" 4.25"4.25"
X
Y
44.5"
20.5"
Side 2
Side
3A B
CD
Column
Side
1
Side 4
Center of column is point (x1, y1). Set this equal to (0,0).
Critical section for punching shear shown dashed.
4.25"
18"
18"
4.25"
6" 6" 4.25"4.25"
X
Y
44.5"
20.5"
Side 2
Side
3A B
CD
Column
Side
1
Side 4
Center of column is point (x1, y1). Set this equal to (0,0).
Critical section for punching shear shown dashed.
Figure 2: Interior Column, Grid B-2 in SAFE Model
211 0.4955
2 44.513 20.5
Vγ = − = +
311 0.3115
2 20.513 44.5
Vγ = − = +
The coordinates of the center of the column (x1, y1) are taken as (0, 0).
EXAMPLE ACI 318-08 RC-PN-001 - 3

Software Verification PROGRAM NAME: SAFEREVISION NO.: 0
The following table is used for calculating the centroid of the critical section for punching shear. Side 1, Side 2, Side 3, and Side 4 refer to the sides of the critical section for punching shear, as identified in Figure 2.
Item Side 1 Side 2 Side 3 Side 4 Sum x2 −10.25 0 10.25 0 N.A. y2 0 22.25 0 −22.25 N.A. L 44.5 20.5 44.5 20.5 b0 = 130 d 8.5 8.5 8.5 8.5 N.A.
Ld 378.25 174.25 378.25 174.25 1105 Ldx2 −3877.06 0 3877.06 0 0 Ldy2 0 3877.06 0 −3877.06 0
23
0 0"1105
Ldxx
Ld= = =∑
23
0 0"1105
Ldyy
Ld= = =∑
The following table is used to calculate IXX, IYY and IXY. The values for IXX, IYY and IXY are given in the “Sum” column.
Item Side 1 Side 2 Side 3 Side 4 Sum L 44.5 20.5 44.5 20.5 N.A. d 8.5 8.5 8.5 8.5 N.A.
x2 - x3 −10.25 0 10.25 0 N.A. y2 - y3 0 22.25 0 −22.25 N.A.
Parallel to Y-Axis X-axis Y-Axis X-axis N.A. Equations 5b, 6b, 7 5a, 6a, 7 5b, 6b, 7 5a, 6a, 7 N.A.
IXX 64696.5 86264.6 64696.5 86264.6 301922.3 IYY 39739.9 7151.5 39739.9 7151.5 93782.8 IXY 0 0 0 0 0
From the SAFE output at Grid B-2: VU = 189.45 k
2 2V UMγ = −156.39 k-in
3 3V UMγ = 91.538 k-in
EXAMPLE ACI 318-08 RC-PN-001 - 4

Software VerificationPROGRAM NAME: SAFE REVISION NO.: 0
At the point labeled A in Figure 2, x4 = −10.25 and y4 = 22.25, thus:
( ) ( )( )
( ) ( )( )( )( ) ( )
2
2
156.39 93782.8 22.25 0 0 10.25 0189.45130 8.5 (301922.3)(93782.8) (0)
91.538 301922.3 10.25 0 0 22.25 0
301922.3 93782.8 0
− − − − = − −• −
− − − − −
Uv
vU = 0.1714 − 0.0115 − 0.0100 = 0.1499 ksi at point A
At the point labeled B in Figure 2, x4 = 10.25 and y4 = 22.25, thus:
( ) ( )( )( )( ) ( )
( ) ( )( )( )( ) ( )
2
2
156.39 93782.8 22.25 0 0 10.25 0189.45130 8.5 301922.3 93782.8 0
91.538 301922.3 10.25 0 0 22.25 0
301922.3 93782.8 0
− − − = − −• −
− − − −
Uv
vU = 0.1714 − 0.0115 + 0.0100 = 0.1699 ksi at point B
At the point labeled C in Figure 2, x4 = 10.25 and y4 = −22.25, thus:
( ) ( )( )( )( ) ( )
( ) ( )( )( )( ) ( )
2
2
156.39 93782.8 22.25 0 0 10.25 0189.45130 8.5 301922.3 93782.8 0
91.538 301922.3 10.25 0 0 22.25 0
301922.3 93782.8 0
− − − − = − −• −
− − − − −
Uv
vU = 0.1714 + 0.0115 + 0.0100 = 0.1930 ksi at point C
At the point labeled D in Figure 2, x4 = −10.25 and y4 = −22.25, thus:
( ) ( )( )( )( ) ( )
( ) ( )( )( )( ) ( )
2
2
156.39 93782.8 22.25 0 0 10.25 0189.45130 8.5 301922.3 93782.8 0
91.538 301922.3 10.25 0 0 22.25 0
301922.3 93782.8 0
− − − − − = − −• −
− − − − − −
Uv
vU = 0.1714 + 0.0115 - 0.0100 = 0.1729 ksi at point D
EXAMPLE ACI 318-08 RC-PN-001 - 5

Software Verification PROGRAM NAME: SAFEREVISION NO.: 0
Point C has the largest absolute value of vu, thus vmax = 0.1930 ksi
The shear capacity is calculated based on the smallest of ACI 318-08 equations 11-34, 11-35 and 11-36 with the b0 and d terms removed to convert force to stress.
40.75 2 400036 /12 0.1581000
Cvϕ
+ = = ksi in accordance with equation 11-34
40 8.50.75 2 4000130 0.219
1000Cvϕ
• + = = ksi in accordance with equation 11-35
ϕ • •= =
0 75 4 4000 0 1901000
C.v . ksi in accordance with equation 11-36
Equation 11-34 yields the smallest value of φvC = 0.158 ksi and thus this is the shear capacity.
0.193 1.220.158
U
C
vShear Ratiovϕ
= = =
EXAMPLE ACI 318-08 RC-PN-001 - 6

Software VerificationPROGRAM NAME: SAFE REVISION NO.: 0
EXAMPLE ACI 318-08 RC-SL-001 Slab Flexural Design
PROBLEM DESCRIPTION The purpose of this example is to verify slab flexural design in SAFE
A one-way, simple-span slab supported by walls on two opposite edges is modeled using SAFE. The slab is 6 inches thick and spans 12 feet between walls. The slab is modeled using thin plate elements. The walls are modeled as line supports. The computational model uses a finite element mesh, automatically generated by SAFE. The maximum element size is specified to be 36 inches. To obtain factored moments and flexural reinforcement in a design strip, one one-foot-wide strip is defined in the X-direction on the slab, as shown in Figure 1.
Figure 1 Plan View of One-Way Slab
One dead load case (DL80) and one live load case (LL100) with uniformly distributed surface loads of magnitudes 80 and 100 psf, respectively, are defined in the model. A load combination (COMB100) is defined using the ACI 318-08 load combination factors, 1.2 for dead loads and 1.6 for live loads. The model is analyzed for both load cases and the load combination.
The slab moment on a strip of unit width is computed analytically. The total factored strip moments are compared with the SAFE results. After completing the analysis, design is performed in accordance with ACI 318-08 using SAFE and also by hand computation. Table 1 shows the comparison of the moments and design reinforcements computed using the two methods.
GEOMETRY, PROPERTIES AND LOADING Thickness T, h = 6 in
EXAMPLE ACI 318-08 RC-SL-001 - 1

Software Verification PROGRAM NAME: SAFEREVISION NO.: 0
Depth of tensile reinf. dc = 1 in Effective depth d = 5 in Clear span ln, l1 = 144 in
Concrete strength fc = 4,000 psi Yield strength of steel fy = 60,000 psi Concrete unit weight wc = 0 pcf Modulus of elasticity Ec = 3,600 ksi Modulus of elasticity Es = 29,000 ksi Poisson’s ratio ν = 0
Dead load wd = 80 psf Live load wl = 100 psf
TECHNICAL FEATURES OF SAFE TESTED Calculation of flexural reinforcement Application of minimum flexural reinforcement
RESULTS COMPARISON Table 1 shows the comparison of the SAFE total factored moments in the design strip with the moments obtained by the hand computation method. Table 1 also shows the comparison of the design reinforcements.
Table 1 Comparison of Design Moments and Reinforcements
Load Level Method
Strip Moment
(k-in)
Reinforcement Area (sq-in)
As+
Medium SAFE 55.22 0.213
Calculated 55.22 0.213
,minA s+ = 0.1296 sq-in
COMPUTER FILE: ACI 318-08 RC-SL-001.FDB
CONCLUSION The SAFE results show an acceptable comparison with the independent results.
EXAMPLE ACI 318-08 RC-SL-001 - 2

Software VerificationPROGRAM NAME: SAFE REVISION NO.: 0
HAND CALCULATION The following quantities are computed for the load combination:
ϕ = 0.9 b = 12 in As,min = 0.0018bh = 0.1296 sq-in
140000.85 0.05 0.85
1000β
′− = − =
cf
max0.003
0.003 0.005c d= =
+1.875 in
amax = β1cmax = 1.59375 in For the load combination, w and Mu are calculated as follows:
w = (1.2wd + 1.6wt) b / 144
8
21wlMu =
As = min[As,min, (4/3) As,required] = min[0.1296, (4/3)2.11] = 0.1296 sq-in
COMB100 wd = 80 psf wt = 100 psf w = 21.33 lb/in Mu-strip = 55.22 k-in Mu-design = 55.629 k-in
The depth of the compression block is given by:
bfM
ddac
u
ϕ'2
85.02
−−= = 0.3128 in < amax
The area of tensile steel reinforcement is then given by:
−
=
2adf
MA
y
us
ϕ = 0.213 sq-in > As,min
As = 0.2114 sq-in
EXAMPLE ACI 318-08 RC-SL-001 - 3

Software VerificationPROGRAM NAME: SAFE REVISION NO.: 0
EXAMPLE AS 3600-09 PT-SL-001 Post-Tensioned Slab Design
PROBLEM DESCRIPTION The purpose of this example is to verify the slab stresses and the required area of mild steel reinforcing strength for a post-tensioned slab.
A one-way, simply supported slab is modeled in SAFE. The modeled slab is 254 mm thick by 914 mm wide and spans 9754 mm, as shown in shown in Figure 1.
Length, L = 9754 mm
Elevation Section
Prestressing tendon, Ap
Mild Steel, As
914 mm25 mm
229 mm
254 mm
Length, L = 9754 mm
Elevation Section
Prestressing tendon, Ap
Mild Steel, As
914 mm25 mm
229 mm
254 mm
Figure 1 One-Way Slab
EXAMPLE AS 3600-09 PT-SL-001 - 1

Software Verification PROGRAM NAME: SAFEREVISION NO.: 0
A 914-mm-wide design strip is centered along the length of the slab and is defined as an A-Strip. B-Strips have been placed at each end of the span, perpendicular to Strip-A (the B-Strips are necessary to define the tendon profile). A tendon with two strands, each having an area of 99 mm2, has been added to the A-Strip. The self weight and live loads were added to the slab. The loads and post-tensioning forces are as follows:
Loads: Dead = self weight, Live = 4.788 kN/m2
The total factored strip moments, required area of mild steel reinforcement, and slab stresses are reported at the mid-span of the slab. Independent hand calculations were compared with the SAFE results and summarized for verification and validation of the SAFE results.
GEOMETRY, PROPERTIES AND LOADING Thickness, T, h = 254 mm Effective depth, d = 229 mm
Clear span, L = 9754 mm Concrete strength, f 'c = 30 MPa Yield strength of steel, fy = 400 MPa Prestressing, ultimate fpu = 1862 MPa Prestressing, effective fe = 1210 MPa Area of prestress (single tendon), Ap = 198 mm2 Concrete unit weight, wc = 23.56 KN/m3 Concrete modulus of elasticity, Ec = 25000 N/mm3 Rebar modulus of elasticity, Es = 200,000 N/mm3 Poisson’s ratio, ν = 0
Dead load, wd = self KN/m2 Live load, wl = 4.788 KN/m2
TECHNICAL FEATURES OF SAFE TESTED Calculation of the required flexural reinforcement Check of slab stresses due to the application of dead, live and post-tensioning
loads.
RESULTS COMPARISON Table 1 shows the comparison of the SAFE total factored moments, required mild steel reinforcing and slab stresses with the independent hand calculations.
EXAMPLE AS 3600-09 PT-SL-001 - 2

Software VerificationPROGRAM NAME: SAFE REVISION NO.: 0
Table 1 Comparison of Results
FEATURE TESTED INDEPENDENT RESULTS
SAFE RESULTS DIFFERENCE
Factored moment, Mu (Ultimate) (kN-m)
156.12 156.14 0.01%
Area of Mild Steel req’d, As (sq-cm) 16.55 16.59 0.24%
Transfer Conc. Stress, top (0.8D+1.15PTI), MPa −3.500 −3.498 0.06%
Transfer Conc. Stress, bot (0.8D+1.15PTI), MPa 0.950 0.948 0.21%
Normal Conc. Stress, top (D+L+PTF), MPa −10.460 −10.465 0.10%
Normal Conc. Stress, bot (D+L+PTF), MPa 8.402 8.407 0.05%
Long-Term Conc. Stress, top (D+0.5L+PTF(L)), MPa −7.817 −7.817 0.00%
Long-Term Conc. Stress, bot (D+0.5L+PTF(L)), MPa 5.759 5.759 0.00%
COMPUTER FILE: AS 3600-09 PT-SL-001.FDB
CONCLUSION The SAFE results show an acceptable comparison with the independent results.
EXAMPLE AS 3600-09 PT-SL-001 - 3

Software Verification PROGRAM NAME: SAFEREVISION NO.: 0
HAND CALCULATIONS:
Design Parameters:
Mild Steel Reinforcing Post-Tensioning
f’c = 30MPai fpu = 1862 MPa fy = 400MPa fpy = 1675 MPa
Stressing Loss = 186 MPa Long-Term Loss = 94 MPa
fi = 1490 MPa fe = 1210 MPa
0 80.φ =
2 1.0 0.003 'cfα = − = 0.91 > 0.85, Use 2α =0.85
1.0 0.003 'cfγ = − = 0.91 > 0.85, Use γ = 0.85
dka uγ=max = 0.85*0.36*229 = 70.07 mm
Length, L = 9754 mm
Elevation Section
Prestressing tendon, Ap
Mild Steel, As
914 mm25 mm
229 mm
254 mm
Length, L = 9754 mm
Elevation Section
Prestressing tendon, Ap
Mild Steel, As
914 mm25 mm
229 mm
254 mm
Loads: Dead, self-wt = 0.254 m x 23.56 kN/m3 = 5.984 kN/m2 (D) x 1.2 = 7.181 kN/m2 (Du) Live, = 4.788 kN/m2 (L) x 1.5 = 7.182 kN/m2 (Lu)
Total = 10.772 kN/m2 (D+L) = 14.363 kN/m2 (D+L)ult
ω =10.772 kN/m2 x 0.914m = 9.846 kN/m, uω = 14.363 kN/m2 x 0.914m = 13.128 kN/m
Ultimate Moment, 2
1
8UwlM = = 13.128 x (9.754)2/8 = 156.12 kN-m
EXAMPLE AS 3600-09 PT-SL-001 - 4

Software VerificationPROGRAM NAME: SAFE REVISION NO.: 0
Ultimate Stress in strand, 70300
C ef PPS SE
P
f ' b df f
A= + +
( )( )( )
30 914 2291210 70300 198
1386 MPa 200 1410 MPa
= + +
= ≤ + =SEf
Ultimate force in PT, ( ), ( ) 197.4 1386 1000 273.60 kN= = =ult PT P PSF A fTotal Ultimate force, , 273.60 560.0 833.60 kN= + =ult TotalF
Stress block depth, 2 20 85
*
c
Ma d d. f ' bφ
= − −
( )
( )( )( )2 2 159.120.229 0.229 40.90
0.85 30000 0.80 0.914= − − =
Ultimate moment due to PT,
( ), ,40.90273.60 229 0.80 1000 45.65 kN-m
22φ = − = − = ult PT ult PT
aM F d
Net ultimate moment, , 156.1 45.65 110.45 kN-m= − = − =net U ult PTM M M
Required area of mild steel reinforcing,
( )( ) 2110.45 1 6 1655 mm
0.040900.80 400000 0.2292 2
φ= = =
− −
netS
y
MA eaf d
Check of Concrete Stresses at Midspan:
Initial Condition (Transfer), load combination (0.8D+1.15PTi) = 0.80D+0.0L+1.15PTI
Tendon stress at transfer = jacking stress − stressing losses =1490 − 186 = 1304 MPa The force in the tendon at transfer, = ( )1304 197.4 1000 257.4 kN=
Moment due to dead load, ( )( )25.984 0.914 9.754 8 65.04 kN-m= =DM Moment due to PT, ( )(sag) 257.4 102 mm 1000 26.25 kN-m= = =PT PTIM F
Stress in concrete,( )( )
( )( ) ( )1.15 257.4 0.80 65.04 1.15 26.23
0.254 0.914 0.00983− − −
= ± = ±PTI D PTF M MfA S
where S = 0.00983m3
1.275 2.225 MPa= − ±f 3.500(Comp) max,0.950(Tension) max= −f
EXAMPLE AS 3600-09 PT-SL-001 - 5

Software Verification PROGRAM NAME: SAFEREVISION NO.: 0
Normal Condition, load combinations: (D+L+PTF) = 1.0D+1.0L+1.0PTF
Tendon stress at Normal = jacking − stressing − long-term = 1490 − 186 − 94= 1210 MPa The force in tendon at Normal, = ( )1210 197.4 1000 238.9 kN=
Moment due to dead load, ( )( )25.984 0.914 9.754 8 65.04 kN-m= =DM
Moment due to live load, ( )( )24.788 0.914 9.754 8 52.04 kN-m= =LM Moment due to PT, ( )(sag) 238.9 102 mm 1000 24.37 kN-m= = =PT PTIM F
Stress in concrete for (D+L+PTF),
( )238.8 117.08 24.37
0.254 0.914 0.00983+ − − −
= ± = ±PTI D L PTF M MfA S1 029 9 431f . .= − ± 10.460(Comp) max, 8.402(Tension) max= −f
Long-Term Condition, load combinations: (D+0.5L+PTF(L)) = 1.0D+0.5L+1.0PTF
Tendon stress at Normal = jacking − stressing − long-term =1490 − 186 − 94 = 1210 MPa The force in tendon at Normal, = ( )1210 197.4 1000 238.9 kN=
Moment due to dead load, ( )( )25.984 0.914 9.754 8 65.04 kN-m= =DM
Moment due to dead load, ( )( )24.788 0.914 9.754 8 52.04 kN-m= =LM Moment due to PT, ( )(sag) 238.9 102 mm 1000 24.37 kN-m= = =PT PTIM F
Stress in concrete for (D+0.5L+PTF(L)),
( )0.5 238.9 91.06 24.33
0.254 0.914 0.00983+ − − −
= ± = ±D L PTPTI M MFfA S1 029 6 788f . .= − ± 7.817(Comp) max, 5.759(Tension) max= −f
EXAMPLE AS 3600-09 PT-SL-001 - 6

Software VerificationPROGRAM NAME: SAFE REVISION NO.: 0
EXAMPLE AS 3600-09 RC-BM-001 Flexural and Shear Beam Design
PROBLEM DESCRIPTION The purpose of this example is to verify slab flexural design in SAFE. The load level is adjusted for the case corresponding to the following conditions:
The stress-block extends below the flange but remains within the balancedcondition permitted by AS 3600-09.
The average shear stress in the beam is below the maximum shear stressallowed by AS 3600-09, requiring design shear reinforcement.
A simple-span, 6-m-long, 300-mm-wide, and 500-mm-deep T-beam with a flange 100 mm thick and 600 mm wide is modeled using SAFE. The beam is shown in Figure 1. The computational model uses a finite element mesh of frame elements automatically generated by SAFE. The maximum element size has been specified to be 200 mm. The beam is supported by columns without rotational stiffnesses and with very large vertical stiffness (1 × 10²⁰ kN/m).
The beam is loaded with symmetric third-point loading. One dead load case (DL30) and one live load case (LL130), with only symmetric third-point loads of magnitudes 30, and 130 kN, respectively, are defined in the model. One load combinations (COMB130) is defined using the AS 3600-09 load combination factors of 1.2 for dead load and 1.5 for live load. The model is analyzed for both of these load cases and the load combination.
The beam moment and shear force are computed analytically. The total factored moment and shear force are compared with the SAFE results and found to be identical. After completing the analysis, the design is performed using the AS 3600-09 code in SAFE and also by hand computation. Table 1 shows the comparison of the design longitudinal reinforcements. Table 2 shows the comparison of the design shear reinforcements.
EXAMPLE AS 3600-09 RC-BM-001 - 1

Software Verification PROGRAM NAME: SAFEREVISION NO.: 0
Beam Section
75 mm 100 mm
300 mm
600 mm
75 mm
500 mm
Shear Force
Bending Moment
2000 mm 2000 mm 2000 mm
Beam Section
75 mm 100 mm
300 mm
600 mm
75 mm
500 mm
Shear Force
Bending Moment
2000 mm 2000 mm 2000 mm
Figure 1 The Model Beam for Flexural and Shear Design
EXAMPLE AS 3600-09 RC-BM-001 - 2

Software Verification PROGRAM NAME: SAFE REVISION NO.: 0 GEOMETRY, PROPERTIES AND LOADING
Clear span, l = 6000 mm Overall depth, h = 500 mm Flange thickness, ds = 100 mm Width of web, bw = 300 mm Width of flange, bf = 600 mm Depth of tensile reinf., dc = 75 mm Effective depth, d = 425 mm Depth of comp. reinf., d' = 75 mm Concrete strength, f'
c = 30 MPa Yield strength of steel, fy = 460 MPa Concrete unit weight, wc = 0 kN/m3 Modulus of elasticity, Ec = 25x105 MPa Modulus of elasticity, Es = 2x10⁸ MPa Poisson’s ratio, v = 0.2 Dead load, Pd = 30 kN Live load, Pl = 130 kN
TECHNICAL FEATURES OF SAFE TESTED Calculation of flexural and shear reinforcement Application of minimum flexural and shear reinforcement
RESULTS COMPARISON Table 1 shows the comparison of the SAFE total factored moments in the design strip with the moments obtained by the analytical method. They match exactly for this problem. Table 1 also shows the design reinforcement comparison.
Table 1 Comparison of Moments and Flexural Reinforcements
Method Moment (kN-m)
Reinforcement Area (sq-cm)
As+
SAFE 462 33.512
Calculated 462 33.512
A+,mins = 3.00 sq-cm
EXAMPLE AS 3600-09 RC-BM-001 - 3

Software Verification PROGRAM NAME: SAFEREVISION NO.: 0
Table 2 Comparison of Shear Reinforcements
Shear Force (kN)
Reinforcement Area, s
Av
(sq-cm/m)
SAFE Calculated
231 12.05 12.05
COMPUTER FILE: AS 3600-09 RC-BM-001.FDB
CONCLUSION The SAFE results show an exact comparison with the independent results.
EXAMPLE AS 3600-09 RC-BM-001 - 4

Software Verification PROGRAM NAME: SAFE REVISION NO.: 0
HAND CALCULATION
Flexural Design The following quantities are computed for all the load combinations:
ϕ = 0.8
2 1.0 0.003 'cfα = − = 0.91 > 0.85, Use 2α =0.85
1.05 0.007 'γ = − cf = 0.84 < 0.85, Use γ = 0.84
dka uγ=max = 0.84 • 0.36 • 425 = 128.52 mm 2
,.min ,ct f
st b wsy
fDA b dd f
α′ =
where
for L- and T-Sections with the web in tension: 1/4
0.20 1 0.4 0.18 0.20f fsb
w w
b bDb D b
α = + − − ≥
=0.2378
2,
.min 0.2378 ct fst
sy
fDA bdd f
′ =
= 0.2378 • (500/425)2 • 0.6 • SQRT(30)/460 • 300*425 = 299.8 sq-mm
COMB130 N* = (1.2Nd + 1.5Nt) = 231kN
**
3N lM = = 462 kN-m
The depth of the compression block is given by: *
2
c ef
2Ma d d0.85 f ' bφ
= − − = 100.755 mm (a > Ds)
The compressive force developed in the concrete alone is given by: The first part is for balancing the compressive force from the flange, Cf, and the second part is for balancing the compressive force from the web, Cw, 2. Cf is given by:
EXAMPLE AS 3600-09 RC-BM-001 - 5

Software Verification PROGRAM NAME: SAFEREVISION NO.: 0
( ) ( )max,min'85.0 aDbbfC swefcf ×−= = 765 kN
Therefore, 1 =f
ssy
CA
f and the portion of M* that is resisted by the flange is given by:
( )
−=
2,min maxaDdCM s
fuf φ = 229.5 kN-m
1 =f
ssy
CA
f = 1663.043 sq-mm
Again, the value for φ is 0.80 by default. Therefore, the balance of the moment, M* to be carried by the web is:
*uw ufM M M= − = 462 – 229.5 = 232.5
The web is a rectangular section of dimensions bw and d, for which the design depth of the compression block is recalculated as:
21
20.85 φ
= − −′uw
c w
Ma d df b
= 101.5118 mm
If a1 ≤ amax, the area of tension reinforcement is then given by:
21
2φ
= −
uws
sy
MAaf d
= 1688.186 sq-mm
21 ssst AAA += = 3351.23 sq-mm = 33.512 sq-cm
Shear Design The shear force carried by the concrete, Vuc, is calculated as:
1 3
1 2 3 ' stuc w o cv
w o
AV b d fb d
β β β
=
= 0 kN
where,
( )1/3' 'cv cf f= = 3.107 N/mm2 4MPa≤
EXAMPLE AS 3600-09 RC-BM-001 - 6

Software Verification PROGRAM NAME: SAFE REVISION NO.: 0
1.11000
6.11.11 ≥
−= odβ =1.2925, β2 = 1 and β3 = 1
The shear force is limited to a maximum of:
ocu bdfV '2.0max. = = 765 kN
Given V*, Vuc, and Vu.max, the required shear reinforcement is calculated as follows, where, φ, the strength reduction factor, is 0.7.
If * / 2,ucV Vφ≤
0=s
Asv , if D ≤ 750 mm, otherwise Asv.min shall be provided.
If *.min .max ,u uV V Vφ φ< ≤
( )*
.,
cotucsv
sy f o v
V VAs f d
φ
φ θ
−=
and greater than Asv.min, defined as:
=
fsy
wsv
fb
sA
.
min. 35.0 = 0.22826 sq-mm/mm = 228.26 sq-mm/m
θv = the angle between the axis of the concrete compression strut and the longitudinal axis of the member, which varies linearly from 30 degrees when V*=φVu.min to 45 degrees when V*=φ Vu,max = 35.52 degrees
If *max ,V Vφ> a failure condition is declared.
For load combination, the N* and V* are calculated as follows: N* = 1.2Nd + 1.5N1
V* = N*
(COMB130) Nd = 30 kips Nl = 130 kips N* = 231 kN
EXAMPLE AS 3600-09 RC-BM-001 - 7

Software Verification PROGRAM NAME: SAFE REVISION NO.: 0
N* = 231 kN, ( *.min .max ,u uV V Vφ φ< ≤ )
( )φ
φ θ
−=
*
.,
cotucsv
sy f o v
V VAs f d
= 1.205 sq-mm/mm or 12.05 sq-cm/m
EXAMPLE AS 3600-09 RC-BM-001 - 8

Software VerificationPROGRAM NAME: SAFE REVISION NO.: 0
EXAMPLE AS 3600-09 RC-PN-001 Slab Punching Shear Design
PROBLEM DESCRIPTION The purpose of this example is to verify slab punching shear design in SAFE
The numerical example is a flat slab that has three 8-m spans in each direction, as shown in Figure 1.
4
A
3
2
1
B C D
X
Y
0.3 m0.3 m8 m8 m8 m
0.6 m
0.6 m
0.25 m thick flat slab
LoadingDL = Self weight + 1.0 kN/m2
LL = 4.0 kN/m2
Columns are 0.3 m x 0.9 mwith long side parallel to the Y-axis, typical
Concrete PropertiesUnit weight = 24 kN/m3
f'c = 30 N/mm2
8 m
8 m
8 m
4
A
3
2
1
B C D
X
Y
0.3 m0.3 m8 m8 m8 m
0.6 m
0.6 m
0.25 m thick flat slab
LoadingDL = Self weight + 1.0 kN/m2
LL = 4.0 kN/m2
Columns are 0.3 m x 0.9 mwith long side parallel to the Y-axis, typical
Concrete PropertiesUnit weight = 24 kN/m3
f'c = 30 N/mm2
8 m
8 m
8 m
Figure 1: Flat Slab for Numerical Example
The slab overhangs beyond the face of the column by 0.15 m along each side of the structure. The columns are typically 0.3 m x 0.9 m, with the long side parallel to the Y-axis. The slab is typically 0.25-m thick. Thick plate properties are used for the slab.
EXAMPLE AS 3600-09 RC-PN-001 - 1

Software Verification PROGRAM NAME: SAFE REVISION NO.: 0
The concrete has a unit weight of 24 kN/m3 and a f 'c of 30 N/mm2. The dead load consists of the self weight of the structure plus an additional 1 kN/m2. The live load is 4 kN/m2.
TECHNICAL FEATURES OF SAFE TESTED Calculation of punching shear capacity, shear stress, and D/C ratio.
RESULTS COMPARISON Table 1 shows the comparison of the punching shear capacity, shear stress ratio, and D/C ratio obtained from SAFE with the punching shear capacity, shear stress ratio and D/C ratio obtained by the analytical method. They match exactly for this problem.
Table 1 Comparison of Design Results for Punching Shear at Grid Point B-2
Method
Shear Stress
(N/mm2)
Shear Capacity
(N/mm2)
D/C ratio
SAFE 1.811 1.086 1.67
Calculated 1.811 1.086 1.67
COMPUTER FILE: AS 3600-09 RC-PN-001.FDB
CONCLUSION The SAFE results show an exact comparison with the independent results.
EXAMPLE AS 3600-09 RC-PN-001 - 2

Software Verification PROGRAM NAME: SAFE REVISION NO.: 0 HAND CALCULATION
Hand Calculation For Interior Column Using SAFE Method
dom = [(250 − 26) + (250 − 38)] / 2 = 218 mm Refer to Figure 2. U = 518+ 1118 + 1118 + 518 = 3272 mm ax = 518 mm ay = 1118 mm
450
450
150 109
X
Y
1118
518
Side 2
Side
3
A B
CD
Column
Side
1
Side 4
Center of column is point (x1, y1). Set this equal to (0,0).
Critical section for punching shear shown dashed.
109 150
109
109
Note: All dimensions in millimeters
450
450
150 109
X
Y
1118
518
Side 2
Side
3
A B
CD
Column
Side
1
Side 4
Center of column is point (x1, y1). Set this equal to (0,0).
Critical section for punching shear shown dashed.
109 150
109
109
Note: All dimensions in millimeters
Figure 2: Interior Column, Grid B-2 in SAFE Model
From the SAFE output at grid line B-2:
V* = 1126.498 kN
Mv2 = −51.991 kN-m Mv3 = 45.723 kN-m
EXAMPLE AS 3600-09 RC-PN-001 - 3

Software Verification PROGRAM NAME: SAFEREVISION NO.: 0
The maximum design shear stress is computed along the major and minor axis of column separately:
*
max *1.08
v
om om
uMVvud V ad
= +
3 6
max, 31126.498 10 3272 51.991 101
3272 218 8 1126.498 10 1118 218Xv • • •
= • + • • • • •
max,Xv = 1.579 • 1.0774 = 1.7013 N/mm2
3 6
max, 31126.498 10 3272 45.723 101
3272 218 8 1126.498 10 518 218Yv • • •
= • + • • • • •
max,Yv = 1.579 • 1.1470 = 1.811 N/mm2 (Govern)
The largest absolute value of vmax= 1.811 N/mm2
The shear capacity is calculated based on the smallest of AS 3600-09 equation 11-35, with the dom and u terms removed to convert force to stress.
20.17 1min
0.34
chcv
c
ff
f
ϕβϕ
ϕ
′+ =
′
= 1.803N/mm2 in accordance with AS 9.2.3(a)
AS 9.2.3(a) yields the smallest value of ϕ cvf = 1.086 N/mm2, and thus this is the shear capacity.
1.811Shear Ratio 1.671.086ϕ
= = =U
cv
vf
EXAMPLE AS 3600-09 RC-PN-001 - 4

Software Verification PROGRAM NAME: SAFE REVISION NO.: 0
EXAMPLE AS 3600-2009 RC-SL-001 Slab Flexural Design
PROBLEM DESCRIPTION The purpose of this example is to verify slab flexural design in SAFE
A one-way, simple-span slab supported by walls on two opposite edges is modeled using SAFE. The slab is 150 mm thick and spans 4 meters between walls. The walls are modeled as pin supports. The computational model uses a finite element mesh, automatically generated by SAFE. The maximum element size is specified as 0.25 meters. To obtain factored moments and flexural reinforcement in a design strip, one one-meter wide strip is defined in the X-direction on the slab, as shown in Figure 1.
Figure 1 Plan View of One-Way Slab
One dead load case (DL4KPa) and one live load case (LL5KPa), with uniformly distributed surface loads of magnitudes 4 and 5 kN/m2, respectively, are defined in the model. A load combination (COMB5kPa) is defined using the AS 3600-2009 load combination factors, 1.2 for dead loads and 1.5 for live loads. The model is analyzed for both load cases and the load combinations.
The slab moment on a strip of unit width is computed analytically. The total factored strip moments are compared with the SAFE results. After completing analysis, design is performed using the AS 3600-2009 code using SAFE and also by hand computation. Table 1 shows the comparison of the design reinforcements computed using the two methods.
EXAMPLE AS 3600-2009 RC-SL-001 - 1

Software Verification PROGRAM NAME: SAFEREVISION NO.: 0
GEOMETRY, PROPERTIES AND LOADING Thickness T, h = 150 mm Depth of tensile reinf. dc = 25 mm Effective depth d = 125 mm Clear span ln, l1 = 4000 mm
Concrete strength fc = 30 MPa Yield strength of steel fsy = 460 MPa Concrete unit weight wc = 0 N/m3 Modulus of elasticity Ec = 25000 MPa Modulus of elasticity Es = 2x10⁶ MPa Poisson’s ratio ν = 0
Dead load wd = 4.0 kPa Live load wl = 5.0 kPa
TECHNICAL FEATURES OF SAFE TESTED Calculation of flexural reinforcement Application of minimum flexural reinforcement
RESULTS COMPARISON Table 1 shows the comparison of the SAFE total factored moments in the design strip with the moments obtained by the hand computation method. Table 1 also shows the comparison of the design reinforcements.
Table 1 Comparison of Design Moments and Reinforcements
Load Level Method
Strip Moment (kN-m)
Reinforcement Area (sq-cm)
As+
Medium SAFE 24.597 5.58
Calculated 24.600 5.58
,minA s+ = 370.356 sq-mm
COMPUTER FILE: AS 3600-2009 RC-SL-001.FDB
CONCLUSION The SAFE results show an exact comparison with the independent results.
EXAMPLE AS 3600-2009 RC-SL-001 - 2

Software VerificationPROGRAM NAME: SAFE REVISION NO.: 0
HAND CALCULATION The following quantities are computed for the load combination:
ϕ = 0.8 b = 1000 mm
2 1.0 0.003 'cfα = − = 0.91 > 0.85, Use 2α =0.85
1.05 0.007 'γ = − cf = 0.84 < 0.85, Use γ = 0.84
dka uγ=max = 0.84•0.36•125 = 37.80 mm
For the load combination, w and M* are calculated as follows: w = (1.2wd + 1.5wt) b
8
21wlMu =
2 ',
,
0.24 ct fs
sy f
fhA bhd f
=
for flat slabs
2,
.min,
0.24 ct fst
sy f
fhA bdd f
′ =
= 0.24•(150/125)2•0.6•SQRT(30)/460•1000•150 = 370.356 sq-mm
COMB100 wd = 4.0 kPa wt = 5.0 kPa w = 12.3 kN/m M-strip
* = 24.6 kN-m
M-design* = 24.633 kN-m
The depth of the compression block is given by:
φ= − −
*2
c
2Ma d d0.85 f ' b
= 10.065 mm < amax
EXAMPLE AS 3600-2009 RC-SL-001 - 3

Software Verification PROGRAM NAME: SAFE REVISION NO.: 0
The area of tensile steel reinforcement is then given by:
−
=
2
*
adf
MAsy
st
φ = 557.966 sq-mm > As,min
As = 5.57966 sq-cm
EXAMPLE AS 3600-2009 RC-SL-001 - 4

Software VerificationPROGRAM NAME: SAFE REVISION NO.: 0
EXAMPLE AS 3600-01 PT-SL-001 Post-Tensioned Slab Design
PROBLEM DESCRIPTION The purpose of this example is to verify the slab stresses and the required area of mild steel reinforcing strength for a post-tensioned slab.
A one-way, simply supported slab is modeled in SAFE. The modeled slab is 254 mm thick by 914 mm wide and spans 9754 mm as shown in shown in Figure 1.
Length, L = 9754 mm
Elevation Section
Prestressing tendon, Ap
Mild Steel, As
914 mm25 mm
229 mm
254 mm
Length, L = 9754 mm
Elevation Section
Prestressing tendon, Ap
Mild Steel, As
914 mm25 mm
229 mm
254 mm
Figure 1 One-Way Slab
EXAMPLE AS 3600-01 PT-SL-001 - 1

Software Verification PROGRAM NAME: SAFEREVISION NO.: 0
A 914-mm-wide design strip is centered along the length of the slab and is defined as an A-Strip. B-Strips have been placed at each end of the span, perpendicular to Strip-A (the B-Strips are necessary to define the tendon profile). A tendon with two strands, each having an area of 99 mm2, has been added to the A-Strip. The self-weight and live loads were added to the slab. The loads and post-tensioning forces are as follows:
Loads: Dead = self weight, Live = 4.788 kN/m2
The total factored strip moments, required area of mild steel reinforcement, and slab stresses are reported at the midspan of the slab. Independent hand calculations were compared with the SAFE results and summarized for verification and validation of the SAFE results.
GEOMETRY, PROPERTIES AND LOADING Thickness, T, h = 254 mm Effective depth, d = 229 mm
Clear span, L = 9754 mm Concrete strength, f 'c = 30 MPa Yield strength of steel, fy = 400 MPa Prestressing, ultimate fpu = 1862 MPa Prestressing, effective fe = 1210 MPa Area of prestress (single tendon), Ap = 198 mm2 Concrete unit weight, wc = 23.56 KN/m3 Concrete modulus of elasticity, Ec = 25000 N/mm3 Rebar modulus of elasticity, Es = 200,000 N/mm3 Poisson’s ratio, ν = 0
Dead load, wd = self KN/m2 Live load, wl = 4.788 KN/m2
TECHNICAL FEATURES OF SAFE TESTED Calculation of the required flexural reinforcement Check of slab stresses due to the application of dead, live and post-tensioning
loads.
RESULTS COMPARISON Table 1 shows the comparison of the SAFE total factored moments, required mild steel reinforcing and slab stresses with the independent hand calculations.
EXAMPLE AS 3600-01 PT-SL-001 - 2

Software VerificationPROGRAM NAME: SAFE REVISION NO.: 0
Table 1 Comparison of Results
FEATURE TESTED INDEPENDENT RESULTS
SAFE RESULTS DIFFERENCE
Factored moment, Mu (Ultimate) (kN-m)
156.12 156.14 0.01%
Area of Mild Steel req’d, As (sq-cm) 16.55 16.59 0.24%
Transfer Conc. Stress, top (0.8D+1.15PTI), MPa −3.500 −3.498 0.06%
Transfer Conc. Stress, bot (0.8D+1.15PTI), MPa 0.950 0.948 0.21%
Normal Conc. Stress, top (D+L+PTF), MPa −10.460 −10.465 0.10%
Normal Conc. Stress, bot (D+L+PTF), MPa 8.402 8.407 0.05%
Long-Term Conc. Stress, top (D+0.5L+PTF(L)), MPa −7.817 −7.817 0.00%
Long-Term Conc. Stress, bot (D+0.5L+PTF(L)), MPa 5.759 5.759 0.00%
COMPUTER FILE: AS 3600-01 PT-SL-001.FDB
CONCLUSION The SAFE results show an acceptable comparison with the independent results.
EXAMPLE AS 3600-01 PT-SL-001 - 3

Software Verification PROGRAM NAME: SAFE REVISION NO.: 0
HAND CALCULATIONS:
Design Parameters:
Mild Steel Reinforcing Post-Tensioning
f’c = 30MPai fpu = 1862 MPa fy = 400MPa fpy = 1675 MPa Stressing Loss = 186 MPa Long-Term Loss = 94 MPa fi = 1490 MPa fe = 1210 MPa
0 80.φ =
( )[ ]28'007.085.0 −−= cfγ = 0.836
dka uγ=max = 0.836*0.4*229 = 76.5 mm
Length, L = 9754 mm
Elevation Section
Prestressing tendon, Ap
Mild Steel, As
914 mm25 mm
229 mm
254 mm
Length, L = 9754 mm
Elevation Section
Prestressing tendon, Ap
Mild Steel, As
914 mm25 mm
229 mm
254 mm
Loads:
Dead, self-wt = 0.254 m x 23.56 kN/m3 = 5.984 kN/m2 (D) x 1.2 = 7.181 kN/m2 (Du) Live, = 4.788 kN/m2 (L) x 1.5 = 7.182 kN/m2 (Lu)
Total = 10.772 kN/m2 (D+L) = 14.363 kN/m2 (D+L)ult ω =10.772 kN/m2 x 0.914m = 9.846 kN/m, uω = 14.363 kN/m2 x 0.914m = 13.128 kN/m
Ultimate Moment, 2
1
8UwlM = = 13.128 x (9.754)2/8 = 156.12 kN-m
EXAMPLE AS 3600-01 PT-SL-001 - 4

Software Verification PROGRAM NAME: SAFE REVISION NO.: 0
Ultimate Stress in strand, 70300
C ef PPS SE
P
f ' b df f
A= + +
( )( )
( )30 914 2291210 70
300 1981386 MPa 200 1410 MPa
= + +
= ≤ + =SEf
Ultimate force in PT, ( ), ( ) 197.4 1386 1000 273.60 kN= = =ult PT P PSF A f
Total Ultimate force, , 273.60 560.0 833.60 kN= + =ult TotalF
Stress block depth, 2 20 85
*
c
Ma d d. f ' bφ
= − −
( )
( )( )( )2 2 159.120.229 0.229 40.90
0.85 30000 0.80 0.914= − − =
Ultimate moment due to PT,
( ), ,40.90273.60 229 0.80 1000 45.65 kN-m
22φ = − = − = ult PT ult PT
aM F d
Net ultimate moment, , 156.1 45.65 110.45 kN-m= − = − =net U ult PTM M M
Required area of mild steel reinforcing,
( )( ) 2110.45 1 6 1655 mm
0.040900.80 400000 0.2292 2
φ= = =
− −
netS
y
MA eaf d
Check of Concrete Stresses at Midspan: Initial Condition (Transfer), load combination (0.8D+1.15PTi) = 0.80D+0.0L+1.15PTI Tendon stress at transfer = jacking stress − stressing losses =1490 − 186 = 1304 MPa The force in the tendon at transfer, = ( )1304 197.4 1000 257.4 kN=
Moment due to dead load, ( )( )25.984 0.914 9.754 8 65.04 kN-m= =DM Moment due to PT, ( )(sag) 257.4 102 mm 1000 26.25 kN-m= = =PT PTIM F
Stress in concrete,( )( )
( )( ) ( )1.15 257.4 0.80 65.04 1.15 26.23
0.254 0.914 0.00983− − −
= ± = ±PTI D PTF M MfA S
where S = 0.00983m3
1.275 2.225 MPa= − ±f 3.500(Comp) max,0.950(Tension) max= −f
EXAMPLE AS 3600-01 PT-SL-001 - 5

Software Verification PROGRAM NAME: SAFEREVISION NO.: 0
Normal Condition, load combinations: (D+L+PTF) = 1.0D+1.0L+1.0PTF
Tendon stress at Normal = jacking − stressing − long-term = 1490 − 186 − 94= 1210 MPa The force in tendon at Normal, = ( )1210 197.4 1000 238.9 kN=
Moment due to dead load, ( )( )25.984 0.914 9.754 8 65.04 kN-m= =DM
Moment due to live load, ( )( )24.788 0.914 9.754 8 52.04 kN-m= =LM Moment due to PT, ( )(sag) 238.9 102 mm 1000 24.37 kN-m= = =PT PTIM F
Stress in concrete for (D+L+PTF),
( )238.8 117.08 24.37
0.254 0.914 0.00983+ − − −
= ± = ±PTI D L PTF M MfA S1 029 9 431f . .= − ± 10.460(Comp) max, 8.402(Tension) max= −f
Long-Term Condition, load combinations: (D+0.5L+PTF(L)) = 1.0D+0.5L+1.0PTF
Tendon stress at Normal = jacking − stressing − long-term =1490 − 186 − 94 = 1210 MPa The force in tendon at Normal, = ( )1210 197.4 1000 238.9 kN=
Moment due to dead load, ( )( )25.984 0.914 9.754 8 65.04 kN-m= =DM
Moment due to dead load, ( )( )24.788 0.914 9.754 8 52.04 kN-m= =LM Moment due to PT, ( )(sag) 238.9 102 mm 1000 24.37 kN-m= = =PT PTIM F
Stress in concrete for (D+0.5L+PTF(L)),
( )0.5 238.9 91.06 24.33
0.254 0.914 0.00983+ − − −
= ± = ±D L PTPTI M MFfA S1 029 6 788f . .= − ± 7.817(Comp) max, 5.759(Tension) max= −f
EXAMPLE AS 3600-01 PT-SL-001 - 6
Software Verification PROGRAM NAME: SAFE REVISION NO.: 0
EXAMPLE AS 3600-01 RC-BM-001 Flexural and Shear Beam Design
PROBLEM DESCRIPTION The purpose of this example is to verify slab flexural design in SAFE. The load level is adjusted for the case corresponding to the following conditions:
The stress-block extends below the flange but remains within the balanced condition permitted by AS 3600-01.
The average shear stress in the beam is below the maximum shear stress allowed by AS 3600-01, requiring design shear reinforcement.
A simple-span, 6-m-long, 300-mm-wide, and 500-mm-deep T beam with a flange 100 mm thick and 600 mm wide is modeled using SAFE. The beam is shown in Figure 1. The computational model uses a finite element mesh of frame elements, automatically generated by SAFE. The maximum element size has been specified to be 200 mm. The beam is supported by columns without rotational stiffnesses and with very large vertical stiffness (1 × 10²⁰ kN/m).
The beam is loaded with symmetric third-point loading. One dead load case (DL30) and one live load case (LL130), with only symmetric third-point loads of magnitudes 30, and 130 kN, respectively, are defined in the model. One load combinations (COMB130) is defined using the AS 3600-01 load combination factors of 1.2 for dead load and 1.5 for live load. The model is analyzed for both of these load cases and the load combination.
The beam moment and shear force are computed analytically. The total factored moment and shear force are compared with the SAFE results and found to be identical. After completing the analysis, the design is performed using the AS 3600-01 code in SAFE and also by hand computation. Table 1 shows the comparison of the design longitudinal reinforcements. Table 2 shows the comparison of the design shear reinforcements.
EXAMPLE AS 3600-01 RC-BM-001 - 1
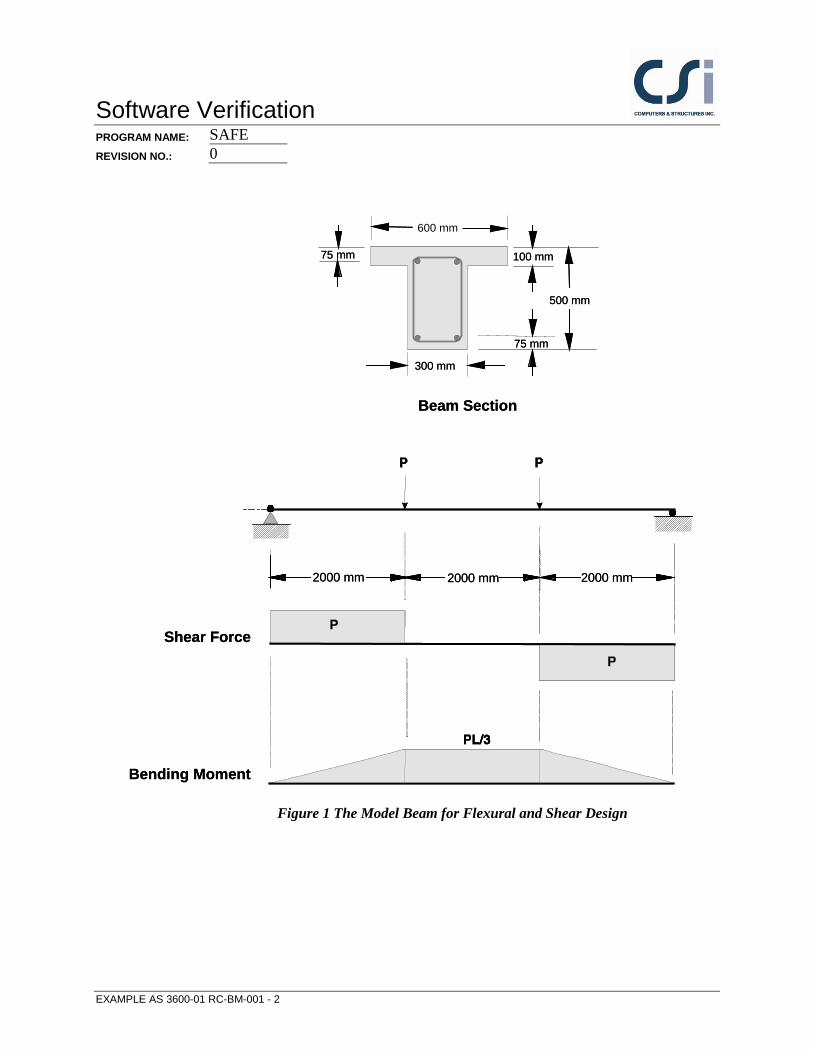
Software Verification PROGRAM NAME: SAFE REVISION NO.: 0
Beam Section
75 mm 100 mm
300 mm
600 mm
75 mm
500 mm
Shear Force
Bending Moment
2000 mm 2000 mm 2000 mm
Beam Section
75 mm 100 mm
300 mm
600 mm
75 mm
500 mm
Shear Force
Bending Moment
2000 mm 2000 mm 2000 mm
Figure 1 The Model Beam for Flexural and Shear Design
EXAMPLE AS 3600-01 RC-BM-001 - 2

Software VerificationPROGRAM NAME: SAFE REVISION NO.: 0
GEOMETRY, PROPERTIES AND LOADING Clear span, l = 6000 mm Overall depth, h = 500 mm Flange thickness, ds = 100 mm Width of web, bw = 300 mm Width of flange, bf = 600 mm Depth of tensile reinf., dc = 75 mm Effective depth, d = 425 mm Depth of comp. reinf., d' = 75 mm
Concrete strength, f'c = 30 MPa
Yield strength of steel, fy = 460 MPa Concrete unit weight, wc = 0 kN/m3 Modulus of elasticity, Ec = 25x105 MPa Modulus of elasticity, Es = 2x10⁸ MPa Poisson’s ratio, v = 0.2
Dead load, Pd = 30 kN Live load, Pl = 130 kN
TECHNICAL FEATURES OF SAFE TESTED Calculation of flexural and shear reinforcement Application of minimum flexural and shear reinforcement
RESULTS COMPARISON Table 1 shows the comparison of the SAFE total factored moments in the design strip with the moments obtained by the analytical method. They match exactly for this problem. Table 1 also shows the design reinforcement comparison.
Table 1 Comparison of Moments and Flexural Reinforcements
Method Moment (kN-m)
Reinforcement Area (sq-cm)
As+
SAFE 462 33.512
Calculated 462 33.512
A+,mins = 3.92 sq-cm
EXAMPLE AS 3600-01 RC-BM-001 - 3

Software Verification PROGRAM NAME: SAFE REVISION NO.: 0
Table 2 Comparison of Shear Reinforcements
Shear Force (kN)
Reinforcement Area, s
Av
(sq-cm/m)
SAFE Calculated
231 12.05 12.05
COMPUTER FILE: AS 3100-01 RC-BM-001.FDB
CONCLUSION The SAFE results show an exact comparison with the independent results.
EXAMPLE AS 3600-01 RC-BM-001 - 4

Software Verification PROGRAM NAME: SAFE REVISION NO.: 0
HAND CALCULATION
Flexural Design The following quantities are computed for all the load combinations:
ϕ = 0.8
( )[ ]28'007.085.0 −−= cfγ = 0.836
dka uγ=max = 0.836 • 0.4 • 425 = 142.12 mm
′ =
2
.min 0.22 cfst c
sy
fDA Ad f
= 0.22 • (500/425)2 • 0.6 • SQRT(30)/460 • 180,000 = 391.572 sq-mm
COMB130 N* = (1.2Nd + 1.5Nt) = 231kN
**
3N lM = = 462 kN-m
The depth of the compression block is given by: *
2
c ef
2Ma d d0.85 f ' bφ
= − − = 100.755 mm (a > Ds)
The compressive force developed in the concrete alone is given by: The first part is for balancing the compressive force from the flange, Cf, and the second part is for balancing the compressive force from the web, Cw, 2. Cf is given by:
( ) ( )max,min'85.0 aDbbfC swefcf ×−= = 765 kN
Therefore, 1 =f
ssy
CA
f and the portion of M* that is resisted by the flange is given by:
( )
−=
2,min maxaDdCM s
fuf φ = 229.5 kN-m
EXAMPLE AS 3600-01 RC-BM-001 - 5

Software Verification PROGRAM NAME: SAFEREVISION NO.: 0
1 =f
ssy
CA
f = 1663.043 sq-mm
Again, the value for φ is 0.80 by default. Therefore, the balance of the moment, M* to be carried by the web is:
*uw ufM M M= − = 462 – 229.5 = 232.5
The web is a rectangular section of dimensions bw and d, for which the design depth of the compression block is recalculated as:
21
20.85 φ
= − −′uw
c w
Ma d df b
= 101.5118 mm
If a1 ≤ amax, the area of tension reinforcement is then given by:
21
2φ
= −
uws
sy
MAaf d
= 1688.186 sq-mm
21 ssst AAA += = 3351.23 sq-mm = 33.512 sq-cm
Shear Design The shear force carried by the concrete, Vuc, is calculated as:
31
321'
=
ow
cstowuc db
fAdbV βββ = 0 kN
where, 1.11000
6.11.11 ≥
−= odβ =1.2925, β2 = 1 and β3 = 1
The shear force is limited to a maximum of:
ocu bdfV '2.0max. = = 765 kN
Given V*, Vuc, and Vu.max, the required shear reinforcement is calculated as follows, where, φ, the strength reduction factor, is 0.7.
If * / 2,ucV Vφ≤
0=s
Asv , if D ≤ 750 mm, otherwise Asv.min shall be provided.
EXAMPLE AS 3600-01 RC-BM-001 - 6

Software Verification PROGRAM NAME: SAFE REVISION NO.: 0
If *.min .max ,u uV V Vφ φ< ≤
( )*
.,
cotucsv
sy f o v
V VAs f d
φ
φ θ
−=
and greater than Asv.min, defined as:
=
fsy
wsv
fb
sA
.
min. 35.0 = 0.22826 sq-mm/mm = 228.26 sq-mm/m
θv = the angle between the axis of the concrete compression strut and the longitudinal axis of the member, which varies linearly from 30 degrees when V*=φVu.min to 45 degrees when V*=φ Vu,max = 35.52 degrees
If *max ,V Vφ> a failure condition is declared.
For load combination, the N* and V* are calculated as follows: N* = 1.2Nd + 1.5N1
V* = N*
(COMB130) Nd = 30 kips Nl = 130 kips N* = 231 kN
N* = 231 kN, ( *.min .max ,u uV V Vφ φ< ≤ )
( )φ
φ θ
−=
*
.,
cotucsv
sy f o v
V VAs f d
= 1.205 sq-mm/mm or 12.05 sq-cm/m
EXAMPLE AS 3600-01 RC-BM-001 - 7

Software Verification PROGRAM NAME: SAFE REVISION NO.: 0
EXAMPLE AS 3600-01 RC-PN-001 Slab Punching Shear Design
PROBLEM DESCRIPTION The purpose of this example is to verify slab punching shear design in SAFE
The numerical example is a flat slab that has three 8-m spans in each direction, as shown in Figure 1.
4
A
3
2
1
B C D
X
Y
0.3 m0.3 m8 m8 m8 m
0.6 m
0.6 m
0.25 m thick flat slab
LoadingDL = Self weight + 1.0 kN/m2
LL = 4.0 kN/m2
Columns are 0.3 m x 0.9 mwith long side parallel to the Y-axis, typical
Concrete PropertiesUnit weight = 24 kN/m3
f'c = 30 N/mm2
8 m
8 m
8 m
4
A
3
2
1
B C D
X
Y
0.3 m0.3 m8 m8 m8 m
0.6 m
0.6 m
0.25 m thick flat slab
LoadingDL = Self weight + 1.0 kN/m2
LL = 4.0 kN/m2
Columns are 0.3 m x 0.9 mwith long side parallel to the Y-axis, typical
Concrete PropertiesUnit weight = 24 kN/m3
f'c = 30 N/mm2
8 m
8 m
8 m
Figure 1: Flat Slab for Numerical Example
The slab overhangs beyond the face of the column by 0.15 m along each side of the structure. The columns are typically 0.3 m x 0.9 m, with the long side parallel to the Y-axis. The slab is typically 0.25-m thick. Thick plate properties are used for the slab.
EXAMPLE AS 3600-01 RC-PN-001 - 1

Software Verification PROGRAM NAME: SAFEREVISION NO.: 0
The concrete has a unit weight of 24 kN/m3 and a f 'c of 30 N/mm2. The dead load consists of the self weight of the structure plus an additional 1 kN/m2. The live load is 4 kN/m2.
TECHNICAL FEATURES OF SAFE TESTED Calculation of punching shear capacity, shear stress, and D/C ratio.
RESULTS COMPARISON Table 1 shows the comparison of the punching shear capacity, shear stress ratio, and D/C ratio obtained from SAFE with the punching shear capacity, shear stress ratio and D/C ratio obtained by the analytical method. They match exactly for this problem.
Table 1 Comparison of Design Results for Punching Shear at Grid Point B-2
Method
Shear Stress
(N/mm2)
Shear Capacity
(N/mm2)
D/C ratio
SAFE 1.811 1.086 1.67
Calculated 1.811 1.086 1.67
COMPUTER FILE: AS 3600-01 RC-PN-001.FDB
CONCLUSION The SAFE results show an exact comparison with the independent results.
EXAMPLE AS 3600-01 RC-PN-001 - 2

Software Verification PROGRAM NAME: SAFE REVISION NO.: 0 HAND CALCULATION
Hand Calculation For Interior Column Using SAFE Method
dom = [(250 − 26) + (250 − 38)] / 2 = 218 mm Refer to Figure 2. U = 518+ 1118 + 1118 + 518 = 3272 mm ax = 518 mm ay = 1118 mm
450
450
150 109
X
Y
1118
518
Side 2
Side
3
A B
CD
Column
Side
1
Side 4
Center of column is point (x1, y1). Set this equal to (0,0).
Critical section for punching shear shown dashed.
109 150
109
109
Note: All dimensions in millimeters
450
450
150 109
X
Y
1118
518
Side 2
Side
3
A B
CD
Column
Side
1
Side 4
Center of column is point (x1, y1). Set this equal to (0,0).
Critical section for punching shear shown dashed.
109 150
109
109
Note: All dimensions in millimeters
Figure 2: Interior Column, Grid B-2 in SAFE Model
From the SAFE output at grid line B-2:
V* = 1126.498 kN
Mv2 = −51.991 kN-m Mv3 = 45.723 kN-m
EXAMPLE AS 3600-01 RC-PN-001 - 3

Software Verification PROGRAM NAME: SAFE REVISION NO.: 0
The maximum design shear stress is computed along the major and minor axis of column separately:
*
max *1.08
v
om om
uMVvud V ad
= +
3 6
max, 31126.498 10 3272 51.991 101
3272 218 8 1126.498 10 1118 218Xv • • •
= • + • • • • •
max,Xv = 1.579 • 1.0774 = 1.7013 N/mm2
3 6
max, 31126.498 10 3272 45.723 101
3272 218 8 1126.498 10 518 218Yv • • •
= • + • • • • •
max,Yv = 1.579 • 1.1470 = 1.811 N/mm2 (Govern)
The largest absolute value of vmax= 1.811 N/mm2 The shear capacity is calculated based on the smallest of AS 3600-01 equation 11-35, with the dom and u terms removed to convert force to stress.
20.17 1min
0.34
chcv
c
ff
f
ϕβϕ
ϕ
′+ =
′
= 1.803N/mm2 in accordance with AS 9.2.3(a)
AS 9.2.3(a) yields the smallest value of ϕ cvf = 1.086 N/mm2, and thus this is the shear capacity.
1.811Shear Ratio 1.671.086ϕ
= = =U
cv
vf
EXAMPLE AS 3600-01 RC-PN-001 - 4

Software VerificationPROGRAM NAME: SAFE REVISION NO.: 0
EXAMPLE AS 3600-2001 RC-SL-001 Slab Flexural Design
PROBLEM DESCRIPTION The purpose of this example is to verify slab flexural design in SAFE
A one-way, simple-span slab supported by walls on two opposite edges is modeled using SAFE. The slab is 150 mm thick and spans 4 meters between walls. The walls are modeled as pin supports. The computational model uses a finite element mesh, automatically generated by SAFE. The maximum element size is specified as 0.25 meters. To obtain factored moments and flexural reinforcement in a design strip, one one-meter wide strip is defined in the X-direction on the slab, as shown in Figure 1.
Figure 1 Plan View of One-Way Slab
One dead load case (DL4KPa) and one live load case (LL5KPa), with uniformly distributed surface loads of magnitudes 4 and 5 kN/m2, respectively, are defined in the model. A load combination (COMB5kPa) is defined using the AS 3600-2001 load combination factors, 1.2 for dead loads and 1.5 for live loads. The model is analyzed for both load cases and the load combinations.
The slab moment on a strip of unit width is computed analytically. The total factored strip moments are compared with the SAFE results. After completing analysis, design is performed using the AS 3600-2001 code using SAFE and also by hand computation. Table 1 shows the comparison of the design reinforcements computed using the two methods.
EXAMPLE AS 3600-2001 RC-SL-001 - 1

Software Verification PROGRAM NAME: SAFE REVISION NO.: 0 GEOMETRY, PROPERTIES AND LOADING
Thickness T, h = 150 mm Depth of tensile reinf. dc = 25 mm Effective depth d = 125 mm Clear span ln, l1 = 4000 mm Concrete strength fc = 30 MPa Yield strength of steel fsy = 460 MPa Concrete unit weight wc = 0 N/m3 Modulus of elasticity Ec = 25000 MPa Modulus of elasticity Es = 2x10⁶ MPa Poisson’s ratio ν = 0 Dead load wd = 4.0 kPa Live load wl = 5.0 kPa
TECHNICAL FEATURES OF SAFE TESTED Calculation of flexural reinforcement Application of minimum flexural reinforcement
RESULTS COMPARISON Table 1 shows the comparison of the SAFE total factored moments in the design strip with the moments obtained by the hand computation method. Table 1 also shows the comparison of the design reinforcements.
Table 1 Comparison of Design Moments and Reinforcements
Load Level Method
Strip Moment (kN-m)
Reinforcement Area (sq-cm)
As+
Medium SAFE 24.597 5.58
Calculated 24.600 5.58
,minA s+ = 282.9 sq-mm
COMPUTER FILE: AS 3600-2001 RC-SL-001.FDB
CONCLUSION The SAFE results show an exact comparison with the independent results.
EXAMPLE AS 3600-2001 RC-SL-001 - 2

Software Verification PROGRAM NAME: SAFE REVISION NO.: 0 HAND CALCULATION
The following quantities are computed for the load combination:
ϕ = 0.8 b = 1000 mm
( )[ ]28'007.085.0 −−= cfγ = 0.836
dka uγ=max = 0.836•0.4•125 = 41.8 mm
For the load combination, w and M* are calculated as follows: w = (1.2wd + 1.5wt) b
8
21wlMu =
2
.min 0.22 cfst
sy
fDA bdd f
′ =
= 0.22•(150/125)2•0.6•SQRT(30)/460•100•125 = 282.9 sq-mm
COMB100 wd = 4.0 kPa wt = 5.0 kPa w = 12.3 kN/m M-strip
* = 24.6 kN-m
M-design* = 24.633 kN-m
The depth of the compression block is given by:
φ= − −
*2
c
2Ma d d0.85 f ' b
= 10.065 mm < amax
The area of tensile steel reinforcement is then given by:
−
=
2
*
adf
MAsy
st
φ = 557.966 sq-mm > As,min
EXAMPLE AS 3600-2001 RC-SL-001 - 3

Software Verification PROGRAM NAME: SAFEREVISION NO.: 0
As = 5.57966 sq-cm
EXAMPLE AS 3600-2001 RC-SL-001 - 4

Software Verification PROGRAM NAME: SAFE REVISION NO.: 0
EXAMPLE BS 8110-97 PT-SL-001 Post-Tensioned Slab Design
PROBLEM DESCRIPTION The purpose of this example is to verify the slab stresses and the required area of mild steel strength reinforcing for a post-tensioned slab.
A one-way, simply supported slab is modeled in SAFE. The modeled slab is 254 mm thick by 914 mm wide and spans 9754 mm, as shown in shown in Figure 1.
Length, L = 9754 mm
Elevation Section
Prestressing tendon, Ap
Mild Steel, As
914 mm25 mm
229 mm
254 mm
Length, L = 9754 mm
Elevation Section
Prestressing tendon, Ap
Mild Steel, As
914 mm25 mm
229 mm
254 mm
Figure 1 One-Way Slab
EXAMPLE BS 8110-97 PT-SL-001 - 1

Software Verification PROGRAM NAME: SAFEREVISION NO.: 0
A 254-mm-wide design strip is centered along the length of the slab and has been defined as an A-Strip. B-strips have been placed at each end of the span, perpendicular to Strip-A (the B-Strips are necessary to define the tendon profile). A tendon with two strands, each having an area of 99 mm2, was added to the A-Strip. The self-weight and live loads were added to the slab. The loads and post-tensioning forces are as follows.
Loads: Dead = self weight, Live = 4.788 kN/m2
The total factored strip moments, required area of mild steel reinforcement, and slab stresses are reported at the midspan of the slab. Independent hand calculations have been compared with the SAFE results and summarized for verification and validation of the SAFE results.
GEOMETRY, PROPERTIES AND LOADING Thickness T, h = 254 mm Effective depth d = 229 mm Clear span L = 9754 mm
Concrete strength f 'c = 30 MPa Yield strength of steel fy = 400 MPa Prestressing, ultimate fpu = 1862 MPa Prestressing, effective fe = 1210 MPa Area of Prestress (single strand) Ap = 198 mm2 Concrete unit weight wc = 23.56 kN/m3 Modulus of elasticity Ec = 25000 N/mm3 Modulus of elasticity Es = 200,000 N/mm3 Poisson’s ratio ν = 0
Dead load wd = self kN/m2 Live load wl = 4.788 kN/m2
TECHNICAL FEATURES OF SAFE TESTED Calculation of the required flexural reinforcement Check of slab stresses due to the application of dead, live, and post-tensioning
loads.
RESULTS COMPARISON Table 1 shows the comparison of the SAFE total factored moments, required mild steel reinforcing, and slab stresses with the independent hand calculations.
EXAMPLE BS 8110-97 PT-SL-001 - 2

Software Verification PROGRAM NAME: SAFE REVISION NO.: 0
Table 1 Comparison of Results
FEATURE TESTED INDEPENDENT RESULTS
SAFE RESULTS DIFFERENCE
Factored moment, Mu (Ultimate) (kN-m)
174.4 174.4 0.00%
Area of Mild Steel req’d, As (sq-cm) 19.65 19.79 0.71%
Transfer Conc. Stress, top (D+PTI), MPa −5.058 −5.057 0.02%
Transfer Conc. Stress, bot (D+PTI), MPa 2.839 2.839 0.00%
Normal Conc. Stress, top (D+L+PTF), MPa −10.460 −10.465 0. 50%
Normal Conc. Stress, bot (D+L+PTF), MPa 8.402 8.407 0.06%
COMPUTER FILE: BS 8110-97 PT-SL-001.FDB
CONCLUSION The SAFE results show an acceptable comparison with the independent results.
EXAMPLE BS 8110-97 PT-SL-001 - 3

Software Verification PROGRAM NAME: SAFE REVISION NO.: 0
HAND CALCULATIONS:
Design Parameters:
Mild Steel Reinforcing Post-Tensioning fcu = 30 MPa fpu = 1862 MPa fy = 400 MPa fpy = 1675 MPa Stressing Loss = 186 MPa Long-Term Loss = 94 MPa fi = 1490 MPa fe = 1210 MPa
γm, steel = 1.15
γm, concrete = 1.50
Length, L = 9754 mm
Elevation Section
Prestressing tendon, Ap
Mild Steel, As
914 mm25 mm
229 mm
254 mm
Length, L = 9754 mm
Elevation Section
Prestressing tendon, Ap
Mild Steel, As
914 mm25 mm
229 mm
254 mm
Loads:
Dead, self-wt = 0.254 m x 23.56 kN/m3 = 5.984 kN/m2 (D) x 1.4 = 8.378 kN/m2 (Du) Live, = 4.788 kN/m2 (L) x 1.6 = 7.661 kN/m2 (Lu)
Total = 10.772 kN/m2 (D+L) = 16.039 kN/m2 (D+L)ult ω =10.772 kN/m2 x 0.914m = 9.846 kN/m, uω = 16.039 kN/m2 x 0.914m = 14.659 kN/m
Ultimate Moment, 2
1
8UwlM = = 14.659 x (9.754)2/8 = 174.4 kN-m
Ultimate Stress in strand, 7000 1 1.7/
pu ppb pe
cu
f Af f
l d f bd
= + −
7000 1862(198)1210 1 1.7
9.754 / 0.229 30(914)(229)1358 MPa 0.7 1303 MPapuf
= + −
= ≤ =
EXAMPLE BS 8110-97 PT-SL-001 - 4

Software VerificationPROGRAM NAME: SAFE REVISION NO.: 0
K factor used to determine the effective depth is given as:
2bdfMK
cu
= = ( )( )2
174.4 0.121330000 0.914 0.229
= < 0.156
dKdz 95.09.0
25.05.0 ≤
−+= = 192.2 mm
Ultimate force in PT, ( ), ( ) 197.4 1303 1000 257.2= = =ult PT P PSF A f KN
Ultimate moment due to PT, ( ), , ( ) / 257.2 0.192 1.15 43.00 kN-mγ= = =ult PT ult PTM F z
Net Moment to be resisted by As, NET U PTM M M= −= − =174.4 43.00 131.40 kN-m
The area of tensile steel reinforcement is then given by:
0 87NET
sy
MA. f z
= = ( )( )
( ) 2131.4 1 6 1965 mm0.87 400 192
e =
Check of Concrete Stresses at Midspan:
Initial Condition (Transfer), load combination (D+PTi) = 1.0D+0.0L+1.0PTI
Tendon stress at transfer = jacking stress − stressing losses = 1490 − 186 = 1304 MPa The force in the tendon at transfer, = ( )1304 197.4 1000 257.4 kN=
Moment due to dead load, ( )( )25.984 0.914 9.754 8 65.04 kN-m= =DM Moment due to PT, ( )(sag) 257.4 102mm 1000 26.25 kN-m= = =PT PTIM F
Stress in concrete,( )
257.4 65.04 26.230.254 0.914 0.00983
− − −= ± = ±PTI D PTF M Mf
A Swhere S=0.00983m3
1.109 3.948 MPaf = − ± 5.058(Comp) max, 2.839(Tension) maxf = −
Normal Condition, load combinations: (D+L+PTF) = 1.0D+1.0L+1.0PTF
Tendon stress at Normal = jacking − stressing − long-term = 1490 − 186 − 94= 1210 MPa The force in tendon at Normal, = ( )1210 197.4 1000 238.9 kN=
Moment due to dead load, ( )( )25.984 0.914 9.754 8 65.04 kN-m= =DM
Moment due to live load, ( )( )24.788 0.914 9.754 8 52.04 kN-m= =LMMoment due to PT, ( )(sag) 238.9 102 mm 1000 24.37 kN-m= = =PT PTIM F
EXAMPLE BS 8110-97 PT-SL-001 - 5

Software Verification PROGRAM NAME: SAFEREVISION NO.: 0
Stress in concrete for (D+L+PTF),
( )238.8 117.08 24.37
0.254 0.914 0.00983+ − − −
= ± = ±PTI D L PTF M MfA S1 029 9 431f . .= − ± 10.460(Comp) max, 8.402(Tension) maxf = −
EXAMPLE BS 8110-97 PT-SL-001 - 6

Software Verification PROGRAM NAME: SAFE REVISION NO.: 0
EXAMPLE BS 8110-97 RC-BM-001 Flexural and Shear Beam Design
PROBLEM DESCRIPTION The purpose of this example is to verify slab flexural design in SAFE. The load level is adjusted for the case corresponding to the following conditions:
The stress-block extends below the flange but remains within the balanced condition permitted by BS 8110-97.
The average shear stress in the beam is below the maximum shear stress allowed by BS 8110-97, requiring design shear reinforcement.
A simple-span, 6-m-long, 300-mm-wide, and 500-mm-deep T-beam with a flange 100 mm thick and 600 mm wide is modeled using SAFE. The beam is shown in Figure 1. The computational model uses a finite element mesh of frame elements, automatically generated by SAFE. The maximum element size has been specified to be 200 mm. The beam is supported by columns without rotational stiffnesses and with very large vertical stiffness (1 × 10²⁰ kN/m).
The beam is loaded with symmetric third-point loading. One dead load case (DL20) and one live load case (LL80) with only symmetric third-point loads of magnitudes 20 and 80 kN, respectively, are defined in the model. One load combinations (COMB80) is defined using the BS 8110-97 load combination factors of 1.4 for dead loads and 1.6 for live loads. The model is analyzed for both of these load cases and the load combinations.
The beam moment and shear force are computed analytically. The total factored moment and shear force are compared with the SAFE results. These moment and shear force are identical. After completing the analysis, design is performed using the BS 8110-97 code in SAFE and also by hand computation. Table 1 shows the comparison of the design longitudinal reinforcements. Table 2 shows the comparison of the design shear reinforcements.
EXAMPLE BS 8110-97 RC-BM-001 - 1

Software Verification PROGRAM NAME: SAFEREVISION NO.: 0
Beam Section
75 mm 100 mm
300 mm
600 mm
75 mm
500 mm
Shear Force
Bending Moment
2000 mm 2000 mm 2000 mm
Beam Section
75 mm 100 mm
300 mm
600 mm
75 mm
500 mm
Shear Force
Bending Moment
2000 mm 2000 mm 2000 mm
Figure 1 The Model Beam for Flexural and Shear Design
EXAMPLE BS 8110-97 RC-BM-001 - 2

Software Verification PROGRAM NAME: SAFE REVISION NO.: 0
GEOMETRY, PROPERTIES AND LOADING Clear span l = 6000 mm Overall depth h = 500 mm Flange thickness ds = 100 mm Width of web bw = 300 mm Width of flange, bf = 600 mm Depth of tensile reinf. dc = 75 mm Effective depth d = 425 mm Depth of comp. reinf. d' = 75 mm Concrete strength f'
c = 30 MPa Yield strength of steel fy = 460 MPa Concrete unit weight wc = 0 kN/m3 Modulus of elasticity Ec = 25x105 MPa Modulus of elasticity Es = 2x10⁸ MPa Poisson’s ratio v = 0.2 Dead load Pd = 20 kN Live load Pl = 80 kN
TECHNICAL FEATURES OF SAFE TESTED Calculation of flexural and shear reinforcement Application of minimum flexural and shear reinforcement
RESULTS COMPARISON Table 1 shows the comparison of the SAFE total factored moments in the design strip with the moments obtained by the analytical method. They match exactly for this problem. Table 1 Also shows the design reinforcement comparison.
Table 1 Comparison of Moments and Flexural Reinforcements
Method Moment (kN-m)
Reinforcement Area (sq-cm)
As+
SAFE 312 20.90
Calculated 312 20.90
,mins+A = 195.00 sq-mm
EXAMPLE BS 8110-97 RC-BM-001 - 3

Software Verification PROGRAM NAME: SAFE REVISION NO.: 0
Table 2 Comparison of Shear Reinforcements
Shear Force (kN)
Reinforcement Area, s
Av
(sq-cm/m)
SAFE Calculated
156 6.50 6.50
COMPUTER FILE: BS 8110-97 RCBM-001.FDB
CONCLUSION The SAFE results show an exact comparison with the independent results.
EXAMPLE BS 8110-97 RC-BM-001 - 4

Software VerificationPROGRAM NAME: SAFE REVISION NO.: 0
HAND CALCULATION
Flexural Design The following quantities are computed for all the load combinations:
γm, steel = 1.15
γm, concrete = 1.50
min 0 0013=s , wA . b h = 195.00 sq-mm
COMB80 P = (1.4Pd + 1.6Pt) =156 kN
**
3N lM = = 312 kN-m
The depth of the compression block is given by:
K = 2dbfM
fcu
= 0.095963 < 0.156
Then the moment arm is computed as:
z = d
−+9.0
25.05.0 K ≤ 0.95d = 373.4254 mm
The depth of the neutral axis is computed as:
x = 45.01 (d − z) = 114.6102 mm
And the depth of the compression block is given by: a = 0.9x = 103.1492 mm > hf
The ultimate resistance moment of the flange is given by:
( ) ( )0.67 0.5f cu f w f fc
M f b b h d hγ
= − − = 150.75 kN-m
The moment taken by the web is computed as:
EXAMPLE BS 8110-97 RC-BM-001 - 5

Software Verification PROGRAM NAME: SAFE REVISION NO.: 0
fw MMM −= = 161.25 kN-m
and the normalized moment resisted by the web is given by:
Kw = 2w
cu w
Mf b d
= 0.0991926 < 0.156
If Kw ≤ 0.156 (BS 3.4.4.4), the beam is designed as a singly reinforced concrete beam. The reinforcement is calculated as the sum of two parts: one to balance compression in the flange and one to balance compression in the web.
dKdz w 95.09.0
25.05.0 ≤
−+= = 371.3988 mm
( )0.5
f ws
y yf
s s
M MA f fd h z
γ γ
= +−
= 2090.4 sq-mm
Shear Design
maxvdb
Vvw
≤= = 1.2235 MPa
vmax = min(0.8 cuf , 5 MPa) = 4.38178 MPa
The shear stress carried by the concrete, vc, is calculated as:
41
31
21 40010079.0
=
dbdAkkv s
mc γ
= 0.3568 MPa
k1 is the enhancement factor for support compression, and is conservatively taken as 1 .
k2 = 3
1
25
cuf = 1.06266, 1 ≤ k2 ≤
31
2540
γm = 1.25
bdAs100 = 0.15
EXAMPLE BS 8110-97 RC-BM-001 - 6

Software Verification PROGRAM NAME: SAFE REVISION NO.: 0
41
400
d = 1
However, the following limitations also apply:
0.15 ≤ bd
As100 ≤ 3
41
400
d ≥ 1
fcu ≤ 40 MPa (for calculation purposes only) and As is the area of tension reinforcement.
Given v, vc, and vmax, the required shear reinforcement is calculated as follows: If v ≤ (vc + 0.4)
yv
w
v
sv
fb
sA
87.04.0
=
If (vc + 0.4) < v ≤ vmax
( )yv
wc
v
sv
fbvv
sA
87.0−
=
If v > vmax, a failure condition is declared.
(COMB80) Pd = 20 kN Pl = 80 kN V = 156 kN
( )
yv
wc
v
sv
fbvv
sA
87.0−
= = 0.64967 sq-mm/mm = 649.67 sq-mm/m
EXAMPLE BS 8110-97 RC-BM-001 - 7

Software VerificationPROGRAM NAME: SAFE REVISION NO.: 0
EXAMPLE BS 8110-97 RC-PN-001 Slab Punching Shear Design
PROBLEM DESCRIPTION The purpose of this example is to verify slab punching shear design in SAFE
The numerical example is a flat slab that has three 8-m spans in each direction, as shown in Figure 1.
4
A
3
2
1
B C D
X
Y
0.3 m0.3 m8 m8 m8 m
0.6 m
0.6 m
0.25 m thick flat slab
LoadingDL = Self weight + 1.0 kN/m2
LL = 4.0 kN/m2
Columns are 0.3 m x 0.9 mwith long side parallel to the Y-axis, typical
Concrete PropertiesUnit weight = 24 kN/m3
f'c = 30 N/mm2
8 m
8 m
8 m
4
A
3
2
1
B C D
X
Y
0.3 m0.3 m8 m8 m8 m
0.6 m
0.6 m
0.25 m thick flat slab
LoadingDL = Self weight + 1.0 kN/m2
LL = 4.0 kN/m2
Columns are 0.3 m x 0.9 mwith long side parallel to the Y-axis, typical
Concrete PropertiesUnit weight = 24 kN/m3
f'c = 30 N/mm2
8 m
8 m
8 m
Figure 1: Flat Slab for Numerical Example
The slab overhangs beyond the face of the column by 0.15 m along each side of the structure. The columns are typically 0.3 m x 0.9 m with the long side parallel to the Y-axis. The slab is typically 0.25-m thick. Thick plate properties are used for the slab.
The concrete has a unit weight of 24 kN/m3 and a fcu of 30 N/mm2. The dead load consists of the self weight of the structure plus an additional 1 kN/m2. The live load is 4 kN/m2.
EXAMPLE BS 8110-97 RC-PN-001 - 1

Software Verification PROGRAM NAME: SAFEREVISION NO.: 0
TECHNICAL FEATURES OF SAFE TESTED Calculation of punching shear capacity, shear stress and D/C ratio.
RESULTS COMPARISON Table 1 shows the comparison of the punching shear capacity, shear stress ratio and D/C ratio obtained from SAFE with the punching shear capacity, shear stress ratio and D/C ratio obtained by the analytical method. They match exactly for this problem.
Table 1 Comparison of Design Results for Punching Shear at Grid B-2
Method
Shear Stress
(N/mm2)
Shear Capacity
(N/mm2)
D/C ratio
SAFE 1.105 0.625 1.77
Calculated 1.105 0.625 1.77
COMPUTER FILE: BS 8110-97 RC-PN-001.FDB
CONCLUSION The SAFE results show an exact comparison with the independent results.
EXAMPLE BS 8110-97 RC-PN-001 - 2

Software Verification PROGRAM NAME: SAFE REVISION NO.: 0
HAND CALCULATION Hand Calculation For Interior Column Using SAFE Method
( ) ( )[ ]250 26 250 38 2 218 mm= − + − =d
Refer to Figure 2. u = 954+ 1554 + 954 + 1554 = 5016 mm
450
450
X
Y
1554
954
Side 2
Side
3
A B
CD
Column
Side
1
Side 4
Center of column is point (x1, y1). Set this equal to (0,0).
Critical section for punching shear shown dashed.
150
327
327
Note: All dimensions in millimeters
150 327
X
Y
Side 2A B
CD
327
450
450
X
Y
1554
954
Side 2
Side
3
A B
CD
Column
Side
1
Side 4
Center of column is point (x1, y1). Set this equal to (0,0).
Critical section for punching shear shown dashed.
150
327
327
Note: All dimensions in millimeters
150 327
X
Y
Side 2A B
CD
327
Figure 2: Interior Column, Grid B-2 in SAFE Model
From the SAFE output at Grid B-2: V = 1126.498 kN M2 = 51.9908 kN-m M3 = 45.7234 kN-m
EXAMPLE BS 8110-97 RC-PN-001 - 3

Software Verification PROGRAM NAME: SAFE REVISION NO.: 0
Maximum design shear stress in computed in along major and minor axis of column:
,
1.5 = +
eff x
MV xv fud Vy
(BS 3.7.7.3)
,. . .. .
.
3 6
31126 498 10 1 5 51 9908 101 0 1 1049
5016 218 1126 498 10 954 • • •
= + = • • • eff xv (Govern)
,
1.5 = +
eff y
MV yv fud Vx
3 6
, 31126.498 10 1.5 45.7234 101.0 1.0705
5016 218 1126.498 10 1554 • • •
= + = • • • eff yv
The largest absolute value of v = 1.1049 N/mm2
The shear stress carried by the concrete, vc, is calculated as:
41
31
21 40010079.0
=
dbdAkkv s
mc γ
= 0.3568 MPa
k1 is the enhancement factor for support compression, and is conservatively taken as 1 .
k2 = 3
1
25
cuf =
1330
25
= 1.0627 > 1.0 OK
γm = 1.25
41
400
d = 1.16386 > 1 OK.
fcu ≤ 40 MPa (for calculation purposes only) and As is the area of tension reinforcement. Areas of reinforcement at the face of column for the design strips are as follows: As in Strip Layer A = 9494.296 mm2
As in Strip Layer B = 8314.486 mm2
EXAMPLE BS 8110-97 RC-PN-001 - 4

Software VerificationPROGRAM NAME: SAFE REVISION NO.: 0
Average As = (9494.296+8314.486)/2 = 8904.391 mm2
bdAs100 = 100• 8904.391/(8000• 218) = 0.51057
( )1/30.79 1.0 1.0627 0.51057 1.163861.25cv • •
= • • = 0.6247 MPa
BS 3.7.7.3 yields the value of v = 0.625 N/mm2 , and thus this is the shear capacity.
1.1049Shear Ratio 1.770.6247
= = =Uvv
EXAMPLE BS 8110-97 RC-PN-001 - 5

Software Verification PROGRAM NAME: SAFE REVISION NO.: 0
EXAMPLE BS 8110-97 RC-SL-001 Slab Flexural Design
PROBLEM DESCRIPTION The purpose of this example is to verify slab flexural design in SAFE.
A one-way, simple-span slab supported by walls on two opposite edges is modeled using SAFE. The slab is 150 mm thick and spans 4 meters between walls. The walls are modeled as pin supports. The computational model uses a finite element mesh, automatically generated by SAFE. The maximum element size is specified as 0.25 meters. To obtain factored moments and flexural reinforcement in a design strip, one one-meter wide strip is defined in the X-direction on the slab, as shown in Figure 1.
Figure 1 Plan View of One-Way Slab
One dead load case (DL4KPa) and one live load case (LL5KPa) with uniformly distributed surface loads of magnitudes 4 and 5 kN/m2, respectively, are defined in the model. A load combination (COMB5kPa) is defined using the BS 8110-97 load combination factors, 1.4 for dead loads and 1.6 for live loads. The model is analyzed for both load cases and the load combination.
The slab moment on a strip of unit width is computed analytically. The total factored strip moments are compared with the SAFE results. After completing the analysis, design was performed using the BS 8110-97 code by SAFE and also by hand computation. Table 1 shows the comparison of the design reinforcements computed by the two methods.
EXAMPLE BS 8110-97 RC-SL-001 - 1

Software Verification PROGRAM NAME: SAFE REVISION NO.: 0 GEOMETRY, PROPERTIES AND LOADING
Thickness T, h = 150 mm Depth of tensile reinf. dc = 25 mm Effective depth d = 125 mm Clear span ln, l1 = 4000 mm Concrete strength fc = 30 MPa Yield strength of steel fsy = 460 MPa Concrete unit weight wc = 0 N/m3 Modulus of elasticity Ec = 25000 MPa Modulus of elasticity Es = 2x10⁶ MPa Poisson’s ratio ν = 0 Dead load wd = 4.0 kPa Live load wl = 5.0 kPa
TECHNICAL FEATURES OF SAFE TESTED Calculation of flexural reinforcement Application of minimum flexural reinforcement
RESULTS COMPARISON Table 1 shows the comparison of the SAFE total factored moments in the design strip with the moments obtained by the hand computation method. Table 1 also shows the comparison of the design reinforcements.
Table 1 Comparison of Design Moments and Reinforcements
Load Level Method
Strip Moment (kN-m)
Reinforcement Area (sq-cm)
As+
Medium SAFE 27.197 5.853
Calculated 27.200 5.850
,minA s+ = 162.5 sq-mm
EXAMPLE BS 8110-97 RC-SL-001 - 2
Software VerificationPROGRAM NAME: SAFE REVISION NO.: 0
COMPUTER FILE: BS 8110-97 RC-SL-001.FDB
CONCLUSION The SAFE results show an exact comparison with the independent results.
EXAMPLE BS 8110-97 RC-SL-001 - 3

Software Verification PROGRAM NAME: SAFE REVISION NO.: 0
HAND CALCULATION The following quantities are computed for the load combination:
γm, steel = 1.15
γm, concrete = 1.50 b = 1000 mm
For the load combination, w and M are calculated as follows: w = (1.4wd + 1.6wt) b
21
8wlM =
As,min = 0.0013bwd = 162.5 sq-mm
COMB100 wd = 4.0 kPa wt = 5.0 kPa w = 13.6 kN/m M-strip = 27.2 kN-m M-design = 27.2366 kN-m
The depth of the compression block is given by:
2bdfMK
cu
= = 0.05810 < 0.156
The area of tensile steel reinforcement is then given by:
dKdz 95.09.0
25.05.0 ≤
−+= =116.3283
zf
MAy
s 87.0= = 585.046 sq-mm > As,min
As = 5.850 sq-cm
EXAMPLE BS 8110-97 RC-SL-001 - 4

Software VerificationPROGRAM NAME: SAFE REVISION NO.: 0
EXAMPLE CSA A23.3-14 PT-SL-001 Post-Tensioned Slab Design
PROBLEM DESCRIPTION The purpose of this example is to verify the slab stresses and the required area of mild steel strength reinforcing for a post-tensioned slab.
A one-way simply supported slab is modeled in SAFE. The modeled slab is 254 mm thick by 914 mm wide and spans 9754 mm as shown in shown in Figure 1.
Length, L = 9754 mm
Elevation Section
Prestressing tendon, Ap
Mild Steel, As
914 mm25 mm
229 mm
254 mm
Length, L = 9754 mm
Elevation Section
Prestressing tendon, Ap
Mild Steel, As
914 mm25 mm
229 mm
254 mm
Figure 1 One-Way Slab
EXAMPLE CSA A23.3-14 PT-SL-001 - 1

Software Verification PROGRAM NAME: SAFE REVISION NO.: 0
A 254-mm-wide design strip is centered along the length of the slab and has been defined as an A-Strip. B-strips have been placed at each end of the span perpendicular to Strip-A (the B-Strips are necessary to define the tendon profile). A tendon with two strands, each having an area of 99 mm2, has been added to the A-Strip. The self weight and live loads were added to the slab. The loads and post-tensioning forces are as follows:
Loads: Dead = self weight, Live = 4.788 KN/m2
The total factored strip moments, required area of mild steel reinforcement, and slab stresses are reported at the midspan of the slab. Independent hand calculations have been compared with the SAFE results and summarized for verification and validation of the SAFE results.
GEOMETRY, PROPERTIES AND LOADING Thickness T, h = 254 mm Effective depth d = 229 mm Clear span L = 9754 mm Concrete strength f 'c = 30 MPa Yield strength of steel fy = 400 MPa Prestressing, ultimate fpu = 1862 MPa Prestressing, effective fe = 1210 MPa Area of Prestress (single strand) Ap = 198 mm2 Concrete unit weight wc = 23.56 KN/m3 Modulus of elasticity Ec = 25000 N/mm3 Modulus of elasticity Es = 200,000 N/mm3 Poisson’s ratio ν = 0 Dead load wd = self KN/m2 Live load wl = 4.788 KN/m2
TECHNICAL FEATURES OF SAFE TESTED Calculation of the required flexural reinforcement Check of slab stresses due to the application of dead, live, and post-tensioning
loads.
EXAMPLE CSA A23.3-14 PT-SL-001 - 2

Software VerificationPROGRAM NAME: SAFE REVISION NO.: 0
RESULTS COMPARISON Table 1 shows the comparison of the SAFE total factored moments, required mild steel reinforcing, and slab stresses with the independent hand calculations.
Table 1 Comparison of Results
FEATURE TESTED INDEPENDENT RESULTS
SAFE RESULTS DIFFERENCE
Factored moment, Mu (Ultimate) (kN-m)
159.4 159.4 0.00%
Area of Mild Steel req’d, As (sq-cm) 16.25 16.32 0.43%
Transfer Conc. Stress, top (D+PTI), MPa −5.058 −5.057 -0.02%
Transfer Conc. Stress, bot (D+PTI), MPa 2.839 2.839 0.00%
Normal Conc. Stress, top (D+L+PTF), MPa −10.460 −10.465 0.05%
Normal Conc. Stress, bot (D+L+PTF), MPa 8.402 8.407 0.06%
Long-Term Conc. Stress, top (D+0.5L+PTF(L)), MPa −7.817 −7.817 0.00%
Long-Term Conc. Stress, bot (D+0.5L+PTF(L)), MPa 5.759 5.759 0.00%
COMPUTER FILE: CSA A23.3-14 PT-SL-001.FDB
CONCLUSION The SAFE results show an exact comparison with the independent results.
EXAMPLE CSA A23.3-14 PT-SL-001 - 3

Software Verification PROGRAM NAME: SAFEREVISION NO.: 0
HAND CALCULATIONS:
Design Parameters:
Mild Steel Reinforcing Post-Tensioning
fcu = 30MPa fpu = 1862 MPa fy = 400MPa fpy = 1675 MPa
Stressing Loss = 186 MPa Long-Term Loss = 94 MPa
fi = 1490 MPa fe = 1210 MPa
0 65c .φ = , 0 85S .φ =
α1 = 0.85 – 0.0015f'c ≥ 0.67 = 0.805
β1 = 0.97 – 0.0025f'c ≥ 0.67 = 0.895
Length, L = 9754 mm
Elevation Section
Prestressing tendon, Ap
Mild Steel, As
914 mm25 mm
229 mm
254 mm
Length, L = 9754 mm
Elevation Section
Prestressing tendon, Ap
Mild Steel, As
914 mm25 mm
229 mm
254 mm
Loads: Dead, self-wt = 0.254 m x 23.56 kN/m3 = 5.984 kN/m2 (D) x 1.25 = 7.480 kN/m2 (Du) Live, = 4.788 kN/m2 (L) x 1.50 = 7.182 kN/m2 (Lu)
Total = 10.772 kN/m2 (D+L) = 14.662 kN/m2 (D+L)ult
ω =10.772 kN/m2 x 0.914m = 9.846 kN/m, uω = 16.039 kN/m2 x 0.914m = 13.401 kN/m
Ultimate Moment, 2
1
8UwlM = = 13.401 x (9.754)2/8 = 159.42 kN-m
EXAMPLE CSA A23.3-14 PT-SL-001 - 4

Software VerificationPROGRAM NAME: SAFE REVISION NO.: 0
Ultimate Stress in strand, ( )8000pb pe p y
o
f f d cl
= + −
( )( ) ( )( )( )( )( )( )1 1
0.9 197 1347 0.85 1625 400 61.66 mm' 0.805 0.65 30.0 0.895 914
φ φα φ β
+ += = =p p pr s s y
yc c
A f A fc
f b
( )80001210 229 61.66 1347 MPa9754pbf = + − =
Depth of the compression block, a, is given as:
Stress block depth, α φ
= − −*
2
1 c c
2Ma d df ' b
( )( )( )( )
2 2 159.420.229 0.229 55.180.805 30000 0.65 0.914
= − − =
Ultimate force in PT, ( ), ( ) 197 1347 1000 265.9 kN= = =ult PT P PSF A f
Ultimate moment due to PT,
( ), ,55.18265.9 0.229 0.85 45.52 kN-m
2 2φ = − = − =
ult PT ult PTaM F d
Net Moment to be resisted by As, NET U PTM M M= −= − =159.42 45.52 113.90 kN-m
The area of tensile steel reinforcement is then given by:
0.87NET
sy
MAf z
= = ( )
( ) 2113.90 1 6 1625 mm55.180.87 400 229
2
e = −
Check of Concrete Stresses at Midspan:
Initial Condition (Transfer), load combination (D+PTi) = 1.0D+0.0L+1.0PTI
Tendon stress at transfer = jacking stress − stressing losses = 1490 − 186 = 1304 MPa The force in the tendon at transfer, = ( )1304 197.4 1000 257.4 kN=
EXAMPLE CSA A23.3-14 PT-SL-001 - 5

Software Verification PROGRAM NAME: SAFEREVISION NO.: 0
Moment due to dead load, ( )( )25.984 0.914 9.754 8 65.04 kN-m= =DM Moment due to PT, ( )(sag) 257.4 102 mm 1000 26.25 kN-m= = =PT PTIM F
Stress in concrete, 257.4 65.04 26.230.254(0.914) 0.00983
PTI D PTF M MfA S
− − −= ± = ±
where S = 0.00983m3
1.109 3.948 MPaf = − ± 5.058(Comp) max, 2.839(Tension) maxf = −
Normal Condition, load combinations: (D+L+PTF) = 1.0D+1.0L+1.0PTF
Tendon stress at normal = jacking − stressing − long-term = 1490 − 186 − 94 = 1210 MPa The force in tendon at normal, = ( )1210 197.4 1000 238.9 kN=
Moment due to dead load, ( )( )25.984 0.914 9.754 8 65.04 kN-m= =DM
Moment due to live load, ( )( )24.788 0.914 9.754 8 52.04 kN-m= =LM Moment due to PT, ( )(sag) 238.9 102 mm 1000 24.37 kN-m= = =PT PTIM F
Stress in concrete for (D+L+PTF),
( )238.8 117.08 24.37
0.254 0.914 0.00983+ − − −
= ± = ±PTI D L PTF M MfA S1 029 9 431f . .= − ± 10.460(Comp) max, 8.402(Tension) maxf = −
Long-Term Condition, load combinations: (D+0.5L+PTF(L)) = 1.0D+0.5L+1.0PTF
Tendon stress at normal = jacking − stressing − long-term = 1490 − 186 − 94 = 1210 MPa The force in tendon at normal, = ( )1210 197.4 1000 238.9 kN=
Moment due to dead load, ( )( )25.984 0.914 9.754 8 65.04 kN-m= =DM
Moment due to live load, ( )( )24.788 0.914 9.754 8 52.04 kN-m= =LM Moment due to PT, ( )(sag) 238.9 102 mm 1000 24.37 kN-m= = =PT PTIM F
Stress in concrete for (D+0.5L+PTF(L)),
( )0.5 238.9 91.06 24.33
0.254 0.914 0.00983+ − − −
= ± = ±D L PTPTI M MFfA S1 029 6 788f . .= − ± 7.817(Comp) max, 5.759(Tension) maxf = −
EXAMPLE CSA A23.3-14 PT-SL-001 - 6
Software Verification PROGRAM NAME: SAFE REVISION NO.: 0
EXAMPLE CSA A23.3-14 RC-BM-001 Flexural and Shear Beam Design
PROBLEM DESCRIPTION The purpose of this example is to verify slab flexural design in SAFE. The load level is adjusted for the case corresponding to the following conditions:
The stress-block extends below the flange but remains within the balanced condition permitted by CSA A23.3-14.
The average shear stress in the beam is below the maximum shear stress allowed by CSA A23.3-14, requiring design shear reinforcement.
A simple-span, 6-m-long, 300-mm-wide, and 500-mm-deep T-beam with a flange 100 mm thick and 600 mm wide is modeled using SAFE. The beam is shown in Figure 1. The computational model uses a finite element mesh of frame elements, automatically generated by SAFE. The maximum element size has been specified to be 200 mm. The beam is supported by columns without rotational stiffnesses and with very large vertical stiffness (1 × 10²⁰ kN/m).
The beam is loaded with symmetric third-point loading. One dead load case (DL30) and one live load case (LL100) with only symmetric third-point loads of magnitudes 30, and 100 kN, respectively, are defined in the model. One load combinations (COMB100) is defined using the CSA A23.3-14 load combination factors of 1.25 for dead loads and 1.5 for live loads. The model is analyzed for both of these load cases and the load combinations.
The beam moment and shear force are computed analytically. The total factored moment and shear force are compared with the SAFE results. These moment and shear force are identical. After completing the analysis, design is performed using the CSA A23.3-14 code in SAFE and also by hand computation. Table 1 shows the comparison of the design longitudinal reinforcements. Table 2 shows the comparison of the design shear reinforcements.
EXAMPLE CSA A23.3-14 RC-BM-001 - 1

Software Verification PROGRAM NAME: SAFE REVISION NO.: 0
Beam Section
75 mm 100 mm
300 mm
600 mm
75 mm
500 mm
Shear Force
Bending Moment
2000 mm 2000 mm 2000 mm
Beam Section
75 mm 100 mm
300 mm
600 mm
75 mm
500 mm
Shear Force
Bending Moment
2000 mm 2000 mm 2000 mm
Figure 1 The Model Beam for Flexural and Shear Design
EXAMPLE CSA A23.3-14 RC-BM-001 - 2

Software VerificationPROGRAM NAME: SAFE REVISION NO.: 0
GEOMETRY, PROPERTIES AND LOADING Clear span, l = 6000 mm Overall depth, h = 500 mm Flange thickness, ds = 100 mm Width of web, bw = 300 mm Width of flange, bf = 600 mm Depth of tensile reinf., dc = 75 mm Effective depth, d = 425 mm Depth of comp. reinf., d' = 75 mm
Concrete strength, f'c = 30 MPa
Yield strength of steel, fy = 460 MPa Concrete unit weight, wc = 0 kN/m3 Modulus of elasticity, Ec = 25x105 MPa Modulus of elasticity, Es = 2x10⁸ MPa Poisson’s ratio, v = 0.2
Dead load, Pd = 30 kN Live load, Pl = 100 kN
TECHNICAL FEATURES OF SAFE TESTED Calculation of flexural and shear reinforcement Application of minimum flexural and shear reinforcement
RESULTS COMPARISON Table 1 shows the comparison of the SAFE total factored moments in the design strip with the moments obtained by the analytical method. They match exactly for this problem. Table 1 also shows the design reinforcement comparison.
Table 1 Comparison of Moments and Flexural Reinforcements
Method Moment (kN-m)
Reinforcement Area (sq-cm)
As+
SAFE 375 25.844
Calculated 375 25.844
,mins+A = 535.82 sq-m
EXAMPLE CSA A23.3-14 RC-BM-001 - 3

Software Verification PROGRAM NAME: SAFE REVISION NO.: 0
Table 2 Comparison of Shear Reinforcements
Shear Force (kN)
Reinforcement Area, s
Av
(sq-cm/m)
SAFE Calculated
187.5 12.573 12.573
COMPUTER FILE: CSA A23.3-14 RC-BM-001.FDB
CONCLUSION The SAFE results show an exact comparison with the independent results.
EXAMPLE CSA A23.3-14 RC-BM-001 - 4

Software Verification PROGRAM NAME: SAFE REVISION NO.: 0
HAND CALCULATION
Flexural Design The following quantities are computed for all the load combinations:
φc = 0.65 for concrete
φs = 0.85 for reinforcement
As,min = 0.2 c
y
ff
′ bw h = 357.2 sq-mm
α1 = 0.85 – 0.0015f'c ≥ 0.67 = 0.805
β1 = 0.97 – 0.0025f'c ≥ 0.67 = 0.895
cb = yf+700
700 d = 256.46 mm
ab = β1cb = 229.5366 mm
As = min[As,min, (4/3) As,required] = min[357.2, (4/3)2445] = 357.2 sq-mm
COMB100 P = (1.25Pd + 1.5Pt) =187.5kN
*
3PlM = = 375 kN-m
Mf = 375 kN-m
The depth of the compression block is given by:
( ) ( )1 min ,f c f w s bC f b b h aα ′= − = 724.5 kN
Therefore, sy
cfs f
CA
φφ
=1 and the portion of Mf that is resisted by the flange is given
by:
EXAMPLE CSA A23.3-14 RC-BM-001 - 5

Software Verification PROGRAM NAME: SAFEREVISION NO.: 0
sy
cfs f
CA
φφ
=1 = 1204.411 sq-mm
( )c
bsfff
ahdCM φ
−=
2,min = 176.596 kN-m
Therefore, the balance of the moment, Mf to be carried by the web is:
Mfw = Mf − Mff = 198.403 kN-m
The web is a rectangular section with dimensions bw and d, for which the design depth of the compression block is recalculated as:
wcc
fw
bfM
ddaφα '
2
1
21 −−= = 114.5745 mm
If a1 ≤ ab, the area of tension reinforcement is then given by:
−
=
21
2 adf
MA
ys
fws
φ = 1379.94 sq-mm
As = As1 + As2 = 2584.351 sq-mm
Shear Design
The basic shear strength for rectangular section is computed as,
φc = 0.65 for shear
{ . , for normal density concrete1 00λ =
vd is the effective shear depth. It is taken as the greater of 0.9d or 0.72h = 382.5 mm (governing) or 360 mm.
300 if minimum transverse reinforcement=zeS
( )ss
ffvfx AE
NVdM2
5.0++=ε and 003.0≤xε
EXAMPLE CSA A23.3-14 RC-BM-001 - 6

Software VerificationPROGRAM NAME: SAFE REVISION NO.: 0
( ) ( )0.40 1300
1 1500 1000β
ε= •
+ +x zeS = 0.07272
c c c w vV f b dφ λβ ′= = 29.708 kN
dbfV wccr '25.0max, φ= = 621.56 kN
θ = 50
( )vyts
cfv
dfVV
sA
φθtan−
= = 1.2573 mm2/mm = 12.573 cm2/m.
EXAMPLE CSA A23.3-14 RC-BM-001 - 7

Software Verification PROGRAM NAME: SAFE REVISION NO.: 0
EXAMPLE CSA A23.3-14 RC-PN-001 Slab Punching Shear Design
PROBLEM DESCRIPTION The purpose of this example is to verify slab punching shear design in SAFE
The numerical example is a flat slab that has three 8 m spans in each direction, as shown in Figure 1.
4
A
3
2
1
B C D
X
Y
0.3 m0.3 m8 m8 m8 m
0.6 m
0.6 m
0.25 m thick flat slab
LoadingDL = Self weight + 1.0 kN/m2
LL = 4.0 kN/m2
Columns are 0.3 m x 0.9 mwith long side parallel to the Y-axis, typical
Concrete PropertiesUnit weight = 24 kN/m3
f'c = 30 N/mm2
8 m
8 m
8 m
4
A
3
2
1
B C D
X
Y
0.3 m0.3 m8 m8 m8 m
0.6 m
0.6 m
0.25 m thick flat slab
LoadingDL = Self weight + 1.0 kN/m2
LL = 4.0 kN/m2
Columns are 0.3 m x 0.9 mwith long side parallel to the Y-axis, typical
Concrete PropertiesUnit weight = 24 kN/m3
f'c = 30 N/mm2
8 m
8 m
8 m
Figure 1: Flat Slab for Numerical Example The slab overhangs beyond the face of the column by 0.15 m along each side of the structure. The columns are typically 0.3 m x 0.9 m with the long side parallel to the Y-axis. The slab is typically 0.25 m thick. Thick plate properties are used for the slab. The concrete has a unit weight of 24 kN/m3 and a f ′c of 30 N/mm2. The dead load consists of the self weight of the structure plus an additional 1 kN/m2. The live load is 4 kN/m2.
EXAMPLE CSA A23.3-14 RC-PN-001 - 1

Software Verification PROGRAM NAME: SAFE REVISION NO.: 0
TECHNICAL FEATURES OF SAFE TESTED Calculation of punching shear capacity, shear stress and D/C ratio.
RESULTS COMPARISON Table 1 shows the comparison of the punching shear capacity, shear stress ratio and D/C ratio obtained from SAFE with the punching shear capacity, shear stress ratio and D/C ratio obtained by the analytical method. They match exactly for this problem.
Table 1 Comparison of Design Results for Punching Shear at Grid B-2
Method Shear Stress
(N/mm2) Shear Capacity
(N/mm2) D/C ratio
SAFE 1.792 1.127 1.59
Calculated 1.792 1.127 1.59
COMPUTER FILE: CSA A23.3-14 RC-PN-001.FDB
CONCLUSION The SAFE results show an exact comparison with the independent results.
EXAMPLE CSA A23.3-14 RC-PN-001 - 2

Software VerificationPROGRAM NAME: SAFE REVISION NO.: 0
HAND CALCULATION Hand Calculation For Interior Column Using SAFE Method
( ) ( )[ ]250 26 250 38 2 218 mm= − + − =d
Refer to Figure 2. b0 = 518+ 1118 + 1118 + 518 = 3272 mm
450
450
150 109
X
Y
1118
518
Side 2
Side
3
A B
CD
Column
Side
1
Side 4
Center of column is point (x1, y1). Set this equal to (0,0).
Critical section for punching shear shown dashed.
109 150
109
109
Note: All dimensions in millimeters
450
450
150 109
X
Y
1118
518
Side 2
Side
3
A B
CD
Column
Side
1
Side 4
Center of column is point (x1, y1). Set this equal to (0,0).
Critical section for punching shear shown dashed.
109 150
109
109
Note: All dimensions in millimeters
Figure 2: Interior Column, Grid B-2 in SAFE Model
211 0.495
2 111813 518
γ = − = +
V
311 0.312
2 51813 1118
γ = − = +
V
The coordinates of the center of the column (x1, y1) are taken as (0, 0).
EXAMPLE CSA A23.3-14 RC-PN-001 - 3
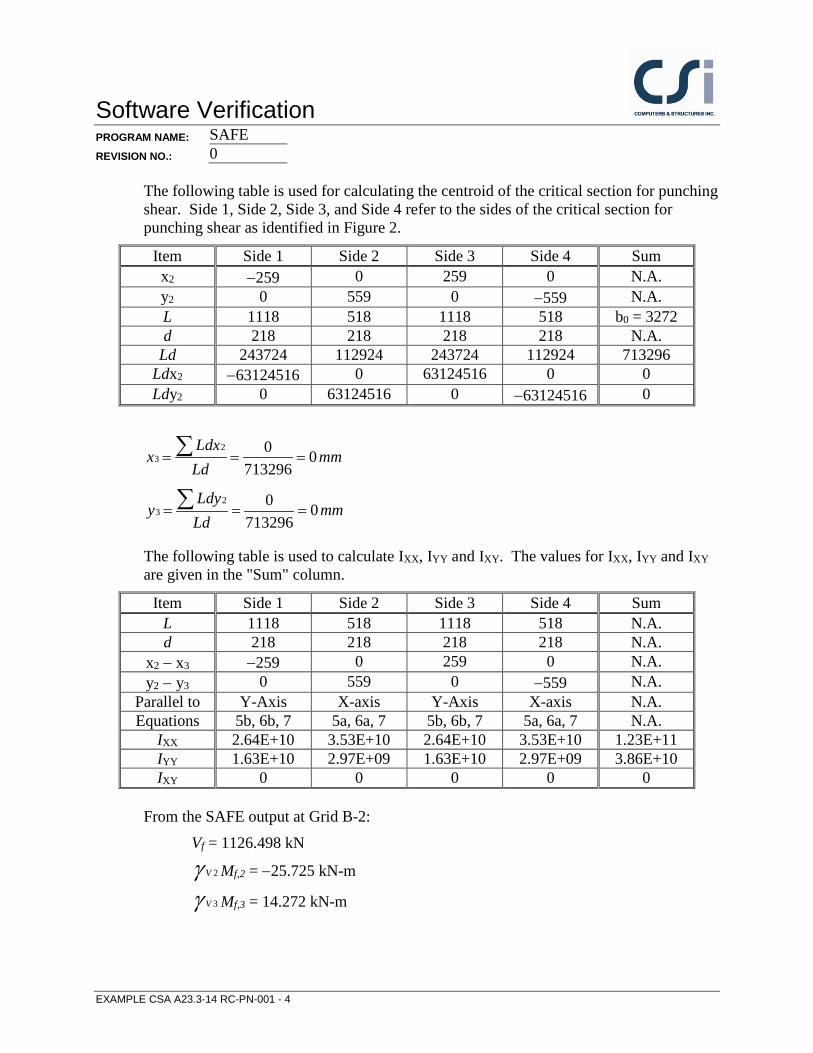
Software Verification PROGRAM NAME: SAFE REVISION NO.: 0
The following table is used for calculating the centroid of the critical section for punching shear. Side 1, Side 2, Side 3, and Side 4 refer to the sides of the critical section for punching shear as identified in Figure 2.
Item Side 1 Side 2 Side 3 Side 4 Sum x2 −259 0 259 0 N.A. y2 0 559 0 −559 N.A. L 1118 518 1118 518 b0 = 3272 d 218 218 218 218 N.A.
Ld 243724 112924 243724 112924 713296 Ldx2 −63124516 0 63124516 0 0 Ldy2 0 63124516 0 −63124516 0
23
0 0713296
Ldxx mm
Ld= = =∑
23
0 0713296
Ldyy mm
Ld= = =∑
The following table is used to calculate IXX, IYY and IXY. The values for IXX, IYY and IXY are given in the "Sum" column.
Item Side 1 Side 2 Side 3 Side 4 Sum L 1118 518 1118 518 N.A. d 218 218 218 218 N.A.
x2 − x3 −259 0 259 0 N.A. y2 − y3 0 559 0 −559 N.A.
Parallel to Y-Axis X-axis Y-Axis X-axis N.A. Equations 5b, 6b, 7 5a, 6a, 7 5b, 6b, 7 5a, 6a, 7 N.A.
IXX 2.64E+10 3.53E+10 2.64E+10 3.53E+10 1.23E+11 IYY 1.63E+10 2.97E+09 1.63E+10 2.97E+09 3.86E+10 IXY 0 0 0 0 0
From the SAFE output at Grid B-2:
Vf = 1126.498 kN
2Vγ Mf,2 = −25.725 kN-m
3Vγ Mf,3 = 14.272 kN-m
EXAMPLE CSA A23.3-14 RC-PN-001 - 4

Software Verification PROGRAM NAME: SAFE REVISION NO.: 0
At the point labeled A in Figure 2, x4 = −259 and y4 = 559, thus: 3 6 10
11 10 2
6 11
11 10 2
1126.498 10 25.725 10 [3.86 10 (559 0) (0)( 259 0)]3272 218 (1.23 10 )(3.86 10 ) (0)
14.272 10 [1.23 10 ( 259 0) (0)(559 0)](1.23 10 )(3.86 10 ) (0)
fv • • • − − − −= − +
• • • −
• • − − − −• • −
vf = 1.5793 − 0.1169 − 0.0958 = 1.3666 N/mm2 at point A At the point labeled B in Figure 2, x4 = 259 and y4 = 559, thus:
3 6 10
11 10 2
6 11
11 10 2
1126.498 10 25.725 10 [3.86 10 (559 0) (0)(259 0)]3272 218 (1.23 10 )(3.86 10 ) (0)
14.272 10 [1.23 10 (259 0) (0)(559 0)](1.23 10 )(3.86 10 ) (0)
fv • • • − − −= − +
• • • −
• • − − −• • −
vf = 1.5793 − 0.1169 + 0.0958 =1.5582 N/mm2 at point B
At the point labeled C in Figure 2, x4 = 259 and y4 = −559, thus: 3 6 10
11 10 2
6 11
11 10 2
1126.498 10 25.725 10 [3.86 10 ( 559 0) (0)(259 0)]3272 218 (1.23 10 )(3.86 10 ) (0)
14.272 10 [1.23 10 (259 0) (0)( 559 0)](1.23 10 )(3.86 10 ) (0)
fv • • • − − − −= − +
• • • −
• • − − − −• • −
vf = 1.5793 + 0.1169 + 0.0958 = 1.792 N/mm2 at point C
At the point labeled D in Figure 2, x4 = −259 and y4 = −559, thus: 3 6 10
11 10 2
6 11
11 10 2
1126.498 10 25.725 10 [3.86 10 ( 559 0) (0)( 259 0)]3272 218 (1.23 10 )(3.86 10 ) (0)
14.272 10 [1.23 10 ( 259 0) (0)( 559 0)](1.23 10 )(3.86 10 ) (0)
fv • • • − − − − −= − +
• • • −
• • − − − − −• • −
vf = 1.5793 + 0.1169 − 0.0958 = 1.6004 N/mm2 at point D Point C has the largest absolute value of vu, thus vmax = 1.792 N/mm2
EXAMPLE CSA A23.3-14 RC-PN-001 - 5

Software Verification PROGRAM NAME: SAFEREVISION NO.: 0
The shear capacity is calculated based on the minimum of the following three limits:
0
21 0.19
min 0.19
0.38
φ λβ
αφ λ
φ λ
′+
′= +
′
c cc
sv c c
c c
f
dv fb
f
1.127 N/mm2 in accordance with CSA 13.3.4.1
CSA 13.3.4.1 yields the smallest value of vv = 1.127 N/mm2 , and thus this is the shear capacity.
1.792Shear Ratio 1.591.127ϕ
= = =U
v
vv
EXAMPLE CSA A23.3-14 RC-PN-001 - 6

Software Verification PROGRAM NAME: SAFE REVISION NO.: 0
EXAMPLE CSA A23.3-14 RC-SL-001 Slab Flexural Design
PROBLEM DESCRIPTION The purpose of this example is to verify slab flexural design in SAFE.
A one-way, simple-span slab supported by walls on two opposite edges is modeled using SAFE. The slab is 150 mm thick and spans 4 meters between walls. The walls are modeled as pin supports. The computational model uses a finite element mesh, automatically generated by SAFE. The maximum element size is specified as 0.25 meters. To obtain factored moments and flexural reinforcement in a design strip, one one-meter wide strip is defined in the X-direction on the slab, as shown in Figure 1.
Figure 1 Plan View of One-Way Slab
One dead load case (DL4KPa) and one live load case (LL5KPa) with uniformly distributed surface loads of magnitudes 4 and 5 kN/m2, respectively, are defined in the model. A load combination (COMB5kPa) is defined using the CSA A23.3-14 load combination factors, 1.25 for dead loads and 1.5 for live loads. The model is analyzed for these load cases and load combinations.
The slab moment on a strip of unit width is computed analytically. The total factored strip moments are compared with the SAFE results. After completing the analysis, design is performed using the CSA A23.3-14 code by SAFE and also by hand computation. Table 1 show the comparison of the design reinforcements computed using the two methods.
EXAMPLE CSA A23.3-14 RC-SL-001 - 1

Software Verification PROGRAM NAME: SAFE REVISION NO.: 0 GEOMETRY, PROPERTIES AND LOADING
Thickness T, h = 150 mm Depth of tensile reinf. dc = 25 mm Effective depth d = 125 mm Clear span ln, l1 = 4000 mm Concrete strength fc = 30 MPa Yield strength of steel fsy = 460 MPa Concrete unit weight wc = 0 N/m3 Modulus of elasticity Ec = 25000 MPa Modulus of elasticity Es = 2x10⁶ MPa Poisson’s ratio ν = 0 Dead load wd = 4.0 kPa Live load wl = 5.0 kPa
TECHNICAL FEATURES OF SAFE TESTED Calculation of flexural reinforcement Application of minimum flexural reinforcement
RESULTS COMPARISON Table 1 shows the comparison of the SAFE total factored moments in the design strip the moments obtained by the hand computation method. Table 1 also shows the comparison of the design reinforcements.
Table 1 Comparison of Design Moments and Reinforcements
Load Level Method
Strip Moment (kN-m)
Reinforcement Area (sq-cm)
As+
Medium SAFE 25.00 5.414
Calculated 25.00 5.528
,minA s+ = 357.2 sq-mm
EXAMPLE CSA A23.3-14 RC-SL-001 - 2

Software VerificationPROGRAM NAME: SAFE REVISION NO.: 0
COMPUTER FILE: CSA A23.3-14 RC-SL-001.FDB
CONCLUSION The SAFE results show a very close comparison with the independent results.
EXAMPLE CSA A23.3-14 RC-SL-001 - 3

Software Verification PROGRAM NAME: SAFE REVISION NO.: 0
HAND CALCULATION The following quantities are computed for the load combination:
φc = 0.65 for concrete
φs = 0.85 for reinforcement
As,min = 0.2 c
y
ff
′ bw h = 357.2 sq-mm
b = 1000 mm
α1 = 0.85 – 0.0015f'c ≥ 0.67 = 0.805
β1 = 0.97 – 0.0025f'c ≥ 0.67 = 0.895
cb = yf+700
700 d = 75.43 mm
ab = β1cb = 67.5 mm For the load combination, w and M* are calculated as follows:
w = (1.25wd + 1.5wt) b
8
21wlMu =
As = min[As,min, (4/3) As,required] = min[357.2, (4/3)540.63] = 357.2 sq-mm = 0.22•(150/125)2•0.6•SQRT(30)/460•100•125 = 282.9 sq-mm
COMB100 wd = 4.0 kPa wt = 5.0 kPa w = 12.5 kN/m Mf-strip = 25.0 kN-m Mf-design = 25.529 kN-m
The depth of the compression block is given by:
EXAMPLE CSA A23.3-14 RC-SL-001 - 4

Software Verification PROGRAM NAME: SAFE REVISION NO.: 0
bfM
ddacc
f
φα '2
1
2 −−= = 13.769 mm < amax
The area of tensile steel reinforcement is then given by:
−
=
2adf
MA
ys
fs
φ = 552.77 sq-mm > As,min
As = 5.528 sq-cm
EXAMPLE CSA A23.3-14 RC-SL-001 - 5

Software VerificationPROGRAM NAME: SAFE REVISION NO.: 0
EXAMPLE CSA A23.3-04 RC-PN-001 Slab Punching Shear Design
PROBLEM DESCRIPTION The purpose of this example is to verify slab punching shear design in SAFE
The numerical example is a flat slab that has three 8 m spans in each direction, as shown in Figure 1.
4
A
3
2
1
B C D
X
Y
0.3 m0.3 m8 m8 m8 m
0.6 m
0.6 m
0.25 m thick flat slab
LoadingDL = Self weight + 1.0 kN/m2
LL = 4.0 kN/m2
Columns are 0.3 m x 0.9 mwith long side parallel to the Y-axis, typical
Concrete PropertiesUnit weight = 24 kN/m3
f'c = 30 N/mm2
8 m
8 m
8 m
4
A
3
2
1
B C D
X
Y
0.3 m0.3 m8 m8 m8 m
0.6 m
0.6 m
0.25 m thick flat slab
LoadingDL = Self weight + 1.0 kN/m2
LL = 4.0 kN/m2
Columns are 0.3 m x 0.9 mwith long side parallel to the Y-axis, typical
Concrete PropertiesUnit weight = 24 kN/m3
f'c = 30 N/mm2
8 m
8 m
8 m
Figure 1: Flat Slab for Numerical Example
The slab overhangs beyond the face of the column by 0.15 m along each side of the structure. The columns are typically 0.3 m x 0.9 m with the long side parallel to the Y-axis. The slab is typically 0.25 m thick. Thick plate properties are used for the slab.
The concrete has a unit weight of 24 kN/m3 and a f ′c of 30 N/mm2. The dead load consists of the self weight of the structure plus an additional 1 kN/m2. The live load is 4 kN/m2.
EXAMPLE CSA A23.3-04 RC-PN-001 - 1

Software Verification PROGRAM NAME: SAFE REVISION NO.: 0
TECHNICAL FEATURES OF SAFE TESTED Calculation of punching shear capacity, shear stress and D/C ratio.
RESULTS COMPARISON Table 1 shows the comparison of the punching shear capacity, shear stress ratio and D/C ratio obtained from SAFE with the punching shear capacity, shear stress ratio and D/C ratio obtained by the analytical method. They match exactly for this problem.
Table 1 Comparison of Design Results for Punching Shear at Grid B-2
Method Shear Stress
(N/mm2) Shear Capacity
(N/mm2) D/C ratio
SAFE 1.792 1.127 1.59
Calculated 1.792 1.127 1.59
COMPUTER FILE: CSA A23.3-04 RC-PN-001.FDB
CONCLUSION The SAFE results show an exact comparison with the independent results.
EXAMPLE CSA A23.3-04 RC-PN-001 - 2

Software VerificationPROGRAM NAME: SAFE REVISION NO.: 0
HAND CALCULATION Hand Calculation For Interior Column Using SAFE Method
( ) ( )[ ]250 26 250 38 2 218 mm= − + − =d
Refer to Figure 2. b0 = 518+ 1118 + 1118 + 518 = 3272 mm
450
450
150 109
X
Y
1118
518
Side 2
Side
3
A B
CD
Column
Side
1
Side 4
Center of column is point (x1, y1). Set this equal to (0,0).
Critical section for punching shear shown dashed.
109 150
109
109
Note: All dimensions in millimeters
450
450
150 109
X
Y
1118
518
Side 2
Side
3
A B
CD
Column
Side
1
Side 4
Center of column is point (x1, y1). Set this equal to (0,0).
Critical section for punching shear shown dashed.
109 150
109
109
Note: All dimensions in millimeters
Figure 2: Interior Column, Grid B-2 in SAFE Model
211 0.495
2 111813 518
γ = − = +
V
311 0.312
2 51813 1118
γ = − = +
V
The coordinates of the center of the column (x1, y1) are taken as (0, 0).
EXAMPLE CSA A23.3-04 RC-PN-001 - 3

Software Verification PROGRAM NAME: SAFE REVISION NO.: 0
The following table is used for calculating the centroid of the critical section for punching shear. Side 1, Side 2, Side 3, and Side 4 refer to the sides of the critical section for punching shear as identified in Figure 2.
Item Side 1 Side 2 Side 3 Side 4 Sum x2 −259 0 259 0 N.A. y2 0 559 0 −559 N.A. L 1118 518 1118 518 b0 = 3272 d 218 218 218 218 N.A.
Ld 243724 112924 243724 112924 713296 Ldx2 −63124516 0 63124516 0 0 Ldy2 0 63124516 0 −63124516 0
23
0 0713296
Ldxx mm
Ld= = =∑
23
0 0713296
Ldyy mm
Ld= = =∑
The following table is used to calculate IXX, IYY and IXY. The values for IXX, IYY and IXY are given in the "Sum" column.
Item Side 1 Side 2 Side 3 Side 4 Sum L 1118 518 1118 518 N.A. d 218 218 218 218 N.A.
x2 − x3 −259 0 259 0 N.A. y2 − y3 0 559 0 −559 N.A.
Parallel to Y-Axis X-axis Y-Axis X-axis N.A. Equations 5b, 6b, 7 5a, 6a, 7 5b, 6b, 7 5a, 6a, 7 N.A.
IXX 2.64E+10 3.53E+10 2.64E+10 3.53E+10 1.23E+11 IYY 1.63E+10 2.97E+09 1.63E+10 2.97E+09 3.86E+10 IXY 0 0 0 0 0
From the SAFE output at Grid B-2:
Vf = 1126.498 kN
2Vγ Mf,2 = −25.725 kN-m
3Vγ Mf,3 = 14.272 kN-m
EXAMPLE CSA A23.3-04 RC-PN-001 - 4

Software VerificationPROGRAM NAME: SAFE REVISION NO.: 0
At the point labeled A in Figure 2, x4 = −259 and y4 = 559, thus: 3 6 10
11 10 2
6 11
11 10 2
1126.498 10 25.725 10 [3.86 10 (559 0) (0)( 259 0)]3272 218 (1.23 10 )(3.86 10 ) (0)
14.272 10 [1.23 10 ( 259 0) (0)(559 0)](1.23 10 )(3.86 10 ) (0)
fv • • • − − − −= − +
• • • −
• • − − − −• • −
vf = 1.5793 − 0.1169 − 0.0958 = 1.3666 N/mm2 at point A
At the point labeled B in Figure 2, x4 = 259 and y4 = 559, thus: 3 6 10
11 10 2
6 11
11 10 2
1126.498 10 25.725 10 [3.86 10 (559 0) (0)(259 0)]3272 218 (1.23 10 )(3.86 10 ) (0)
14.272 10 [1.23 10 (259 0) (0)(559 0)](1.23 10 )(3.86 10 ) (0)
fv • • • − − −= − +
• • • −
• • − − −• • −
vf = 1.5793 − 0.1169 + 0.0958 =1.5582 N/mm2 at point B
At the point labeled C in Figure 2, x4 = 259 and y4 = −559, thus: 3 6 10
11 10 2
6 11
11 10 2
1126.498 10 25.725 10 [3.86 10 ( 559 0) (0)(259 0)]3272 218 (1.23 10 )(3.86 10 ) (0)
14.272 10 [1.23 10 (259 0) (0)( 559 0)](1.23 10 )(3.86 10 ) (0)
fv • • • − − − −= − +
• • • −
• • − − − −• • −
vf = 1.5793 + 0.1169 + 0.0958 = 1.792 N/mm2 at point C
At the point labeled D in Figure 2, x4 = −259 and y4 = −559, thus: 3 6 10
11 10 2
6 11
11 10 2
1126.498 10 25.725 10 [3.86 10 ( 559 0) (0)( 259 0)]3272 218 (1.23 10 )(3.86 10 ) (0)
14.272 10 [1.23 10 ( 259 0) (0)( 559 0)](1.23 10 )(3.86 10 ) (0)
fv • • • − − − − −= − +
• • • −
• • − − − − −• • −
vf = 1.5793 + 0.1169 − 0.0958 = 1.6004 N/mm2 at point D
Point C has the largest absolute value of vu, thus vmax = 1.792 N/mm2
EXAMPLE CSA A23.3-04 RC-PN-001 - 5

Software Verification PROGRAM NAME: SAFE REVISION NO.: 0 The shear capacity is calculated based on the minimum of the following three limits:
0
21 0.19
min 0.19
0.38
φ λβ
αφ λ
φ λ
′+
′= +
′
c cc
sv c c
c c
f
dv fb
f
1.127 N/mm2 in accordance with CSA 13.3.4.1
CSA 13.3.4.1 yields the smallest value of vv = 1.127 N/mm2 , and thus this is the shear capacity.
1.792Shear Ratio 1.591.127ϕ
= = =U
v
vv
EXAMPLE CSA A23.3-04 RC-PN-001 - 6

Software Verification PROGRAM NAME: SAFE REVISION NO.: 0
EXAMPLE CSA 23.3-04 PT-SL-001 Post-Tensioned Slab Design
PROBLEM DESCRIPTION The purpose of this example is to verify the slab stresses and the required area of mild steel strength reinforcing for a post-tensioned slab.
A one-way simply supported slab is modeled in SAFE. The modeled slab is 254 mm thick by 914 mm wide and spans 9754 mm as shown in shown in Figure 1.
Length, L = 9754 mm
Elevation Section
Prestressing tendon, Ap
Mild Steel, As
914 mm25 mm
229 mm
254 mm
Length, L = 9754 mm
Elevation Section
Prestressing tendon, Ap
Mild Steel, As
914 mm25 mm
229 mm
254 mm
Figure 1 One-Way Slab
EXAMPLE CSA 23.3-04 PT-SL-001 - 1

Software Verification PROGRAM NAME: SAFEREVISION NO.: 0
A 254-mm-wide design strip is centered along the length of the slab and has been defined as an A-Strip. B-strips have been placed at each end of the span perpendicular to Strip-A (the B-Strips are necessary to define the tendon profile). A tendon with two strands, each having an area of 99 mm2, has been added to the A-Strip. The self weight and live loads were added to the slab. The loads and post-tensioning forces are as follows:
Loads: Dead = self weight, Live = 4.788 KN/m2
The total factored strip moments, required area of mild steel reinforcement, and slab stresses are reported at the midspan of the slab. Independent hand calculations have been compared with the SAFE results and summarized for verification and validation of the SAFE results.
GEOMETRY, PROPERTIES AND LOADING Thickness T, h = 254 mm Effective depth d = 229 mm Clear span L = 9754 mm
Concrete strength f 'c = 30 MPa Yield strength of steel fy = 400 MPa Prestressing, ultimate fpu = 1862 MPa Prestressing, effective fe = 1210 MPa Area of Prestress (single strand) Ap = 198 mm2 Concrete unit weight wc = 23.56 KN/m3 Modulus of elasticity Ec = 25000 N/mm3 Modulus of elasticity Es = 200,000 N/mm3 Poisson’s ratio ν = 0
Dead load wd = self KN/m2 Live load wl = 4.788 KN/m2
TECHNICAL FEATURES OF SAFE TESTED Calculation of the required flexural reinforcement Check of slab stresses due to the application of dead, live, and post-tensioning
loads.
EXAMPLE CSA 23.3-04 PT-SL-001 - 2

Software Verification PROGRAM NAME: SAFE REVISION NO.: 0
RESULTS COMPARISON Table 1 shows the comparison of the SAFE total factored moments, required mild steel reinforcing, and slab stresses with the independent hand calculations.
Table 1 Comparison of Results
FEATURE TESTED INDEPENDENT RESULTS
SAFE RESULTS DIFFERENCE
Factored moment, Mu (Ultimate) (kN-m)
159.4 159.4 0.00%
Area of Mild Steel req’d, As (sq-cm) 16.25 16.32 0.43%
Transfer Conc. Stress, top (D+PTI), MPa −5.058 −5.057 0.02%
Transfer Conc. Stress, bot (D+PTI), MPa 2.839 2.839 0.00%
Normal Conc. Stress, top (D+L+PTF), MPa −10.460 −10.465 0.05%
Normal Conc. Stress, bot (D+L+PTF), MPa 8.402 8.407 0.06%
Long-Term Conc. Stress, top (D+0.5L+PTF(L)), MPa −7.817 −7.817 0.00%
Long-Term Conc. Stress, bot (D+0.5L+PTF(L)), MPa 5.759 5.759 0.00%
COMPUTER FILE: CSA A23.3-04 PT-SL-001.FDB
CONCLUSION The SAFE results show an exact comparison with the independent results.
EXAMPLE CSA 23.3-04 PT-SL-001 - 3

Software Verification PROGRAM NAME: SAFE REVISION NO.: 0
HAND CALCULATIONS:
Design Parameters:
Mild Steel Reinforcing Post-Tensioning
fcu = 30MPa fpu = 1862 MPa fy = 400MPa fpy = 1675 MPa Stressing Loss = 186 MPa Long-Term Loss = 94 MPa fi = 1490 MPa fe = 1210 MPa
0 65c .φ = , 0 85S .φ =
α1 = 0.85 – 0.0015f'c ≥ 0.67 = 0.805
β1 = 0.97 – 0.0025f'c ≥ 0.67 = 0.895
Length, L = 9754 mm
Elevation Section
Prestressing tendon, Ap
Mild Steel, As
914 mm25 mm
229 mm
254 mm
Length, L = 9754 mm
Elevation Section
Prestressing tendon, Ap
Mild Steel, As
914 mm25 mm
229 mm
254 mm
Loads:
Dead, self-wt = 0.254 m x 23.56 kN/m3 = 5.984 kN/m2 (D) x 1.25 = 7.480 kN/m2 (Du) Live, = 4.788 kN/m2 (L) x 1.50 = 7.182 kN/m2 (Lu) Total = 10.772 kN/m2 (D+L) = 14.662 kN/m2 (D+L)ult ω =10.772 kN/m2 x 0.914m = 9.846 kN/m, uω = 16.039 kN/m2 x 0.914m = 13.401 kN/m
Ultimate Moment, 2
1
8UwlM = = 13.401 x (9.754)2/8 = 159.42 kN-m
EXAMPLE CSA 23.3-04 PT-SL-001 - 4

Software VerificationPROGRAM NAME: SAFE REVISION NO.: 0
Ultimate Stress in strand, ( )8000pb pe p y
o
f f d cl
= + −
( )( ) ( )( )( )( )( )( )1 1
0.9 197 1347 0.85 1625 400 61.66 mm' 0.805 0.65 30.0 0.895 914
φ φα φ β
+ += = =p p pr s s y
yc c
A f A fc
f b
( )80001210 229 61.66 1347 MPa9754pbf = + − =
Depth of the compression block, a, is given as:
Stress block depth, α φ
= − −*
2
1 c c
2Ma d df ' b
( )( )( )( )
2 2 159.420.229 0.229 55.180.805 30000 0.65 0.914
= − − =
Ultimate force in PT, ( ), ( ) 197 1347 1000 265.9 kN= = =ult PT P PSF A f
Ultimate moment due to PT,
( ), ,55.18265.9 0.229 0.85 45.52 kN-m
2 2φ = − = − =
ult PT ult PTaM F d
Net Moment to be resisted by As, NET U PTM M M= −= − =159.42 45.52 113.90 kN-m
The area of tensile steel reinforcement is then given by:
0.87NET
sy
MAf z
= = ( )
( ) 2113.90 1 6 1625 mm55.180.87 400 229
2
e = −
Check of Concrete Stresses at Midspan:
Initial Condition (Transfer), load combination (D+PTi) = 1.0D+0.0L+1.0PTI
Tendon stress at transfer = jacking stress − stressing losses = 1490 − 186 = 1304 MPa The force in the tendon at transfer, = ( )1304 197.4 1000 257.4 kN=
EXAMPLE CSA 23.3-04 PT-SL-001 - 5

Software Verification PROGRAM NAME: SAFE REVISION NO.: 0 Moment due to dead load, ( )( )25.984 0.914 9.754 8 65.04 kN-m= =DM Moment due to PT, ( )(sag) 257.4 102 mm 1000 26.25 kN-m= = =PT PTIM F
Stress in concrete, 257.4 65.04 26.230.254(0.914) 0.00983
PTI D PTF M MfA S
− − −= ± = ±
where S = 0.00983m3
1.109 3.948 MPaf = − ± 5.058(Comp) max, 2.839(Tension) maxf = − Normal Condition, load combinations: (D+L+PTF) = 1.0D+1.0L+1.0PTF Tendon stress at normal = jacking − stressing − long-term = 1490 − 186 − 94 = 1210 MPa The force in tendon at normal, = ( )1210 197.4 1000 238.9 kN=
Moment due to dead load, ( )( )25.984 0.914 9.754 8 65.04 kN-m= =DM
Moment due to live load, ( )( )24.788 0.914 9.754 8 52.04 kN-m= =LM Moment due to PT, ( )(sag) 238.9 102 mm 1000 24.37 kN-m= = =PT PTIM F Stress in concrete for (D+L+PTF),
( )
238.8 117.08 24.370.254 0.914 0.00983
+ − − −= ± = ±PTI D L PTF M Mf
A S
1 029 9 431f . .= − ± 10.460(Comp) max, 8.402(Tension) maxf = − Long-Term Condition, load combinations: (D+0.5L+PTF(L)) = 1.0D+0.5L+1.0PTF Tendon stress at normal = jacking − stressing − long-term = 1490 − 186 − 94 = 1210 MPa The force in tendon at normal, = ( )1210 197.4 1000 238.9 kN=
Moment due to dead load, ( )( )25.984 0.914 9.754 8 65.04 kN-m= =DM
Moment due to live load, ( )( )24.788 0.914 9.754 8 52.04 kN-m= =LM Moment due to PT, ( )(sag) 238.9 102 mm 1000 24.37 kN-m= = =PT PTIM F Stress in concrete for (D+0.5L+PTF(L)),
( )
0.5 238.9 91.06 24.330.254 0.914 0.00983
+ − − −= ± = ±D L PTPTI M MFf
A S
1 029 6 788f . .= − ± 7.817(Comp) max, 5.759(Tension) maxf = −
EXAMPLE CSA 23.3-04 PT-SL-001 - 6

Software Verification PROGRAM NAME: SAFE REVISION NO.: 0
EXAMPLE CSA A23.3-04 RC-BM-001 Flexural and Shear Beam Design
PROBLEM DESCRIPTION The purpose of this example is to verify slab flexural design in SAFE. The load level is adjusted for the case corresponding to the following conditions:
The stress-block extends below the flange but remains within the balanced condition permitted by CSA A23.3-04.
The average shear stress in the beam is below the maximum shear stress allowed by CSA A23.3-04, requiring design shear reinforcement.
A simple-span, 6-m-long, 300-mm-wide, and 500-mm-deep T-beam with a flange 100 mm thick and 600 mm wide is modeled using SAFE. The beam is shown in Figure 1. The computational model uses a finite element mesh of frame elements, automatically generated by SAFE. The maximum element size has been specified to be 200 mm. The beam is supported by columns without rotational stiffnesses and with very large vertical stiffness (1 × 10²⁰ kN/m).
The beam is loaded with symmetric third-point loading. One dead load case (DL30) and one live load case (LL100) with only symmetric third-point loads of magnitudes 30, and 100 kN, respectively, are defined in the model. One load combinations (COMB100) is defined using the CSA A23.3-04 load combination factors of 1.25 for dead loads and 1.5 for live loads. The model is analyzed for both of these load cases and the load combinations.
The beam moment and shear force are computed analytically. The total factored moment and shear force are compared with the SAFE results. These moment and shear force are identical. After completing the analysis, design is performed using the CSA A23.3-04 code in SAFE and also by hand computation. Table 1 shows the comparison of the design longitudinal reinforcements. Table 2 shows the comparison of the design shear reinforcements.
EXAMPLE CSA A23.3-04 RC-BM-001 - 1

Software Verification PROGRAM NAME: SAFEREVISION NO.: 0
Beam Section
75 mm 100 mm
300 mm
600 mm
75 mm
500 mm
Shear Force
Bending Moment
2000 mm 2000 mm 2000 mm
Beam Section
75 mm 100 mm
300 mm
600 mm
75 mm
500 mm
Shear Force
Bending Moment
2000 mm 2000 mm 2000 mm
Figure 1 The Model Beam for Flexural and Shear Design
EXAMPLE CSA A23.3-04 RC-BM-001 - 2

Software Verification PROGRAM NAME: SAFE REVISION NO.: 0
GEOMETRY, PROPERTIES AND LOADING Clear span, l = 6000 mm Overall depth, h = 500 mm Flange thickness, ds = 100 mm Width of web, bw = 300 mm Width of flange, bf = 600 mm Depth of tensile reinf., dc = 75 mm Effective depth, d = 425 mm Depth of comp. reinf., d' = 75 mm Concrete strength, f'
c = 30 MPa Yield strength of steel, fy = 460 MPa Concrete unit weight, wc = 0 kN/m3 Modulus of elasticity, Ec = 25x105 MPa Modulus of elasticity, Es = 2x10⁸ MPa Poisson’s ratio, v = 0.2 Dead load, Pd = 30 kN Live load, Pl = 100 kN
TECHNICAL FEATURES OF SAFE TESTED Calculation of flexural and shear reinforcement Application of minimum flexural and shear reinforcement
RESULTS COMPARISON Table 1 shows the comparison of the SAFE total factored moments in the design strip with the moments obtained by the analytical method. They match exactly for this problem. Table 1 also shows the design reinforcement comparison.
Table 1 Comparison of Moments and Flexural Reinforcements
Method Moment (kN-m)
Reinforcement Area (sq-cm)
As+
SAFE 375 25.844
Calculated 375 25.844
,mins+A = 535.82 sq-m
EXAMPLE CSA A23.3-04 RC-BM-001 - 3

Software Verification PROGRAM NAME: SAFE REVISION NO.: 0
Table 2 Comparison of Shear Reinforcements
Shear Force (kN)
Reinforcement Area, s
Av
(sq-cm/m)
SAFE Calculated
187.5 12.573 12.573
COMPUTER FILE: CSA A23.3-04 RC-BM-001.FDB
CONCLUSION The SAFE results show an exact comparison with the independent results.
EXAMPLE CSA A23.3-04 RC-BM-001 - 4

Software VerificationPROGRAM NAME: SAFE REVISION NO.: 0
HAND CALCULATION
Flexural Design The following quantities are computed for all the load combinations:
φc = 0.65 for concrete
φs = 0.85 for reinforcement
As,min = 0.2 c
y
ff
′ bw h = 357.2 sq-mm
α1 = 0.85 – 0.0015f'c ≥ 0.67 = 0.805
β1 = 0.97 – 0.0025f'c ≥ 0.67 = 0.895
cb = yf+700
700 d = 256.46 mm
ab = β1cb = 229.5366 mm
As = min[As,min, (4/3) As,required] = min[357.2, (4/3)2445] = 357.2 sq-mm
COMB100 P = (1.25Pd + 1.5Pt) =187.5kN
*
3PlM = = 375 kN-m
Mf = 375 kN-m
The depth of the compression block is given by:
( ) ( )1 min ,f c f w s bC f b b h aα ′= − = 724.5 kN
Therefore, sy
cfs f
CA
φφ
=1 and the portion of Mf that is resisted by the flange is given
by:
EXAMPLE CSA A23.3-04 RC-BM-001 - 5
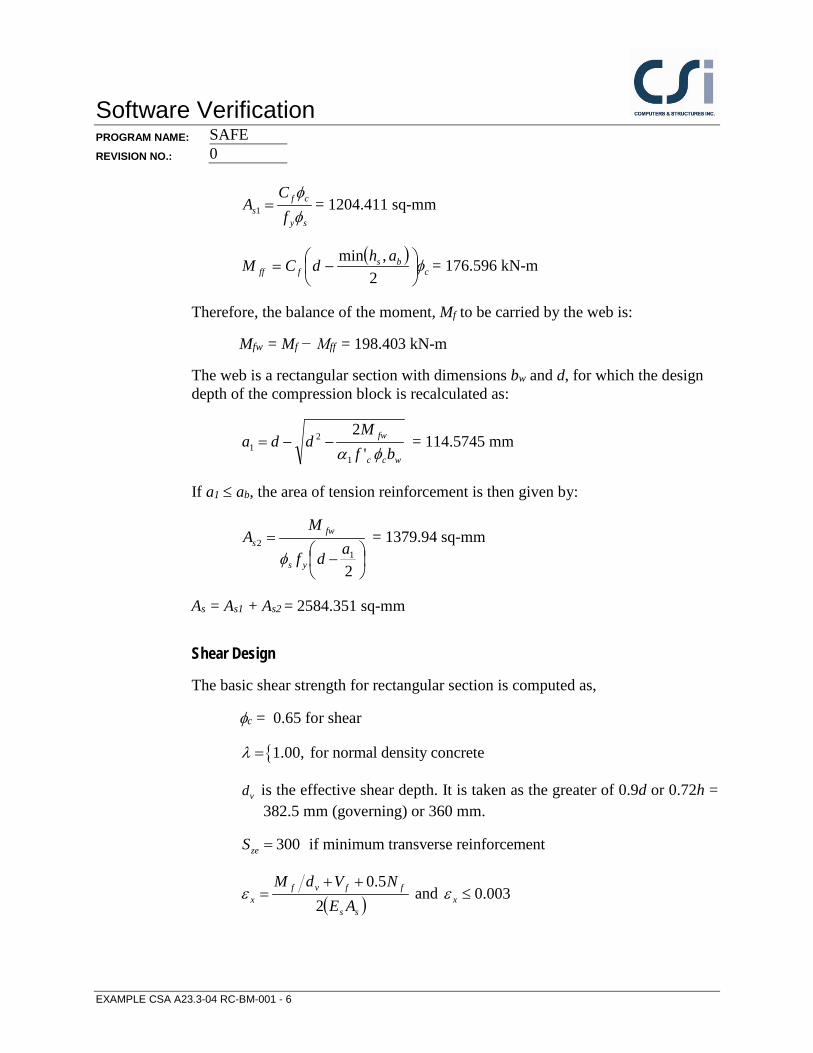
Software Verification PROGRAM NAME: SAFE REVISION NO.: 0
sy
cfs f
CA
φφ
=1 = 1204.411 sq-mm
( )c
bsfff
ahdCM φ
−=
2,min = 176.596 kN-m
Therefore, the balance of the moment, Mf to be carried by the web is:
Mfw = Mf − Mff = 198.403 kN-m
The web is a rectangular section with dimensions bw and d, for which the design depth of the compression block is recalculated as:
wcc
fw
bfM
ddaφα '
2
1
21 −−= = 114.5745 mm
If a1 ≤ ab, the area of tension reinforcement is then given by:
−
=
21
2 adf
MA
ys
fws
φ = 1379.94 sq-mm
As = As1 + As2 = 2584.351 sq-mm
Shear Design
The basic shear strength for rectangular section is computed as,
φc = 0.65 for shear
{ . , for normal density concrete1 00λ =
vd is the effective shear depth. It is taken as the greater of 0.9d or 0.72h = 382.5 mm (governing) or 360 mm.
300 if minimum transverse reinforcement=zeS
( )ss
ffvfx AE
NVdM2
5.0++=ε and 003.0≤xε
EXAMPLE CSA A23.3-04 RC-BM-001 - 6

Software Verification PROGRAM NAME: SAFE REVISION NO.: 0
( ) ( )0.40 1300
1 1500 1000β
ε= •
+ +x zeS = 0.07272
c c c w vV f b dφ λβ ′= = 29.708 kN
dbfV wccr '25.0max, φ= = 621.56 kN
θ = 50
( )vyts
cfv
dfVV
sA
φθtan−
= = 1.2573 mm2/mm = 12.573 cm2/m.
EXAMPLE CSA A23.3-04 RC-BM-001 - 7

Software VerificationPROGRAM NAME: SAFE REVISION NO.: 0
EXAMPLE CSA A23.3-04 RC-SL-001 Slab Flexural Design
PROBLEM DESCRIPTION The purpose of this example is to verify slab flexural design in SAFE.
A one-way, simple-span slab supported by walls on two opposite edges is modeled using SAFE. The slab is 150 mm thick and spans 4 meters between walls. The walls are modeled as pin supports. The computational model uses a finite element mesh, automatically generated by SAFE. The maximum element size is specified as 0.25 meters. To obtain factored moments and flexural reinforcement in a design strip, one one-meter wide strip is defined in the X-direction on the slab, as shown in Figure 1.
Figure 1 Plan View of One-Way Slab
One dead load case (DL4KPa) and one live load case (LL5KPa) with uniformly distributed surface loads of magnitudes 4 and 5 kN/m2, respectively, are defined in the model. A load combination (COMB5kPa) is defined using the CSA A23.3-04 load combination factors, 1.25 for dead loads and 1.5 for live loads. The model is analyzed for these load cases and load combinations.
The slab moment on a strip of unit width is computed analytically. The total factored strip moments are compared with the SAFE results. After completing the analysis, design is performed using the CSA A23.3-04 code by SAFE and also by hand computation. Table 1 show the comparison of the design reinforcements computed using the two methods.
EXAMPLE CSA A23.3-04 RC-SL-001 - 1

Software Verification PROGRAM NAME: SAFE REVISION NO.: 0 GEOMETRY, PROPERTIES AND LOADING
Thickness T, h = 150 mm Depth of tensile reinf. dc = 25 mm Effective depth d = 125 mm Clear span ln, l1 = 4000 mm Concrete strength fc = 30 MPa Yield strength of steel fsy = 460 MPa Concrete unit weight wc = 0 N/m3 Modulus of elasticity Ec = 25000 MPa Modulus of elasticity Es = 2x10⁶ MPa Poisson’s ratio ν = 0 Dead load wd = 4.0 kPa Live load wl = 5.0 kPa
TECHNICAL FEATURES OF SAFE TESTED Calculation of flexural reinforcement Application of minimum flexural reinforcement
RESULTS COMPARISON Table 1 shows the comparison of the SAFE total factored moments in the design strip the moments obtained by the hand computation method. Table 1 also shows the comparison of the design reinforcements.
Table 1 Comparison of Design Moments and Reinforcements
Load Level Method
Strip Moment (kN-m)
Reinforcement Area (sq-cm)
As+
Medium SAFE 25.00 5.414
Calculated 25.00 5.528
,minA s+ = 357.2 sq-mm
EXAMPLE CSA A23.3-04 RC-SL-001 - 2

Software Verification PROGRAM NAME: SAFE REVISION NO.: 0 COMPUTER FILE: CSA A23.3-04 RC-SL-001.FDB
CONCLUSION The SAFE results show a very close comparison with the independent results.
EXAMPLE CSA A23.3-04 RC-SL-001 - 3

Software Verification PROGRAM NAME: SAFEREVISION NO.: 0
HAND CALCULATION The following quantities are computed for the load combination:
φc = 0.65 for concrete
φs = 0.85 for reinforcement
As,min = 0.2 c
y
ff
′ bw h = 357.2 sq-mm
b = 1000 mm
α1 = 0.85 – 0.0015f'c ≥ 0.67 = 0.805
β1 = 0.97 – 0.0025f'c ≥ 0.67 = 0.895
cb = yf+700
700 d = 75.43 mm
ab = β1cb = 67.5 mm For the load combination, w and M* are calculated as follows:
w = (1.25wd + 1.5wt) b
8
21wlMu =
As = min[As,min, (4/3) As,required] = min[357.2, (4/3)540.63] = 357.2 sq-mm = 0.22•(150/125)2•0.6•SQRT(30)/460•100•125
= 282.9 sq-mm
COMB100 wd = 4.0 kPa wt = 5.0 kPa w = 12.5 kN/m Mf-strip = 25.0 kN-m Mf-design = 25.529 kN-m
The depth of the compression block is given by:
EXAMPLE CSA A23.3-04 RC-SL-001 - 4

Software Verification PROGRAM NAME: SAFE REVISION NO.: 0
bfM
ddacc
f
φα '2
1
2 −−= = 13.769 mm < amax
The area of tensile steel reinforcement is then given by:
−
=
2adf
MA
ys
fs
φ = 552.77 sq-mm > As,min
As = 5.528 sq-cm
EXAMPLE CSA A23.3-04 RC-SL-001 - 5

Software Verification PROGRAM NAME: SAFE REVISION NO.: 0
EXAMPLE Eurocode 2-04 PT-SL-001 Post-Tensioned Slab Design
PROBLEM DESCRIPTION The purpose of this example is to verify the slab stresses and the required area of mild steel strength reinforcing for a post-tensioned slab.
A one-way, simply supported slab is modeled in SAFE. The modeled slab is 254 mm thick by 914 mm wide and spans 9754 mm as shown in shown in Figure 1.
Length, L = 9754 mm
Elevation Section
Prestressing tendon, Ap
Mild Steel, As
914 mm25 mm
229 mm
254 mm
Length, L = 9754 mm
Elevation Section
Prestressing tendon, Ap
Mild Steel, As
914 mm25 mm
229 mm
254 mm
Figure 1 One-Way Slab
EXAMPLE Eurocode 2-04 PT-SL-001 - 1

Software Verification PROGRAM NAME: SAFEREVISION NO.: 0
A 254-mm-wide design strip is centered along the length of the slab and has been defined as an A-Strip. B-strips have been placed at each end of the span, perpendicular to Strip-A (the B-Strips are necessary to define the tendon profile). A tendon with two strands, each having an area of 99 mm2, was added to the A-Strip. The self weight and live loads have been added to the slab. The loads and post-tensioning forces are as follows:
Loads: Dead = self weight, Live = 4.788 kN/m2
The total factored strip moments, required area of mild steel reinforcement, and slab stresses are reported at the mid-span of the slab. Independent hand calculations were compared with the SAFE results and summarized for verification and validation of the SAFE results.
GEOMETRY, PROPERTIES AND LOADING Thickness T, h = 254 mm Effective depth d = 229 mm Clear span L = 9754 mm
Concrete strength f 'c = 30 MPa Yield strength of steel fy = 400 MPa Prestressing, ultimate fpu = 1862 MPa Prestressing, effective fe = 1210 MPa Area of Prestress (single strand) Ap = 198 mm2 Concrete unit weight wc = 23.56 KN/m3 Modulus of elasticity Ec = 25000 N/mm3 Modulus of elasticity Es = 200,000 N/mm3 Poisson’s ratio ν = 0
Dead load wd = self KN/m2 Live load wl = 4.788 KN/m2
TECHNICAL FEATURES OF SAFE TESTED Calculation of the required flexural reinforcement Check of slab stresses due to the application of dead, live, and post-tensioning
loads.
RESULTS COMPARISON Table 1 shows the comparison of the SAFE total factored moments, required mild steel reinforcing, and slab stresses with independent hand calculations.
EXAMPLE Eurocode 2-04 PT-SL-001 - 2

Software VerificationPROGRAM NAME: SAFE REVISION NO.: 0
Table 1 Comparison of Results
FEATURE TESTED INDEPENDENT RESULTS
SAFE RESULTS DIFFERENCE
Factored moment, Mu (Ultimate) (kN-m)
166.41 166.41 0.00%
Transfer Conc. Stress, top (D+PTI), MPa −5.057 −5.057 0.00%
Transfer Conc. Stress, bot (D+PTI), MPa 2.839 2.839 0.00%
Normal Conc. Stress, top (D+L+PTF), MPa −10.460 −10.465 0.05%
Normal Conc. Stress, bot (D+L+PTF), MPa 8.402 8.407 0.06%
Long-Term Conc. Stress, top (D+0.5L+PTF(L)), MPa −7.817 −7.817 0.00%
Long-Term Conc. Stress, bot (D+0.5L+PTF(L)), MPa 5.759 5.759 0.00%
Table 2 Comparison of Design Moments and Reinforcements
National Annex Method Design Moment
(kN-m)
Reinforcement Area (sq-cm)
As+
CEN Default, Norway, Slovenia and Sweden
SAFE 166.41 15.39
Calculated 166.41 15.36
Finland , Singapore and UK SAFE 166.41 15.89
Calculated 166.41 15.87
Denmark SAFE 166.41 15.96
Calculated 166.41 15.94
COMPUTER FILE: EUROCODE 2-04 PT-SL-001.FDB
CONCLUSION The SAFE results show an acceptable comparison with the independent results.
EXAMPLE Eurocode 2-04 PT-SL-001 - 3

Software Verification PROGRAM NAME: SAFEREVISION NO.: 0
HAND CALCULATIONS:
Design Parameters:
Mild Steel Reinforcing Post-Tensioning
f’c = 30MPa fpu = 1862 MPa fy = 400MPa fpy = 1675 MPa
Stressing Loss = 186 MPa Long-Term Loss = 94 MPa
fi = 1490 MPa fe = 1210 MPa
γm, steel = 1.15
γm, concrete = 1.50
0.1=η for fck ≤ 50 MPa
8.0=λ for fck ≤ 50 MPa
Length, L = 9754 mm
Elevation Section
Prestressing tendon, Ap
Mild Steel, As
914 mm25 mm
229 mm
254 mm
Length, L = 9754 mm
Elevation Section
Prestressing tendon, Ap
Mild Steel, As
914 mm25 mm
229 mm
254 mm
Loads: Dead, self-wt = 0.254 m × 23.56 kN/m3 = 5.984 kN/m2 (D) × 1.35 = 8.078 kN/m2 (Du) Live, = 4.788 kN/m2 (L) × 1.50 = 7.182 kN/m2 (Lu)
Total = 10.772 kN/m2 (D+L) = 15.260 kN/m2 (D+L)ult
ω =10.772 kN/m2 × 0.914 m = 9.846 kN/m, uω = 15.260 kN/m2 × 0.914 m = 13.948 kN/m
Ultimate Moment, 2
1
8UwlM = = ( )213.948 9.754 8× = 165.9 kN-m
EXAMPLE Eurocode 2-04 PT-SL-001 - 4

Software Verification PROGRAM NAME: SAFE REVISION NO.: 0
Ultimate Stress in strand, 7000 1 1.36
= + −
PU PPS SE
CK
f Af f d lf bd
( )( )1862(198)1210 7000(229) 1 1.36 9754
30(914) 229
1361 MPa
= + −
=
Ultimate force in PT, ( )( ), ( ) 2 99 1361 1000 269.5 kNult PT P PSF A f= = = CEN Default, Norway, Slovenia and Sweden: Design moment M = 166.4122 kN-m
Compression block depth ratio:cdfbd
Mmη2
=
( )( ) ( )( )2
166.4122 0.17360.914 0.229 1 30000 1.50
= =
Required area of mild steel reinforcing, m211 −−=ω = 1 1 2(0.1736) 0.1920− − =
21(30 /1.5)(914)(229)0.1920 2311 mm400 /1.15
cdEquivTotal
yd
f bdAf
ηω = = =
21361 2311 mm400 1.15
= + =
EquivTotal P SA A A
213612311 198 1536 mm400 /1.15
= − =
SA
Finland, Singapore and UK: Design moment M = 166.4122 kN-m
Compression block depth ratio:cdfbd
Mmη2
=
( )( ) ( )( )2
166.4122 0.20420.914 0.229 0.85 30000 1.50
= =
Required area of mild steel reinforcing, m211 −−=ω = 1 1 2(0.2042) 0.23088− − =
EXAMPLE Eurocode 2-04 PT-SL-001 - 5

Software Verification PROGRAM NAME: SAFE REVISION NO.: 0
20.85(30 /1.5)(914)(229)0.23088 2362 mm400 /1.15
cdEquivTotal
yd
f bdAf
ηω = = =
21361 2362 mm400 1.15
= + =
EquivTotal P SA A A
213612362 198 1587 mm400 1.15
= − =
SA
Denmark: Design moment M = 166.4122 kN-m
Compression block depth ratio:cdfbd
Mmη2
=
( )( ) ( )( )2
166.4122 0.16780.914 0.229 1.0 30000 1.45
= =
Required area of mild steel reinforcing, m211 −−=ω = 1 1 2(0.1678) 0.1849− − =
21.0(30 /1.45)(914)(229)0.1849 2402 mm400 /1.20
cdEquivTotal
yd
f bdAf
ηω = = =
21361 2402 mm400 1.2
= + =
EquivTotal P SA A A
213612402 198 1594 mm400 1.2
= − =
SA
Check of Concrete Stresses at Midspan: Initial Condition (Transfer), load combination (D+PTi) = 1.0D+0.0L+1.0PTI
Tendon stress at transfer = jacking stress − stressing losses =1490 − 186 = 1304 MPa The force in the tendon at transfer = ( )1304 197.4 1000 257.4 kN=
Moment due to dead load, ( )( )25.984 0.914 9.754 8 65.04 kN-m= =DM Moment due to PT, ( )(sag) 257.4 102 mm 1000 26.25 kN-m= = =PT PTIM F
Stress in concrete,( )
257.4 65.04 26.230.254 0.914 0.00983
− − −= ± = ±PTI D PTF M Mf
A S
EXAMPLE Eurocode 2-04 PT-SL-001 - 6

Software VerificationPROGRAM NAME: SAFE REVISION NO.: 0
where S = 0.00983m3
1.109 3.948 MPaf = − ± 5.058(Comp) max, 2.839(Tension) maxf = −
Normal Condition, load combinations: (D+L+PTF) = 1.0D+1.0L+1.0PTF
Tendon stress at normal = jacking − stressing − long-term=1490 − 186 − 94 = 1210 MPa The force in tendon at normal = ( )1210 197.4 1000 238.9 kN=
Moment due to dead load ( )( )25.984 0.914 9.754 8 65.04 kN-m= =DM
Moment due to live load ( )( )24.788 0.914 9.754 8 52.04 kN-m= =LM Moment due to PT, ( )(sag) 238.9 102 mm 1000 24.37 kN-m= = =PT PTIM F
Stress in concrete for (D+L+PTF),
( )238.8 117.08 24.37
0.254 0.914 0.00983+ − − −
= ± = ±PTI D L PTF M MfA S1 029 9 431f . .= − ± 10.460(Comp) max, 8.402(Tension) maxf = −
Long-Term Condition, load combinations: (D+0.5L+PTF(L)) = 1.0D+0.5L+1.0PTF
Tendon stress at normal = jacking − stressing − long-term = 1490 − 186 − 94 = 1210 MPa The force in tendon at normal, = ( )1210 197.4 1000 238.9 kN=
Moment due to dead load, ( )( )25.984 0.914 9.754 8 65.04 kN-m= =DM
Moment due to live load, ( )( )24.788 0.914 9.754 8 52.04 kN-m= =LM Moment due to PT, ( )(sag) 238.9 102 mm 1000 24.37 kN-m= = =PT PTIM F
Stress in concrete for (D+0.5L+PTF(L)),
( )0.5 238.9 91.06 24.33
0.254 0.914 0.00983+ − − −
= ± = ±D L PTPTI M MFfA S1 029 6 788f . .= − ± 7.817(Comp) max, 5.759(Tension) maxf = −
EXAMPLE Eurocode 2-04 PT-SL-001 - 7

Software VerificationPROGRAM NAME: SAFE REVISION NO.: 0
EXAMPLE Eurocode 2-04 RC-BM-001 Flexural and Shear Beam Design
PROBLEM DESCRIPTION The purpose of this example is to verify slab flexural design in SAFE. The load level is adjusted for the case corresponding to the following conditions:
The stress-block extends below the flange but remains within the balancedcondition permitted by Eurocode 2-04.
The average shear stress in the beam is below the maximum shear stressallowed by Eurocode 2-04, requiring design shear reinforcement.
A simple-span, 6-m-long, 300-mm-wide, and 500-mm-deep T-beam with a flange 100 mm thick and 600 mm wide is modeled using SAFE. The beam is shown in Figure 1. The computational model uses a finite element mesh of frame elements, automatically generated by SAFE. The maximum element size has been specified to be 200 mm. The beam is supported by columns without rotational stiffnesses and with very large vertical stiffness (1×10²⁰ kN/m).
The beam is loaded with symmetric third-point loading One dead load case (DL30) and one live load case (LL130) with only symmetric third-point loads of magnitudes 30, and 130 kN, respectively, are defined in the model. One load combinations (COMB130) is defined using the Eurocode 2-04 load combination factors of 1.35 for dead loads and 1.5 for live loads. The model is analyzed for both of these load cases and the load combinations.
The beam moment and shear force are computed analytically. The total factored moment and shear force are compared with the SAFE results. These moment and shear force are identical. After completing the analysis, design is performed using the Eurocode 2-04 code in SAFE and also by hand computation. Table 1 shows the comparison of the design longitudinal reinforcements. Table 2 shows the comparison of the design shear reinforcements.
EXAMPLE Eurocode 2-04 RC-BM-001 - 1

Software Verification PROGRAM NAME: SAFEREVISION NO.: 0
Beam Section
75 mm 100 mm
300 mm
600 mm
75 mm
500 mm
Shear Force
Bending Moment
2000 mm 2000 mm 2000 mm
Beam Section
75 mm 100 mm
300 mm
600 mm
75 mm
500 mm
Shear Force
Bending Moment
2000 mm 2000 mm 2000 mm
Figure 1 The Model Beam for Flexural and Shear Design
EXAMPLE Eurocode 2-04 RC-BM-001 - 2

Software Verification PROGRAM NAME: SAFE REVISION NO.: 0
GEOMETRY, PROPERTIES AND LOADING Clear span, l = 6000 mm Overall depth, h = 500 mm Flange thickness, ds = 100 mm Width of web, bw = 300 mm Width of flange, bf = 600 mm Depth of tensile reinf., dc = 75 mm Effective depth, d = 425 mm Depth of comp. reinf., d' = 75 mm Concrete strength, f'
ck = 30 MPa Yield strength of steel, fy = 460 MPa Concrete unit weight, wc = 0 kN/m3 Modulus of elasticity, Ec = 25x105 MPa Modulus of elasticity, Es = 2x10⁸ MPa Poisson’s ratio, v = 0.2 Dead load, Pd = 30 kN Live load, Pl = 130 kN
TECHNICAL FEATURES OF SAFE TESTED Calculation of flexural and shear reinforcement Application of minimum flexural and shear reinforcement
RESULTS COMPARISON Table 1 shows the comparison of the SAFE total factored moments in the design strip with the moments obtained by the analytical method. They match exactly for this problem. Table 1 also shows the comparison of design reinforcements.
EXAMPLE Eurocode 2-04 RC-BM-001 - 3

Software Verification PROGRAM NAME: SAFE REVISION NO.: 0
Table 1 Comparison of Moments and Flexural Reinforcements
National Annex Method
Moment
(kN-m)
Reinforcement Area (sq-cm)
As+
CEN Default, Norway, Slovenia and Sweden
SAFE 471 31.643
Calculated 471 31.643
Finland , Singapore and UK SAFE 471 32.98
Calculated 471 32.98
Denmark SAFE 471 32.83
Calculated 471 32.83
,mins+A = 2.09 sq-cm
Table 2 Comparison of Shear Reinforcements
National Annex Method
Shear Force
(kN)
Reinforcement Area , s
Av
(sq-cm/m)
As+
CEN Default, Norway, Slovenia and Sweden
SAFE 235.5 6.16
Calculated 235.5 6.16
Finland , Singapore and UK SAFE 235.5 6.16
Calculated 235.5 6.16
Denmark SAFE 235.5 6.42
Calculated 235.5 6.42
COMPUTER FILE: Eurocode 2-04 RC-BM-001.FDB
CONCLUSION The SAFE results show an exact comparison with the independent results.
EXAMPLE Eurocode 2-04 RC-BM-001 - 4

Software VerificationPROGRAM NAME: SAFE REVISION NO.: 0
HAND CALCULATION
Flexural Design The following quantities are computed for both of the load combinations:
γs = 1.15
γc = 1.50
/cd cc ck cf f= α γ
/yd yk sf f= γ
0.1=η for fck ≤ 50 MPa
8.0=λ for fck ≤ 50 MPa
bdffA
yk
ctms 26.0min, = = 208.73 sq-mm
min 0 0013=s wA , . b h = 195.00 sq-mm
For CEN Default, Norway, Slovenia and Sweden—COMB130:
γm, steel = 1.15
γm, concrete = 1.50 αcc = 1.0
The depth of the compression block is given by: 6
2 2
471 10600 425 1.0 1.0 30 /1.5cd
Mmbd fη
•= =
• • • • = 0.217301
For reinforcement with fyk ≤ 500 MPa, the following values are used: k1 = 0.44 k2 = k4 = 1.25(0.6 + 0.0014/εcu2) = 1.25
δ is assumed to be 1
2
1
lim kk
dx −
=
δ for fck ≤ 50 MPa = 0.448
EXAMPLE Eurocode 2-04 RC-BM-001 - 5

Software Verification PROGRAM NAME: SAFEREVISION NO.: 0
−
=
limlimlim 2
1dx
dxm λλ = 0.29417
limlim
lim 211 mdx
−−=
= λω = 0.3584
amax = ωlimd = 152.32 mm
ω = 1 1 2m− − = 0.24807 a = ωd = 105.4299 mm ≤ amax
( )2
η−= f w f cd
syd
b b h fA
f = 1500 sq-mm
−=
222f
yds
hdfAM = 225 kN-m
M1 = M − M2 = 246 kN-m
11 2η=
w cd
Mmb d f
= 0.2269896 ≤ mlim
11 211 m−−=ω = 0.2610678
1 1ηω
=
cd ws
yd
f b dAf
= 1664.304 sq-mm
As = As1 + As2 = 3164.307 sq-mm
For Singapore and UK—COMB130:
γm, steel = 1.15
γm, concrete = 1.50 αcc = 0.85
The depth of the compression block is given by: 6
2 2
471 10600 425 1.0 0.85 30 /1.5cd
Mmbd fη
•= =
• • • • = 0.255648
For reinforcement with fyk ≤ 500 MPa, the following values are used: k1 = 0.40
EXAMPLE Eurocode 2-04 RC-BM-001 - 6

Software Verification PROGRAM NAME: SAFE REVISION NO.: 0
k2 = (0.6 + 0.0014/εcu2) = 1.00
δ is assumed to be 1
2
1
lim kk
dx −
=
δ for fck ≤ 50 MPa = 0.60
−
=
limlimlim 2
1dx
dxm λλ = 0.3648
limlim
lim 211 mdx
−−=
= λω = 0.48
amax = ωlimd = 204 mm
ω = 1 1 2m− − = 0.300923 a = ωd = 127.8939 mm ≤ amax
( )
2
η−= f w f cd
syd
b b h fA
f = 1275 sq-mm
−=
222f
yds
hdfAM =191.25 kN-m
M1 = M − M2 = 279.75 kN-m
11 2η=
w cd
Mmb d f
= 0.30368 ≤ mlim
11 211 m−−=ω = 0.37339
=
yd
wcds f
dbfA ηω11
= 0.85 301.0 300 425
1.50.37339400
• • • •
= 2023.307 sq-mm
As = As1 + As2 = 3298.31 sq-mm
For Finland—COMB130:
γm, steel = 1.15
EXAMPLE Eurocode 2-04 RC-BM-001 - 7

Software Verification PROGRAM NAME: SAFE REVISION NO.: 0
γm, concrete = 1.50 αcc = 0.85
The depth of the compression block is given by: 6
2 2
471 10600 425 1.0 0.85 30 /1.5cd
Mmbd fη
•= =
• • • • = 0.255648
For reinforcement with fyk ≤ 500 MPa, the following values are used: k1 = 0.44 k2 = 1.10
δ is assumed to be 1
2
1
lim kk
dx −
=
δ for fck ≤ 50 MPa = 0.5091
−
=
limlimlim 2
1dx
dxm λλ = 0.3243
limlim
lim 211 mdx
−−=
= λω = 0.40728
amax = ωlimd = 173.094 mm
ω = 1 1 2m− − = 0.300923 a = ωd = 127.8939 mm ≤ amax
( )
2
η−= f w f cd
syd
b b h fA
f = 1275 sq-mm
−=
222f
yds
hdfAM =191.25 kN-m
M1 = M − M2 = 279.75 kN-m
11 2η=
w cd
Mmb d f
= 0.30368 ≤ mlim
11 211 m−−=ω = 0.37339
=
yd
wcds f
dbfA ηω11
EXAMPLE Eurocode 2-04 RC-BM-001 - 8

Software VerificationPROGRAM NAME: SAFE REVISION NO.: 0
= 0.85 301.0 300 425
1.50.37339400
• • • •
= 2023.307 sq-mm
As = As1 + As2 = 3298.31 sq-mm
For Denmark—COMB130:
γm, steel = 1.20
γm, concrete = 1.45 αcc = 1.0
The depth of the compression block is given by: 6
2 2
471 10600 425 1.0 1.0 30 /1.45cd
Mmbd fη
•= =
• • • • = 0.210058
For reinforcement with fyk ≤ 500 MPa, the following values are used: k1 = 0.44 k2 = k4 = 1.25(0.6 + 0.0014/εcu2) = 1.25
δ is assumed to be 1
2
1
lim kk
dx −
=
δ for fck ≤ 50 MPa = 0.448
−
=
limlimlim 2
1dx
dxm λλ = 0.29417
limlim
lim 211 mdx
−−=
= λω = 0.3584
amax = ωlimd = 152.32 mm
ω = 1 1 2m− − = 0.238499 a = ωd = 101.3620 mm ≤ amax
( )2
η−= f w f cd
syd
b b h fA
f = 1619.19 sq-mm
EXAMPLE Eurocode 2-04 RC-BM-001 - 9

Software Verification PROGRAM NAME: SAFEREVISION NO.: 0
−=
222f
yds
hdfAM = 232.76 kN-m
M1 = M − M2 = 238.24 kN-m
11 2η=
w cd
Mmb d f
= 0.21250 ≤ mlim
11 211 m−−=ω = 0.241715
1 1ηω
=
cd ws
yd
f b dAf
= 1663.37 sq-mm
As = As1 + As2 = 3282.56 sq-mm
Shear Design For CEN Default, Finland, Singapore, Slovenia and UK
ccRdC γ18.0, = = 0.18/1.5 = 0.12
For Denmark
, 0.18Rd c cC γ= = 0.18/1.45 = 0.124
For Sweden and Norway
, 0.15Rd c cC γ= = 0.15/1.5 = 0.10
2001 1.686 2.0kd
= + = ≤ with d in mm
ρ1 = 0.0
0.2σ = <cp Ed c cdN A f = 0.0 MPa
For CEN Default, Denmark, Norway, Singapore, Slovenia, Sweden and UK:
2123min 035.0 ckfk=ν = 0.419677
For Finland: 2/3 1 2
min 0.035 ckk fν = = 0.271561
( )1 3, , 1 1100Rd c Rd c ck cp wV C k f k b dρ σ = + = 34.62 kN for Finland
EXAMPLE Eurocode 2-04 RC-BM-001 - 10
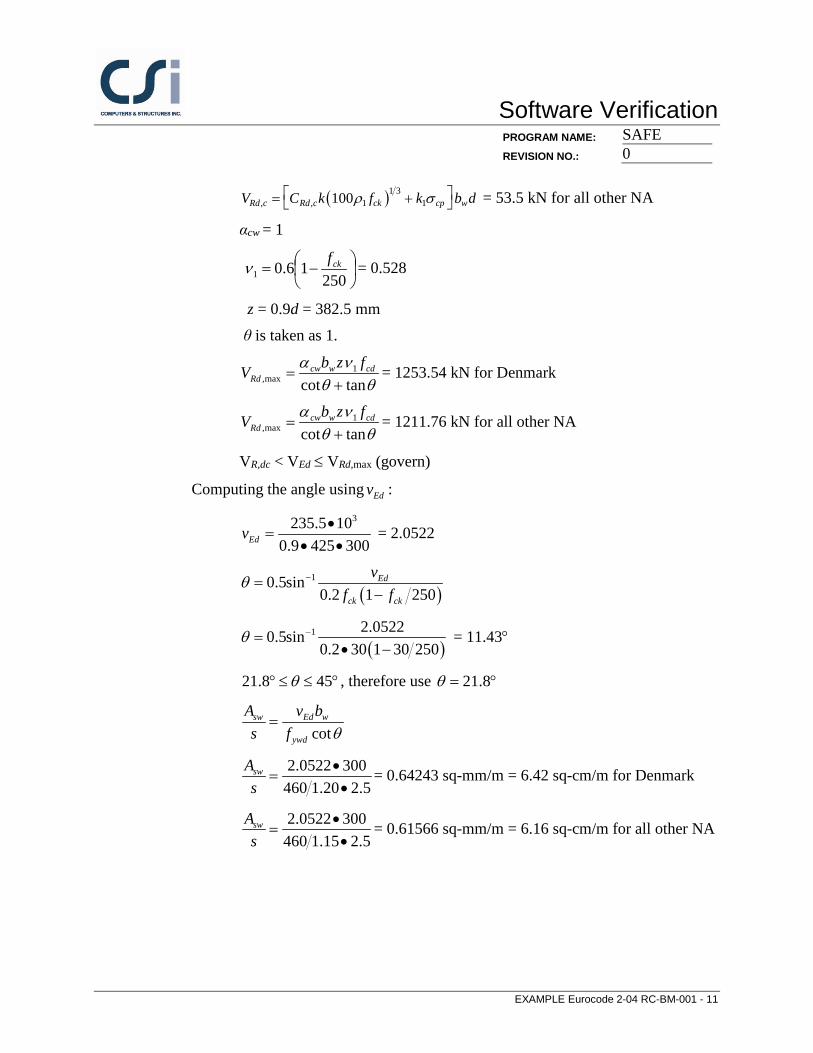
Software VerificationPROGRAM NAME: SAFE REVISION NO.: 0
( )1 3, , 1 1100Rd c Rd c ck cp wV C k f k b dρ σ = + = 53.5 kN for all other NA
αcw = 1
−=
25016.01
ckfν = 0.528
z = 0.9d = 382.5 mm θ is taken as 1.
θθναtancot
1max, +
= cdwcwRd
fzbV = 1253.54 kN for Denmark
θθναtancot
1max, +
= cdwcwRd
fzbV = 1211.76 kN for all other NA
VR,dc < VEd ≤ VRd,max (govern)
Computing the angle using Edv :
3235.5 100.9 425 300Edv •
=• •
= 2.0522
( )10.5sin
0.2 1 250θ −=
−Ed
ck ck
vf f
( )1 2.05220.5sin
0.2 30 1 30 250θ −=
• − = 11.43°
21.8 45θ° ≤ ≤ ° , therefore use 21.8θ = °
cotsw Ed w
ywd
A v bs f θ
=
2.0522 300460 1.20 2.5
swAs
•=
•= 0.64243 sq-mm/m = 6.42 sq-cm/m for Denmark
2.0522 300460 1.15 2.5
swAs
•=
•= 0.61566 sq-mm/m = 6.16 sq-cm/m for all other NA
EXAMPLE Eurocode 2-04 RC-BM-001 - 11

Software VerificationPROGRAM NAME: SAFE REVISION NO.: 0
EXAMPLE EUROCODE 2-04 RC-PN-001 Slab Punching Shear Design
PROBLEM DESCRIPTION The purpose of this example is to verify slab punching shear design in SAFE
The numerical example is a flat slab that has three 8-m spans in each direction, as shown in Figure 1.
4
A
3
2
1
B C D
X
Y
0.3 m0.3 m8 m8 m8 m
0.6 m
0.6 m
0.25 m thick flat slab
LoadingDL = Self weight + 1.0 kN/m2
LL = 4.0 kN/m2
Columns are 0.3 m x 0.9 mwith long side parallel to the Y-axis, typical
Concrete PropertiesUnit weight = 24 kN/m3
f'c = 30 N/mm2
8 m
8 m
8 m
4
A
3
2
1
B C D
X
Y
0.3 m0.3 m8 m8 m8 m
0.6 m
0.6 m
0.25 m thick flat slab
LoadingDL = Self weight + 1.0 kN/m2
LL = 4.0 kN/m2
Columns are 0.3 m x 0.9 mwith long side parallel to the Y-axis, typical
Concrete PropertiesUnit weight = 24 kN/m3
f'c = 30 N/mm2
8 m
8 m
8 m
Figure 1: Flat Slab for Numerical Example
The slab overhangs beyond the face of the column by 0.15 m along each side of the structure. The columns are typically 0.3 m x 0.9 m with the long side parallel to the Y-axis. Thick plate properties are used for the slab.
The concrete has a unit weight of 24 kN/m3 and a f 'c of 30 N/mm2. The dead load consists of the self weight of the structure plus an additional 1 kN/m2. The live load is 4 kN/m2.
EXAMPLE EUROCODE 2-04 RC-PN-001 - 1

Software Verification PROGRAM NAME: SAFE REVISION NO.: 0
TECHNICAL FEATURES OF SAFE TESTED Calculation of punching shear capacity, shear stress and D/C ratio.
RESULTS COMPARISON Table 1 shows the comparison of the punching shear capacity, shear stress ratio and D/C ratio obtained from SAFE with the punching shear capacity, shear stress ratio and D/C ratio obtained by the analytical method. They match exactly for this problem.
Table 1 Comparison of Design Results for Punching Shear at Grid B-2
National Annex
Method
Shear Stress
(N/mm2)
Shear Capacity (N/mm2)
D/C ratio
CEN Default, Norway, Slovenia and Sweden
SAFE 1.100 0.578 1.90
Calculated 1.099 0.578 1.90
Finland, Singapore and UK SAFE 1.100 0.5796 1.90
Calculated 1.099 0.5796 1.90
Denmark SAFE 1.100 0.606 1.82
Calculated 1.099 0.606 1.81
COMPUTER FILE: EUROCODE 2-04 RC-PN-001.FDB
CONCLUSION The SAFE results show an acceptable comparison with the independent results.
EXAMPLE EUROCODE 2-04 RC-PN-001 - 2

Software VerificationPROGRAM NAME: SAFE REVISION NO.: 0
HAND CALCULATION Hand Calculation for Interior Column using SAFE Method
( ) ( )[ ]250 26 250 38 2= − + −d = 218 mm
Refer to Figure 2.
u1 = u = 2•300 + 2•900 + 2•π•436 = 5139.468 mm
450
450
150 436
X
Y
1772
1172
Side
3
Column
Side
1
Side 4
436 150
436
436
Note: All dimensions in millimeters
X
Y
Side 2A B
CD
Critical section for punching shear shown dashed.
Center of column is point (x1, y1). Set this equal to (0,0).
450
450
150 436
X
Y
1772
1172
Side
3
Column
Side
1
Side 4
436 150
436
436
Note: All dimensions in millimeters
X
Y
Side 2A B
CD
Critical section for punching shear shown dashed.
Center of column is point (x1, y1). Set this equal to (0,0).
450
450
150 436
X
Y
1772
1172
Side
3
Column
Side
1
Side 4
436 150
436
436
Note: All dimensions in millimeters
X
Y
Side 2A B
CD
Critical section for punching shear shown dashed.
Center of column is point (x1, y1). Set this equal to (0,0).
450
450
150 436
X
Y
1772
1172
Side
3
Column
Side
1
Side 4
436 150
436
436
Note: All dimensions in millimeters
X
Y
Side 2A B
CD
Critical section for punching shear shown dashed.
Center of column is point (x1, y1). Set this equal to (0,0).
Figure 2: Interior Column, Grid B-2 in SAFE Model
From the SAFE output at Grid B-2: VEd = 1112.197 kN k2MEd2 = 41.593 kN-m k3MEd3 = 20.576 kN-m
EXAMPLE EUROCODE 2-04 RC-PN-001 - 3

Software Verification PROGRAM NAME: SAFEREVISION NO.: 0
Maximum design shear stress in computed in along major and minor axis of column:
2 ,2 1 3 ,3 1
1,2 1,3
1 Ed EdEdEd
Ed Ed
k M u k M uVvud V W V W
= + +
(EC2 6.4.4(2))
221
1 1 2 2 14 16 22cW c c c d d dcπ= + + + +
22
1,2900 300 900 4 300 218 16 218 2 218 900
2W π= + • + • • + • + • •
1,2 2,929,744.957W = mm2
22
1,39003 900 300 4 900 218 16 218 2 218 300
2W π= + • + • • + • + • •
1,2 2, 271,104.319W = mm2
2 ,2 1 3 ,3 1
1 1,2 1,3
1 Ed EdEdEd
Ed Ed
k M u k M uVvu d V W V W
= + +
3 6 6
3 31112.197 10 41.593 10 5139.468 20.576 10 5139.46815139.468 218 1112.197 10 2929744.957 1112.197 10 2271104.319Edv
• • • • •= + + • • • • •
Edv = 1.099 N/mm2
Thus vmax = 1.099 N/mm2
For CEN Default, Finland, Norway, Singapore, Slovenia, Sweden and UK:
ccRdC γ18.0, = = 0.18/1.5 = 0.12 (EC2 6.4.4)
For Denmark:
, 0.18Rd c cC γ= = 0.18/1.45 = 0.124 (EC2 6.4.4)
The shear stress carried by the concrete, VRd,c, is calculated as:
( )ρ σ = + 1 3
, , 1 1100Rd c Rd c ck cpV C k f k (EC2 6.4.4)
with a minimum of:
( ), min 1Rd c cpv v kσ= + (EC2 6.4.4)
EXAMPLE EUROCODE 2-04 RC-PN-001 - 4

Software VerificationPROGRAM NAME: SAFE REVISION NO.: 0
2001 2.0kd
= + ≤ = 1.9578 (EC2 6.4.4(1))
k1 = 0.15. (EC2 6.2.2(1))
ρ1 = db
A
w
s1 ≤ 0.02
Area of reinforcement at the face of column for design strip are as follows:
For CEN Default, Norway, Slovenia and Sweden: As in Strip Layer A = 9204.985 mm2
As in Strip Layer B = 8078.337 mm2
Average As = ( )9204.985 8078.337 2+ = 8641.661 mm2
ρ1 = ( )8641.661 8000 218• = 0.004955 ≤ 0.02
For Finland, Singapore and UK: As in Strip Layer A = 9319.248 mm2
As in Strip Layer B = 8174.104 mm2
Average As = ( )9319.248 8174.104 2+ = 8746.676 mm2
ρ1 = ( )8746.676 8000 218• = 0.005015 ≤ 0.02
For Denmark: As in Strip Layer A = 9606.651 mm2
As in Strip Layer B = 8434.444 mm2
Average As = ( )9606.651 8434.444 2+ = 9020.548 mm2
ρ1 = ( )9020.548 8000 218• = 0.005172 ≤ 0.02
EXAMPLE EUROCODE 2-04 RC-PN-001 - 5

Software Verification PROGRAM NAME: SAFE REVISION NO.: 0
For CEN Default, Denmark, Norway, Singapore, Slovenia, Sweden and UK: 2123
min 035.0 ckfk=ν = ( ) ( )3/2 1/20.035 1.9578 30 = 0.525 N/mm2
For Finland: 2/3 1 2
min 0.035 ckk fν = = ( ) ( )2/3 1/20.035 1.9578 30 = 0.3000 N/mm2
For CEN Default, Norway, Slovenia and Sweden:
( ) = • • • + 1 3
, 0.12 1.9578 100 0.004955 30 0Rd cv = 0.5777 N/mm2
For Finland, Singapore, and UK:
( )1 3, 0.12 1.9578 100 0.005015 30 0Rd cv = • • • + = 0.5796 N/mm2
For Denmark:
( )1 3, 0.124 1.9578 100 0.005015 30 0Rd cv = • • • + = 0.606 N/mm2
For CEN Default, Norway, Slovenia and Sweden:
max
,
1.092Shear Ratio 1.900.5777Rd c
vv
= = =
For Finland, Singapore and UK: max
,
1.092Shear Ratio 1.900.5796Rd c
vv
= = =
For Denmark: max
,
1.092Shear Ratio 1.810.606Rd c
vv
= = =
EXAMPLE EUROCODE 2-04 RC-PN-001 - 6

Software Verification PROGRAM NAME: SAFE REVISION NO.: 0
EXAMPLE Eurocode 2-04 RC-SL-001 Slab Flexural Design
PROBLEM DESCRIPTION The purpose of this example is to verify slab flexural design in SAFE.
A one-way, simple-span slab supported by walls on two opposite edges is modeled using SAFE. The slab is 150 mm thick and spans 4 meters between walls. The walls are modeled as pin supports. The computational model uses a finite element mesh, automatically generated by SAFE. The maximum element size is specified as 0.25 meters. To obtain factored moments and flexural reinforcement in a design strip, one one-meter wide strip is defined in the X-direction on the slab, as shown in Figure 1.
Figure 1 Plan View of One-Way Slab
One dead load case (DL4KPa) and one live load case (LL5KPa) with uniformly distributed surface loads of magnitudes 4 and 5 kN/m2, respectively, are defined in the model. A load combination (COMB5kPa) is defined using the Eurocode 2-04 load combination factors, 1.35 for dead loads and 1.5 for live loads. The model is analyzed for both load cases and the load combination.
The slab moment on a strip of unit width is computed analytically. The total factored strip moments are compared with the SAFE results. These moments are identical. After completing the analysis, design is performed using the Eurocode 2-04 code by SAFE and also by hand computation. Table 1 shows the comparison of the design reinforcements computed by the two methods.
EXAMPLE Eurocode 2-04 RC-SL-001 - 1

Software Verification PROGRAM NAME: SAFEREVISION NO.: 0
GEOMETRY, PROPERTIES AND LOADING Thickness T, h = 150 mm Depth of tensile reinf. dc = 25 mm Effective depth d = 125 mm Clear span ln, l1 = 4000 mm
Concrete strength fck = 30 MPa Yield strength of steel fsy = 460 MPa Concrete unit weight wc = 0 N/m3 Modulus of elasticity Ec = 25000 MPa Modulus of elasticity Es = 2x10⁶ MPa Poisson’s ratio ν = 0
Dead load wd = 4.0 kPa Live load wl = 5.0 kPa
TECHNICAL FEATURES OF SAFE TESTED Calculation of flexural reinforcement Application of minimum flexural reinforcement
RESULTS COMPARISON Table 1 shows the comparison of the SAFE total factored moments in the design strip the moments obtained by the hand computation method. Table 1 also shows the comparison of the design reinforcements.
Table 1 Comparison of Design Moments and Reinforcements
National Annex Method Strip Moment
(kN-m)
Reinforcement Area (sq-cm)
As+
CEN Default, Norway, Slovenia and Sweden
SAFE 25.797 5.400
Calculated 25.800 5.400
Finland , Singapore and UK
SAFE 25.797 5.446
Calculated 25.800 5.446
Denmark SAFE 25.797 5.626
EXAMPLE Eurocode 2-04 RC-SL-001 - 2

Software Verification PROGRAM NAME: SAFE REVISION NO.: 0
Calculated 25.800 5.626
,minA s+ = 204.642 sq-mm
COMPUTER FILE: Eurocode 2-04 RC-SL-001.FDB
CONCLUSION The SAFE results show an acceptable comparison with the independent results.
EXAMPLE Eurocode 2-04 RC-SL-001 - 3

Software Verification PROGRAM NAME: SAFE REVISION NO.: 0
HAND CALCULATION The following quantities are computed for the load combination:
0.1=η for fck ≤ 50 MPa
8.0=λ for fck ≤ 50 MPa
b = 1000 mm For the load combination, w and M are calculated as follows:
w = (1.35wd + 1.5wt) b 2
1
8wlM =
=
min
0 0013max 0 26
w
s , ctm
yk
. b dA f. bd
f
= 204.642 sq-mm
COMB100 wd = 4.0 kPa wt = 5.0 kPa w = 12.9 kN/m M-strip = 25.8 kN-m M-design= 25.8347 kN-m
For CEN Default, Norway, Slovenia and Sweden:
γm, steel = 1.15
γm, concrete = 1.50 αcc = 1.0
The depth of the compression block is given by: 6
2 2
25.8347 101000 125 1.0 1.0 30 /1.5cd
Mmbd fη
•= =
• • • • = 0.08267
EXAMPLE Eurocode 2-04 RC-SL-001 - 4

Software VerificationPROGRAM NAME: SAFE REVISION NO.: 0
For reinforcement with fyk ≤ 500 MPa, the following values are used: k1 = 0.44 k2 = k4 = 1.25(0.6 + 0.0014/εcu2) = 1.25
δ is assumed to be 1
2
1
lim kk
dx −
=
δ for fck ≤ 50 MPa = 0.448
−
=
limlimlim 2
1dx
dxm λλ = 0.294
m211 −−=ω = 0.08640
=
yd
cds f
bdfA ηω = 540.024 sq-mm > As,min
As = 5.400 sq-cm
For Singapore and UK:
γm, steel = 1.15
γm, concrete = 1.50 αcc = 0.85:
The depth of the compression block is given by: 6
2 2
25.8347 101000 125 1.0 0.85 30 /1.5cd
Mmbd fη
•= =
• • • • = 0.097260
−
=
limlimlim 2
1dx
dxm λλ = 0.48
2
1
lim kk
dx −
=
δ for fck ≤ 50 MPa = 0.60
For reinforcement with fyk ≤ 500 MPa, the following values are used: k1 = 0.40 k2 = (0.6 + 0.0014/εcu2) = 1.00
EXAMPLE Eurocode 2-04 RC-SL-001 - 5

Software Verification PROGRAM NAME: SAFEREVISION NO.: 0
δ is assumed to be 1
m211 −−=ω = 0.10251
=
yd
cds f
bdfA ηω = 544.61 sq-mm > As,min
As = 5.446 sq-cm
For Finland:
γm, steel = 1.15
γm, concrete = 1.50 αcc = 0.85:
The depth of the compression block is given by: 6
2 2
25.8347 101000 125 1.0 0.85 30 /1.5cd
Mmbd fη
•= =
• • • • = 0.097260
−
=
limlimlim 2
1dx
dxm λλ = 032433
2
1
lim kk
dx −
=
δ for fck ≤ 50 MPa = 0.5091
For reinforcement with fyk ≤ 500 MPa, the following values are used: k1 = 0.44 k2 = 1.1
k4 = 1.25(0.6 + 0.0014/εcu2) = 1.25
δ is assumed to be 1
m211 −−=ω = 0.10251
=
yd
cds f
bdfA ηω = 544.61 sq-mm > As,min
As = 5.446 sq-cm
EXAMPLE Eurocode 2-04 RC-SL-001 - 6

Software Verification PROGRAM NAME: SAFE REVISION NO.: 0
For Denmark:
γm, steel = 1.20
γm, concrete = 1.45 αcc = 1.0
The depth of the compression block is given by: 6
2 2
25.8347 101000 125 1.0 1.0 30 /1.5cd
Mmbd fη
•= =
• • • • = 0.0799153
−
=
limlimlim 2
1dx
dxm λλ = 0.294
2
1
lim kk
dx −
=
δ for fck ≤ 50 MPa = 0.448
For reinforcement with fyk ≤ 500 MPa, the following values are used: k1 = 0.44 k2 = k4 = 1.25(0.6 + 0.0014/εcu2) = 1.25
δ is assumed to be 1
m211 −−=ω = 0.08339
=
yd
cds f
bdfA ηω = 562.62 sq-mm > As,min
As = 5.626 sq-cm
EXAMPLE Eurocode 2-04 RC-SL-001 - 7

Software Verification PROGRAM NAME: SAFE REVISION NO.: 0
EXAMPLE Hong Kong CP-04 PT-SL-001 Post-Tensioned Slab Design
PROBLEM DESCRIPTION The purpose of this example is to verify the slab stresses and the required area of mild steel strength reinforcing for a post-tensioned slab.
A one-way, simply supported slab is modeled in SAFE. The modeled slab is 254 mm thick by 914 mm wide and spans 9754 mm, as shown in shown in Figure 1.
Length, L = 9754 mm
Elevation Section
Prestressing tendon, Ap
Mild Steel, As
914 mm25 mm
229 mm
254 mm
Length, L = 9754 mm
Elevation Section
Prestressing tendon, Ap
Mild Steel, As
914 mm25 mm
229 mm
254 mm
Figure 1 One-Way Slab
EXAMPLE Hong Kong CP-04 PT-SL-001 - 1

Software Verification PROGRAM NAME: SAFEREVISION NO.: 0
To ensure one-way action Poisson’s ratio is taken to be zero. A 254-mm-wide design strip is centered along the length of the slab and has been defined as an A-Strip. B-strips have been placed at each end of the span, perpendicular to Strip-A (the B-Strips are necessary to define the tendon profile). A tendon with twostrands, each having an area of 99 mm2, was added to the A-Strip. The self weightand live loads were added to the slab. The loads and post-tensioning forces are asfollows:
Loads: Dead = self weight, Live = 4.788 kN/m2
The total factored strip moments, required area of mild steel reinforcement and slab stresses are reported at the midspan of the slab. Independent hand calculations were compared with the SAFE results and summarized for verification and validation of the SAFE results.
GEOMETRY, PROPERTIES AND LOADING Thickness T, h = 254 mm Effective depth d = 229 mm Clear span L = 9754 mm
Concrete strength f 'c = 30 MPa Yield strength of steel fy = 400 MPa Prestressing, ultimate fpu = 1862 MPa Prestressing, effective fe = 1210 MPa Area of Prestress (single strand) Ap = 198 mm2 Concrete unit weight wc = 23.56 KN/m3 Modulus of elasticity Ec = 25000 N/mm3 Modulus of elasticity Es = 200,000 N/mm3 Poisson’s ratio ν = 0
Dead load wd = self KN/m2 Live load wl = 4.788 KN/m2
TECHNICAL FEATURES OF SAFE TESTED Calculation of the required flexural reinforcement Check of slab stresses due to the application of dead, live, and post-tensioning
loads.
RESULTS COMPARISON Table 1 shows the comparison of the SAFE total factored moments, required mild steel reinforcing, and slab stresses with independent hand calculations.
EXAMPLE Hong Kong CP-04 PT-SL-001 - 2

Software VerificationPROGRAM NAME: SAFE REVISION NO.: 0
Table 1 Comparison of Results
FEATURE TESTED INDEPENDENT RESULTS
SAFE RESULTS DIFFERENCE
Factored moment, Mu (KN-m)
174.4 174.4 0.00%
Area of Mild Steel req’d, As (cm2) 19.65 19.79 0.35%
Transfer Conc. Stress, top (D+PTI), MPa −5.056 −5.056 0.00%
Transfer Conc. Stress, bot (D+PTI), MPa 2.836 2.839 0.11%
Normal Conc. Stress, top (D+L+PTF), MPa −10.547 −10.465 0.77%
Normal Conc. Stress, top (D+L+PTF), MPa 8.323 8.407 1.01%
COMPUTER FILE: HONG KONG CP-04 PT-SL-001.FDB
CONCLUSION The SAFE results show an acceptable comparison with the independent results.
EXAMPLE Hong Kong CP-04 PT-SL-001 - 3

Software Verification PROGRAM NAME: SAFE REVISION NO.: 0
HAND CALCULATIONS:
Design Parameters:
Mild Steel Reinforcing Post-Tensioning
fc = 30 MPa fpu = 1862 MPa fy = 400 MPa fpy = 1675 MPa Stressing Loss = 186 MPa Long-Term Loss = 94 MPa fi = 1490 MPa fe = 1210 MPa
γm, steel = 1.15
γm, concrete = 1.50
Length, L = 9754 mm
Elevation Section
Prestressing tendon, Ap
Mild Steel, As
914 mm25 mm
229 mm
254 mm
Length, L = 9754 mm
Elevation Section
Prestressing tendon, Ap
Mild Steel, As
914 mm25 mm
229 mm
254 mm
Loads:
Dead, self-wt = 0.254 m × 23.56 kN/m3 = 5.984 kN/m2 (D) × 1.4 = 8.378 kN/m2 (Du) Live, = 4.788 kN/m2 (L) × 1.6 = 7.661 kN/m2 (Lu) Total = 10.772 kN/m2 (D+L) = 16.039 kN/m2 (D+L)ult
ω =10.772 kN/m2 × 0.914 m = 9.846 kN/m, uω = 16.039 kN/m2 × 0.914 m = 14.659 kN/m
Ultimate Moment, 2
1
8UwlM = = ( )214.659 9.754 8× = 174.4 kN-m
EXAMPLE Hong Kong CP-04 PT-SL-001 - 4

Software Verification PROGRAM NAME: SAFE REVISION NO.: 0
Ultimate Stress in strand, 7000 1 1 7 pu ppb pe
cu
f Af f .
l / d f bd
= + −
7000 1862(198)1210 1 1.7
9.754 / 0.229 30(914)(229)1358 MPa 0.7 1303 MPapuf
= + −
= ≤ =
K factor used to determine the effective depth is given as:
2bdfMK
cu
= = =2
174.4 0.121330000(0.914)(0.229)
< 0.156
dKdz 95.09.0
25.05.0 ≤
−+= = 192.2 mm
Ultimate force in PT, ( ), ( ) 197.4 1303 1000 257.2 KN= = =ult PT P PSF A f
Ultimate moment due to PT, ( ), , ( ) / 257.2 0.192 1.15 43.00 KN-mγ= = =ult PT ult PTM F z Net Moment to be resisted by As, NET U PTM M M= −
= − =174.4 43.00 131.40 kN-m
The area of tensile steel reinforcement is then given by:
zf
MAy
s 87.0= =
( )( )( ) 2131.40 1 6 1965mm
0.87 400 192e =
Check of Concrete Stresses at Midspan: Initial Condition (Transfer), load combination (D+PTi) = 1.0D+0.0L+1.0PTI
Tendon stress at transfer = jacking stress − stressing losses = 1490 − 186 = 1304 MPa The force in the tendon at transfer, = ( )( )1304 2 99 1000 258.2 kN=
Moment due to dead load, ( )( )25.984 0.914 9.754 8 65.04 kN-m= =DM Moment due to PT, ( )(sag) 258.2 101.6 mm 1000 26.23 kN-m= = =PT PTIM F
Stress in concrete,( )
258.2 65.04 26.230.254 0.914 0.00983 0.00983
−= ± ± = ± ±PTI D PTF M Mf
A S S
where S = 0.00983 m3
1.112 6.6166 2.668 MPaf = − ± ± 5.060(Comp) max, 2.836(Tension) maxf = −
EXAMPLE Hong Kong CP-04 PT-SL-001 - 5

Software Verification PROGRAM NAME: SAFEREVISION NO.: 0
Normal Condition, load combinations: (D+L+PTF) = 1.0D+1.0L+1.0PTF
Tendon stress at normal = jacking − stressing − long-term = 1490 − 186 − 94 = 1210 MPa The force in tendon at normal, = ( )( )1210 2 99 1000 239.5 kN=
Moment due to dead load, ( )( )25.984 0.914 9.754 8 65.04 kN-m= =DM
Moment due to live load, ( )( )24.788 0.914 9.754 8 52.04 kN-m= =LMMoment due to PT, ( )(sag) 239.5 101.6 mm 1000 24.33 kN-m= = =PT PTIM F
Stress in concrete for (D+L+PTF),
( )258.2 117.08 24.33
0.254 0.914 0.00983 0.00983−
= ± ± = ± ±PTI D PTF M MfA S S1.112 11.910 2.475f = − ± ± 10.547(Comp) max, 8.323(Tension) maxf = −
EXAMPLE Hong Kong CP-04 PT-SL-001 - 6

Software Verification PROGRAM NAME: SAFE REVISION NO.: 0
EXAMPLE HONG KONG CP-04 RC-BM-001 Flexural and Shear Beam Design
PROBLEM DESCRIPTION The purpose of this example is to verify slab flexural design in SAFE. The load level is adjusted for the case corresponding to the following conditions:
The stress-block extends below the flange but remains within the balanced condition permitted by Hong Kong CP 2004.
The average shear stress in the beam is below the maximum shear stress allowed by Hong Kong CP 2004, requiring design shear reinforcement.
A simple-span, 6-m-long, 300-mm-wide, and 500-mm-deep T beam with a flange 100 mm thick and 600 mm wide is modeled using SAFE. The beam is shown in Figure 1. The computational model uses a finite element mesh of frame elements, automatically generated by SAFE. The maximum element size has been specified to be 200 mm. The beam is supported by columns without rotational stiffnesses and with very large vertical stiffness (1×10²⁰ kN/m).
The beam is loaded with symmetric third-point loading. One dead load case (DL20) and one live load case (LL80) with only symmetric third-point loads of magnitudes 20, and 80 kN, respectively, are defined in the model. One load combinations (COMB80) is defined using the Hong Kong CP 2004 load combination factors of 1.4 for dead loads and 1.6 for live loads. The model is analyzed for both of these load cases and the load combinations.
The beam moment and shear force are computed analytically. The total factored moment and shear force are compared with the SAFE results. These moment and shear force are identical. After completing the analysis, design is performed using the Hong Kong CP 2004 code in SAFE and also by hand computation. The design longitudinal reinforcements are compared in Table 1. The design shear reinforcements are compared in Table 2.
EXAMPLE HONG KONG CP-04 RC-BM-001 - 1

Software Verification PROGRAM NAME: SAFE REVISION NO.: 0
Beam Section
75 mm 100 mm
300 mm
600 mm
75 mm
500 mm
Shear Force
Bending Moment
2000 mm 2000 mm 2000 mm
Beam Section
75 mm 100 mm
300 mm
600 mm
75 mm
500 mm
Shear Force
Bending Moment
2000 mm 2000 mm 2000 mm
Figure 1 The Model Beam for Flexural and Shear Design
EXAMPLE HONG KONG CP-04 RC-BM-001 - 2

Software Verification PROGRAM NAME: SAFE REVISION NO.: 0
GEOMETRY, PROPERTIES AND LOADING Clear span, l = 6000 mm Overall depth, h = 500 mm Flange Thickness, ds = 100 mm Width of web, bw = 300 mm Width of flange, bf = 600 mm Depth of tensile reinf., dc = 75 mm Effective depth, d = 425 mm Depth of comp. reinf., d' = 75 mm Concrete strength, f'
c = 30 MPa Yield strength of steel, fy = 460 MPa Concrete unit weight, wc = 0 kN/m3 Modulus of elasticity, Ec = 25×105 MPa Modulus of elasticity, Es = 2×10⁸ MPa Poisson’s ratio, v = 0.2 Dead load, Pd = 20 kN Live load, Pl = 80 kN
TECHNICAL FEATURES OF SAFE TESTED Calculation of flexural and shear reinforcement Application of minimum flexural and shear reinforcement
RESULTS COMPARISON Table 1 shows the comparison of the SAFE total factored moments in the design strip with the moments obtained by the analytical method. They match exactly for this problem. Table 1 also shows the comparison of design reinforcements.
Table 1 Comparison of Moments and Flexural Reinforcements
Method Moment (kN-m)
Reinforcement Area (sq-cm)
As+
SAFE 312 20.904
Calculated 312 20.904
,mins+A = 195.00 sq-mm
EXAMPLE HONG KONG CP-04 RC-BM-001 - 3

Software Verification PROGRAM NAME: SAFEREVISION NO.: 0
Table 2 Comparison of Shear Reinforcements
Shear Force (kN)
Reinforcement Area, s
Av
(sq-cm/m)
SAFE Calculated
156 6.50 6.50
COMPUTER FILE: Hong Kong CP-04 RC-BM-001.FDB
CONCLUSION The SAFE results show an approximate comparison with the independent results.
EXAMPLE HONG KONG CP-04 RC-BM-001 - 4

Software Verification PROGRAM NAME: SAFE REVISION NO.: 0
HAND CALCULATION
Flexural Design The following quantities are computed for all the load combinations:
γm, steel = 1.15
γm, concrete = 1.50
min 0 0013=s , wA . b h
= 195.00 sq-mm
COMB80 P = (1.4Pd + 1.6Pt) =156 kN
**
3N lM = = 312 kN-m
The depth of the compression block is given by:
K = 2dbfM
fcu
= 0.095963 < 0.156
Then the moment arm is computed as:
z = d
−+9.0
25.05.0 K ≤ 0.95d = 373.4254 mm
The depth of the neutral axis is computed as:
x = 45.01 (d − z) = 114.6102 mm
And the depth of the compression block is given by: a = 0.9x = 103.1492 mm > hf
The ultimate resistance moment of the flange is given by:
( ) ( )0.67 0.5f cu f w f fc
M f b b h d hγ
= − − = 150.75 kN-m
EXAMPLE HONG KONG CP-04 RC-BM-001 - 5

Software Verification PROGRAM NAME: SAFE REVISION NO.: 0
The moment taken by the web is computed as:
fw MMM −= = 161.25 kN-m
and the normalized moment resisted by the web is given by:
Kw = 2w
cu w
Mf b d
= 0.0991926 < 0.156
If Kw ≤ 0.156 (BS 3.4.4.4), the beam is designed as a singly reinforced concrete beam. The reinforcement is calculated as the sum of two parts: one to balance compression in the flange and one to balance compression in the web.
dKdz w 95.09.0
25.05.0 ≤
−+= = 371.3988 mm
( )0.5
f ws
y yf
s s
M MA f fd h z
γ γ
= +−
= 2090.4 sq-mm
Shear Design
maxvdb
Vvw
≤= = 1.2235 MPa
vmax = min(0.8 cuf , 5 MPa) = 4.38178 MPa
The shear stress carried by the concrete, vc, is calculated as:
41
31
21 40010079.0
=
dbdAkkv s
mc γ
= 0.3568 MPa
k1 is the enhancement factor for support compression, and is conservatively taken as 1 .
k2 = 3
1
25
cuf = 1.06266, 1 ≤ k2 ≤
31
2540
γm = 1.25
bdAs100 = 0.15
EXAMPLE HONG KONG CP-04 RC-BM-001 - 6

Software VerificationPROGRAM NAME: SAFE REVISION NO.: 0
41
400
d = 1
However, the following limitations also apply:
0.15 ≤ bd
As100 ≤ 3
41
400
d ≥ 1
fcu ≤ 40 MPa (for calculation purposes only) and As is the area of tension reinforcement.
Given v, vc, and vmax, the required shear reinforcement is calculated as follows:
If v ≤ (vc + 0.4),
yv
w
v
sv
fb
sA
87.04.0
=
If (vc + 0.4) < v ≤ vmax,
( )yv
wc
v
sv
fbvv
sA
87.0−
=
If v > vmax, a failure condition is declared.
(COMB80) Pd = 20 kN Pl = 80 kN V = 156 kN
ν* = db
V
w
*
= 2.0 MPa (φsνc < ν* ≤ φsνmax)
( )yv
wc
v
sv
fbvv
sA
87.0−
= = 0.64967sq-mm/mm = 6.50 sq-cm/m
EXAMPLE HONG KONG CP-04 RC-BM-001 - 7

Software Verification PROGRAM NAME: SAFE REVISION NO.: 0
EXAMPLE Hong Kong CP-04 RC-PN-001 Slab Punching Shear Design
PROBLEM DESCRIPTION The purpose of this example is to verify slab punching shear design in SAFE
The numerical example is a flat slab that has three 8-m spans in each direction, as shown in Figure 1.
4
A
3
2
1
B C D
X
Y
0.3 m0.3 m8 m8 m8 m
0.6 m
0.6 m
0.25 m thick flat slab
LoadingDL = Self weight + 1.0 kN/m2
LL = 4.0 kN/m2
Columns are 0.3 m x 0.9 mwith long side parallel to the Y-axis, typical
Concrete PropertiesUnit weight = 24 kN/m3
f'c = 30 N/mm2
8 m
8 m
8 m
4
A
3
2
1
B C D
X
Y
0.3 m0.3 m8 m8 m8 m
0.6 m
0.6 m
0.25 m thick flat slab
LoadingDL = Self weight + 1.0 kN/m2
LL = 4.0 kN/m2
Columns are 0.3 m x 0.9 mwith long side parallel to the Y-axis, typical
Concrete PropertiesUnit weight = 24 kN/m3
f'c = 30 N/mm2
8 m
8 m
8 m
Figure 1: Flat Slab for Numerical Example
The slab overhangs beyond the face of the column by 0.15 m along each side of the structure. The columns are typically 0.3 m x 0.9 m with the long side parallel to the Y-axis. The slab is typically 0.25 m thick. Thick plate properties are used for the slab.
The concrete has a unit weight of 24 kN/m3 and a fcu of 30 N/mm2. The dead load consists of the self weight of the structure plus an additional 1 kN/m2. The live load is 4 kN/m2.
EXAMPLE Hong Kong CP-04 RC-PN-001 - 1

Software Verification PROGRAM NAME: SAFE REVISION NO.: 0
TECHNICAL FEATURES OF SAFE TESTED Calculation of punching shear capacity, shear stress and D/C ratio.
RESULTS COMPARISON Table 1 shows the comparison of the punching shear capacity, shear stress ratio and D/C ratio obtained from SAFE with the punching shear capacity, shear stress ratio and D/C ratio obtained by the analytical method. They match exactly for this problem.
Table 1 Comparison of Design Results for Punching Shear at Grid B-2
Method Shear Stress
(N/mm2) Shear Capacity
(N/mm2) D/C ratio
SAFE 1.105 0.625 1.77
Calculated 1.105 0.625 1.77
COMPUTER FILE: HONG KONG CP-04 RC-PN-001.FDB
CONCLUSION The SAFE results show an exact comparison with the independent results.
EXAMPLE Hong Kong CP-04 RC-PN-001 - 2

Software VerificationPROGRAM NAME: SAFE REVISION NO.: 0
HAND CALCULATION Hand Calculation For Interior Column Using SAFE Method
( ) ( )[ ]250 26 250 38 2= − + −d = 218 mm
Refer to Figure 1. u = 954+ 1554 + 954 + 1554 = 5016 mm
450
450
X
Y
1554
954
Side 2
Side
3
A B
CD
Column
Side
1
Side 4
Center of column is point (x1, y1). Set this equal to (0,0).
Critical section for punching shear shown dashed.
150
327
327
Note: All dimensions in millimeters
150 327
X
Y
Side 2A B
CD
327
Note: All dimensions in millimeters
450
450
X
Y
1554
954
Side 2
Side
3
A B
CD
Column
Side
1
Side 4
Center of column is point (x1, y1). Set this equal to (0,0).
Critical section for punching shear shown dashed.
150
327
327
Note: All dimensions in millimeters
150 327
X
Y
Side 2A B
CD
327
Note: All dimensions in millimeters
Figure 2: Interior Column, Grid B-2 in SAFE Model
From the SAFE output at Grid B-2: V= 1126.498 kN M2 = 51.9908 kN-m M3 = 45.7234 kN-m
EXAMPLE Hong Kong CP-04 RC-PN-001 - 3

Software Verification PROGRAM NAME: SAFEREVISION NO.: 0
Maximum design shear stress in computed in along major and minor axis of column:
,
1.5 = +
eff x
MV xv fud Vy
3 6
, 31126.498 10 1.5 51.9908 101.0 1.1049
5016 218 1126.498 10 954 • • •
= + = • • • eff xv (Govern)
,
1.5 = +
eff y
MV yv fud Vx
3 6
, 31126.498 10 1.5 45.7234 101.0 1.0705
5016 218 1126.498 10 1554 • • •
= + = • • • eff yv
The largest absolute value of v = 1.1049 N/mm2
The shear stress carried by the concrete, vc, is calculated as:
41
31
21 40010079.0
=
dbdAkkv s
mc γ
= 0.3568 MPa
k1 is the enhancement factor for support compression, and is conservatively taken as 1 .
k2 = 3
1
25
cuf =
1330
25
= 1.0627 > 1.0 OK
γm = 1.25
41
400
d = 1.16386 > 1 OK.
fcu ≤ 40 MPa (for calculation purposes only) and As is the area of tension reinforcement.
Area of reinforcement at the face of column for design strip are as follows: As in Strip Layer A = 9494.296 mm2
As in Strip Layer B = 8314.486 mm2
EXAMPLE Hong Kong CP-04 RC-PN-001 - 4

Software Verification PROGRAM NAME: SAFE REVISION NO.: 0
Average As = ( )9494 296 8314 486 2+. . = 8904.391 mm2
bdAs100 = ( )100 8904 391 8000 218• •. = 0.51057
( )1/30.79 1.0 1.0627 0.51057 1.163861.25
• •= • •cv = 0.6247 MPa
BS 3.7.7.3 yields the value of v = 0.625 N/mm2 , and thus this is the shear capacity.
1.1049Shear Ratio 1.770.6247
= = =Uvv
EXAMPLE Hong Kong CP-04 RC-PN-001 - 5

Software Verification PROGRAM NAME: SAFE REVISION NO.: 0
EXAMPLE Hong Kong CP-04 RC-SL-001 Slab Flexural Design
PROBLEM DESCRIPTION The purpose of this example is to verify slab flexural design in SAFE.
A one-way, simple-span slab supported by walls on two opposite edges is modeled using SAFE. The slab is 150 mm thick and spans 4 meters between walls. The walls are modeled as pin supports. The computational model uses a finite element mesh, automatically generated by SAFE. The maximum element size is specified as 0.25 meters. To obtain factored moments and flexural reinforcement in a design strip, one one-meter wide strip is defined in the X-direction on the slab, as shown in Figure 1.
Figure 1 Plan View of One-Way Slab
One dead load case (DL4KPa) and one live load case (LL5KPa) with uniformly distributed surface loads of magnitudes 4 and 5 kN/m2, respectively, are defined in the model. A load combination (COMB5kPa) is defined using the Hong Kong CP-04 load combination factors, 1.4 for dead loads and 1.6 for live loads. The model is analyzed for both load cases and the load combination.
The slab moment on a strip of unit width is computed analytically. The total factored strip moments are compared with the SAFE results. After completing analysis, design is performed using the Hong Kong CP-04 code by SAFE and also by hand computation. Table 1 shows the comparison of the design reinforcements computed using the two methods.
EXAMPLE Hong Kong CP-04 RC-SL-001 - 1

Software Verification PROGRAM NAME: SAFEREVISION NO.: 0
GEOMETRY, PROPERTIES AND LOADING Thickness T, h = 150 mm Depth of tensile reinf. dc = 25 mm Effective depth d = 125 mm Clear span ln, l1 = 4000 mm
Concrete strength fc = 30 MPa Yield strength of steel fsy = 460 MPa Concrete unit weight wc = 0 N/m3 Modulus of elasticity Ec = 25000 MPa Modulus of elasticity Es = 2×10⁶ MPa Poisson’s ratio ν = 0
Dead load wd = 4.0 kPa Live load wl = 5.0 kPa
TECHNICAL FEATURES OF SAFE TESTED Calculation of flexural reinforcement Application of minimum flexural reinforcement
RESULTS COMPARISON Table 1 shows the comparison of the SAFE total factored moments in the design strip with the moments obtained by the hand computation method. Table 1 also shows the comparison of the design reinforcements.
Table 1 Comparison of Design Moments and Reinforcements
Load Level Method
Strip Moment (kN-m)
Reinforcement Area (sq-cm)
As+
Medium SAFE 27.197 5.853
Calculated 27.200 5.842
,minA s+ = 162.5 sq-mm
EXAMPLE Hong Kong CP-04 RC-SL-001 - 2

Software VerificationPROGRAM NAME: SAFE REVISION NO.: 0
COMPUTER FILE: Hong Kong CP-04 RC-SL-001.FDB
CONCLUSION The SAFE results show an acceptable comparison with the independent results.
EXAMPLE Hong Kong CP-04 RC-SL-001 - 3

Software Verification PROGRAM NAME: SAFE REVISION NO.: 0
HAND CALCULATION The following quantities are computed for the load combination:
γm, steel = 1.15
γm, concrete = 1.50 b = 1000 mm
For the load combination, the w and M are calculated as follows: w = (1.4wd + 1.6wt) b
21
8wlM =
As,min = 0.0013bwd = 162.5 sq-mm
COMB100 wd = 4.0 kPa wt = 5.0 kPa w = 13.6 kN/m M-strip = 27.2 kN-m M-design = 27.2366 kN-m
The depth of the compression block is given by:
2bdfMK
cu
= = 0.05810 < 0.156
The area of tensile steel reinforcement is then given by:
dKdz 95.09.0
25.05.0 ≤
−+= =116.3283
zf
MAy
s 87.0= = 585.046 sq-mm > As,min
As = 5.850 sq-cm
EXAMPLE Hong Kong CP-04 RC-SL-001 - 4

Software Verification PROGRAM NAME: SAFE REVISION NO.: 0
EXAMPLE Hong Kong CP-2013 PT-SL-001 Post-Tensioned Slab Design
PROBLEM DESCRIPTION The purpose of this example is to verify the slab stresses and the required area of mild steel strength reinforcing for a post-tensioned slab.
A one-way, simply supported slab is modeled in SAFE. The modeled slab is 254 mm thick by 914 mm wide and spans 9754 mm, as shown in shown in Figure 1.
Length, L = 9754 mm
Elevation Section
Prestressing tendon, Ap
Mild Steel, As
914 mm25 mm
229 mm
254 mm
Length, L = 9754 mm
Elevation Section
Prestressing tendon, Ap
Mild Steel, As
914 mm25 mm
229 mm
254 mm
Figure 1 One-Way Slab
EXAMPLE Hong Kong CP-2013 PT-SL-001 - 1

Software Verification PROGRAM NAME: SAFEREVISION NO.: 0
To ensure one-way action Poisson’s ratio is taken to be zero. A 254-mm-wide design strip is centered along the length of the slab and has been defined as an A-Strip. B-strips have been placed at each end of the span, perpendicular to Strip-A (the B-Strips are necessary to define the tendon profile). A tendon with twostrands, each having an area of 99 mm2, was added to the A-Strip. The self weightand live loads were added to the slab. The loads and post-tensioning forces are asfollows:
Loads: Dead = self weight, Live = 4.788 kN/m2
The total factored strip moments, required area of mild steel reinforcement and slab stresses are reported at the midspan of the slab. Independent hand calculations were compared with the SAFE results and summarized for verification and validation of the SAFE results.
GEOMETRY, PROPERTIES AND LOADING Thickness T, h = 254 mm Effective depth d = 229 mm Clear span L = 9754 mm
Concrete strength f 'c = 30 MPa Yield strength of steel fy = 400 MPa Prestressing, ultimate fpu = 1862 MPa Prestressing, effective fe = 1210 MPa Area of Prestress (single strand) Ap = 198 mm2 Concrete unit weight wc = 23.56 KN/m3 Modulus of elasticity Ec = 25000 N/mm3 Modulus of elasticity Es = 200,000 N/mm3 Poisson’s ratio ν = 0
Dead load wd = self KN/m2 Live load wl = 4.788 KN/m2
TECHNICAL FEATURES OF SAFE TESTED Calculation of the required flexural reinforcement Check of slab stresses due to the application of dead, live, and post-tensioning
loads.
RESULTS COMPARISON Table 1 shows the comparison of the SAFE total factored moments, required mild steel reinforcing, and slab stresses with independent hand calculations.
EXAMPLE Hong Kong CP-2013 PT-SL-001 - 2

Software VerificationPROGRAM NAME: SAFE REVISION NO.: 0
Table 1 Comparison of Results
FEATURE TESTED INDEPENDENT RESULTS
SAFE RESULTS DIFFERENCE
Factored moment, Mu (KN-m)
174.4 174.4 0.00%
Area of Mild Steel req’d, As (cm2) 19.65 19.79 0.35%
Transfer Conc. Stress, top (D+PTI), MPa −5.056 −5.056 0.00%
Transfer Conc. Stress, bot (D+PTI), MPa 2.836 2.839 0.11%
Normal Conc. Stress, top (D+L+PTF), MPa −10.547 −10.465 0.77%
Normal Conc. Stress, top (D+L+PTF), MPa 8.323 8.407 1.01%
COMPUTER FILE: HONG KONG CP-13 PT-SL-001.FDB
CONCLUSION The SAFE results show an acceptable comparison with the independent results.
EXAMPLE Hong Kong CP-2013 PT-SL-001 - 3

Software Verification PROGRAM NAME: SAFE REVISION NO.: 0
HAND CALCULATIONS:
Design Parameters:
Mild Steel Reinforcing Post-Tensioning
fc = 30 MPa fpu = 1862 MPa fy = 400 MPa fpy = 1675 MPa Stressing Loss = 186 MPa Long-Term Loss = 94 MPa fi = 1490 MPa fe = 1210 MPa
γm, steel = 1.15
γm, concrete = 1.50
Length, L = 9754 mm
Elevation Section
Prestressing tendon, Ap
Mild Steel, As
914 mm25 mm
229 mm
254 mm
Length, L = 9754 mm
Elevation Section
Prestressing tendon, Ap
Mild Steel, As
914 mm25 mm
229 mm
254 mm
Loads:
Dead, self-wt = 0.254 m × 23.56 kN/m3 = 5.984 kN/m2 (D) × 1.4 = 8.378 kN/m2 (Du) Live, = 4.788 kN/m2 (L) × 1.6 = 7.661 kN/m2 (Lu) Total = 10.772 kN/m2 (D+L) = 16.039 kN/m2 (D+L)ult
ω =10.772 kN/m2 × 0.914 m = 9.846 kN/m, uω = 16.039 kN/m2 × 0.914 m = 14.659 kN/m
Ultimate Moment, 2
1
8UwlM = = ( )214.659 9.754 8× = 174.4 kN-m
EXAMPLE Hong Kong CP-2013 PT-SL-001 - 4

Software VerificationPROGRAM NAME: SAFE REVISION NO.: 0
Ultimate Stress in strand, 7000 1 1 7 pu ppb pe
cu
f Af f .
l / d f bd
= + − 7000 1862(198)1210 1 1.7
9.754 / 0.229 30(914)(229)1358 MPa 0.7 1303 MPapuf
= + −
= ≤ =
K factor used to determine the effective depth is given as:
2bdfMK
cu
= = =2
174.4 0.121330000(0.914)(0.229)
< 0.156
dKdz 95.09.0
25.05.0 ≤
−+= = 192.2 mm
Ultimate force in PT, ( ), ( ) 197.4 1303 1000 257.2 KN= = =ult PT P PSF A f
Ultimate moment due to PT, ( ), , ( ) / 257.2 0.192 1.15 43.00 KN-mγ= = =ult PT ult PTM F z
Net Moment to be resisted by As, NET U PTM M M= −= − =174.4 43.00 131.40 kN-m
The area of tensile steel reinforcement is then given by:
zfMA
ys 87.0= =
( )( )( ) 2131.40 1 6 1965mm
0.87 400 192e =
Check of Concrete Stresses at Midspan:
Initial Condition (Transfer), load combination (D+PTi) = 1.0D+0.0L+1.0PTI
Tendon stress at transfer = jacking stress − stressing losses = 1490 − 186 = 1304 MPa The force in the tendon at transfer, = ( )( )1304 2 99 1000 258.2 kN=
Moment due to dead load, ( )( )25.984 0.914 9.754 8 65.04 kN-m= =DM Moment due to PT, ( )(sag) 258.2 101.6 mm 1000 26.23 kN-m= = =PT PTIM F
Stress in concrete,( )
258.2 65.04 26.230.254 0.914 0.00983 0.00983
−= ± ± = ± ±PTI D PTF M Mf
A S Swhere S = 0.00983 m3
1.112 6.6166 2.668 MPaf = − ± ± 5.060(Comp) max, 2.836(Tension) maxf = −
EXAMPLE Hong Kong CP-2013 PT-SL-001 - 5

Software Verification PROGRAM NAME: SAFEREVISION NO.: 0
Normal Condition, load combinations: (D+L+PTF) = 1.0D+1.0L+1.0PTF
Tendon stress at normal = jacking − stressing − long-term = 1490 − 186 − 94 = 1210 MPa The force in tendon at normal, = ( )( )1210 2 99 1000 239.5 kN=
Moment due to dead load, ( )( )25.984 0.914 9.754 8 65.04 kN-m= =DM
Moment due to live load, ( )( )24.788 0.914 9.754 8 52.04 kN-m= =LMMoment due to PT, ( )(sag) 239.5 101.6 mm 1000 24.33 kN-m= = =PT PTIM F
Stress in concrete for (D+L+PTF),
( )258.2 117.08 24.33
0.254 0.914 0.00983 0.00983−
= ± ± = ± ±PTI D PTF M MfA S S1.112 11.910 2.475f = − ± ± 10.547(Comp) max, 8.323(Tension) maxf = −
EXAMPLE Hong Kong CP-2013 PT-SL-001 - 6

Software Verification PROGRAM NAME: SAFE REVISION NO.: 0
EXAMPLE HONG KONG CP-2013 RC-BM-001 Flexural and Shear Beam Design
PROBLEM DESCRIPTION The purpose of this example is to verify slab flexural design in SAFE. The load level is adjusted for the case corresponding to the following conditions:
The stress-block extends below the flange but remains within the balanced condition permitted by Hong Kong CP 2013.
The average shear stress in the beam is below the maximum shear stress allowed by Hong Kong CP 2013, requiring design shear reinforcement.
A simple-span, 6-m-long, 300-mm-wide, and 500-mm-deep T beam with a flange 100 mm thick and 600 mm wide is modeled using SAFE. The beam is shown in Figure 1. The computational model uses a finite element mesh of frame elements, automatically generated by SAFE. The maximum element size has been specified to be 200 mm. The beam is supported by columns without rotational stiffnesses and with very large vertical stiffness (1×10²⁰ kN/m).
The beam is loaded with symmetric third-point loading. One dead load case (DL20) and one live load case (LL80) with only symmetric third-point loads of magnitudes 20, and 80 kN, respectively, are defined in the model. One load combinations (COMB80) is defined using the Hong Kong CP 2013 load combination factors of 1.4 for dead loads and 1.6 for live loads. The model is analyzed for both of these load cases and the load combinations.
The beam moment and shear force are computed analytically. The total factored moment and shear force are compared with the SAFE results. These moment and shear force are identical. After completing the analysis, design is performed using the Hong Kong CP 2013 code in SAFE and also by hand computation. The design longitudinal reinforcements are compared in Table 1. The design shear reinforcements are compared in Table 2.
EXAMPLE HONG KONG CP-2013 RC-BM-001 - 1

Software Verification PROGRAM NAME: SAFE REVISION NO.: 0
Beam Section
75 mm 100 mm
300 mm
600 mm
75 mm
500 mm
Shear Force
Bending Moment
2000 mm 2000 mm 2000 mm
Beam Section
75 mm 100 mm
300 mm
600 mm
75 mm
500 mm
Shear Force
Bending Moment
2000 mm 2000 mm 2000 mm
Figure 1 The Model Beam for Flexural and Shear Design
EXAMPLE HONG KONG CP-2013 RC-BM-001 - 2

Software VerificationPROGRAM NAME: SAFE REVISION NO.: 0
GEOMETRY, PROPERTIES AND LOADING Clear span, l = 6000 mm Overall depth, h = 500 mm Flange Thickness, ds = 100 mm Width of web, bw = 300 mm Width of flange, bf = 600 mm Depth of tensile reinf., dc = 75 mm Effective depth, d = 425 mm Depth of comp. reinf., d' = 75 mm
Concrete strength, f'c = 30 MPa
Yield strength of steel, fy = 460 MPa Concrete unit weight, wc = 0 kN/m3 Modulus of elasticity, Ec = 25×105 MPa Modulus of elasticity, Es = 2×10⁸ MPa Poisson’s ratio, v = 0.2
Dead load, Pd = 20 kN Live load, Pl = 80 kN
TECHNICAL FEATURES OF SAFE TESTED Calculation of flexural and shear reinforcement Application of minimum flexural and shear reinforcement
RESULTS COMPARISON Table 1 shows the comparison of the SAFE total factored moments in the design strip with the moments obtained by the analytical method. They match exactly for this problem. Table 1 also shows the comparison of design reinforcements.
Table 1 Comparison of Moments and Flexural Reinforcements
Method Moment (kN-m)
Reinforcement Area (sq-cm)
As+
SAFE 312 20.904
Calculated 312 20.904
,mins+A = 195.00 sq-mm
EXAMPLE HONG KONG CP-2013 RC-BM-001 - 3

Software Verification PROGRAM NAME: SAFE REVISION NO.: 0
Table 2 Comparison of Shear Reinforcements
Shear Force (kN)
Reinforcement Area, s
Av
(sq-cm/m)
SAFE Calculated
156 6.50 6.50
COMPUTER FILE: Hong Kong CP-13 RC-BM-001.FDB
CONCLUSION The SAFE results show an approximate comparison with the independent results.
EXAMPLE HONG KONG CP-2013 RC-BM-001 - 4

Software Verification PROGRAM NAME: SAFE REVISION NO.: 0
HAND CALCULATION
Flexural Design The following quantities are computed for all the load combinations:
γm, steel = 1.15
γm, concrete = 1.50
min 0 0013=s , wA . b h
= 195.00 sq-mm
COMB80 P = (1.4Pd + 1.6Pt) =156 kN
**
3N lM = = 312 kN-m
The depth of the compression block is given by:
K = 2dbfM
fcu
= 0.095963 < 0.156
Then the moment arm is computed as:
z = d
−+9.0
25.05.0 K ≤ 0.95d = 373.4254 mm
The depth of the neutral axis is computed as:
x = 45.01 (d − z) = 114.6102 mm
And the depth of the compression block is given by: a = 0.9x = 103.1492 mm > hf
The ultimate resistance moment of the flange is given by:
( ) ( )0.67 0.5f cu f w f fc
M f b b h d hγ
= − − = 150.75 kN-m
EXAMPLE HONG KONG CP-2013 RC-BM-001 - 5

Software Verification PROGRAM NAME: SAFEREVISION NO.: 0
The moment taken by the web is computed as:
fw MMM −= = 161.25 kN-m
and the normalized moment resisted by the web is given by:
Kw = 2w
cu w
Mf b d
= 0.0991926 < 0.156
If Kw ≤ 0.156 (BS 3.4.4.4), the beam is designed as a singly reinforced concrete beam. The reinforcement is calculated as the sum of two parts: one to balance compression in the flange and one to balance compression in the web.
dKdz w 95.09.0
25.05.0 ≤
−+= = 371.3988 mm
( )0.5
f ws
y yf
s s
M MA f fd h z
γ γ
= +−
= 2090.4 sq-mm
Shear Design
maxvdb
Vvw
≤= = 1.2235 MPa
vmax = min(0.8 cuf , 5 MPa) = 4.38178 MPa
The shear stress carried by the concrete, vc, is calculated as:
41
31
21 40010079.0
=
dbdAkkv s
mc γ
= 0.3568 MPa
k1 is the enhancement factor for support compression, and is conservatively taken as 1 .
k2 = 3
1
25
cuf = 1.06266, 1 ≤ k2 ≤
31
2540
γm = 1.25
bdAs100 = 0.15
EXAMPLE HONG KONG CP-2013 RC-BM-001 - 6

Software VerificationPROGRAM NAME: SAFE REVISION NO.: 0
41
400
d = 1
However, the following limitations also apply:
0.15 ≤ bd
As100 ≤ 3
41
400
d ≥ 1
fcu ≤ 40 MPa (for calculation purposes only) and As is the area of tension reinforcement.
Given v, vc, and vmax, the required shear reinforcement is calculated as follows:
If v ≤ (vc + 0.4),
yv
w
v
sv
fb
sA
87.04.0
=
If (vc + 0.4) < v ≤ vmax,
( )yv
wc
v
sv
fbvv
sA
87.0−
=
If v > vmax, a failure condition is declared.
(COMB80) Pd = 20 kN Pl = 80 kN V = 156 kN
ν* = db
V
w
*
= 2.0 MPa (φsνc < ν* ≤ φsνmax)
( )yv
wc
v
sv
fbvv
sA
87.0−
= = 0.64967sq-mm/mm = 6.50 sq-cm/m
EXAMPLE HONG KONG CP-2013 RC-BM-001 - 7

Software Verification PROGRAM NAME: SAFE REVISION NO.: 0
EXAMPLE Hong Kong CP-2013 RC-PN-001 Slab Punching Shear Design
PROBLEM DESCRIPTION The purpose of this example is to verify slab punching shear design in SAFE
The numerical example is a flat slab that has three 8-m spans in each direction, as shown in Figure 1.
4
A
3
2
1
B C D
X
Y
0.3 m0.3 m8 m8 m8 m
0.6 m
0.6 m
0.25 m thick flat slab
LoadingDL = Self weight + 1.0 kN/m2
LL = 4.0 kN/m2
Columns are 0.3 m x 0.9 mwith long side parallel to the Y-axis, typical
Concrete PropertiesUnit weight = 24 kN/m3
f'c = 30 N/mm2
8 m
8 m
8 m
4
A
3
2
1
B C D
X
Y
0.3 m0.3 m8 m8 m8 m
0.6 m
0.6 m
0.25 m thick flat slab
LoadingDL = Self weight + 1.0 kN/m2
LL = 4.0 kN/m2
Columns are 0.3 m x 0.9 mwith long side parallel to the Y-axis, typical
Concrete PropertiesUnit weight = 24 kN/m3
f'c = 30 N/mm2
8 m
8 m
8 m
Figure 1: Flat Slab for Numerical Example
The slab overhangs beyond the face of the column by 0.15 m along each side of the structure. The columns are typically 0.3 m x 0.9 m with the long side parallel to the Y-axis. The slab is typically 0.25 m thick. Thick plate properties are used for the slab.
The concrete has a unit weight of 24 kN/m3 and a fcu of 30 N/mm2. The dead load consists of the self weight of the structure plus an additional 1 kN/m2. The live load is 4 kN/m2.
EXAMPLE Hong Kong CP-2013 RC-PN-001 - 1

Software Verification PROGRAM NAME: SAFE REVISION NO.: 0
TECHNICAL FEATURES OF SAFE TESTED Calculation of punching shear capacity, shear stress and D/C ratio.
RESULTS COMPARISON Table 1 shows the comparison of the punching shear capacity, shear stress ratio and D/C ratio obtained from SAFE with the punching shear capacity, shear stress ratio and D/C ratio obtained by the analytical method. They match exactly for this problem.
Table 1 Comparison of Design Results for Punching Shear at Grid B-2
Method Shear Stress
(N/mm2) Shear Capacity
(N/mm2) D/C ratio
SAFE 1.105 0.625 1.77
Calculated 1.105 0.625 1.77
COMPUTER FILE: HONG KONG CP-13 RC-PN-001.FDB
CONCLUSION The SAFE results show an exact comparison with the independent results.
EXAMPLE Hong Kong CP-2013 RC-PN-001 - 2

Software VerificationPROGRAM NAME: SAFE REVISION NO.: 0
HAND CALCULATION Hand Calculation For Interior Column Using SAFE Method
( ) ( )[ ]250 26 250 38 2= − + −d = 218 mm
Refer to Figure 1. u = 954+ 1554 + 954 + 1554 = 5016 mm
450
450
X
Y
1554
954
Side 2
Side
3
A B
CD
Column
Side
1
Side 4
Center of column is point (x1, y1). Set this equal to (0,0).
Critical section for punching shear shown dashed.
150
327
327
Note: All dimensions in millimeters
150 327
X
Y
Side 2A B
CD
327
Note: All dimensions in millimeters
450
450
X
Y
1554
954
Side 2
Side
3
A B
CD
Column
Side
1
Side 4
Center of column is point (x1, y1). Set this equal to (0,0).
Critical section for punching shear shown dashed.
150
327
327
Note: All dimensions in millimeters
150 327
X
Y
Side 2A B
CD
327
Note: All dimensions in millimeters
Figure 2: Interior Column, Grid B-2 in SAFE Model
From the SAFE output at Grid B-2: V= 1126.498 kN M2 = 51.9908 kN-m M3 = 45.7234 kN-m
EXAMPLE Hong Kong CP-2013 RC-PN-001 - 3

Software Verification PROGRAM NAME: SAFE REVISION NO.: 0
Maximum design shear stress in computed in along major and minor axis of column:
,
1.5 = +
eff x
MV xv fud Vy
3 6
, 31126.498 10 1.5 51.9908 101.0 1.1049
5016 218 1126.498 10 954 • • •
= + = • • • eff xv (Govern)
,
1.5 = +
eff y
MV yv fud Vx
3 6
, 31126.498 10 1.5 45.7234 101.0 1.0705
5016 218 1126.498 10 1554 • • •
= + = • • • eff yv
The largest absolute value of v = 1.1049 N/mm2
The shear stress carried by the concrete, vc, is calculated as:
41
31
21 40010079.0
=
dbdAkkv s
mc γ
= 0.3568 MPa
k1 is the enhancement factor for support compression, and is conservatively taken as 1 .
k2 = 3
1
25
cuf =
1330
25
= 1.0627 > 1.0 OK
γm = 1.25
41
400
d = 1.16386 > 1 OK.
fcu ≤ 40 MPa (for calculation purposes only) and As is the area of tension reinforcement. Area of reinforcement at the face of column for design strip are as follows: As in Strip Layer A = 9494.296 mm2
As in Strip Layer B = 8314.486 mm2
EXAMPLE Hong Kong CP-2013 RC-PN-001 - 4

Software Verification PROGRAM NAME: SAFE REVISION NO.: 0
Average As = ( )9494 296 8314 486 2+. . = 8904.391 mm2
bdAs100 = ( )100 8904 391 8000 218• •. = 0.51057
( )1/30.79 1.0 1.0627 0.51057 1.163861.25
• •= • •cv = 0.6247 MPa
BS 3.7.7.3 yields the value of v = 0.625 N/mm2 , and thus this is the shear capacity.
1.1049Shear Ratio 1.770.6247
= = =Uvv
EXAMPLE Hong Kong CP-2013 RC-PN-001 - 5

Software VerificationPROGRAM NAME: SAFE REVISION NO.: 0
EXAMPLE Hong Kong CP-2013 RC-SL-001 Slab Flexural Design
PROBLEM DESCRIPTION The purpose of this example is to verify slab flexural design in SAFE.
A one-way, simple-span slab supported by walls on two opposite edges is modeled using SAFE. The slab is 150 mm thick and spans 4 meters between walls. The walls are modeled as pin supports. The computational model uses a finite element mesh, automatically generated by SAFE. The maximum element size is specified as 0.25 meters. To obtain factored moments and flexural reinforcement in a design strip, one one-meter wide strip is defined in the X-direction on the slab, as shown in Figure 1.
Figure 1 Plan View of One-Way Slab
One dead load case (DL4KPa) and one live load case (LL5KPa) with uniformly distributed surface loads of magnitudes 4 and 5 kN/m2, respectively, are defined in the model. A load combination (COMB5kPa) is defined using the Hong Kong CP-04 load combination factors, 1.4 for dead loads and 1.6 for live loads. The model is analyzed for both load cases and the load combination.
The slab moment on a strip of unit width is computed analytically. The total factored strip moments are compared with the SAFE results. After completing analysis, design is performed using the Hong Kong CP-04 code by SAFE and also by hand computation. Table 1 shows the comparison of the design reinforcements computed using the two methods.
EXAMPLE Hong Kong CP-2013 RC-SL-001 - 1

Software Verification PROGRAM NAME: SAFE REVISION NO.: 0 GEOMETRY, PROPERTIES AND LOADING
Thickness T, h = 150 mm Depth of tensile reinf. dc = 25 mm Effective depth d = 125 mm Clear span ln, l1 = 4000 mm Concrete strength fc = 30 MPa Yield strength of steel fsy = 460 MPa Concrete unit weight wc = 0 N/m3 Modulus of elasticity Ec = 25000 MPa Modulus of elasticity Es = 2×10⁶ MPa Poisson’s ratio ν = 0 Dead load wd = 4.0 kPa Live load wl = 5.0 kPa
TECHNICAL FEATURES OF SAFE TESTED Calculation of flexural reinforcement Application of minimum flexural reinforcement
RESULTS COMPARISON Table 1 shows the comparison of the SAFE total factored moments in the design strip with the moments obtained by the hand computation method. Table 1 also shows the comparison of the design reinforcements.
Table 1 Comparison of Design Moments and Reinforcements
Load Level Method
Strip Moment (kN-m)
Reinforcement Area (sq-cm)
As+
Medium SAFE 27.197 5.853
Calculated 27.200 5.842
,minA s+ = 162.5 sq-mm
EXAMPLE Hong Kong CP-2013 RC-SL-001 - 2

Software Verification PROGRAM NAME: SAFE REVISION NO.: 0 COMPUTER FILE: Hong Kong CP-13 RC-SL-001.FDB
CONCLUSION The SAFE results show an acceptable comparison with the independent results.
EXAMPLE Hong Kong CP-2013 RC-SL-001 - 3

Software Verification PROGRAM NAME: SAFEREVISION NO.: 0
HAND CALCULATION The following quantities are computed for the load combination:
γm, steel = 1.15
γm, concrete = 1.50 b = 1000 mm
For the load combination, the w and M are calculated as follows: w = (1.4wd + 1.6wt) b
21
8wlM =
As,min = 0.0013bwd = 162.5 sq-mm
COMB100 wd = 4.0 kPa wt = 5.0 kPa w = 13.6 kN/m M-strip = 27.2 kN-mM-design = 27.2366 kN-m
The depth of the compression block is given by:
2bdfMK
cu
= = 0.05810 < 0.156
The area of tensile steel reinforcement is then given by:
dKdz 95.09.0
25.05.0 ≤
−+= =116.3283
zfMA
ys 87.0= = 585.046 sq-mm > As,min
As = 5.850 sq-cm
EXAMPLE Hong Kong CP-2013 RC-SL-001 - 4

Software VerificationPROGRAM NAME: SAFE REVISION NO.: 0
EXAMPLE IS 456-00 PT-SL-001 Post-Tensioned Slab Design
PROBLEM DESCRIPTION The purpose of this example is to verify the slab stresses and the required area of mild steel strength reinforcing for a post-tensioned slab.
A one-way simply supported slab is modeled in SAFE. The modeled slab is 254 mm thick by 914 mm wide and spans 9754 mm, as shown in shown in Figure 1.
Length, L = 9754 mm
Elevation Section
Prestressing tendon, Ap
Mild Steel, As
914 mm25 mm
229 mm
254 mm
Length, L = 9754 mm
Elevation Section
Prestressing tendon, Ap
Mild Steel, As
914 mm25 mm
229 mm
254 mm
Figure 1 One-Way Slab
EXAMPLE IS 456-00 PT-SL-001 - 1

Software Verification PROGRAM NAME: SAFE REVISION NO.: 0
A 254-mm-wide design strip is centered along the length of the slab and has been defined as an A-Strip. B-strips have been placed at each end of the span, perpendicular to Strip-A (the B-Strips are necessary to define the tendon profile). A tendon with two strands, each having an area of 99 mm2, has been added to the A-Strip. The self weight and live loads have been added to the slab. The loads and post-tensioning forces are as follows:
Loads: Dead = self weight, Live = 4.788 kN/m2
The total factored strip moments, required area of mild steel reinforcement, and slab stresses are reported at the mid-span of the slab. Independent hand calculations were compared with the SAFE results and summarized for verification and validation of the SAFE results.
GEOMETRY, PROPERTIES AND LOADING Thickness T, h = 254 mm Effective depth d = 229 mm Clear span L = 9754 mm Concrete strength f 'c = 30 MPa Yield strength of steel fy = 400 MPa Prestressing, ultimate fpu = 1862 MPa Prestressing, effective fe = 1210 MPa Area of Prestress (single strand) Ap = 198 mm2 Concrete unit weight wc = 23.56 kN/m3 Modulus of elasticity Ec = 25000 N/mm3 Modulus of elasticity Es = 200,000 N/mm3 Poisson’s ratio ν = 0 Dead load wd = self kN/m2 Live load wl = 4.788 kN/m2
TECHNICAL FEATURES OF SAFE TESTED Calculation of the required flexural reinforcement Check of slab stresses due to the application of dead, live, and post-tensioning
loads
RESULTS COMPARISON Table 1 shows the comparison of the SAFE total factored moments, required mild steel reinforcing, and slab stresses with the independent hand calculations.
EXAMPLE IS 456-00 PT-SL-001 - 2

Software Verification PROGRAM NAME: SAFE REVISION NO.: 0
Table 1 Comparison of Results
FEATURE TESTED INDEPENDENT RESULTS
SAFE RESULTS DIFFERENCE
Factored moment, Mu (Ultimate) (kN-m)
175.6 175.65 0.03%
Area of Mild Steel req’d, As (sq-cm) 19.53 19.768 1.22%
Transfer Conc. Stress, top (D+PTI), MPa −5.058 −5.057 0.02%
Transfer Conc. Stress, bot (D+PTI), MPa 2.839 2.839 0.00%
Normal Conc. Stress, top (D+L+PTF), MPa −10.460 −10.465 0.05%
Normal Conc. Stress, bot (D+L+PTF), MPa 8.402 8.407 0.06%
COMPUTER FILE: IS 456-00 PT-SL-001.FDB
CONCLUSION The SAFE results show an acceptable comparison with the independent results.
EXAMPLE IS 456-00 PT-SL-001 - 3

Software Verification PROGRAM NAME: SAFEREVISION NO.: 0
HAND CALCULATIONS:
Design Parameters: Mild Steel Reinforcing Post-Tensioning
fck = 30MPa fpu = 1862 MPa fy = 400MPa fpy = 1675 MPa
Stressing Loss = 186 MPa Long-Term Loss = 94 MPa
fi = 1490 MPa fe =1210 MPa
γs = 1.15
γc = 1.50
α = 0.36
β = 0.42 max 2500 53 0 05 if 250 415 MPa
165−
= − < ≤yy
fx . . fd
max =u ,xd
0.484
Length, L = 9754 mm
Elevation Section
Prestressing tendon, Ap
Mild Steel, As
914 mm25 mm
229 mm
254 mm
Length, L = 9754 mm
Elevation Section
Prestressing tendon, Ap
Mild Steel, As
914 mm25 mm
229 mm
254 mm
Loads: Dead, self-wt = 0.254 m × 23.56 kN/m3 = 5.984 kN/m2 (D) × 1.50 = 8.976 kN/m2 (Du) Live, = 4.788 kN/m2 (L) × 1.50 = 7.182 kN/m2 (Lu)
Total = 10.772 kN/m2 (D+L) = 16.158 kN/m2 (D+L)ult
ω =10.772 kN/m2 × 0.914 m = 9.846 kN/m, uω = 16.158 kN/m2 × 0.914 m = 14.768 kN/m
Ultimate Moment, 2
1
8UwlM = = ( )214 768 9 754 8×. . = 175.6 kN-m
EXAMPLE IS 456-00 PT-SL-001 - 4
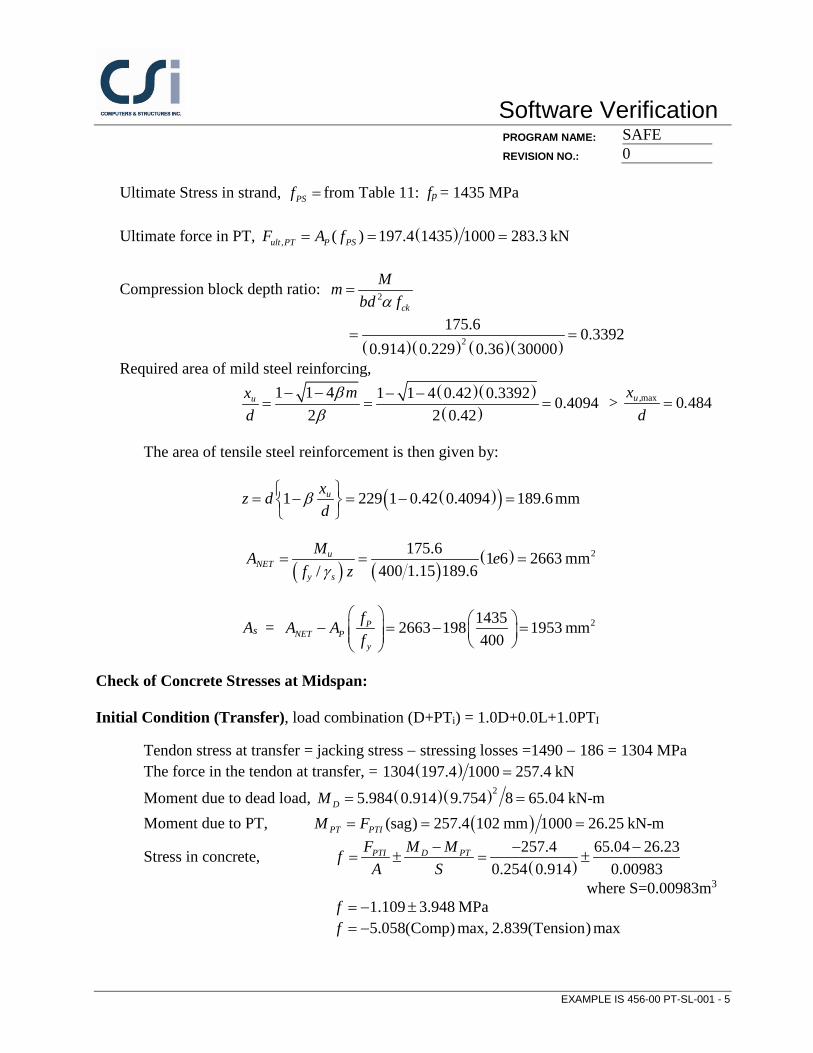
Software Verification PROGRAM NAME: SAFE REVISION NO.: 0 Ultimate Stress in strand, PSf = from Table 11: fp = 1435 MPa
Ultimate force in PT, ( ), ( ) 197.4 1435 1000 283.3 kN= = =ult PT P PSF A f
Compression block depth ratio: 2ck
Mmbd fα
=
( )( ) ( )( )2
175.6 0.33920.914 0.229 0.36 30000
= =
Required area of mild steel reinforcing, ( )( )( )
1 1 4 1 1 4 0.42 0.3392 0.40942 2 0.42
u mxd
ββ
− − − −= = = > =max 0 484u,x .
d
The area of tensile steel reinforcement is then given by:
( )( )1 229 1 0.42 0.4094 189.6mmuxz dd
β = − = − =
( ) ( )( ) 2175.6 1 6 2663 mm
400 1.15 189.6/u
NETy s
MA ef zγ
= = =
As = 214352663 198 1953 mm400
PNET P
y
fA Af
− = − =
Check of Concrete Stresses at Midspan: Initial Condition (Transfer), load combination (D+PTi) = 1.0D+0.0L+1.0PTI
Tendon stress at transfer = jacking stress − stressing losses =1490 − 186 = 1304 MPa The force in the tendon at transfer, = ( )1304 197.4 1000 257.4 kN=
Moment due to dead load, ( )( )25.984 0.914 9.754 8 65.04 kN-m= =DM Moment due to PT, ( )(sag) 257.4 102 mm 1000 26.25 kN-m= = =PT PTIM F
Stress in concrete, ( )
257.4 65.04 26.230.254 0.914 0.00983
− − −= ± = ±PTI D PTF M Mf
A S
where S=0.00983m3
1.109 3.948 MPaf = − ± 5.058(Comp) max, 2.839(Tension) maxf = −
EXAMPLE IS 456-00 PT-SL-001 - 5

Software Verification PROGRAM NAME: SAFE REVISION NO.: 0 Normal Condition, load combinations: (D+L+PTF) = 1.0D+1.0L+1.0PTF
Tendon stress at normal = jacking − stressing − long-term=1490 − 186 − 94 = 1210 MPa The force in tendon at normal, = ( )1210 197.4 1000 238.9 kN=
Moment due to dead load, ( )( )25.984 0.914 9.754 8 65.04 kN-m= =DM
Moment due to live load, ( )( )24.788 0.914 9.754 8 52.04 kN-m= =LM Moment due to PT, ( )(sag) 238.9 102 mm 1000 24.37 kN-m= = =PT PTIM F Stress in concrete for (D+L+PTF),
( )
238.8 117.08 24.370.254 0.914 0.00983
+ − − −= ± = ±PTI D L PTF M Mf
A S
1 029 9 431f . .= − ± 10.460(Comp) max, 8.402(Tension) maxf = −
EXAMPLE IS 456-00 PT-SL-001 - 6

Software VerificationPROGRAM NAME: SAFE REVISION NO.: 0
EXAMPLE IS 456-00 RC-BM-001 Flexural and Shear Beam Design
PROBLEM DESCRIPTION The purpose of this example is to verify slab flexural design in SAFE. The load level is adjusted for the case corresponding to the following conditions:
The stress block extends below the flange but remains within the balancedcondition permitted by IS 456-2000.
The average shear stress in the beam is below the maximum shear stressallowed by IS 456-2000, requiring design shear reinforcement.
A simple-span, 6-m-long, 300-mm-wide, and 500-mm-deep T-beam with a flange 100 mm thick and 600 mm wide is modeled using SAFE. The beam is shown in Figure 1. The computational model uses a finite element mesh of frame elements, automatically generated by SAFE. The maximum element size has been specified to be 200 mm. The beam is supported by columns without rotational stiffnesses and with very large vertical stiffness (1×10²⁰ kN/m).
The beam is loaded with symmetric third-point loading. One dead load case (DL20) and one live load case (LL80) with only symmetric third-point loads of magnitudes 20, and 80 kN, respectively, are defined in the model. One load combinations (COMB80) is defined using the IS 456-2000 load combination factors of 1.5 for dead loads and 1.5 for live loads. The model is analyzed for both of these load cases and the load combinations.
The beam moment and shear force are computed analytically. The total factored moment and shear force are compared with the SAFE results. The moment and shear force are identical. After completing the analysis, design is performed using the IS 456-2000 code in SAFE and also by hand computation. Table 1 shows the comparison of the design longitudinal reinforcements. Table 2 shows the comparison of the design shear reinforcements.
EXAMPLE IS 456-00 RC-BM-001 - 1

Software Verification PROGRAM NAME: SAFEREVISION NO.: 0
Beam Section
75 mm 100 mm
300 mm
600 mm
75 mm
500 mm
Shear Force
Bending Moment
2000 mm 2000 mm 2000 mm
Beam Section
75 mm 100 mm
300 mm
600 mm
75 mm
500 mm
Shear Force
Bending Moment
2000 mm 2000 mm 2000 mm
Figure 1 The Model Beam for Flexural and Shear Design
EXAMPLE IS 456-00 RC-BM-001 - 2

Software Verification PROGRAM NAME: SAFE REVISION NO.: 0
GEOMETRY, PROPERTIES AND LOADING Clear span, l = 6000 mm Overall depth, h = 500 mm Flange Thickness, ds = 100 mm Width of web, bw = 300 mm Width of flange, bf = 600 mm Depth of tensile reinf., dc = 75 mm Effective depth, d = 425 mm Depth of comp. reinf., d' = 75 mm Concrete strength, f'
c = 30 MPa Yield strength of steel, fy = 460 MPa Concrete unit weight, wc = 0 kN/m3 Modulus of elasticity, Ec = 25×105 MPa Modulus of elasticity, Es = 2×10⁸ MPa Poisson’s ratio, v = 0.2 Dead load, Pd = 20 kN Live load, Pl = 80 kN
TECHNICAL FEATURES OF SAFE TESTED Calculation of flexural and shear reinforcement Application of minimum flexural and shear reinforcement
RESULTS COMPARISON Table 1 shows the comparison of SAFE total factored moments in the design strip with the moments obtained by the analytical method. They match exactly for this problem. Table 1 also shows the comparison of design reinforcements.
Table 1 Comparison of Moments and Flexural Reinforcements
Method Moment (kN-m)
Reinforcement Area (sq-cm)
As+
SAFE 312 21.13
Calculated 312 21.13
,mins+A = 235.6 sq-mm
EXAMPLE IS 456-00 RC-BM-001 - 3
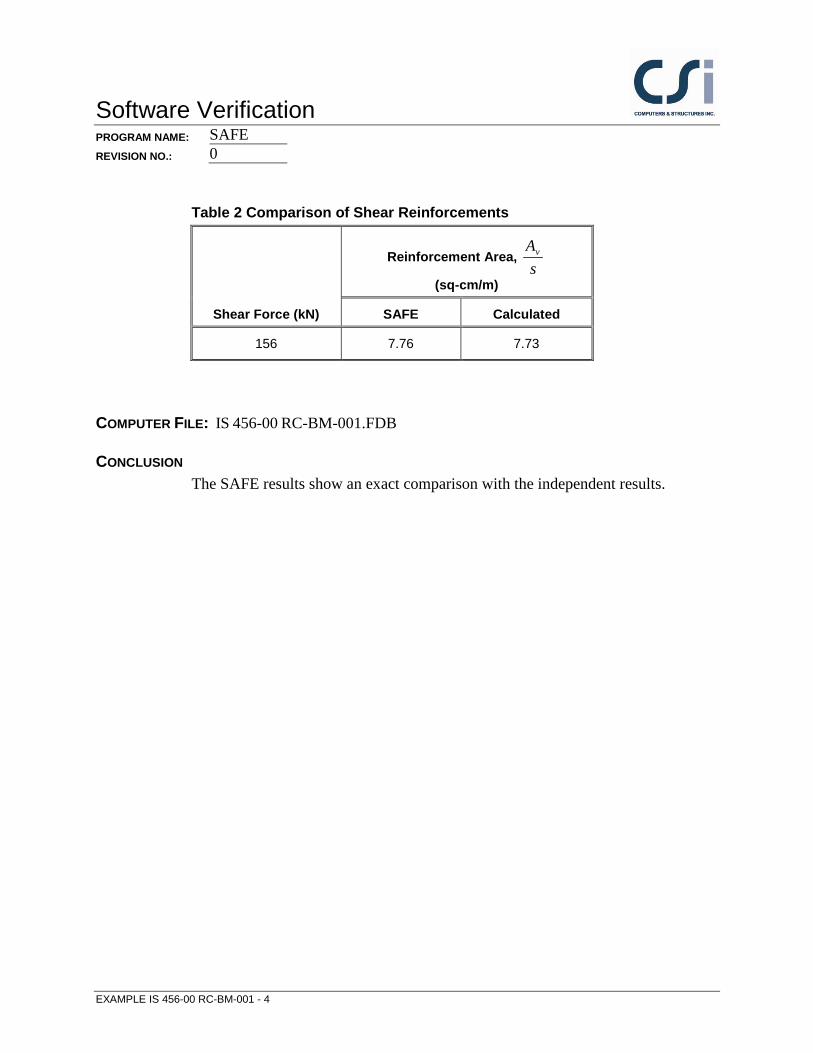
Software Verification PROGRAM NAME: SAFE REVISION NO.: 0
Table 2 Comparison of Shear Reinforcements
Shear Force (kN)
Reinforcement Area, s
Av
(sq-cm/m)
SAFE Calculated
156 7.76 7.73
COMPUTER FILE: IS 456-00 RC-BM-001.FDB
CONCLUSION The SAFE results show an exact comparison with the independent results.
EXAMPLE IS 456-00 RC-BM-001 - 4

Software VerificationPROGRAM NAME: SAFE REVISION NO.: 0
HAND CALCULATION
Flexural Design The following quantities are computed for all the load combinations:
γm, steel = 1.15
γm, concrete = 1.50
α = 0.36
β = 0.42
,min0.85
sy
A bdf
≥ = 235.6 sq-mm
COMB80 P = (1.4Pd + 1.6Pt) =156 kN
**
3N lM = = 312 kN-m
max
0 53 if 250 MPa250
0 53 0 05 if 250 415 MPa165
4150 48 0 02 if 415 500 MPa
850 46 if 500 MPa
y
yy
u,
yy
y
. ff
. . fxd f
. . f
. f
≤ − − < ≤
= − − < ≤ ≥
max 0 4666u,x .d
=
The normalized design moment, m, is given by
ckf
u
fdbMmα2
=
M = 312x106/(600 • 4252 • 0.36 • 30) = 0.26656
fDd
= 100/425 = 0.23529
EXAMPLE IS 456-00 RC-BM-001 - 5

Software Verification PROGRAM NAME: SAFEREVISION NO.: 0
ββ
2411 m
dxu −−
= = 0.305848 > fDd
0 15 0 65 if 0 2f u f f. x . D D . dγ = + > = 84.49781
( )
−−=
245.0 f
fwfckf dbbfMγ
γ = 130.98359 kN-m
Mw = Mu − Mf. = 181.0164 kN-m
Mw,single = αfckbwd2
−
dx
dx uu max,max, 1 β = 233.233 < Mw
2w
f ck
Mmb d fα
= = 0.309310
ββ
2411 m
dxu −−
= = 0.36538
( )( ) ( ) zfM
ydfM
Asy
w
fsy
fs γγ
+−
=5.0
= 2113 sq-mm
Shear Design
τv = bdVu = 1.2235
τmax = 3.5 for M30 concrete k = 1.0
1 if 0 Under TensionuP ,δ = ≤
bdAs100 = 0.15 as 0.15 ≤
bdAs100 ≤ 3
14
25ckf = 1.0466
τ = 0 29c . From Table 19 of IS 456:2000 code
τcd = kδτc = 0.29
τcd +0.4 = 0.69
EXAMPLE IS 456-00 RC-BM-001 - 6

Software VerificationPROGRAM NAME: SAFE REVISION NO.: 0
The required shear reinforcement is calculated as follows:
If τcd + 0.4 < τv ≤ τc,max,
( )τ τ−≥ = 7.73 sq-cm/m
0.87v cdsv
v y
bAs f
EXAMPLE IS 456-00 RC-BM-001 - 7

Software Verification PROGRAM NAME: SAFE REVISION NO.: 0
EXAMPLE IS 456-00 RC-PN-001 Slab Punching Shear Design
PROBLEM DESCRIPTION The purpose of this example is to verify slab punching shear design in SAFE
The numerical example is a flat slab that has three 8-m spans in each direction, as shown in Figure 1.
4
A
3
2
1
B C D
X
Y
0.3 m0.3 m8 m8 m8 m
0.6 m
0.6 m
0.25 m thick flat slab
LoadingDL = Self weight + 1.0 kN/m2
LL = 4.0 kN/m2
Columns are 0.3 m x 0.9 mwith long side parallel to the Y-axis, typical
Concrete PropertiesUnit weight = 24 kN/m3
f'c = 30 N/mm2
8 m
8 m
8 m
4
A
3
2
1
B C D
X
Y
0.3 m0.3 m8 m8 m8 m
0.6 m
0.6 m
0.25 m thick flat slab
LoadingDL = Self weight + 1.0 kN/m2
LL = 4.0 kN/m2
Columns are 0.3 m x 0.9 mwith long side parallel to the Y-axis, typical
Concrete PropertiesUnit weight = 24 kN/m3
f'c = 30 N/mm2
8 m
8 m
8 m
Figure 1: Flat Slab for Numerical Example
The slab overhangs beyond the face of the column by 0.15 m along each side of the structure. The columns are typically 0.3 m x 0.9 m with the long side parallel to the Y-axis. The slab is typically 0.25 m thick. Thick plate properties are used for the slab. The concrete has a unit weight of 24 kN/m3 and a f 'c of 30 N/mm2. The dead load consists of the self weight of the structure plus an additional 1 kN/m2. The live load is 4 kN/m2.
EXAMPLE IS 456-00 RC-PN-001 - 1

Software Verification PROGRAM NAME: SAFE REVISION NO.: 0
TECHNICAL FEATURES OF SAFE TESTED Calculation of punching shear capacity, shear stress and D/C ratio.
RESULTS COMPARISON Table 1 shows the comparison of the punching shear capacity, shear stress ratio and D/C ratio obtained in SAFE with the punching shear capacity, shear stress ratio and D/C ratio obtained by the analytical method. They match exactly for this problem.
Table 1 Comparison of Design Results for Punching Shear at Grid B-2
Method Shear Stress
(N/mm2) Shear Capacity
(N/mm2) D/C ratio
SAFE 1.792 1.141 1.57
Calculated 1.792 1.141 1.57
COMPUTER FILE: IS 456-00 RC-PN-001.FDB
CONCLUSION The SAFE results show an exact comparison with the independent results.
EXAMPLE IS 456-00 RC-PN-001 - 2

Software VerificationPROGRAM NAME: SAFE REVISION NO.: 0
HAND CALCULATION Hand Calculation For Interior Column Using SAFE Method
( ) ( )[ ]250 26 250 38 2d = − + − = 218 mm
Refer to Figure 1. b0 = 518+ 1118 + 1118 + 518 = 3272 mm
450
450
X
Y
1118
518
Side 2
Side
3
A B
CD
Column
Side
1
Side 4
Center of column is point (x1, y1). Set this equal to (0,0).
Critical section for punching shear shown dashed.
150
109
109
Note: All dimensions in millimeters
150 109
X
Y
Side 2A B
CD
109
Note: All dimensions in millimeters
450
450
X
Y
1118
518
Side 2
Side
3
A B
CD
Column
Side
1
Side 4
Center of column is point (x1, y1). Set this equal to (0,0).
Critical section for punching shear shown dashed.
150
109
109
Note: All dimensions in millimeters
150 109
X
Y
Side 2A B
CD
109
Note: All dimensions in millimeters
Figure 2: Interior Column, Grid B-2 in SAFE Model
211 0.495
2 111813 518
γ = − = +
V
311 0.312
2 51813 1118
γ = − = +
V
The coordinates of the center of the column (x1, y1) are taken as (0, 0).
EXAMPLE IS 456-00 RC-PN-001 - 3

Software Verification PROGRAM NAME: SAFE REVISION NO.: 0
The following table is used for calculating the centroid of the critical section for punching shear. Side 1, Side 2, Side 3, and Side 4 refer to the sides of the critical section for punching shear as identified in Figure 2.
Item Side 1 Side 2 Side 3 Side 4 Sum x2 −259 0 259 0 N.A. y2 0 559 0 −559 N.A. L 1118 518 1118 518 b0 = 3272 d 218 218 218 218 N.A.
Ld 243724 112924 243724 112924 713296 Ldx2 −63124516 0 63124516 0 0 Ldy2 0 63124516 0 −63124516 0
2
30 0
713296Ldx
x mmLd
= = =∑
23
0 0713296
Ldyy mm
Ld= = =∑
The following table is used to calculate IXX, IYY and IXY. The values for IXX, IYY and IXY are given in the "Sum" column.
Item Side 1 Side 2 Side 3 Side 4 Sum L 1118 518 1118 518 N.A. d 218 218 218 218 N.A.
x2 − x3 −259 0 259 0 N.A. y2 − y3 0 559 0 −559 N.A.
Parallel to Y-Axis X-axis Y-Axis X-axis N.A. Equations 5b, 6b, 7 5a, 6a, 7 5b, 6b, 7 5a, 6a, 7 N.A.
IXX 2.64E+10 3.53E+10 2.64E+10 3.53E+10 1.23E+11 IYY 1.63E+10 2.97E+09 1.63E+10 2.97E+09 3.86E+10 IXY 0 0 0 0 0
From the SAFE output at Grid B-2:
VU = 1126.498 kN
2Vγ MU2 = −25.725 kN-m
3Vγ MU3 = 14.272 kN-m
EXAMPLE IS 456-00 RC-PN-001 - 4

Software Verification PROGRAM NAME: SAFE REVISION NO.: 0
At the point labeled A in Figure 2, x4 = −259 and y4 = 559, thus:
( ) ( )( )( )( ) ( )
( ) ( )( )( )( ) ( )
6 103
211 10
6 11
211 10
25.725 10 3.86 10 559 0 0 259 01126.498 103272 218 1.23 10 3.86 10 0
14.272 10 1.23 10 259 0 0 559 0
1.23 10 3.86 10 0
Uv • • − − − −• = − +
• • • − • • − − − −
• • −
vU = 1.5793 − 0.1169 − 0.0958 = 1.3666 N/mm2 at point A At the point labeled B in Figure 2, x4 = 259 and y4 = 559, thus:
( ) ( )( )( )( ) ( )
( ) ( )( )( )( ) ( )
6 103
211 10
6 11
211 10
25.725 10 3.86 10 559 0 0 259 01126.498 103272 218 1.23 10 3.86 10 0
14.272 10 1.23 10 259 0 0 559 0
1.23 10 3.86 10 0
Uv • • − − −• = − +
• • • − • • − − − • • −
vU = 1.5793 − 0.1169 + 0.0958 =1.5582 N/mm2 at point B At the point labeled C in Figure 2, x4 = 259 and y4 = −559, thus:
( ) ( )( )( )( ) ( )
( ) ( )( )( )( ) ( )
6 103
211 10
6 11
211 10
25.725 10 3.86 10 559 0 0 259 01126.498 103272 218 1.23 10 3.86 10 0
14.272 10 1.23 10 259 0 0 559 0
1.23 10 3.86 10 0
Uv • • − − − −• = − +
• • • − • • − − − −
• • −
vU = 1.5793 + 0.1169 + 0.0958 = 1.792 N/mm2 at point C At the point labeled D in Figure 2, x4 = −259 and y4 = −559, thus:
( ) ( )( )( )( ) ( )
( ) ( )( )( )( ) ( )
6 103
211 10
6 11
211 10
25.725 10 3.86 10 559 0 0 259 01126.498 103272 218 1.23 10 3.86 10 0
14.272 10 1.23 10 259 0 0 559 0
1.23 10 3.86 10 0
Uv • • − − − − −• = − +
• • • − • • − − − − −
• • −
vU = 1.5793 + 0.1169 − 0.0958 = 1.6004 N/mm2 at point D Point C has the largest absolute value of vu, thus vmax = 1.792 N/mm2
EXAMPLE IS 456-00 RC-PN-001 - 5

Software Verification PROGRAM NAME: SAFEREVISION NO.: 0
The shear capacity is calculated based on the minimum of the following three limits:
ks = 0.5 + βc ≤ 1.0 = 0.833 (IS 31.6.3.1)
τc = 0.25 = 1.127 N/mm2 (IS 31.6.3.1)
vc = ks τc= 1.141 N/mm2 (IS 31.6.3.1)
CSA 13.3.4.1 yields the smallest value of cv = 1.141 N/mm2, and thus this is the shear capacity.
1.792Shear Ratio 1.571.141
U
c
vv
= = =
EXAMPLE IS 456-00 RC-PN-001 - 6

Software Verification PROGRAM NAME: SAFE REVISION NO.: 0
EXAMPLE IS 456-00 RC-SL-001 Slab Flexural Design
PROBLEM DESCRIPTION The purpose of this example is to verify slab flexural design in SAFE.
A one-way, simple-span slab supported by walls on two opposite edges is modeled using SAFE. The slab is 150 mm thick and spans 4 meters between walls. The walls are modeled as pin supports. The computational model uses a finite element mesh, automatically generated by SAFE. The maximum element size is specified as 0.25 meters. To obtain factored moments and flexural reinforcement in a design strip, one one-meter wide strip is defined in the X-direction on the slab, as shown in Figure 1.
Figure 1 Plan View of One-Way Slab
One dead load case (DL4KPa) and one live load case (LL5KPa) with uniformly distributed surface loads of magnitudes 4 and 5 kN/m2, respectively, are defined in the model. A load combination (COMB5kPa) is defined using the IS 456-00 load combination factors, 1.5 for dead loads and 1.5 for live loads. The model is analyzed for both load cases and the load combination.
The slab moment on a strip of unit width is computed analytically. The total factored strip moments are compared with the SAFE results. After completing analysis, design was performed using the IS 456-00 code by SAFE and also by hand computation. Table 1 shows the comparison of the design reinforcements computed using the two methods.
EXAMPLE IS 456-00 RC-SL-001 - 1

Software Verification PROGRAM NAME: SAFE REVISION NO.: 0 GEOMETRY, PROPERTIES AND LOADING
Thickness T, h = 150 mm Depth of tensile reinf. dc = 25 mm Effective depth d = 125 mm Clear span ln, l1 = 4000 mm Concrete strength fc = 30 MPa Yield strength of steel fsy = 460 MPa Concrete unit weight wc = 0 N/m3 Modulus of elasticity Ec = 25000 MPa Modulus of elasticity Es = 2×10⁶ MPa Poisson’s ratio ν = 0 Dead load wd = 4.0 kPa Live load wl = 5.0 kPa
TECHNICAL FEATURES OF SAFE TESTED Calculation of flexural reinforcement Application of minimum flexural reinforcement
RESULTS COMPARISON Table 1 shows the comparison of the SAFE total factored moments in the design strip with the moments obtained by the hand computation method. Table 1 also shows the comparison of design reinforcements.
Table 1 Comparison of Design Moments and Reinforcements
Load Level Method
Strip Moment (kN-m)
Reinforcement Area (sq-cm)
As+ As-
Medium SAFE 26.997 5.830 --
Calculated 27.000 5.830 --
,minA s+ = 230.978 sq-mm
EXAMPLE IS 456-00 RC-SL-001 - 2

Software VerificationPROGRAM NAME: SAFE REVISION NO.: 0
COMPUTER FILE: IS 456-00 RC-SL-001.FDB
CONCLUSION The SAFE results show an acceptable comparison with the independent results.
EXAMPLE IS 456-00 RC-SL-001 - 3

Software Verification PROGRAM NAME: SAFE REVISION NO.: 0
HAND CALCULATION The following quantities are computed for the load combination:
γs = 1.15
γc = 1.50
α = 0.36
β = 0.42 b = 1000 mm
For the load combination, w and M are calculated as follows: w = (1.5wd + 1.5wt) b
21
8wlM =
,min0.85
sy
A bdf
=
= 230.978 sq-mm
COMB100 wd = 4.0 kPa wt = 5.0 kPa w = 13.5 kN/m M-strip = 27.0 kN-m
M-design = 27.0363 kN-m
max
0 53 if 250 MPa250
0 53 0 05 if 250 415 MPa165
4150 48 0 02 if 415 500 MPa
850 46 if 500 MPa
y
yy
u ,
yy
y
. ff
. . fxfd
. . f
. f
≤ − − < ≤
= − − < ≤ ≥
EXAMPLE IS 456-00 RC-SL-001 - 4

Software Verification PROGRAM NAME: SAFE REVISION NO.: 0
maxu ,xd
= 0.466
The depth of the compression block is given by:
ck
u
fbdMmα2
=
= 0.16
1 1 42
u mxd
ββ
− −= = 0.1727488 < maxu ,x
d
The area of tensile steel reinforcement is given by:
.uxz dd
β = − 1 = 115.9307 mm
( ) ,/
us
y s
MAf zγ
= = 583.027 sq-mm > As,min
As = 5.830 sq-cm
EXAMPLE IS 456-00 RC-SL-001 - 5

Software VerificationPROGRAM NAME: SAFE REVISION NO.: 0
EXAMPLE Italian NTC 2008 PT-SL-001 Post-Tensioned Slab Design
PROBLEM DESCRIPTION The purpose of this example is to verify the slab stresses and the required area of mild steel strength reinforcing for a post-tensioned slab.
A one-way, simply supported slab is modeled in SAFE. The modeled slab is 254 mm thick by 914 mm wide and spans 9754 mm as shown in shown in Figure 1.
Length, L = 9754 mm
Elevation Section
Prestressing tendon, Ap
Mild Steel, As
914 mm25 mm
229 mm
254 mm
Length, L = 9754 mm
Elevation Section
Prestressing tendon, Ap
Mild Steel, As
914 mm25 mm
229 mm
254 mm
Figure 1 One-Way Slab
EXAMPLE Italian NTC 2008 PT-SL-001 - 1

Software Verification PROGRAM NAME: SAFE REVISION NO.: 0
A 254-mm-wide design strip is centered along the length of the slab and has been defined as an A-Strip. B-strips have been placed at each end of the span, perpendicular to Strip-A (the B-Strips are necessary to define the tendon profile). A tendon with two strands, each having an area of 99 mm2, was added to the A-Strip. The self weight and live loads have been added to the slab. The loads and post-tensioning forces are as follows:
Loads: Dead = self weight, Live = 4.788 kN/m2
The total factored strip moments, required area of mild steel reinforcement, and slab stresses are reported at the mid-span of the slab. Independent hand calculations were compared with the SAFE results and summarized for verification and validation of the SAFE results.
GEOMETRY, PROPERTIES AND LOADING Thickness T, h = 254 mm Effective depth d = 229 mm Clear span L = 9754 mm Concrete strength f 'c = 30 MPa Yield strength of steel fy = 400 MPa Prestressing, ultimate fpu = 1862 MPa Prestressing, effective fe = 1210 MPa Area of Prestress (single strand) Ap = 198 mm2 Concrete unit weight wc = 23.56 KN/m3 Modulus of elasticity Ec = 25000 N/mm3 Modulus of elasticity Es = 200,000 N/mm3 Poisson’s ratio ν = 0 Dead load wd = self KN/m2 Live load wl = 4.788 KN/m2
TECHNICAL FEATURES OF SAFE TESTED Calculation of the required flexural reinforcement Check of slab stresses due to the application of dead, live, and post-tensioning
loads.
RESULTS COMPARISON Table 1 shows the comparison of the SAFE total factored moments, required mild steel reinforcing, and slab stresses with independent hand calculations.
EXAMPLE Italian NTC 2008 PT-SL-001 - 2

Software VerificationPROGRAM NAME: SAFE REVISION NO.: 0
Table 1 Comparison of Results
FEATURE TESTED INDEPENDENT RESULTS
SAFE RESULTS DIFFERENCE
Factored moment, Mu (Ultimate) (kN-m)
165.9 165.9 0.00%
Transfer Conc. Stress, top (D+PTI), MPa −5.057 −5.057 0.00%
Transfer Conc. Stress, bot (D+PTI), MPa 2.839 2.839 0.00%
Normal Conc. Stress, top (D+L+PTF), MPa −10.460 −10.465 0.05%
Normal Conc. Stress, bot (D+L+PTF), MPa 8.402 8.407 0.06%
Long-Term Conc. Stress, top (D+0.5L+PTF(L)), MPa −7.817 −7.817 0.00%
Long-Term Conc. Stress, bot (D+0.5L+PTF(L)), MPa 5.759 5.759 0.00%
Table 2 Comparison of Design Moments and Reinforcements
Method Design Moment (kN-m)
Reinforcement Area (sq-cm)
As+
SAFE 165.9 16.39
Calculated 165.9 16.29
COMPUTER FILE: ITALIAN NTC 2008 PT-SL-001.FDB
CONCLUSION The SAFE results show an acceptable comparison with the independent results.
EXAMPLE Italian NTC 2008 PT-SL-001 - 3

Software Verification PROGRAM NAME: SAFE REVISION NO.: 0
HAND CALCULATIONS:
Design Parameters:
Mild Steel Reinforcing Post-Tensioning
f’c = 30MPa fpu = 1862 MPa fy = 400MPa fpy = 1675 MPa Stressing Loss = 186 MPa
Long-Term Loss = 94 MPa fi = 1490 MPa fe = 1210 MPa
γm, steel = 1.15
γm, concrete = 1.50
0.1=η for fck ≤ 50 MPa
8.0=λ for fck ≤ 50 MPa
Length, L = 9754 mm
Elevation Section
Prestressing tendon, Ap
Mild Steel, As
914 mm25 mm
229 mm
254 mm
Length, L = 9754 mm
Elevation Section
Prestressing tendon, Ap
Mild Steel, As
914 mm25 mm
229 mm
254 mm
Loads: Dead, self-wt = 0.254 m × 23.56 kN/m3 = 5.984 kN/m2 (D) × 1.35 = 8.078 kN/m2 (Du) Live, = 4.788 kN/m2 (L) × 1.50 = 7.182 kN/m2 (Lu)
Total = 10.772 kN/m2 (D+L) = 15.260 kN/m2 (D+L)ult
ω =10.772 kN/m2 × 0.914 m = 9.846 kN/m, uω = 15.260 kN/m2 × 0.914 m = 13.948 kN/m
Ultimate Moment, 2
1
8UwlM = = ( )213.948 9.754 8× = 165.9 kN-m
EXAMPLE Italian NTC 2008 PT-SL-001 - 4

Software VerificationPROGRAM NAME: SAFE REVISION NO.: 0
Ultimate Stress in strand, 7000 1 1.36
= + −
PU PPS SE
CK
f Af f d lf bd
( )( )1862(198)1210 7000(229) 1 1.36 9754
30(914) 229
1361 MPa
= + −
=
Ultimate force in PT, ( )( ), ( ) 2 99 1361 1000 269.5 kNult PT P PSF A f= = =
Design moment M = 165.9 kN-m
Compression block depth ratio:cdfbd
Mmη2
=
( )( ) ( )( )2165.9 0.1731
0.914 0.229 1 30000 1.50= =
Required area of mild steel reinforcing, m211 −−=ω = 1 1 2(0.1731) 0.1914− − =
21(30 /1.5)(914)(229)0.1914 2303 mm400 /1.15
ηω = = =
cdEquivTotal
yd
f bdAf
21366 2311 mm400EquivTotal P SA A A = + =
213612303 198 1629 mm400
= − =
SA
Check of Concrete Stresses at Midspan:
Initial Condition (Transfer), load combination (D+PTi) = 1.0D+0.0L+1.0PTI
Tendon stress at transfer = jacking stress − stressing losses =1490 − 186 = 1304 MPa The force in the tendon at transfer = ( )1304 197.4 1000 257.4 kN=
Moment due to dead load, ( )( )25.984 0.914 9.754 8 65.04 kN-m= =DMMoment due to PT, ( )(sag) 257.4 102 mm 1000 26.25 kN-m= = =PT PTIM F
Stress in concrete,( )
257.4 65.04 26.230.254 0.914 0.00983
− − −= ± = ±PTI D PTF M Mf
A Swhere S = 0.00983m3
EXAMPLE Italian NTC 2008 PT-SL-001 - 5

Software Verification PROGRAM NAME: SAFEREVISION NO.: 0
1.109 3.948 MPaf = − ± 5.058(Comp) max, 2.839(Tension) maxf = −
Normal Condition, load combinations: (D+L+PTF) = 1.0D+1.0L+1.0PTF
Tendon stress at normal = jacking − stressing − long-term=1490 − 186 − 94 = 1210 MPa The force in tendon at normal = ( )1210 197.4 1000 238.9 kN=
Moment due to dead load ( )( )25.984 0.914 9.754 8 65.04 kN-m= =DM
Moment due to live load ( )( )24.788 0.914 9.754 8 52.04 kN-m= =LM Moment due to PT, ( )(sag) 238.9 102 mm 1000 24.37 kN-m= = =PT PTIM F
Stress in concrete for (D+L+PTF),
( )238.8 117.08 24.37
0.254 0.914 0.00983+ − − −
= ± = ±PTI D L PTF M MfA S1 029 9 431f . .= − ± 10.460(Comp) max, 8.402(Tension) maxf = −
Long-Term Condition, load combinations: (D+0.5L+PTF(L)) = 1.0D+0.5L+1.0PTF
Tendon stress at normal = jacking − stressing − long-term = 1490 − 186 − 94 = 1210 MPa The force in tendon at normal, = ( )1210 197.4 1000 238.9 kN=
Moment due to dead load, ( )( )25.984 0.914 9.754 8 65.04 kN-m= =DM
Moment due to live load, ( )( )24.788 0.914 9.754 8 52.04 kN-m= =LM Moment due to PT, ( )(sag) 238.9 102 mm 1000 24.37 kN-m= = =PT PTIM F
Stress in concrete for (D+0.5L+PTF(L)),
( )0.5 238.9 91.06 24.33
0.254 0.914 0.00983+ − − −
= ± = ±D L PTPTI M MFfA S1 029 6 788f . .= − ± 7.817(Comp) max, 5.759(Tension) maxf = −
EXAMPLE Italian NTC 2008 PT-SL-001 - 6

Software Verification PROGRAM NAME: SAFE REVISION NO.: 0
EXAMPLE Italian NTC 2008 RC-BM-001 Flexural and Shear Beam Design
PROBLEM DESCRIPTION The purpose of this example is to verify slab flexural design in SAFE. The load level is adjusted for the case corresponding to the following conditions:
The stress-block extends below the flange but remains within the balanced condition permitted by Italian NTC 2008.
The average shear stress in the beam is below the maximum shear stress allowed by Italian NTC 2008, requiring design shear reinforcement.
A simple-span, 6-m-long, 300-mm-wide, and 500-mm-deep T-beam with a flange 100 mm thick and 600 mm wide is modeled using SAFE. The beam is shown in Figure 1. The computational model uses a finite element mesh of frame elements, automatically generated by SAFE. The maximum element size has been specified to be 200 mm. The beam is supported by columns without rotational stiffnesses and with very large vertical stiffness (1×10²⁰ kN/m).
The beam is loaded with symmetric third-point loading One dead load case (DL30) and one live load case (LL130) with only symmetric third-point loads of magnitudes 30, and 130 kN, respectively, are defined in the model. One load combinations (COMB130) is defined using the Italian NTC 2008 load combination factors of 1.35 for dead loads and 1.5 for live loads. The model is analyzed for both of these load cases and the load combinations.
The beam moment and shear force are computed analytically. The total factored moment and shear force are compared with the SAFE results. These moment and shear force are identical. After completing the analysis, design is performed using the Italian NTC 2008 code in SAFE and also by hand computation. Table 1 shows the comparison of the design longitudinal reinforcements. Table 2 shows the comparison of the design shear reinforcements.
EXAMPLE Italian NTC 2008 RC-BM-001 - 1

Software Verification PROGRAM NAME: SAFE REVISION NO.: 0
Beam Section
75 mm 100 mm
300 mm
600 mm
75 mm
500 mm
Shear Force
Bending Moment
2000 mm 2000 mm 2000 mm
Beam Section
75 mm 100 mm
300 mm
600 mm
75 mm
500 mm
Shear Force
Bending Moment
2000 mm 2000 mm 2000 mm
Figure 1 The Model Beam for Flexural and Shear Design
EXAMPLE Italian NTC 2008 RC-BM-001 - 2

Software VerificationPROGRAM NAME: SAFE REVISION NO.: 0
GEOMETRY, PROPERTIES AND LOADING Clear span, l = 6000 mm Overall depth, h = 500 mm Flange thickness, ds = 100 mm Width of web, bw = 300 mm Width of flange, bf = 600 mm Depth of tensile reinf., dc = 75 mm Effective depth, d = 425 mm Depth of comp. reinf., d' = 75 mm
Concrete strength, f'ck = 30 MPa
Yield strength of steel, fy = 460 MPa Concrete unit weight, wc = 0 kN/m3 Modulus of elasticity, Ec = 25x105 MPa Modulus of elasticity, Es = 2x10⁸ MPa Poisson’s ratio, v = 0.2
Dead load, Pd = 30 kN Live load, Pl = 130 kN
TECHNICAL FEATURES OF SAFE TESTED Calculation of flexural and shear reinforcement Application of minimum flexural and shear reinforcement
RESULTS COMPARISON Table 1 shows the comparison of the SAFE total factored moments in the design strip with the moments obtained by the analytical method. They match exactly for this problem. Table 1 also shows the comparison of design reinforcements.
EXAMPLE Italian NTC 2008 RC-BM-001 - 3

Software Verification PROGRAM NAME: SAFE REVISION NO.: 0
Table 1 Comparison of Moments and Flexural Reinforcements
Method
Moment
(kN-m)
Reinforcement Area (sq-cm)
As+
SAFE 471 31.643
Calculated 471 31.643
,mins+A = 2.09 sq-cm
Table 2 Comparison of Shear Reinforcements
Method
Shear Force
(kN)
Reinforcement Area , s
Av
(sq-cm/m)
As+
SAFE 235.5 6.16
Calculated 235.5 6.16
COMPUTER FILE: Italian NTC 2008 RC-BM-001.FDB
CONCLUSION The SAFE results show an exact comparison with the independent results.
EXAMPLE Italian NTC 2008 RC-BM-001 - 4

Software Verification PROGRAM NAME: SAFE REVISION NO.: 0
HAND CALCULATION
Flexural Design The following quantities are computed for both of the load combinations:
γs = 1.15
γc = 1.50
/cd cc ck cf f= α γ
/yd yk sf f= γ
0.1=η for fck ≤ 50 MPa
8.0=λ for fck ≤ 50 MPa
bdffA
yk
ctms 26.0min, = = 208.73 sq-mm
min 0 0013=s wA , . b h = 195.00 sq-mm
γm, steel = 1.15
γm, concrete = 1.50 αcc = 1.0
The depth of the compression block is given by: 6
2 2
471 10600 425 1.0 1.0 30 /1.5cd
Mmbd fη
•= =
• • • • = 0.217301
For reinforcement with fyk ≤ 500 MPa, the following values are used: k1 = 0.44 k2 = k4 = 1.25(0.6 + 0.0014/εcu2) = 1.25
δ is assumed to be 1
2
1
lim kk
dx −
=
δ for fck ≤ 50 MPa = 0.448
EXAMPLE Italian NTC 2008 RC-BM-001 - 5

Software Verification PROGRAM NAME: SAFEREVISION NO.: 0
−
=
limlimlim 2
1dx
dxm λλ = 0.29417
limlim
lim 211 mdx
−−=
= λω = 0.3584
amax = ωlimd = 152.32 mm
ω = 1 1 2m− − = 0.24807 a = ωd = 105.4299 mm ≤ amax
( )2
η−= f w f cd
syd
b b h fA
f = 1500 sq-mm
−=
222f
yds
hdfAM = 225 kN-m
M1 = M − M2 = 246 kN-m
11 2η=
w cd
Mmb d f
= 0.2269896 ≤ mlim
11 211 m−−=ω = 0.2610678
1 1ηω
=
cd ws
yd
f b dAf
= 1664.304 sq-mm
As = As1 + As2 = 3164.307 sq-mm
Shear Design
ccRdC γ18.0, = = 0.18/1.5 = 0.12
2001 1.686 2.0kd
= + = ≤ with d in mm
ρ1 = 0.0
0.2σ = <cp Ed c cdN A f = 0.0 MPa
2123min 035.0 ckfk=ν = 0.419677
EXAMPLE Italian NTC 2008 RC-BM-001 - 6

Software Verification PROGRAM NAME: SAFE REVISION NO.: 0
( )1 3, , 1 1100Rd c Rd c ck cp wV C k f k b dρ σ = + = 53.5 kN
αcw = 1
−=
25016.01
ckfν = 0.528
z = 0.9d = 382.5 mm θ is taken as 1.
θθναtancot
1max, +
= cdwcwRd
fzbV = 1211.76 kN
VR,dc < VEd ≤ VRd,max (govern)
Computing the angle using Edv :
3235.5 100.9 425 300Edv •
=• •
= 2.0522
( )10.5sin
0.2 1 250θ −=
−Ed
ck ck
vf f
( )1 2.05220.5sin
0.2 30 1 30 250θ −=
• − = 11.43°
21.8 45θ° ≤ ≤ ° , therefore use 21.8θ = °
cot
sw Ed w
ywd
A v bs f θ
=
2.0522 300460 1.15 2.5
swAs
•=
•= 0.61566 sq-mm/m = 6.16 sq-cm/m
EXAMPLE Italian NTC 2008 RC-BM-001 - 7

Software Verification PROGRAM NAME: SAFE REVISION NO.: 0
EXAMPLE Italian NTC 2008 RC-PN-001 Slab Punching Shear Design
PROBLEM DESCRIPTION The purpose of this example is to verify slab punching shear design in SAFE
The numerical example is a flat slab that has three 8-m spans in each direction, as shown in Figure 1.
4
A
3
2
1
B C D
X
Y
0.3 m0.3 m8 m8 m8 m
0.6 m
0.6 m
0.25 m thick flat slab
LoadingDL = Self weight + 1.0 kN/m2
LL = 4.0 kN/m2
Columns are 0.3 m x 0.9 mwith long side parallel to the Y-axis, typical
Concrete PropertiesUnit weight = 24 kN/m3
f'c = 30 N/mm2
8 m
8 m
8 m
4
A
3
2
1
B C D
X
Y
0.3 m0.3 m8 m8 m8 m
0.6 m
0.6 m
0.25 m thick flat slab
LoadingDL = Self weight + 1.0 kN/m2
LL = 4.0 kN/m2
Columns are 0.3 m x 0.9 mwith long side parallel to the Y-axis, typical
Concrete PropertiesUnit weight = 24 kN/m3
f'c = 30 N/mm2
8 m
8 m
8 m
Figure 1: Flat Slab for Numerical Example
The slab overhangs beyond the face of the column by 0.15 m along each side of the structure. The columns are typically 0.3 m x 0.9 m with the long side parallel to the Y-axis. Thick plate properties are used for the slab. The concrete has a unit weight of 24 kN/m3 and a f 'c of 30 N/mm2. The dead load consists of the self weight of the structure plus an additional 1 kN/m2. The live load is 4 kN/m2.
EXAMPLE Italian NTC 2008 RC-PN-001 - 1

Software Verification PROGRAM NAME: SAFEREVISION NO.: 0
TECHNICAL FEATURES OF SAFE TESTED Calculation of punching shear capacity, shear stress and D/C ratio.
RESULTS COMPARISON Table 1 shows the comparison of the punching shear capacity, shear stress ratio and D/C ratio obtained from SAFE with the punching shear capacity, shear stress ratio and D/C ratio obtained by the analytical method. They match exactly for this problem.
Table 1 Comparison of Design Results for Punching Shear at Grid B-2
Method Shear Stress
(N/mm2) Shear Capacity
(N/mm2) D/C ratio
SAFE 1.100 0.578 1.90
Calculated 1.099 0.578 1.90
COMPUTER FILE: ITALIAN NTC 2008 RC-PN-001.FDB
CONCLUSION The SAFE results show an acceptable comparison with the independent results.
EXAMPLE Italian NTC 2008 RC-PN-001 - 2

Software VerificationPROGRAM NAME: SAFE REVISION NO.: 0
HAND CALCULATION Hand Calculation for Interior Column using SAFE Method
( ) ( )[ ]250 26 250 38 2= − + −d = 218 mm
Refer to Figure 2.
u1 = u = 2•300 + 2•900 + 2•π•436 = 5139.468 mm
450
450
150 436
X
Y
1772
1172
Side
3
Column
Side
1
Side 4
436 150
436
436
Note: All dimensions in millimeters
X
Y
Side 2A B
CD
Critical section for punching shear shown dashed.
Center of column is point (x1, y1). Set this equal to (0,0).
450
450
150 436
X
Y
1772
1172
Side
3
Column
Side
1
Side 4
436 150
436
436
Note: All dimensions in millimeters
X
Y
Side 2A B
CD
Critical section for punching shear shown dashed.
Center of column is point (x1, y1). Set this equal to (0,0).
450
450
150 436
X
Y
1772
1172
Side
3
Column
Side
1
Side 4
436 150
436
436
Note: All dimensions in millimeters
X
Y
Side 2A B
CD
Critical section for punching shear shown dashed.
Center of column is point (x1, y1). Set this equal to (0,0).
450
450
150 436
X
Y
1772
1172
Side
3
Column
Side
1
Side 4
436 150
436
436
Note: All dimensions in millimeters
X
Y
Side 2A B
CD
Critical section for punching shear shown dashed.
Center of column is point (x1, y1). Set this equal to (0,0).
Figure 2: Interior Column, Grid B-2 in SAFE Model
From the SAFE output at Grid B-2: VEd = 1112.197 kN k2MEd2 = 41.593 kN-m k3MEd3 = 20.576 kN-m
EXAMPLE Italian NTC 2008 RC-PN-001 - 3

Software Verification PROGRAM NAME: SAFE REVISION NO.: 0
Maximum design shear stress in computed in along major and minor axis of column:
2 ,2 1 3 ,3 1
1,2 1,3
1 Ed EdEdEd
Ed Ed
k M u k M uVvud V W V W
= + +
(EC2 6.4.4(2))
221
1 1 2 2 14 16 22cW c c c d d dcπ= + + + +
22
1,2900 300 900 4 300 218 16 218 2 218 900
2W π= + • + • • + • + • •
1,2 2,929,744.957W = mm2
22
1,39003 900 300 4 900 218 16 218 2 218 300
2W π= + • + • • + • + • •
1,2 2, 271,104.319W = mm2
2 ,2 1 3 ,3 1
1,2 1,3
1 Ed EdEdEd
Ed Ed
k M u k M uVvud V W V W
= + +
3 6 6
3 31112.197 10 41.593 10 5139.468 20.576 10 5139.46815139.468 218 1112.197 10 2929744.957 1112.197 10 2271104.319Edv
• • • • •= + + • • • • •
Edv = 1.099 N/mm2
Thus vmax = 1.099 N/mm2
ccRdC γ18.0, = = 0.18/1.5 = 0.12 (EC2 6.4.4)
The shear stress carried by the concrete, VRd,c, is calculated as:
( )ρ σ = + 1 3
, , 1 1100Rd c Rd c ck cpV C k f k (EC2 6.4.4)
with a minimum of:
( ), min 1Rd c cpv v kσ= + (EC2 6.4.4)
2001 2.0kd
= + ≤ = 1.9578 (EC2 6.4.4(1))
k1 = 0.15. (EC2 6.2.2(1))
EXAMPLE Italian NTC 2008 RC-PN-001 - 4

Software Verification PROGRAM NAME: SAFE REVISION NO.: 0
ρ1 = db
A
w
s1 ≤ 0.02
Area of reinforcement at the face of column for design strip are as follows:
As in Strip Layer A = 9204.985 mm2
As in Strip Layer B = 8078.337 mm2
Average As = ( )9204.985 8078.337 2+ = 8641.661 mm2
ρ1 = ( )8641.661 8000 218• = 0.004955 ≤ 0.02
2123
min 035.0 ckfk=ν = ( ) ( )3/2 1/20.035 1.9578 30 = 0.525 N/mm2
( ) = • • • + 1 3
, 0.12 1.9578 100 0.004955 30 0Rd cv = 0.5777 N/mm2
max
,
1.099Shear Ratio 1.900.5777Rd c
vv
= = =
EXAMPLE Italian NTC 2008 RC-PN-001 - 5

Software VerificationPROGRAM NAME: SAFE REVISION NO.: 0
EXAMPLE Italian NTC 2008 RC-SL-001 Slab Flexural Design
PROBLEM DESCRIPTION The purpose of this example is to verify slab flexural design in SAFE.
A one-way, simple-span slab supported by walls on two opposite edges is modeled using SAFE. The slab is 150 mm thick and spans 4 meters between walls. The walls are modeled as pin supports. The computational model uses a finite element mesh, automatically generated by SAFE. The maximum element size is specified as 0.25 meters. To obtain factored moments and flexural reinforcement in a design strip, one one-meter wide strip is defined in the X-direction on the slab, as shown in Figure 1.
Figure 1 Plan View of One-Way Slab
One dead load case (DL4KPa) and one live load case (LL5KPa) with uniformly distributed surface loads of magnitudes 4 and 5 kN/m2, respectively, are defined in the model. A load combination (COMB5kPa) is defined using the Italian NTC 2008 load combination factors, 1.35 for dead loads and 1.5 for live loads. The model is analyzed for both load cases and the load combination.
The slab moment on a strip of unit width is computed analytically. The total factored strip moments are compared with the SAFE results. These moments are identical. After completing the analysis, design is performed using the Italian NTC 2008 code by SAFE and also by hand computation. Table 1 shows the comparison of the design reinforcements computed by the two methods.
EXAMPLE Italian NTC 2008 RC-SL-001 - 1

Software Verification PROGRAM NAME: SAFE REVISION NO.: 0 GEOMETRY, PROPERTIES AND LOADING
Thickness T, h = 150 mm Depth of tensile reinf. dc = 25 mm Effective depth d = 125 mm Clear span ln, l1 = 4000 mm Concrete strength fck = 30 MPa Yield strength of steel fsy = 460 MPa Concrete unit weight wc = 0 N/m3 Modulus of elasticity Ec = 25000 MPa Modulus of elasticity Es = 2x10⁶ MPa Poisson’s ratio ν = 0 Dead load wd = 4.0 kPa Live load wl = 5.0 kPa
TECHNICAL FEATURES OF SAFE TESTED Calculation of flexural reinforcement Application of minimum flexural reinforcement
RESULTS COMPARISON Table 1 shows the comparison of the SAFE total factored moments in the design strip the moments obtained by the hand computation method. Table 1 also shows the comparison of the design reinforcements.
Table 1 Comparison of Design Moments and Reinforcements
Method Strip Moment
(kN-m)
Reinforcement Area (sq-cm)
As+
SAFE 25.797 5.400
Calculated 25.800 5.400
,minA s+ = 204.642 sq-mm
COMPUTER FILE: Italian NTC 2008 RC-SL-001.FDB
CONCLUSION The SAFE results show an acceptable comparison with the independent results.
EXAMPLE Italian NTC 2008 RC-SL-001 - 2

Software Verification PROGRAM NAME: SAFE REVISION NO.: 0
HAND CALCULATION The following quantities are computed for the load combination:
0.1=η for fck ≤ 50 MPa
8.0=λ for fck ≤ 50 MPa
b = 1000 mm For the load combination, w and M are calculated as follows:
w = (1.35wd + 1.5wt) b 2
1
8wlM =
=
min
0 0013max 0 26
w
s , ctm
yk
. b dA f. bd
f
= 204.642 sq-mm
COMB100 wd = 4.0 kPa wt = 5.0 kPa w = 12.9 kN/m M-strip = 25.8 kN-m M-design= 25.8347 kN-m
γm, steel = 1.15
γm, concrete = 1.50 αcc = 0.85:
The depth of the compression block is given by: 6
2 2
25.8347 101000 125 1.0 0.85 30 /1.5cd
Mmbd fη
•= =
• • • • = 0.097260
−
=
limlimlim 2
1dx
dxm λλ = 0.48
EXAMPLE Italian NTC 2008 RC-SL-001 - 3

Software Verification PROGRAM NAME: SAFEREVISION NO.: 0
2
1
lim kk
dx −
=
δ for fck ≤ 50 MPa = 0.60
For reinforcement with fyk ≤ 500 MPa, the following values are used: k1 = 0.40 k2 = (0.6 + 0.0014/εcu2) = 1.00
δ is assumed to be 1
m211 −−=ω = 0.10251
=
yd
cds f
bdfA ηω = 544.61 sq-mm > As,min
As = 5.446 sq-cm
EXAMPLE Italian NTC 2008 RC-SL-001 - 4

Software Verification PROGRAM NAME: SAFE REVISION NO.: 0
EXAMPLE NZS 3101-06 PT-SL-001 Post-Tensioned Slab Design
PROBLEM DESCRIPTION The purpose of this example is to verify the slab stresses and the required area of mild steel strength reinforcing for a post-tensioned slab.
A one-way, simply supported slab is modeled in SAFE. The modeled slab is 254 mm thick by 915 mm wide and spans 9754 mm as, shown in shown in Figure 1.
Length, L = 9754 mm
Elevation Section
Prestressing tendon, Ap
Mild Steel, As
914 mm25 mm
229 mm
254 mm
Length, L = 9754 mm
Elevation Section
Prestressing tendon, Ap
Mild Steel, As
914 mm25 mm
229 mm
254 mm
Figure 1 One-Way Slab
EXAMPLE NZS 3101-06 PT-SL-001 - 1

Software Verification PROGRAM NAME: SAFE REVISION NO.: 0
A 254-mm-wide design strip is centered along the length of the slab and has been defined as an A-Strip. B-strips have been placed at each end of the span, perpendicular to Strip-A (the B-Strips are necessary to define the tendon profile). A tendon with two strands, each having an area of 99 mm2, has been added to the A-Strip. The self weight and live loads have been added to the slab. The loads and post-tensioning forces are as follows:
Loads: Dead = self weight, Live = 4.788 kN/m2
The total factored strip moments, required area of mild steel reinforcement, and slab stresses are reported at the midspan of the slab. Independent hand calculations were compared with the SAFE results and summarized for verification and validation of the SAFE results.
GEOMETRY, PROPERTIES AND LOADING Thickness T, h = 254 mm Effective depth d = 229 mm Clear span L = 9754 mm Concrete strength f 'c = 30 MPa Yield strength of steel fy = 400 MPa Prestressing, ultimate fpu = 1862 MPa Prestressing, effective fe = 1210 MPa Area of Prestress (single strand) Ap = 198 mm2 Concrete unit weight wc = 23.56 kN/m3 Modulus of elasticity Ec = 25000 N/mm3 Modulus of elasticity Es = 200,000 N/mm3 Poisson’s ratio ν = 0 Dead load wd = self kN/m2 Live load wl = 4.788 kN/m2
TECHNICAL FEATURES OF SAFE TESTED Calculation of the required flexural reinforcement Check of slab stresses due to the application of dead, live, and post-tensioning
loads.
RESULTS COMPARISON Table 1 shows the comparison of the SAFE total factored moments, required mild steel reinforcing, and slab stresses with the independent hand calculations.
EXAMPLE NZS 3101-06 PT-SL-001 - 2

Software VerificationPROGRAM NAME: SAFE REVISION NO.: 0
Table 1 Comparison of Results
FEATURE TESTED INDEPENDENT RESULTS
SAFE RESULTS DIFFERENCE
Factored moment, Mu (Ultimate) (kN-m)
156.12 156.14 0.01%
Area of Mild Steel req’d, As (sq-cm) 14.96 15.08 0.74%
Transfer Conc. Stress, top (D+PTI), MPa −5.058 −5.057 0.02%
Transfer Conc. Stress, bot (D+PTI), MPa 2.839 2.839 0.00%
Normal Conc. Stress, top (D+L+PTF), MPa −10.460 −10.465 0.05%
Normal Conc. Stress, bot (D+L+PTF), MPa 8.402 8.407 0.06%
Long-Term Conc. Stress, top (D+0.5L+PTF(L)), MPa −7.817 −7.817 0.00%
Long-Term Conc. Stress, bot (D+0.5L+PTF(L)), MPa 5.759 5.759 0.00%
COMPUTER FILE: NZS 3101-06 PT-SL-001.FDB
CONCLUSION The SAFE results show an acceptable comparison with the independent results.
EXAMPLE NZS 3101-06 PT-SL-001 - 3

Software Verification PROGRAM NAME: SAFE REVISION NO.: 0
HAND CALCULATIONS:
Design Parameters:
Mild Steel Reinforcing Post-Tensioning f’c = 30MPa fpu = 1862 MPa fy = 400MPa fpy = 1675 MPa Stressing Loss = 186 MPa Long-Term Loss = 94 MPa fi = 1490 MPa fe = 1210 MPa
φb = 0.85
1 0.85 for 55 MPacfα ′= ≤
1 0.85 for 30,cfβ ′= ≤
cb
c y s
c df Eε
ε=
+ = 214.7
amax = 0.75β1cb = 136.8 mm
Length, L = 9754 mm
Elevation Section
Prestressing tendon, Ap
Mild Steel, As
914 mm25 mm
229 mm
254 mm
Length, L = 9754 mm
Elevation Section
Prestressing tendon, Ap
Mild Steel, As
914 mm25 mm
229 mm
254 mm
Loads:
Dead, self-wt = 0.254 m × 23.56 kN/m3 = 5.984 kN/m2 (D) × 1.2 = 7.181kN/m2 (Du) Live, = 4.788 kN/m2 (L) × 1.5 = 7.182 kN/m2 (Lu) Total = 10.772 kN/m2 (D+L) = 14.363 kN/m2 (D+L)ult ω =10.772 kN/m2 × 0.914 m = 9.846 kN/m, ωu = 14.363 kN/m2 × 0.914 m = 13.128 kN/m
EXAMPLE NZS 3101-06 PT-SL-001 - 4

Software Verification PROGRAM NAME: SAFE REVISION NO.: 0
Ultimate Moment, 2
1
8UwlM = = 13.128 × (9.754)2/8 = 156.12 kN-m
Ultimate Stress in strand, 70300PS SE
P
f ' cf fρ
= + +
( )301210 70
300 0.000951385 MPa 200 1410 MPaSEf
= + +
= ≤ + =
Ultimate force in PT, ( ) ( )( ), 2 99 1385 1000 274.23 kNult PT P PSF A f= = =
Stress block depth, *
2
c
2Ma d df ' bα φ
= − −
( )
( )( )( )( )= − − =2 2 156.120.229 0.229 1 3 37.48 mm
0.85 30000 0.85 0.914e
Ultimate moment due to PT,
( ), ,37.48274.23 229 0.85 1000 49.01 kN-m
2 2ult PT ult PTaM F d φ = − = − =
Net ultimate moment, , 156.1 49.10 107.0 kN-m= − = − =net U ult PTM M M
Required area of mild steel reinforcing,
2107.0 (1 6) 1496 mm0.03748( ) 0.85(400000) 0.229
2 2φ
= = = − −
netS
y
MA eaf d
Check of Concrete Stresses at Midspan: Initial Condition (Transfer), load combination (D+PTi) = 1.0D+0.0L+1.0PTI
Tendon stress at transfer = jacking stress − stressing losses =1490 − 186 = 1304 MPa The force in the tendon at transfer, = ( )1304 197.4 1000 257.4 kN=
Moment due to dead load, ( )( )25.984 0.914 9.754 8 65.04 kN-mDM = = Moment due to PT, ( )(sag) 257.4 102 mm 1000 26.25 kN-mPT PTIM F= = =
Stress in concrete, ( )
257.4 65.04 26.230.254 0.914 0.00983
PTI D PTF M MfA S
− − −= ± = ±
where S = 0.00983m3
EXAMPLE NZS 3101-06 PT-SL-001 - 5

Software Verification PROGRAM NAME: SAFEREVISION NO.: 0
1 109 3 948f . . MPa= − ± 5.058(Comp) max, 2.839(Tension) max= −f
Normal Condition, load combinations: (D+L+PTF) = 1.0D+1.0L+1.0PTF
Tendon stress at normal = jacking − stressing − long-term = 1490 − 186 − 94 = 1210 MPa The force in tendon at normal, = ( )1210 197.4 1000 238.9 kN=
Moment due to dead load, ( )( )25.984 0.914 9.754 8 65.04 kN-mDM = =
Moment due to live load, ( )( )24.788 0.914 9.754 8 52.04 kN-mLM = =
Moment due to PT, ( )(sag) 238.9 102 mm 1000 24.37 kN-mPT PTIM F= = =
Stress in concrete for (D+L+PTF),
( )238.8 117.08 24.37
0.254 0.914 0.00983PTI D L PTF M MfA S
+ − − −= ± = ±
1 029 9 431f . .= − ± 10.460(Comp) max, 8.402(Tension) max= −f
Long-Term Condition, load combinations: (D+0.5L+PTF(L)) = 1.0D+0.5L+1.0PTF
Tendon stress at normal = jacking − stressing − long-term = 1490 − 186 − 94 = 1210 MPa The force in tendon at normal, = ( )1210 197.4 1000 238.9 kN=
Moment due to dead load, ( )( )25.984 0.914 9.754 8 65.04 kN-mDM = =
Moment due to live load, ( )( )24.788 0.914 9.754 8 52.04 kN-mLM = =
Moment due to PT, ( )(sag) 238.9 102 mm 1000 24.37 kN-mPT PTIM F= = =
Stress in concrete for (D+0.5L+PTF(L)),
( )0.5 238.9 91.06 24.33
0.254 0.914 0.00983D L PTPTI M MFf
A S+ − − −
= ± = ±
1 029 6 788f . .= − ± 7.817(Comp) max, 5.759(Tension) max= −f
EXAMPLE NZS 3101-06 PT-SL-001 - 6

Software Verification PROGRAM NAME: SAFE REVISION NO.: 0
EXAMPLE NZS 3101-06 RC-BM-001 Flexural and Shear Beam Design
PROBLEM DESCRIPTION The purpose of this example is to verify slab flexural design in SAFE. The load level is adjusted for the case corresponding to the following conditions:
The stress-block extends below the flange but remains within the balanced condition permitted by NZS 3101-06.
The average shear stress in the beam is below the maximum shear stress allowed by NZS 3101-06, requiring design shear reinforcement.
A simple-span, 6-m-long, 300-mm-wide, and 500-mm-deep T beam with a flange 100 mm thick and 600 mm wide is modeled using SAFE. The beam is shown in Figure 1. The computational model uses a finite element mesh of frame elements, automatically generated by SAFE. The maximum element size has been specified to be 200 mm. The beam is supported by columns without rotational stiffnesses and with very large vertical stiffness (1 × 10²⁰ kN/m).
The beam is loaded with symmetric third-point loading One dead load case (DL50) and one live load case (LL130) with only symmetric third-point loads of magnitudes 50, and 130 kN, respectively, are defined in the model. One load combinations (COMB130) is defined with the NZS 3101-06 load combination factors of 1.2 for dead loads and 1.5 for live loads. The model is analyzed for both of these load cases and the load combinations.
The beam moment and shear force are computed analytically. The total factored moment and shear force are compared with the SAFE results. These moment and shear force are identical. After completing the analysis, design is performed using the NZS 3101-06 code in SAFE and also by hand computation. Table 1 shows the comparison of the design longitudinal reinforcements. Table 2 shows the comparison of the design shear reinforcements.
EXAMPLE NZS 3101-06 RC-BM-001 - 1

Software Verification PROGRAM NAME: SAFEREVISION NO.: 0
Beam Section
75 mm 100 mm
300 mm
600 mm
75 mm
500 mm
Shear Force
Bending Moment
2000 mm 2000 mm 2000 mm
Beam Section
75 mm 100 mm
300 mm
600 mm
75 mm
500 mm
Shear Force
Bending Moment
2000 mm 2000 mm 2000 mm
Figure 1 The Model Beam for Flexural and Shear Design
EXAMPLE NZS 3101-06 RC-BM-001 - 2

Software Verification PROGRAM NAME: SAFE REVISION NO.: 0
GEOMETRY, PROPERTIES AND LOADING Clear span, l = 6000 mm Overall depth, h = 500 mm Flange Thickness, ds = 100 mm Width of web, bw = 300 mm Width of flange, bf = 600 mm Depth of tensile reinf., dc = 75 mm Effective depth, d = 425 mm Depth of comp. reinf., d' = 75 mm Concrete strength, f'
c = 30 MPa Yield strength of steel, fy = 460 MPa Concrete unit weight, wc = 0 kN/m3 Modulus of elasticity, Ec = 25x105 MPa Modulus of elasticity, Es = 2x10⁸ MPa Poisson’s ratio, v = 0.2 Dead load, Pd = 50 kN Live load, Pl = 130 kN
TECHNICAL FEATURES OF SAFE TESTED Calculation of flexural and shear reinforcement Application of minimum flexural and shear reinforcement
RESULTS COMPARISON Table 1 shows the comparison of the SAFE total factored moments in the design strip with the moments obtained by the analytical method. They match exactly for this problem. Table 1 also shows the comparison of design reinforcements.
Table 1 Comparison of Moments and Flexural Reinforcements
Method Moment (kN-m)
Reinforcement Area (sq-cm)
As+
SAFE 510 35.046
Calculated 510 35.046
,mins+A = 535.82 sq-m
EXAMPLE NZS 3101-06 RC-BM-001 - 3

Software Verification PROGRAM NAME: SAFEREVISION NO.: 0
Table 2 Comparison of Shear Reinforcements
Shear Force (kN)
Reinforcement Area, s
Av
(sq-cm/m)
SAFE Calculated
255 14.962 14.89
COMPUTER FILE: NZS 3101-06 RC-BM-001.FDB
CONCLUSION The SAFE results show an acceptable close comparison with the independent results.
EXAMPLE NZS 3101-06 RC-BM-001 - 4

Software Verification PROGRAM NAME: SAFE REVISION NO.: 0
HAND CALCULATION
Flexural Design The following quantities are computed for the load combination:
φb = 0.85
1 0.85 for 55cf MPaα ′= ≤
1 0.85 for 30,cfβ ′= ≤
cb
c y s
c df Eε
ε=
+ = 240.56 mm
amax = 0.75β1cb= 153.36 mm
min
535 824
max1 4 136 96
cc
ys ,
c
y
fA .
fA
A. .f
′=
= =
sq-mm
= 535.82 sq-mm
COMB130 N* = (1.2Nd + 1.5Nt) = 255 kN
**
3N lM = = 510 kN-m
The depth of the compression block is given by:
*2
'1
2
c b f
Ma d d
f bα φ= − − = 105.322 mm (a > Ds)
The compressive force developed in the concrete alone is given by: Cf is given by:
( )1f c f w fC f b b hα ′= − = 765 kN
EXAMPLE NZS 3101-06 RC-BM-001 - 5

Software Verification PROGRAM NAME: SAFEREVISION NO.: 0
Therefore, As1 = y
f
fC
and the portion of M* that is resisted by the flange is given
by:
bs
ffddCM φ
−=
2* = 243.84375 kN-m
As1 = y
f
fC
= 1663.043 sq-mm
Therefore, the balance of the moment, M*, to be carried by the web is:
M*w = M* − M*
f = 510 − 243.84375 = 266.15625 kN-m The web is a rectangular section with dimensions bw and d, for which the depth of the compression block is recalculated as:
21
1
2 *w
c b w
Ma d df bα φ
= − −′
= 110.7354 mm ≤ amax
If a1 ≤ amax (NZS 9.3.8.1), the area of tension reinforcement is then given by:
As2 =
−
21
*
adf
M
yb
w
φ = 1841.577 sq-mm
As = As1 + As2 = 3504.62 sq-mm
Shear Design The basic shear strength for rectangular section is computed as,
νb =
+
dbA
w
s1007.0 cf ′ = 0.3834
cf ′ ≤ 50 MPa, and
0.08 cf ′ = 0.438 MPa ≤ νb ≤ 0.2 cf ′ = 1.095 MPa
νc = kd ka νb = 0.438 where (kd =1.0, ka=1.0) The average shear stress is limited to a maximum limit of,
vmax = min{ }0.2 , 8 MPa′cf = min{6, 8} = 6 MPa
EXAMPLE NZS 3101-06 RC-BM-001 - 6

Software VerificationPROGRAM NAME: SAFE REVISION NO.: 0
The shear reinforcement is computed as follows:
If ν* ≤ φs ( )2cv or h ≤ max(300 mm, 0.5bw)
sAv = 0 (NZS 9.3.9.4.13)
If φs ( )2cv < ν* ≤ φsνc,
sAv = 1
16′ wc
yt
bff
(NZS 9.3.9.4.15)
If φsνc < ν* ≤ φsνmax, (NZS 9.3.9.4.2)
( )dfvv
sA
yts
csv
φφ−
=*
If ν* > νmax, a failure condition is declared.
For the load combination, the N* and V* are calculated as follows: N* = 1.2Nd + 1.5N1
V* = N*
ν* = db
V
w
*
(COMB130) Nd = 50 kips Nl = 130 kips V* = 255 kN
ν* = db
V
w
*
= 2.0 MPa (φsνc < ν* ≤ φsνmax)
( )*s c wv
s yt
v v bAs f
φ
φ
−= = 1.489 sq-mm/mm = 1489 sq-mm/m
EXAMPLE NZS 3101-06 RC-BM-001 - 7

Software Verification PROGRAM NAME: SAFE REVISION NO.: 0
EXAMPLE NZS 3101-06 RC-PN-001 Slab Punching Shear Design
PROBLEM DESCRIPTION The purpose of this example is to verify slab punching shear design in SAFE
The numerical example is a flat slab that has three 8 m spans in each direction, as shown in Figure 1.
4
A
3
2
1
B C D
X
Y
0.3 m0.3 m8 m8 m8 m
0.6 m
0.6 m
0.25 m thick flat slab
LoadingDL = Self weight + 1.0 kN/m2
LL = 4.0 kN/m2
Columns are 0.3 m x 0.9 mwith long side parallel to the Y-axis, typical
Concrete PropertiesUnit weight = 24 kN/m3
f'c = 30 N/mm2
8 m
8 m
8 m
4
A
3
2
1
B C D
X
Y
0.3 m0.3 m8 m8 m8 m
0.6 m
0.6 m
0.25 m thick flat slab
LoadingDL = Self weight + 1.0 kN/m2
LL = 4.0 kN/m2
Columns are 0.3 m x 0.9 mwith long side parallel to the Y-axis, typical
Concrete PropertiesUnit weight = 24 kN/m3
f'c = 30 N/mm2
8 m
8 m
8 m
Figure 1: Flat Slab for Numerical Example
The slab overhangs beyond the face of the column by 0.15 m along each side of the structure. The columns are typically 0.3 m x 0.9 m with the long side parallel to the Y-axis. The slab is typically 0.25 m thick. Thick plate properties are used for the slab.
The concrete has a unit weight of 24 kN/m3 and a f 'c of 30 N/mm2. The dead load consists of the self weight of the structure plus an additional 1 kN/m2. The live load is 4 kN/m2.
EXAMPLE NZS 3101-06 RC-PN-001 - 1

Software Verification PROGRAM NAME: SAFEREVISION NO.: 0
TECHNICAL FEATURES OF SAFE TESTED Calculation of punching shear capacity, shear stress and D/C ratio.
RESULTS COMPARISON Table 1 shows the comparison of the punching shear capacity, shear stress ratio and D/C ratio obtained from SAFE with the punching shear capacity, shear stress ratio and D/C ratio obtained by the analytical method. They match exactly for this problem.
Table 1 Comparison of Design Results for Punching Shear at Grid B-2
Method Shear Stress
(N/mm2) Shear Capacity
(N/mm2) D/C ratio
SAFE 1.792 1.141 1.57
Calculated 1.792 1.141 1.57
COMPUTER FILE: NZS 3101-06 RC-PN-001.FDB
CONCLUSION The SAFE results show an exact comparison with the independent results.
EXAMPLE NZS 3101-06 RC-PN-001 - 2

Software Verification PROGRAM NAME: SAFE REVISION NO.: 0
HAND CALCULATION Hand Calculation For Interior Column Using SAFE Method
( ) ( )[ ]259 26 250 38 2d = − + − = 218 mm
Refer to Figure 2. b0 = 518+ 1118 + 1118 + 518 = 3272 mm
450
450
X
Y
1118
518
Side 2
Side
3
A B
CD
Column
Side
1
Side 4
Center of column is point (x1, y1). Set this equal to (0,0).
Critical section for punching shear shown dashed.
150
109
109
Note: All dimensions in millimeters
150 109
X
Y
Side 2A B
CD
109
Note: All dimensions in millimeters
450
450
X
Y
1118
518
Side 2
Side
3
A B
CD
Column
Side
1
Side 4
Center of column is point (x1, y1). Set this equal to (0,0).
Critical section for punching shear shown dashed.
150
109
109
Note: All dimensions in millimeters
150 109
X
Y
Side 2A B
CD
109
Note: All dimensions in millimeters
Figure 2: Interior Column, Grid B-2 in SAFE Model
211 0.495
2 111813 518
γ = − = +
V
311 0.312
2 51813 1118
γ = − = +
V
The coordinates of the center of the column (x1, y1) are taken as (0, 0).
EXAMPLE NZS 3101-06 RC-PN-001 - 3

Software Verification PROGRAM NAME: SAFE REVISION NO.: 0
The following table is used for calculating the centroid of the critical section for punching shear. Side 1, Side 2, Side 3, and Side 4 refer to the sides of the critical section for punching shear as identified in Figure 2.
Item Side 1 Side 2 Side 3 Side 4 Sum x2 −259 0 259 0 N.A. y2 0 559 0 −559 N.A. L 1118 518 1118 518 b0 = 3272 d 218 218 218 218 N.A.
Ld 243724 112924 243724 112924 713296 Ldx2 −63124516 0 63124516 0 0 Ldy2 0 63124516 0 −63124516 0
2
30 0
713296Ldx
x mmLd
= = =∑
23
0 0713296
Ldyy mm
Ld= = =∑
The following table is used to calculate IXX, IYY and IXY. The values for IXX, IYY and IXY are given in the "Sum" column.
Item Side 1 Side 2 Side 3 Side 4 Sum L 1118 518 1118 518 N.A. d 218 218 218 218 N.A.
x2 − x3 −259 0 259 0 N.A. y2 − y3 0 559 0 −559 N.A.
Parallel to Y-Axis X-axis Y-Axis X-axis N.A. Equations 5b, 6b, 7 5a, 6a, 7 5b, 6b, 7 5a, 6a, 7 N.A.
IXX 2.64E+10 3.53E+10 2.64E+10 3.53E+10 1.23E+11 IYY 1.63E+10 2.97E+09 1.63E+10 2.97E+09 3.86E+10 IXY 0 0 0 0 0
From the SAFE output at Grid B-2:
VU = 1126.498 kN
2Vγ MU2 = −25.725 kN-m
3Vγ MU3 = 14.272 kN-m
EXAMPLE NZS 3101-06 RC-PN-001 - 4

Software VerificationPROGRAM NAME: SAFE REVISION NO.: 0
At the point labeled A in Figure 2, x4 = −259 and y4 = 559, thus:
( ) ( )( )( )( ) ( )
( ) ( )( )( )( ) ( )
6 103
211 10
6 11
211 10
25.725 10 3.86 10 559 0 0 259 01126.498 103272 218 1.23 10 3.86 10 0
14.272 10 1.23 10 259 0 0 559 0
1.23 10 3.86 10 0
Uv • • − − − −• = − +
• • • − • • − − − −
• • −
vU = 1.5793 − 0.1169 − 0.0958 = 1.3666 N/mm2 at point A
At the point labeled B in Figure 2, x4 = 259 and y4 = 559, thus:
( ) ( )( )( )( ) ( )
( ) ( )( )( )( ) ( )
6 103
211 10
6 11
211 10
25.725 10 3.86 10 559 0 0 259 01126.498 103272 218 1.23 10 3.86 10 0
14.272 10 1.23 10 259 0 0 559 0
1.23 10 3.86 10 0
Uv • • − − −• = − +
• • • − • • − − − • • −
vU = 1.5793 − 0.1169 + 0.0958 =1.5582 N/mm2 at point B
At the point labeled C in Figure 2, x4 = 259 and y4 = −559, thus:
( ) ( )( )( )( ) ( )
( ) ( )( )( )( ) ( )
6 103
211 10
6 11
211 10
25.725 10 3.86 10 559 0 0 259 01126.498 103272 218 1.23 10 3.86 10 0
14.272 10 1.23 10 259 0 0 559 0
1.23 10 3.86 10 0
Uv • • − − − −• = − +
• • • − • • − − − −
• • −
vU = 1.5793 + 0.1169 + 0.0958 = 1.792 N/mm2 at point C
At the point labeled D in Figure 2, x4 = −259 and y4 = −559, thus:
( ) ( )( )( )( ) ( )
( ) ( )( )( )( ) ( )
6 103
211 10
6 11
211 10
25.725 10 3.86 10 559 0 0 259 01126.498 103272 218 1.23 10 3.86 10 0
14.272 10 1.23 10 259 0 0 559 0
1.23 10 3.86 10 0
Uv • • − − − − −• = − +
• • • − • • − − − − −
• • −
vU = 1.5793 + 0.1169 − 0.0958 = 1.6004 N/mm2 at point D
Point C has the largest absolute value of vu, thus vmax = 1.792 N/mm2
EXAMPLE NZS 3101-06 RC-PN-001 - 5

Software Verification PROGRAM NAME: SAFEREVISION NO.: 0
The shear capacity is calculated based on the smallest of NZS 3101-06, with the bo and u terms removed to convert force to stress.
0
1 2161min 1613
cc
sv c
c
f
dv fb
f
ϕβ
αϕ ϕ
ϕ
′+
′= +
′
= 1.141N/mm2 per (NZS 12.7.3.2)
NZS 12.7.3.2 yields the smallest value of ϕ vv = 1.141 N/mm2, and thus this is the shear capacity.
1.792Shear Ratio 1.571.141
U
v
vvϕ
= = =
EXAMPLE NZS 3101-06 RC-PN-001 - 6

Software Verification PROGRAM NAME: SAFE REVISION NO.: 0
EXAMPLE NZS 3101-06 RC-SL-001 Slab Flexural Design
PROBLEM DESCRIPTION The purpose of this example is to verify slab flexural design in SAFE.
A one-way, simple-span slab supported by walls on two opposite edges is modeled using SAFE. The slab is 150 mm thick and spans 4 meters between walls. The walls are modeled as pin supports. The computational model uses a finite element mesh, automatically generated by SAFE. The maximum element size is specified as 0.25 meters. To obtain factored moments and flexural reinforcement in a design strip, one one-meter wide strip is defined in the X-direction on the slab, as shown in Figure 1.
Figure 1 Plan View of One-Way Slab
One dead load case (DL4KPa) and one live load case (LL5KPa) with uniformly distributed surface loads of magnitudes 4 and 5 kN/m2, respectively, are defined in the model. A load combination (COMB5kPa) is defined using the NZS 3101-06 load combination factors, 1.2 for dead loads and 1.5 for live loads. The model is analyzed for both load cases and the load combination.
The slab moment on a strip of unit width is computed analytically. The total factored strip moments are compared with the SAFE results. After completing analysis, design is performed using the NZS 3101-06 code by SAFE and also by hand computation. Table 1 shows the comparison of the design reinforcements computed using the two methods.
EXAMPLE NZS 3101-06 RC-SL-001 - 1

Software Verification PROGRAM NAME: SAFE REVISION NO.: 0 GEOMETRY, PROPERTIES AND LOADING
Thickness T, h = 150 mm Depth of tensile reinf. dc = 25 mm Effective depth d = 125 mm Clear span ln, l1 = 4000 mm Concrete strength fc = 30 MPa Yield strength of steel fsy = 460 MPa Concrete unit weight wc = 0 N/m3 Modulus of elasticity Ec = 25000 MPa Modulus of elasticity Es = 2×10⁶ MPa Poisson’s ratio ν = 0 Dead load wd = 4.0 kPa Live load wl = 5.0 kPa
TECHNICAL FEATURES OF SAFE TESTED Calculation of flexural reinforcement Application of minimum flexural reinforcement
RESULTS COMPARISON Table 1 shows the comparison of the SAFE total factored moments in the design strip with the moments obtained by the hand computation method. Table 1 also shows the comparison of design reinforcements.
Table 1 Comparison of Design Moments and Reinforcements
Load Level Method
Strip Moment (kN-m)
Reinforcement Area (sq-cm)
As+
Medium SAFE 24.597 5.238
Calculated 24.6 5.238
,minA s+ = 380.43 sq-mm
EXAMPLE NZS 3101-06 RC-SL-001 - 2

Software VerificationPROGRAM NAME: SAFE REVISION NO.: 0
COMPUTER FILE: NZS 3101-06 RC-SL-001.FDB
CONCLUSION The SAFE results show an exact comparison with the independent results.
EXAMPLE NZS 3101-06 RC-SL-001 - 3

Software Verification PROGRAM NAME: SAFE REVISION NO.: 0
HAND CALCULATION The following quantities are computed for the load combination:
φb = 0.85 b = 1000 mm
1 0.85 for 55MPacfα ′= ≤
1 0.85 for 30,cfβ ′= ≤
cb
c y s
c df Eε
ε=
+ = 70.7547
amax = 0.75β1cb= 45.106 mm For the load combination, w and M* are calculated as follows:
w = (1.2wd + 1.5wt) b
8
21wlMu =
min
372 09 sq-mm4
max1 4 380 43 sq-mm
cw
ys ,
w
y
fb d .
fA
b d. .f
′=
= =
= 380.43 sq-mm
COMB100 wd = 4.0 kPa wt = 5.0 kPa w = 12.3 kN/m M*
-strip = 24.6 kN-m M*
-design = 24.6331 kN-m The depth of the compression block is given by:
*2
1
2c b
Ma d df bα φ
= − −′
= 9.449 mm < amax
EXAMPLE NZS 3101-06 RC-SL-001 - 4

Software Verification PROGRAM NAME: SAFE REVISION NO.: 0
The area of tensile steel reinforcement is then given by:
*
2
s
b y
MAaf dφ
= −
= 523.799 sq-mm > As,min
As = 5.238 sq-cm
EXAMPLE NZS 3101-06 RC-SL-001 - 5

Software VerificationPROGRAM NAME: SAFE REVISION NO.: 0
EXAMPLE Singapore CP 65-99 PT-SL-001 Post-Tensioned Slab Design
PROBLEM DESCRIPTION The purpose of this example is to verify the slab stresses and the required area of mild steel strength reinforcing for a post-tensioned slab.
A one-way, simply supported slab is modeled in SAFE. The modeled slab is 254 mm thick by 914 mm wide and spans 9754 mm, as shown in shown in Figure 1.
Length, L = 9754 mm
Elevation Section
Prestressing tendon, Ap
Mild Steel, As
914 mm25 mm
229 mm
254 mm
Length, L = 9754 mm
Elevation Section
Prestressing tendon, Ap
Mild Steel, As
914 mm25 mm
229 mm
254 mm
Figure 1 One-Way Slab
EXAMPLE Singapore CP 65-99 PT-SL-001 - 1

Software Verification PROGRAM NAME: SAFE REVISION NO.: 0
A 254-mm-wide design strip is centered along the length of the slab and has been defined as an A-Strip. B-strips have been placed at each end of the span, perpendicular to Strip-A (the B-Strips are necessary to define the tendon profile). A tendon with two strands, each having an area of 99 mm2, has been added to the A-Strip. The self weight and live loads have been added to the slab. The loads and post-tensioning forces are as follows.
Loads: Dead = self weight, Live = 4.788 kN/m2
The total factored strip moments, required area of mild steel reinforcement, and slab stresses are reported at the mid-span of the slab. Independent hand calculations are compared with the SAFE results and summarized for verification and validation of the SAFE results.
GEOMETRY, PROPERTIES AND LOADING Thickness T, h = 254 mm Effective depth d = 229 mm Clear span L = 9754 mm Concrete strength f 'c = 30 MPa Yield strength of steel fy = 400 MPa Prestressing, ultimate fpu = 1862 MPa Prestressing, effective fe = 1210 MPa Area of Prestress (single strand) Ap = 198 mm2 Concrete unit weight wc = 23.56 kN/m3 Modulus of elasticity Ec = 25000 N/mm3 Modulus of elasticity Es = 200,000 N/mm3 Poisson’s ratio ν = 0 Dead load wd = self kN/m2 Live load wl = 4.788 kN/m2
TECHNICAL FEATURES OF SAFE TESTED Calculation of the required flexural reinforcement Check of slab stresses due to the application of dead, live, and post-tensioning
loads
RESULTS COMPARISON Table 1 shows the comparison of the SAFE total factored moments, required mild steel reinforcing, and slab stresses with the independent hand calculations.
EXAMPLE Singapore CP 65-99 PT-SL-001 - 2

Software VerificationPROGRAM NAME: SAFE REVISION NO.: 0
Table 1 Comparison of Results
FEATURE TESTED INDEPENDENT RESULTS
SAFE RESULTS DIFFERENCE
Factored moment, Mu (Ultimate) (kN-m)
174.4 174.4 0.00%
Area of Mild Steel req’d, As (sq-cm) 19.65 19.79 0.71%
Transfer Conc. Stress, top (D+PTI), MPa −5.058 −5.057 0.02%
Transfer Conc. Stress, bot (D+PTI), MPa 2.839 2.839 0.00%
Normal Conc. Stress, top (D+L+PTF), MPa −10.460 −10.465 0. 50%
Normal Conc. Stress, bot (D+L+PTF), MPa 8.402 8.407 0.06%
COMPUTER FILE: SINGAPORE CP 65-99 PT-SL-001.FDB
CONCLUSION The SAFE results show an acceptable comparison with the independent results.
EXAMPLE Singapore CP 65-99 PT-SL-001 - 3

Software Verification PROGRAM NAME: SAFE REVISION NO.: 0
HAND CALCULATIONS:
Design Parameters:
Mild Steel Reinforcing Post-Tensioning f’c = 30MPa fpu = 1862 MPa fy = 400MPa fpy = 1675 MPa Stressing Loss = 186 MPa Long-Term Loss = 94 MPa fi = 1490 MPa fe = 1210 MPa
γm, steel = 1.15
γm, concrete = 1.50
Length, L = 9754 mm
Elevation Section
Prestressing tendon, Ap
Mild Steel, As
914 mm25 mm
229 mm
254 mm
Length, L = 9754 mm
Elevation Section
Prestressing tendon, Ap
Mild Steel, As
914 mm25 mm
229 mm
254 mm
Loads: Dead, self-wt = 0.254 m × 23.56 kN/m3 = 5.984 kN/m2 (D) × 1.4 = 8.378 kN/m2 (Du) Live, = 4.788 kN/m2 (L) × 1.6 = 7.661 kN/m2 (Lu) Total = 10.772 kN/m2 (D+L) = 16.039 kN/m2 (D+L)ult ω =10.772 kN/m2 × 0.914 m = 9.846 kN/m, ωu = 16.039 kN/m2 × 0.914 m = 14.659 kN/m
Ultimate Moment, 2
1
8=U
wlM = 14.659 × (9.754)2/8 = 174.4 kN-m
EXAMPLE Singapore CP 65-99 PT-SL-001 - 4

Software VerificationPROGRAM NAME: SAFE REVISION NO.: 0
Ultimate Stress in strand, 7000 1 1.7/
= + −
pu ppb pe
cu
f Af f
l d f bd
7000 1862(198)1210 1 1.79754 / 229 30(914)(229)
1358 MPa 0.7 1303 MPa
= + −
= ≤ =puf
K factor used to determine the effective depth is given as:
2bdfMK
cu
= = 2
174.4 0.121330000(0.914)(0.229)
= < 0.156
dKdz 95.09.0
25.05.0 ≤
−+= = 192.2 mm
Ultimate force in PT, ( )( ), ( ) 2 99 1303 1000 258.0 kNult PT P PSF A f= = =
Ultimate moment due to PT, ( ), , ( ) / 258.0 0.192 1.15 43.12 kN-mult PT ult PTM F z γ= = =
Net Moment to be resisted by As, NET U PTM M M= −
174.4 43.12 131.28 kN-m= − =
The area of tensile steel reinforcement is then given by:
0.87= NET
sy X
MAf z
= ( )( )
( ) = 2131.28 1 6 1965 mm0.87 400 192
e
Check of Concrete Stresses at Midspan:
Initial Condition (Transfer), load combination (D+PTi) = 1.0D+0.0L+1.0PTI
Tendon stress at transfer = jacking stress − stressing losses = 1490 − 186 = 1304 MPa The force in the tendon at transfer, = ( )1304 197.4 1000 257.4 kN=
Moment due to dead load, ( )( )25.984 0.914 9.754 8 65.04 kN-mDM = = Moment due to PT, ( )(sag) 257.4 102 mm 1000 26.25 kN-mPT PTIM F= = =
Stress in concrete, ( )
257.4 65.04 26.230.254 0.914 0.00983
PTI D PTF M MfA S
− − −= ± = ±
where S = 0.00983m3
1.109 3.948 MPaf = − ± 5.058(Comp) max, 2.839(Tension) max= −f
EXAMPLE Singapore CP 65-99 PT-SL-001 - 5

Software Verification PROGRAM NAME: SAFE REVISION NO.: 0 Normal Condition, load combinations: (D+L+PTF) = 1.0D+1.0L+1.0PTF Tendon stress at normal = jacking − stressing − long-term = 1490 − 186 − 94 = 1210 MPa The force in tendon at normal, = ( )1210 197.4 1000 238.9 kN=
Moment due to dead load, ( )( )25.984 0.914 9.754 8 65.04 kN-mDM = =
Moment due to live load, ( )( )24.788 0.914 9.754 8 52.04 kN-mLM = = Moment due to PT, ( )(sag) 238.9 102 mm 1000 24.37 kN-mPT PTIM F= = = Stress in concrete for (D+L+PTF),
( )
238.8 117.08 24.370.254 0.914 0.00983
PTI D L PTF M MfA S
+ − − −= ± = ±
1 029 9 431f . .= − ± 10.460(Comp) max, 8.402(Tension) max= −f
EXAMPLE Singapore CP 65-99 PT-SL-001 - 6

Software VerificationPROGRAM NAME: SAFE REVISION NO.: 0
EXAMPLE SINGAPORE CP 65-99 RC-BM-001 Flexural and Shear Beam Design
PROBLEM DESCRIPTION The purpose of this example is to verify slab flexural design in SAFE. The load level is adjusted for the case corresponding to the following conditions:
The stress-block extends below the flange but remains within the balancedcondition permitted by Singapore CP 65-99.
The average shear stress in the beam is below the maximum shear stressallowed by Singapore CP 65-99, requiring design shear reinforcement.
A simple-span, 6-m-long, 300-mm-wide, and 500-mm-deep T-beam with a flange 100 mm thick and 600 mm wide is modeled using SAFE. The beam is shown in Figure 1. The computational model uses a finite element mesh of frame elements, automatically generated by SAFE. The maximum element size has been specified to be 200 mm. The beam is supported by columns without rotational stiffnesses and with very large vertical stiffness (1×10²⁰ kN/m).
The beam is loaded with symmetric third-point loading. One dead load case (DL20) and one live load case (LL80) with only symmetric third-point loads of magnitudes 20, and 80 kN, respectively, are defined in the model. One load combinations (COMB80) is defined with the Singapore CP 65-99 load combination factors of 1.4 for dead loads and 1.6 for live loads. The model is analyzed for both of these load cases and the load combinations.
The beam moment and shear force are computed analytically. The total factored moment and shear force are compared with the SAFE results. These moment and shear force are identical. After completing the analysis, design is performed using the Singapore CP 65-99 code in SAFE and also by hand computation. Table 1 shows the comparison of the design longitudinal reinforcements. Table 2 shows the comparison of the design shear reinforcements.
EXAMPLE SINGAPORE CP 65-99 RC-BM-001 - 1

Software Verification PROGRAM NAME: SAFE REVISION NO.: 0
Beam Section
75 mm 100 mm
300 mm
600 mm
75 mm
500 mm
Shear Force
Bending Moment
2000 mm 2000 mm 2000 mm
Beam Section
75 mm 100 mm
300 mm
600 mm
75 mm
500 mm
Shear Force
Bending Moment
2000 mm 2000 mm 2000 mm
Figure 1 The Model Beam for Flexural and Shear Design
EXAMPLE SINGAPORE CP 65-99 RC-BM-001 - 2

Software Verification PROGRAM NAME: SAFE REVISION NO.: 0 GEOMETRY, PROPERTIES AND LOADING
Clear span, l = 6000 mm Overall depth, h = 500 mm Flange Thickness, ds = 100 mm Width of web, bw = 300 mm Width of flange, bf = 600 mm Depth of tensile reinf., dc = 75 mm Effective depth, d = 425 mm Depth of comp. reinf., d' = 75 mm Concrete strength, f'
c = 30 MPa Yield strength of steel, fy = 460 MPa Concrete unit weight, wc = 0 kN/m3 Modulus of elasticity, Ec = 25×105 MPa Modulus of elasticity, Es = 2×10⁸ MPa Poisson’s ratio, v = 0.2 Dead load, Pd = 20 kN Live load, Pl = 80 kN
TECHNICAL FEATURES OF SAFE TESTED Calculation of flexural and shear reinforcement Application of minimum flexural and shear reinforcement
RESULTS COMPARISON Table 1 shows the comparison of the SAFE total factored moments in the design strip with the moments obtained by the analytical method. They match exactly for this problem. Table 1 also shows the comparison of design reinforcements.
Table 1 Comparison of Moments and Flexural Reinforcements
Method Moment (kN-m)
Reinforcement Area (sq-cm)
As+
SAFE 312 20.904
Calculated 312 20.904
,mins+A = 195.00 sq-mm
EXAMPLE SINGAPORE CP 65-99 RC-BM-001 - 3

Software Verification PROGRAM NAME: SAFEREVISION NO.: 0
Table 2 Comparison of Shear Reinforcements
Shear Force (kN)
Reinforcement Area, s
Av
(sq-cm/m)
SAFE Calculated
156 6.50 6.50
COMPUTER FILE: SINGAPORE CP 65-99 RC-002.FDB
CONCLUSION The SAFE results show an exact comparison with the independent results.
EXAMPLE SINGAPORE CP 65-99 RC-BM-001 - 4

Software Verification PROGRAM NAME: SAFE REVISION NO.: 0
HAND CALCULATION
Flexural Design The following quantities are computed for all the load combinations:
γm, steel = 1.15
γm, concrete = 1.50
min 0 0013s , wA . b h=
= 195.00 sq-mm
COMB80 P = (1.4Pd + 1.6Pt) = 156 kN
**
3N lM = = 312 kN-m
The depth of the compression block is given by:
K = 2dbfM
fcu
= 0.095963 < 0.156
Then the moment arm is computed as:
z = d
−+9.0
25.05.0 K ≤ 0.95d = 373.4254 mm
The depth of the neutral axis is computed as:
x = 45.01 (d − z) = 114.6102 mm
And the depth of the compression block is given by: a = 0.9x = 103.1492 mm > hf
The ultimate resistance moment of the flange is given by:
( ) ( )0.67 0.5f cu f w f fc
M f b b h d hγ
= − − = 150.75 kN-m
EXAMPLE SINGAPORE CP 65-99 RC-BM-001 - 5

Software Verification PROGRAM NAME: SAFE REVISION NO.: 0
The moment taken by the web is computed as:
fw MMM −= = 161.25 kN-m
And the normalized moment resisted by the web is given by:
Kw = 2w
cu w
Mf b d
= 0.0991926 < 0.156
If Kw ≤ 0.156 (BS 3.4.4.4), the beam is designed as a singly reinforced concrete beam. The reinforcement is calculated as the sum of two parts: one to balance compression in the flange and one to balance compression in the web.
dKdz w 95.09.0
25.05.0 ≤
−+= = 371.3988 mm
( )0.5
f ws
y yf
s s
M MA f fd h z
γ γ
= +−
= 2090.4 sq-mm
Shear Design
maxvdb
Vvw
≤= = 1.2235 MPa
vmax = min(0.8 cuf , 5 MPa) = 4.38178 MPa
The shear stress carried by the concrete, vc, is calculated as:
41
31
21 40010079.0
=
dbdAkkv s
mc γ
= 0.3568 MPa
k1 is the enhancement factor for support compression, and is conservatively taken as 1 .
k2 = 3
1
25
cuf = 1.06266, 1 ≤ k2 ≤
31
2540
γm = 1.25
bdAs100 = 0.15
EXAMPLE SINGAPORE CP 65-99 RC-BM-001 - 6

Software VerificationPROGRAM NAME: SAFE REVISION NO.: 0
41
400
d = 1
However, the following limitations also apply:
0.15 ≤ bd
As100 ≤ 3
41
400
d ≥ 1
fcu ≤ 40 MPa (for calculation purposes only) and As is the area of tension reinforcement.
Given v, vc, and vmax, the required shear reinforcement is calculated as follows:
If v ≤ (vc + 0.4),
yv
w
v
sv
fb
sA
87.04.0
=
If (vc + 0.4) < v ≤ vmax ,
( )yv
wc
v
sv
fbvv
sA
87.0−
=
If v > vmax, a failure condition is declared.
(COMB80) Pd = 20 kN Pl = 80 kN V = 156 kN
ν* = db
V
w
*
= 2.0 MPa (φsνc < ν* ≤ φsνmax)
( )yv
wc
v
sv
fbvv
sA
87.0−
= = 0.64967sq-mm/mm = 6.50 sq-cm/m
EXAMPLE SINGAPORE CP 65-99 RC-BM-001 - 7

Software Verification PROGRAM NAME: SAFE REVISION NO.: 0
EXAMPLE Singapore CP 65-99 RC-PN-001 Slab Punching Shear Design
PROBLEM DESCRIPTION The purpose of this example is to verify slab punching shear design in SAFE
The numerical example is a flat slab that has three 8-m spans in each direction, as shown in Figure 1.
4
A
3
2
1
B C D
X
Y
0.3 m0.3 m8 m8 m8 m
0.6 m
0.6 m
0.25 m thick flat slab
LoadingDL = Self weight + 1.0 kN/m2
LL = 4.0 kN/m2
Columns are 0.3 m x 0.9 mwith long side parallel to the Y-axis, typical
Concrete PropertiesUnit weight = 24 kN/m3
f'c = 30 N/mm2
8 m
8 m
8 m
4
A
3
2
1
B C D
X
Y
0.3 m0.3 m8 m8 m8 m
0.6 m
0.6 m
0.25 m thick flat slab
LoadingDL = Self weight + 1.0 kN/m2
LL = 4.0 kN/m2
Columns are 0.3 m x 0.9 mwith long side parallel to the Y-axis, typical
Concrete PropertiesUnit weight = 24 kN/m3
f'c = 30 N/mm2
8 m
8 m
8 m
Figure 1: Flat Slab for Numerical Example
The slab overhangs beyond the face of the column by 0.15 m along each side of the structure. The columns are typically 0.3 m x 0.9 m with the long side parallel to the Y-axis. The slab is typically 0.25 m thick. Thick plate properties are used for the slab.
The concrete has a unit weight of 24 kN/m3 and a fcu of 30 N/mm2. The dead load consists of the self weight of the structure plus an additional 1 kN/m2. The live load is 4 kN/m2.
EXAMPLE Singapore CP 65-99 RC-PN-001 - 1

Software Verification PROGRAM NAME: SAFE REVISION NO.: 0
TECHNICAL FEATURES OF SAFE TESTED Calculation of punching shear capacity, shear stress and D/C ratio.
RESULTS COMPARISON Table 1 shows the comparison of the punching shear capacity, shear stress ratio and D/C ratio obtained from SAFE with the punching shear capacity, shear stress ratio and D/C ratio obtained by the analytical method. They match exactly for this problem.
Table 1 Comparison of Design Results for Punching Shear at Grid B-2
Method Shear Stress
(N/mm2) Shear Capacity
(N/mm2) D/C ratio
SAFE 1.105 0.625 1.77
Calculated 1.105 0.620 1.77
COMPUTER FILE: SINGAPORE CP 65-99 RC-PN-001.FDB
CONCLUSION The SAFE results show an exact comparison with the independent results.
EXAMPLE Singapore CP 65-99 RC-PN-001 - 2

Software VerificationPROGRAM NAME: SAFE REVISION NO.: 0
HAND CALCULATION Hand Calculation For Interior Column Using SAFE Method
( ) ( )[ ]250 26 250 38 2d = − + − = 218 mm
Refer to Figure 1. u = 954+ 1554 + 954 + 1554 = 5016 mm
450
450X
Y
1554
954
Side 2
Side
3
A B
CD
Column
Side
1
Side 4
Center of column is point (x1, y1). Set this equal to (0,0).
Critical section for punching shear shown dashed.
150
327
327
Note: All dimensions in millimeters
150 327
X
Y
Side 2A B
CD
327
Note: All dimensions in millimeters
450
450X
Y
1554
954
Side 2
Side
3
A B
CD
Column
Side
1
Side 4
Center of column is point (x1, y1). Set this equal to (0,0).
Critical section for punching shear shown dashed.
150
327
327
Note: All dimensions in millimeters
150 327
X
Y
Side 2A B
CD
327
Note: All dimensions in millimeters
Figure 2: Interior Column, Grid B-2 in SAFE Model
From the SAFE output at Grid B-2: V= 1126.498 kN M2 = 51.9908 kN-m M3 = 45.7234 kN-m
EXAMPLE Singapore CP 65-99 RC-PN-001 - 3

Software Verification PROGRAM NAME: SAFE REVISION NO.: 0
Maximum design shear stress in computed in along major and minor axis of column:
,
1.5eff x
MV xv fud Vy
= +
(CP 3.7.7.3)
3 6
, 31126.498 10 1.5 51.9908 101.0 1.1049
5016 218 1126.498 10 954eff xv • • •
= + = • • • (Govern)
,
1.5eff y
MV yv fud Vx
= +
3 6
, 31126.498 10 1.5 45.7234 101.0 1.0705
5016 218 1126.498 10 1554eff yv • • •
= + = • • •
The largest absolute value of v = 1.1049 N/mm2
The shear stress carried by the concrete, vc, is calculated as:
41
31
21 40010079.0
=
dbdAkkv s
mc γ
= 0.3568 MPa
k1 is the enhancement factor for support compression, and is conservatively taken as 1 .
k2 = 3
1
25
cuf =
1330
25
= 1.0627 > 1.0 OK
γm = 1.25
41
400
d = 1.16386 > 1 OK.
fcu ≤ 40 MPa (for calculation purposes only) and As is the area of tension reinforcement. Area of reinforcement at the face of column for design strip are as follows: As in Strip Layer A = 9494.296 mm2
As in Strip Layer B = 8314.486 mm2 Average As = (9494.296+8314.486)/2 = 8904.391 mm2
EXAMPLE Singapore CP 65-99 RC-PN-001 - 4

Software Verification PROGRAM NAME: SAFE REVISION NO.: 0
bdAs100 = 100• 8904.391/(8000• 218) = 0.51057
( )1/30.79 1.0 1.0627 0.51057 1.163861.25cv • •
= • • = 0.6247 MPa
BS 3.7.7.3 yields the value of v = 0.625 N/mm2, and thus this is the shear capacity.
1.1049Shear Ratio 1.770.6247
Uvv
= = =
EXAMPLE Singapore CP 65-99 RC-PN-001 - 5

Software VerificationPROGRAM NAME: SAFE REVISION NO.: 0
EXAMPLE Singapore CP 65-99 RC-SL-001 Slab Flexural Design
PROBLEM DESCRIPTION The purpose of this example is to verify slab flexural design in SAFE.
A one-way, simple-span slab supported by walls on two opposite edges is modeled using SAFE. The slab is 150 mm thick and spans 4 meters between walls. The walls are modeled as pin supports. The computational model uses a finite element mesh, automatically generated by SAFE. The maximum element size is specified as 0.25 meters. To obtain factored moments and flexural reinforcement in a design strip, one one-meter wide strip is defined in the X-direction on the slab, as shown in Figure 1.
Figure 1 Plan View of One-Way Slab
One dead load case (DL4KPa) and one live load case (LL5KPa) with uniformly distributed surface loads of magnitudes 4 and 5 KN/m2, respectively, are defined in the model. A load combination (COMB5kPa) is defined using the Singapore CP 65-99 load combination factors, 1.4 for dead loads and 1.6 for live loads. The model is analyzed for both load cases and the load combination.
The slab moment on a strip of unit width is computed analytically. The total factored strip moments are compared with the SAFE results. After completing the analysis, design is performed using the Singapore CP 65-99 code by SAFE and also by hand computation. Table 1 shows the comparison of the design reinforcements computed by the two methods.
EXAMPLE Singapore CP 65-99 RC-SL-001 - 1

Software Verification PROGRAM NAME: SAFE REVISION NO.: 0 GEOMETRY, PROPERTIES AND LOADING
Thickness T, h = 150 mm Depth of tensile reinf. dc = 25 mm Effective depth d = 125 mm Clear span ln, l1 = 4000 mm Concrete strength fc = 30 MPa Yield strength of steel fsy = 460 MPa Concrete unit weight wc = 0 N/m3 Modulus of elasticity Ec = 25000 MPa Modulus of elasticity Es = 2×10⁶ MPa Poisson’s ratio ν = 0 Dead load wd = 4.0 kPa Live load wl = 5.0 kPa
TECHNICAL FEATURES OF SAFE TESTED Calculation of flexural reinforcement Application of minimum flexural reinforcement
RESULTS COMPARISON Table 1 shows the comparison of the SAFE total factored moments in the design strip with the moments obtained by the hand computation method. Table 1 also shows the comparison of the design reinforcements.
Table 1 Comparison of Design Moments and Reinforcements
Load Level Method
Strip Moment (kN-m)
Reinforcement Area (sq-cm)
As+
Medium SAFE 27.197 5.853
Calculated 27.200 5.850
,minA s+ = 162.5 sq-mm
EXAMPLE Singapore CP 65-99 RC-SL-001 - 2

Software Verification PROGRAM NAME: SAFE REVISION NO.: 0 COMPUTER FILE: Singapore CP 65-99 RC-001.FDB
CONCLUSION The SAFE results show an acceptable comparison with the independent results.
EXAMPLE Singapore CP 65-99 RC-SL-001 - 3

Software Verification PROGRAM NAME: SAFEREVISION NO.: 0
HAND CALCULATION The following quantities are computed for all the load combinations:
γm, steel = 1.15
γm, concrete = 1.50 b = 1000 mm
For each load combination, the w and M are calculated as follows: w = (1.4wd + 1.6wt) b
21
8wlM =
0 0013s ,min wA . b d=
= 162.5 sq-mm
COMB100 wd = 4.0 kPa wt = 5.0 kPa w = 13.6 kN/m M-strip = 27.2 kN-mM-design = 27.2366 kN-m
The depth of the compression block is given by:
2bdfMK
cu
= = 0.05810 < 0.156
The area of tensile steel reinforcement is then given by:
dKdz 95.09.0
25.05.0 ≤
−+= =116.3283
zfMA
ys 87.0= = 585.046 sq-mm > As,min
As = 5.850 sq-cm
EXAMPLE Singapore CP 65-99 RC-SL-001 - 4

Software VerificationPROGRAM NAME: SAFE REVISION NO.: 0
EXAMPLE Turkish TS 500-2000 PT-SL-001 Post-Tensioned Slab Design
PROBLEM DESCRIPTION The purpose of this example is to verify the slab stresses and the required area of mild steel strength reinforcing for a post-tensioned slab.
A one-way, simply supported slab is modeled in SAFE. The modeled slab is 254 mm thick by 914 mm wide and spans 9754 mm, as shown in shown in Figure 1.
Length, L = 9754 mm
Elevation Section
Prestressing tendon, Ap
Mild Steel, As
914 mm25 mm
229 mm
254 mm
Length, L = 9754 mm
Elevation Section
Prestressing tendon, Ap
Mild Steel, As
914 mm25 mm
229 mm
254 mm
Figure 1 One-Way Slab
EXAMPLE Turkish TS 500-2000 PT-SL-001 - 1

Software Verification PROGRAM NAME: SAFE REVISION NO.: 0
A 254-mm-wide design strip is centered along the length of the slab and has been defined as an A-Strip. B-strips have been placed at each end of the span, perpendicular to Strip-A (the B-Strips are necessary to define the tendon profile). A tendon with two strands, each having an area of 99 mm2, has been added to the A-Strip. The self weight and live loads have been added to the slab. The loads and post-tensioning forces are as follows.
Loads: Dead = self weight, Live = 4.788 kN/m2
The total factored strip moments, required area of mild steel reinforcement, and slab stresses are reported at the mid-span of the slab. Independent hand calculations are compared with the SAFE results and summarized for verification and validation of the SAFE results.
GEOMETRY, PROPERTIES AND LOADING Thickness T, h = 254 mm Effective depth d = 229 mm Clear span L = 9754 mm Concrete strength f ck = 30 MPa Yield strength of steel fyk = 400 MPa Prestressing, ultimate fpu = 1862 MPa Prestressing, effective fe = 1210 MPa Area of Prestress (single strand) Ap = 198 mm2 Concrete unit weight wc = 23.56 kN/m3 Modulus of elasticity Ec = 25000 N/mm3 Modulus of elasticity Es = 200,000 N/mm3 Poisson’s ratio ν = 0 Dead load wd = self kN/m2 Live load wl = 4.788 kN/m2
TECHNICAL FEATURES OF SAFE TESTED Calculation of the required flexural reinforcement Check of slab stresses due to the application of dead, live, and post-tensioning
loads
RESULTS COMPARISON Table 1 shows the comparison of the SAFE total factored moments, required mild steel reinforcing, and slab stresses with the independent hand calculations.
EXAMPLE Turkish TS 500-2000 PT-SL-001 - 2

Software Verification PROGRAM NAME: SAFE REVISION NO.: 0
Table 1 Comparison of Results
FEATURE TESTED INDEPENDENT RESULTS
SAFE RESULTS DIFFERENCE
Factored moment, Mu (Ultimate) (kN-m)
174.4 174.4 0.00%
Area of Mild Steel req’d, As (sq-cm) 14.88 14.90 0.13%
Transfer Conc. Stress, top (D+PTI), MPa −5.058 −5.057 0.02%
Transfer Conc. Stress, bot (D+PTI), MPa 2.839 2.839 0.00%
Normal Conc. Stress, top (D+L+PTF), MPa −10.460 −10.465 0. 50%
Normal Conc. Stress, bot (D+L+PTF), MPa 8.402 8.407 0.06%
COMPUTER FILE: TURKISH TS 500-2000 PT-SL-001.FDB
CONCLUSION The SAFE results show an acceptable comparison with the independent results.
EXAMPLE Turkish TS 500-2000 PT-SL-001 - 3

Software Verification PROGRAM NAME: SAFEREVISION NO.: 0
HAND CALCULATIONS:
Design Parameters:
Mild Steel Reinforcing Post-Tensioning fck = 30MPa fpu = 1862 MPa fyk = 400MPa fpy = 1675 MPa
Stressing Loss = 186 MPa Long-Term Loss = 94 MPa
fi = 1490 MPa fe = 1210 MPa
γm, steel = 1.15
γm, concrete = 1.50
Length, L = 9754 mm
Elevation Section
Prestressing tendon, Ap
Mild Steel, As
914 mm25 mm
229 mm
254 mm
Length, L = 9754 mm
Elevation Section
Prestressing tendon, Ap
Mild Steel, As
914 mm25 mm
229 mm
254 mm
Loads: Dead, self-wt = 0.254 m × 23.56 kN/m3 = 5.984 kN/m2 (D) × 1.4 = 8.378 kN/m2 (Du) Live, = 4.788 kN/m2 (L) × 1.6 = 7.661 kN/m2 (Lu)
Total = 10.772 kN/m2 (D+L) = 16.039 kN/m2 (D+L)ult
ω =10.772 kN/m2 × 0.914 m = 9.846 kN/m, ωu = 16.039 kN/m2 × 0.914 m = 14.659 kN/m
Ultimate Moment, 2
1
8=U
wlM = 14.659 × (9.754)2/8 = 174.4 kN-m
EXAMPLE Turkish TS 500-2000 PT-SL-001 - 4

Software Verification PROGRAM NAME: SAFE REVISION NO.: 0
Ultimate Stress in strand, 7000 1 1.36
= + −
PU PPd pe
CK
f Af f d lf bd
( )( )1862(198)1210 7000(229) 1 1.36 9754
30(914) 229
1361 MPa
= + −
=
Ultimate force in PT, ( )( ), ( ) 2 99 1361 1000 269.5 kNult PT P PSF A f= = =
Stress block depth, = − −2 d
cd
2Ma d d0.85 f b
( )
( )( )( )2 2 174.40.229 0.229 1 3 55.816 mm
0.85 20000 0.914= − − =e
Ultimate moment due to PT,
, ,55.816269.5 229 1000 54.194 kN-m
2 2 = − = − = ult PT ult PT
aM F d
Net ultimate moment, , 174.4 54.194 120.206 kN-m= − = − =net U ult PTM M M Required area of mild steel reinforcing,
( )
62120.206 10 1488.4 mm
54.194400 2292 2
•= = =
− −
netS
yd
MAaf d
K factor used to determine the effective depth is given as:
2bdfMK
cu
= = 2
174.4 0.181930000 1.5(0.914)(0.229)
= < 0.156
dKdz 95.09.0
25.05.0 ≤
−+= = 192.2 mm
Ultimate force in PT, ( )( ), ( ) 2 99 1303 1000 258.0 kNult PT P PSF A f= = =
Ultimate moment due to PT, ( ), , ( ) / 258.0 0.192 1.15 43.12 kN-mult PT ult PTM F z γ= = = Net Moment to be resisted by As,
EXAMPLE Turkish TS 500-2000 PT-SL-001 - 5

Software Verification PROGRAM NAME: SAFE REVISION NO.: 0 NET U PTM M M= −
174.4 43.12 131.28 kN-m= − =
The area of tensile steel reinforcement is then given by:
= NETs
yd X
MAf z
= ( )( )
( ) = 2131.28 1 6 1965 mm0.87 400 192
e
Check of Concrete Stresses at Midspan: Initial Condition (Transfer), load combination (D+PTi) = 1.0D+0.0L+1.0PTI
Tendon stress at transfer = jacking stress − stressing losses = 1490 − 186 = 1304 MPa The force in the tendon at transfer, = ( )1304 197.4 1000 257.4 kN=
Moment due to dead load, ( )( )25.984 0.914 9.754 8 65.04 kN-mDM = = Moment due to PT, ( )(sag) 257.4 102 mm 1000 26.25 kN-mPT PTIM F= = =
Stress in concrete, ( )
257.4 65.04 26.230.254 0.914 0.00983
PTI D PTF M MfA S
− − −= ± = ±
where S = 0.00983m3
1.109 3.948 MPaf = − ± 5.058(Comp) max, 2.839(Tension) max= −f Normal Condition, load combinations: (D+L+PTF) = 1.0D+1.0L+1.0PTF Tendon stress at normal = jacking − stressing − long-term = 1490 − 186 − 94 = 1210 MPa The force in tendon at normal, = ( )1210 197.4 1000 238.9 kN=
Moment due to dead load, ( )( )25.984 0.914 9.754 8 65.04 kN-mDM = =
Moment due to live load, ( )( )24.788 0.914 9.754 8 52.04 kN-mLM = = Moment due to PT, ( )(sag) 238.9 102 mm 1000 24.37 kN-mPT PTIM F= = = Stress in concrete for (D+L+PTF),
( )
238.8 117.08 24.370.254 0.914 0.00983
PTI D L PTF M MfA S
+ − − −= ± = ±
1 029 9 431f . .= − ± 10.460(Comp) max, 8.402(Tension) max= −f
EXAMPLE Turkish TS 500-2000 PT-SL-001 - 6

Software VerificationPROGRAM NAME: SAFE REVISION NO.: 0
EXAMPLE Turkish TS 500-2000 RC-BM-001 Flexural and Shear Beam Design
PROBLEM DESCRIPTION The purpose of this example is to verify slab flexural design in SAFE. The load level is adjusted for the case corresponding to the following conditions:
The stress-block extends below the flange but remains within the balancedcondition permitted by TS 500-2000.
The average shear stress in the beam is below the maximum shear stressallowed by TS 500-2000, requiring design shear reinforcement.
A simple-span, 6-m-long, 300-mm-wide, and 500-mm-deep T-beam with a flange 100 mm thick and 600 mm wide is modeled using SAFE. The beam is shown in Figure 1. The computational model uses a finite element mesh of frame elements, automatically generated by SAFE. The maximum element size has been specified to be 200 mm. The beam is supported by columns without rotational stiffnesses and with very large vertical stiffness (1×10²⁰ kN/m).
The beam is loaded with symmetric third-point loading. One dead load case (DL20) and one live load case (LL80) with only symmetric third-point loads of magnitudes 20, and 80 kN, respectively, are defined in the model. One load combinations (COMB80) is defined with the Turkish TS 500-2000 load combination factors of 1.4 for dead loads and 1.6 for live loads. The model is analyzed for both of these load cases and the load combinations.
The beam moment and shear force are computed analytically. The total factored moment and shear force are compared with the SAFE results. These moment and shear force are identical. After completing the analysis, design is performed using the Turkish TS 500-2000 code in SAFE and also by hand computation. Table 1 shows the comparison of the design longitudinal reinforcements. Table 2 shows the comparison of the design shear reinforcements.
EXAMPLE Turkish TS 500-2000 RC-BM-001 - 1

Software Verification PROGRAM NAME: SAFEREVISION NO.: 0
Beam Section
75 mm 100 mm
300 mm
600 mm
75 mm
500 mm
Shear Force
Bending Moment
2000 mm 2000 mm 2000 mm
Beam Section
75 mm 100 mm
300 mm
600 mm
75 mm
500 mm
Shear Force
Bending Moment
2000 mm 2000 mm 2000 mm
Figure 1 The Model Beam for Flexural and Shear Design
EXAMPLE Turkish TS 500-2000 RC-BM-001 - 2

Software VerificationPROGRAM NAME: SAFE REVISION NO.: 0
GEOMETRY, PROPERTIES AND LOADING Clear span, l = 6000 mm Overall depth, h = 500 mm Flange Thickness, ds = 100 mm Width of web, bw = 300 mm Width of flange, bf = 600 mm Depth of tensile reinf., dc = 75 mm Effective depth, d = 425 mm Depth of comp. reinf., d' = 75 mm
Concrete strength, f'ck = 30 MPa
Yield strength of steel, fyk = 460 MPa Concrete unit weight, wc = 0 kN/m3 Modulus of elasticity, Ec = 25×105 MPa Modulus of elasticity, Es = 2×10⁸ MPa Poisson’s ratio, v = 0.2
Dead load, Pd = 20 kN Live load, Pl = 80 kN
TECHNICAL FEATURES OF SAFE TESTED Calculation of flexural and shear reinforcement Application of minimum flexural and shear reinforcement
RESULTS COMPARISON Table 1 shows the comparison of the SAFE total factored moments in the design strip with the moments obtained by the analytical method. They match exactly for this problem. Table 1 also shows the comparison of design reinforcements.
Table 1 Comparison of Moments and Flexural Reinforcements
Method Moment (kN-m)
Reinforcement Area (sq-cm)
As+
SAFE 312 20.244
Calculated 312 20.244
,mins+A = 325.9 sq-mm
EXAMPLE Turkish TS 500-2000 RC-BM-001 - 3

Software Verification PROGRAM NAME: SAFEREVISION NO.: 0
Table 2 Comparison of Shear Reinforcements
Shear Force (kN)
Reinforcement Area, s
Av
(sq-cm/m)
SAFE Calculated
156 4.19 4.19
COMPUTER FILE: TURKISH TS 500-2000 RC-002.FDB
CONCLUSION The SAFE results show an exact comparison with the independent results.
EXAMPLE Turkish TS 500-2000 RC-BM-001 - 4

Software Verification PROGRAM NAME: SAFE REVISION NO.: 0
HAND CALCULATION
Flexural Design The following quantities are computed for all the load combinations:
γm, steel = 1.15
γm, concrete = 1.50
30 201.5
ckcd
mc
ff = = =γ
460 4001.15
= = =γ
ykyd
ms
ff
cu sb
cu s yd
Ec dE fε
ε=
+ = 255 mm
amax = 10.85 bk c = 177.7 mm
where, ( )1 0.85 0.006 25 0.82ckk f= − − = , 10.70 0.85k≤ ≤
2min
0 8 325 9= =ctds ,
yd
. fA bd . mmf
Where 0.35 0.35 30 1.278
1.5cu
ctdmc
ff = = =
γ
COMB80 Pd = (1.4PG + 1.6PQ) = 156 kN
3= d
dN lM = 312 kN-m
The depth of the compression block is given by:
2 20.85
d
cd
Ma d d
f b= − − = 79.386 mm < 100 mm
since a < amax,
EXAMPLE Turkish TS 500-2000 RC-BM-001 - 5

Software Verification PROGRAM NAME: SAFE REVISION NO.: 0
2 20.85
= − − d
cd
Ma d df b
(TS 7.1)
62 2 312 10425 425 79.387 mm
0.85 20 600• •
= − − =• •
a
If a ≤ amax (TS 7.1), the area of tensile steel reinforcement is then given by:
62312 10 2024.36 mm
79.387400 4252 2
•= = =
− −
ds
yd
MAaf d
, and
Shear Design Pd = 20 kN Pl = 80 kN V = 156 kN The shear force is limited to a maximum of,
max 0.22 cd wV f A= = 561 kN
The nominal shear strength provided by concrete is computed as:
0.65 1 γ
= +
dcr ctd w
g
NV f b dA
= 105.9 kN, where 0dN =
0.8c crV V= = 84.73 kN
The shear reinforcement is computed as follows:
If d crV V≤
2
min
0.3 0.2876 = =
sw ctd
ywd
A f mmbs f mm
(TS 8.1.5, Eqn 8.6)
If maxcr dV V V≤ ≤
EXAMPLE Turkish TS 500-2000 RC-BM-001 - 6

Software VerificationPROGRAM NAME: SAFE REVISION NO.: 0
( ) 2
0.419−
= =d csw
ywd
V VA mms f d mm
(TS 8.1.4, Eqn 8.5)
EXAMPLE Turkish TS 500-2000 RC-BM-001 - 7

Software VerificationPROGRAM NAME: SAFE REVISION NO.: 0
EXAMPLE Turkish TS 500-2000 RC-PN-001 Slab Punching Shear Design
PROBLEM DESCRIPTION The purpose of this example is to verify slab punching shear design in SAFE
The numerical example is a flat slab that has three 8-m spans in each direction, as shown in Figure 1.
4
A
3
2
1
B C D
X
Y
0.3 m0.3 m8 m8 m8 m
0.6 m
0.6 m
0.25 m thick flat slab
LoadingDL = Self weight + 1.0 kN/m2
LL = 4.0 kN/m2
Columns are 0.3 m x 0.9 mwith long side parallel to the Y-axis, typical
Concrete PropertiesUnit weight = 24 kN/m3
f'c = 30 N/mm2
8 m
8 m
8 m
4
A
3
2
1
B C D
X
Y
0.3 m0.3 m8 m8 m8 m
0.6 m
0.6 m
0.25 m thick flat slab
LoadingDL = Self weight + 1.0 kN/m2
LL = 4.0 kN/m2
Columns are 0.3 m x 0.9 mwith long side parallel to the Y-axis, typical
Concrete PropertiesUnit weight = 24 kN/m3
f'c = 30 N/mm2
8 m
8 m
8 m
Figure 1: Flat Slab for Numerical Example
The slab overhangs beyond the face of the column by 0.15 m along each side of the structure. The columns are typically 0.3 m x 0.9 m with the long side parallel to the Y-axis. The slab is typically 0.25 m thick. Thick plate properties are used for the slab.
The concrete has a unit weight of 24 kN/m3 and a fck of 30 N/mm2. The dead load consists of the self weight of the structure plus an additional 1 kN/m2. The live load is 4 kN/m2.
EXAMPLE Turkish TS 500-2000 RC-PN-001 - 1

Software Verification PROGRAM NAME: SAFEREVISION NO.: 0
TECHNICAL FEATURES OF SAFE TESTED Calculation of punching shear capacity, shear stress and D/C ratio.
RESULTS COMPARISON Table 1 shows the comparison of the punching shear capacity, shear stress ratio and D/C ratio obtained from SAFE with the punching shear capacity, shear stress ratio and D/C ratio obtained by the analytical method. They match exactly for this problem.
Table 1 Comparison of Design Results for Punching Shear at Grid B-2
Method Shear Stress
(N/mm2) Shear Capacity
(N/mm2) D/C ratio
SAFE 1.690 1.278 1.32
Calculated 1.690 1.278 1.32
COMPUTER FILE: TURKISH TS 500-2000 RC-PN-001.FDB
CONCLUSION The SAFE results show an exact comparison with the independent results.
EXAMPLE Turkish TS 500-2000 RC-PN-001 - 2

Software VerificationPROGRAM NAME: SAFE REVISION NO.: 0
HAND CALCULATION Hand Calculation For Interior Column Using SAFE Method
( ) ( )[ ]250 26 250 38 2d = − + − = 218 mm
b0 = 518+ 1118 + 1118 + 518 = 3272 mm
450
450
X
Y
1118
518
Side 2
Side
3
A B
CD
Column
Side
1
Side 4
Center of column is point (x1, y1). Set this equal to (0,0).
Critical section for punching shear shown dashed.
150
109
109
Note: All dimensions in millimeters
150 109
X
Y
Side 2A B
CD
109
Note: All dimensions in millimeters
450
450
X
Y
1118
518
Side 2
Side
3
A B
CD
Column
Side
1
Side 4
Center of column is point (x1, y1). Set this equal to (0,0).
Critical section for punching shear shown dashed.
150
109
109
Note: All dimensions in millimeters
150 109
X
Y
Side 2A B
CD
109
Note: All dimensions in millimeters
Figure 2: Interior Column, Grid B-2 in SAFE Model
211 0.59511181518
η = − =+
311 0.4055181
1118
η = − =+
The coordinates of the center of the column (x1, y1) are taken as (0, 0).
The following table is used for calculating the centroid of the critical section for punching shear. Side 1, Side 2, Side 3, and Side 4 refer to the sides of the critical section for punching shear as identified in Figure 2.
EXAMPLE Turkish TS 500-2000 RC-PN-001 - 3
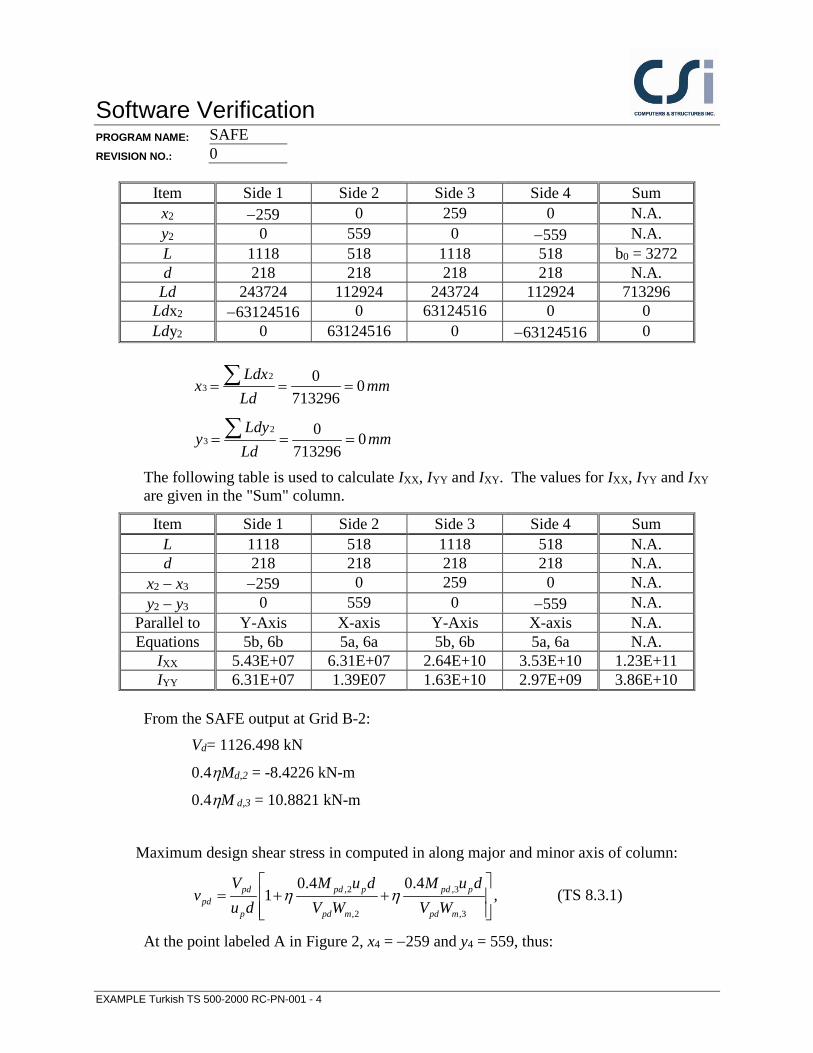
Software Verification PROGRAM NAME: SAFE REVISION NO.: 0
Item Side 1 Side 2 Side 3 Side 4 Sum x2 −259 0 259 0 N.A. y2 0 559 0 −559 N.A. L 1118 518 1118 518 b0 = 3272 d 218 218 218 218 N.A.
Ld 243724 112924 243724 112924 713296 Ldx2 −63124516 0 63124516 0 0 Ldy2 0 63124516 0 −63124516 0
2
30 0
713296Ldx
x mmLd
= = =∑
23
0 0713296
Ldyy mm
Ld= = =∑
The following table is used to calculate IXX, IYY and IXY. The values for IXX, IYY and IXY are given in the "Sum" column.
Item Side 1 Side 2 Side 3 Side 4 Sum L 1118 518 1118 518 N.A. d 218 218 218 218 N.A.
x2 − x3 −259 0 259 0 N.A. y2 − y3 0 559 0 −559 N.A.
Parallel to Y-Axis X-axis Y-Axis X-axis N.A. Equations 5b, 6b 5a, 6a 5b, 6b 5a, 6a N.A.
IXX 5.43E+07 6.31E+07 2.64E+10 3.53E+10 1.23E+11 IYY 6.31E+07 1.39E07 1.63E+10 2.97E+09 3.86E+10
From the SAFE output at Grid B-2:
Vd= 1126.498 kN
0.4ηMd,2 = -8.4226 kN-m
0.4ηM d,3 = 10.8821 kN-m Maximum design shear stress in computed in along major and minor axis of column:
,2 ,3
,2 ,3
0.4 0.41 ,pd pd p pd p
pdp pd m pd m
V M u d M u dv
u d V W V Wη η
= + +
(TS 8.3.1)
At the point labeled A in Figure 2, x4 = −259 and y4 = 559, thus:
EXAMPLE Turkish TS 500-2000 RC-PN-001 - 4

Software VerificationPROGRAM NAME: SAFE REVISION NO.: 0
( )( )( )
( )( )( )
6 103
11 10
6 11
11 10
8.423 10 3.86 10 559 01126.498 103272 218 1.23 10 3.86 10
10.882 10 1.23 10 259 01.23 10 3.86 10
• • −• = − +• • •
• • − − • •
Uv
vU = 1.5793 − 0.0383 − 0.0730 = 1.4680 N/mm2 at point A
At the point labeled B in Figure 2, x4 = 259 and y4 = 559, thus:
( )( )( )
( )( )( )
6 103
11 10
6 11
11 10
8.423 10 3.86 10 559 01126.498 103272 218 1.23 10 3.86 10
10.8821 10 1.23 10 259 01.23 10 3.86 10
• • −• = − +• • •
• • − • •
Uv
vU = 1.5793 − 0.0383 + 0.0730 =1.614 N/mm2 at point B
At the point labeled C in Figure 2, x4 = 259 and y4 = −559, thus:
( )( )( )
( )( )( )
6 103
11 10
6 11
11 10
8.423 10 3.86 10 559 01126.498 103272 218 1.23 10 3.86 10
10.882 10 1.23 10 259 01.23 10 3.86 10
• • − −• = − +• • •
• • − • •
Uv
vU = 1.5793 + 0.0383 + 0.0730 = 1.690 N/mm2 at point C
At the point labeled D in Figure 2, x4 = −259 and y4 = −559, thus:
( )( )( )
( )( )( )
6 103
11 10
6 11
11 10
8.423 10 3.86 10 559 01126.498 103272 218 1.23 10 3.86 10
10.8821 10 1.23 10 259 01.23 10 3.86 10
• • − −• = − +• • •
• • − − • •
Uv
vU = 1.5793 + 0.383 − 0.0730 = 1.5446 N/mm2 at point D
Point C has the largest absolute value of vu, thus vmax = 1.690 N/mm2
EXAMPLE Turkish TS 500-2000 RC-PN-001 - 5

Software Verification PROGRAM NAME: SAFE REVISION NO.: 0
The concrete punching shear stress capacity of a section with punching shear reinforcement is limited to:
0.35pr ctd ck cv f f γ= = (TS 8.3.1)
0.35 30 1.5 1.278= = =pr ctdv f N/mm2
1.690Shear Ratio 1.321.278
= = =pd
pr
vv
EXAMPLE Turkish TS 500-2000 RC-PN-001 - 6

Software Verification PROGRAM NAME: SAFE REVISION NO.: 0
EXAMPLE Turkish TS 500-2000 RC-SL-001 Slab Flexural Design
PROBLEM DESCRIPTION The purpose of this example is to verify slab flexural design in SAFE.
A one-way, simple-span slab supported by walls on two opposite edges is modeled using SAFE. The slab is 150 mm thick and spans 4 meters between walls. The walls are modeled as pin supports. The computational model uses a finite element mesh, automatically generated by SAFE. The maximum element size is specified as 0.25 meters. To obtain factored moments and flexural reinforcement in a design strip, one one-meter wide strip is defined in the X-direction on the slab, as shown in Figure 1.
Figure 1 Plan View of One-Way Slab
One dead load case (DL4KPa) and one live load case (LL5KPa) with uniformly distributed surface loads of magnitudes 4 and 5 KN/m2, respectively, are defined in the model. A load combination (COMB5kPa) is defined using the Turkish TS 500-2000 load combination factors, 1.4 for dead loads and 1.6 for live loads. The model is analyzed for both load cases and the load combination.
The slab moment on a strip of unit width is computed analytically. The total factored strip moments are compared with the SAFE results. After completing the analysis, design is performed using the Turkish TS 500-2000 code by SAFE and also by hand computation. Table 1 shows the comparison of the design reinforcements computed by the two methods.
EXAMPLE Turkish TS 500-2000 RC-SL-001 - 1

Software Verification PROGRAM NAME: SAFEREVISION NO.: 0
GEOMETRY, PROPERTIES AND LOADING Thickness T, h = 150 mm Depth of tensile reinf. dc = 25 mm Effective depth d = 125 mm Clear span ln, l1 = 4000 mm
Concrete strength fck = 30 MPa Yield strength of steel fyk = 460 MPa Concrete unit weight wc = 0 N/m3 Modulus of elasticity Ec = 25000 MPa Modulus of elasticity Es = 2×10⁶ MPa Poisson’s ratio ν = 0
Dead load wd = 4.0 kPa Live load wl = 5.0 kPa
TECHNICAL FEATURES OF SAFE TESTED Calculation of flexural reinforcement Application of minimum flexural reinforcement
RESULTS COMPARISON Table 1 shows the comparison of the SAFE total factored moments in the design strip with the moments obtained by the hand computation method. Table 1 also shows the comparison of the design reinforcements.
Table 1 Comparison of Design Moments and Reinforcements
Load Level Method
Strip Moment (kN-m)
Reinforcement Area (sq-cm)
As+
Medium SAFE 27.197 5.760
Calculated 27.200 5.760
,minA s+ = 162.5 sq-mm
EXAMPLE Turkish TS 500-2000 RC-SL-001 - 2

Software Verification PROGRAM NAME: SAFE REVISION NO.: 0 COMPUTER FILE: Turkish TS 500-2000 RC-001.FDB
CONCLUSION The SAFE results show an acceptable comparison with the independent results.
EXAMPLE Turkish TS 500-2000 RC-SL-001 - 3

Software Verification PROGRAM NAME: SAFEREVISION NO.: 0
HAND CALCULATION The following quantities are computed for all the load combinations:
γm, steel = 1.15
γm, concrete = 1.50
30 201.5
ckcd
mc
ff = = =γ
460 4001.15
= = =γ
ykyd
ms
ff
cu sb
cu s yd
Ec dE fε
ε=
+ = 75 mm
amax = 10.85 bk c = 52.275 mm
where, ( )1 0.85 0.006 25 0.82ckk f= − − = , 10.70 0.85k≤ ≤
2min
0 8 325 9= =ctds ,
yd
. fA bd . mmf
Where 0.35 0.35 30 1.278
1.5cu
ctdmc
ff = = =
γ
For each load combination, the w and M are calculated as follows: w = (1.4wd + 1.6wt) b
21
8wlM =
COMB100 wd = 4.0 kPa wt = 5.0 kPa w = 13.6 kN/m M-strip = 27.2 kN-mM-design = 27.2366 kN-m
The depth of the compression block is given by:
EXAMPLE Turkish TS 500-2000 RC-SL-001 - 4

Software Verification PROGRAM NAME: SAFE REVISION NO.: 0
The depth of the compression block is given by:
2 20.85
d
cd
Ma d d
f b= − − (TS 7.1)
62 2 27.2366 10125 125 13.5518 mm
0.85 20 1000• •
= − − =• •
a
If a ≤ amax (TS 7.1), the area of tensile steel reinforcement is then given by:
6227.2366 10 576 mm
13.5518400 1252 2
•= = =
− −
ds
yd
MAaf d
EXAMPLE Turkish TS 500-2000 RC-SL-001 - 5

Software VerificationPROGRAM NAME: SAFE REVISION NO.: 0
CONCLUSIONS
The conclusions are presented separately for analysis, reinforced concrete beam and slab design, and post-tensioned slab design in the following subsections.
ANALYSIS
The SAFE verification and validation example problems for analysis show Acceptable comparison with the independent solutions. The accuracy of the SAFE results for certain examples depends on the discretization of the area objects. For those examples, as the discretization is refined, the solution becomes more accurate.
DESIGN
The design results for flexural and shear design for reinforced concrete beams; flexural design for reinforced concrete and post-tensioned slab and stress checks for post-tensioned slabs show exact comparison with hand calculations.
MESHING OF AREA ELEMENTS
It is important to adequately mesh area elements to obtain satisfactory results. The art of creating area element models includes determining what constitutes an adequate mesh. In general, meshes should always be two or more elements wide. Rectangular elements give the best results and the aspect ratio should not be excessive. A tighter mesh may be needed in areas where the stress is high or the stress is changing quickly. When reviewing results, the following process can help determine if the mesh is adequate. Pick a joint in a high stress area that has several different area elements connected to it. Review the stress reported for that joint for each of the area elements. If the stresses are similar, the mesh likely is adequate. Otherwise, additional meshing is required. If you choose to view the stresses graphically when using this process, be sure to turn off the stress averaging feature when displaying the stresses.
CONCLUSIONS - 1

Software VerificationPROGRAM NAME: SAFE REVISION NO.: 0
References ACI Committee 435, 1984. Deflection of Two-way Reinforced Concrete Floor Systems:
State-of-the-Art Report, (ACI 435-6R-74), (Reaffirmed 1984), American Concrete Institute, Detroit, Michigan.
ACI Committee 336, 1988. Suggested Analysis and Design Procedures for Combined Footings and Mats (ACI 336-2R-88), American Concrete Institute, Detroit, Michigan.
ACI Committee 340, 1991. Design Handbook In Accordance with the Strength Design Method of ACI 318-89, Volume 3, Two-way Slabs (ACI 340.4R-91), American Concrete Institute, Detroit, Michigan.
ACI Committee 340, 1997. ACI Design Handbook, Design of Structural Reinforced Concrete Elements in Accordance with the Strength Design Method of ACI 318-95 (ACI 340R-97), American Concrete Institute, Detroit, Michigan.
ACI Committee 318, 1995. Building Code Requirements for Reinforced Concrete (ACI 318-95) and Commentary (ACI 318R-95), American Concrete Institute, Detroit, Michigan.
Corley, W. G. and J. O. Jirsa, 1970. Equivalent Frame Analysis for Slab Design, ACI Journal, Vol. 67, No. 11, November.
Gamble, W. L., M. A. Sozen, and C. P. Siess, 1969. Tests of a Two-way Reinforced Concrete Floor Slab, Journal of the Structural Division, Proceedings of the ASCE, Vol. 95, ST6, June.
Guralnick, S. A. and R. W. LaFraugh, 1963. Laboratory Study of a 45-Foot Square Flat Plate Structure, ACI Journal, Vol. 60, No.9, September.
Hatcher, D. S., M. A. Sozen, and C. P. Siess, 1965. Test of a Reinforced Concrete Flat Plate, Journal of the Structural Division, Proceedings of the ASCE, Vol. 91, ST5, October.
Hatcher, D. S., M. A. Sozen, and C. P. Siess, 1969. Test of a Reinforced Concrete Flat Slab, Journal of the Structural Division, Proceedings of the ASCE, Vol. 95, ST6, June.
Jirsa, J. O., M. A. Sozen, and C. P. Siess, 1966. Test of a Flat Slab Reinforced with Welded Wire Fabric, Journal of the Structural Division, Proceedings of the ASCE, Vol. 92, ST3, June.
PCA, 1990. Notes on ACI 318-89 Building Code Requirements for Reinforced Concrete with Design Applications, Portland Cement Association, Skokie, Illinois.
References - 1

Software Verification PROGRAM NAME: SAFEREVISION NO.: 0
PCA, 1996. Notes on ACI 318-95 Building Code Requirements for Reinforced Concrete with Design Applications, Portland Cement Association, Skokie, Illinois.
Roark, Raymond J., and Warren C. Young, 1975. Formulas for Stress and Strain, Fifth Edition, Table 3, p. 107-108. McGraw-Hill, 2 Penn Plaza, New York, NY 10121-0101.
Timoshenko, S. and S. Woinowsky-Krieger, 1959, Theory of Plates and Shells, McGraw-Hill, 2 Penn Plaza, New York, NY 10121-0101.
Ugural, A. C. 1981, Stresses in Plates and Shells, McGraw-Hill, 2 Penn Plaza, New York, NY 10121-0101.
Vanderbilt, M. D., M. A. Sozen, and C. P. Siess, 1969. Tests of a Modified Reinforced Concrete Two-Way Slab, Journal of the Structural Division, Proceedings of the ASCE, Vol. 95, ST6, June.
References - 2