verhoeff-1992-mtf.pdf - TNOpublications.tno.nl/publication/34617078/yO7qkS/verhoeff-1992-mtf.pdf ·...
13
MTF MEASUREMENTS OF A FRAME TRANSFER CCD OPERATING IN TDI MODE Peter Verhoeff TPD (TNO Institute of Applied Physics) Deift, the Netherlands Ph. Gondoin European Space Research and Technology Centre (ESTEC) Noordwijk, the Netherlands ABSTRACT A simulation set-up, radiometrically representative of a high resolution Earth observation condition from a geosynchronous spinning spacecraft has been built. This simulation set-up is used to verify the performance of a commercially matrix CCD (THOMSON-CSF type TH7864) when operating in time delay and integration (ThI) mode. MTF measurements results of this TDI operating CCD are presented in this paper and are compared with M'TF values of the same CCD operating in a conventional staring mode. 1. INTRODUCTION In the frame of the Earth Observation Preparatory Programme of the European Space Agency (ESA), various assessment studies of candidate instruments for the next generation of meteorological satellites have been conducted. One of the proposed concepts for a high resolution visible imager (HRVIS) identified the ThI mode as potentially valuable operation mode for CCDs operating on board a spinning spacecraft. An important constraint for the selection of the detectors for the HRVIS instrument came from the high spinrate (100 RPM) of the spacecraft in combination with the high performance requirements in terms of spatial resolution and signal-to- noise ratio. Indeed the combination of high spinrate and high spatial resolution lead to an integration time per pixel in the order of 1.3 ps. In order to maintain at a reasonable imager aperture diameter and in order to meet the S/N requirements properly for earth landmark detection the effective integration time needs to be in the order of 0.4 ms. Indeed in a TDI mode, the charges which are generated in a CCD pixel are transferred in the column direction at exactly the same speed as the image speed. This results in a 'still image' with a larger effective integration time equal to the number of TDI stages i.e. the number of pixel-to-pixel transfers and integrations. In the HRVIS instrument the TDI mode leads to a number of TDI stages of about 300 at a ThI clockspeed at approximately 750 kHz. This high number of TDI stages and the high clockspeed excluded the use of commercially available TDI detectors. On the other hand the use of a standard matrix CCD in a TDI mode is limited by the clockspeed of the horizontal register. We overcome this problem by the use of a frame-transfer CCD, providing the proper clockspeed in the column transfer direction, but in which the image can be stored and read-out later at a moderate speed (see figure 1). In the case of the HRVIS instrument during one spacecraft revolution the successive detector viewing conditions are the earth scene crossing, the dark sky crossing and eventually solar passage (see figure 2). Therefore the image lines as obtained in a TDI mode of the earth scene can be read-out much more slowly when the instrument is viewing dark space. A drawback of a frame transfer CCD comes from the fact that continuous read-out of the detector is not possible as in the case of commercially available TDI detectors. Therefore a large amount of charge can build up in the detector when crossing bright scenes where no detection is required as e.g. passage of earth scenes where no imaging is requested and possibly solar passage in the case of HRVIS. To avoid oversaturation an electronic shutter within the detector is required. O-8194-0810-7/921$4.OO SPIE Vol. 1656 High-Resolution Sensors and Hybrid Systems (1992) 1437 Downloaded From: http://proceedings.spiedigitallibrary.org/ on 07/02/2015 Terms of Use: http://spiedl.org/terms
Transcript of verhoeff-1992-mtf.pdf - TNOpublications.tno.nl/publication/34617078/yO7qkS/verhoeff-1992-mtf.pdf ·...

MTF MEASUREMENTS OF A FRAME TRANSFER CCD OPERATING IN TDI MODE
Peter VerhoeffTPD (TNO Institute of Applied Physics)
Deift, the Netherlands
Ph. GondoinEuropean Space Research and Technology Centre (ESTEC)
Noordwijk, the Netherlands
ABSTRACT
A simulation set-up, radiometrically representative of a high resolution Earth observation condition from ageosynchronous spinning spacecraft has been built. This simulation set-up is used to verify the performance of acommercially matrix CCD (THOMSON-CSF type TH7864) when operating in time delay and integration (ThI) mode. MTFmeasurements results of this TDI operating CCD are presented in this paper and are compared with M'TF values of the sameCCD operating in a conventional staring mode.
1. INTRODUCTION
In the frame of the Earth Observation Preparatory Programme of the European Space Agency (ESA), variousassessment studies of candidate instruments for the next generation of meteorological satellites have been conducted. One ofthe proposed concepts for a high resolution visible imager (HRVIS) identified the ThI mode as potentially valuable operationmode for CCDs operating on board a spinning spacecraft.
An important constraint for the selection of the detectors for the HRVIS instrument came from the high spinrate (100RPM) of the spacecraft in combination with the high performance requirements in terms of spatial resolution and signal-to-noise ratio. Indeed the combination of high spinrate and high spatial resolution lead to an integration time per pixel in theorder of 1.3 ps.
In order to maintain at a reasonable imager aperture diameter and in order to meet the S/N requirements properly forearth landmark detection the effective integration time needs to be in the order of 0.4 ms.
Indeed in a TDI mode, the charges which are generated in a CCD pixel are transferred in the column direction atexactly the same speed as the image speed. This results in a 'still image' with a larger effective integration time equal to thenumber of TDI stages i.e. the number of pixel-to-pixel transfers and integrations.
In the HRVIS instrument the TDI mode leads to a number of TDI stages of about 300 at a ThI clockspeed atapproximately 750 kHz. This high number of TDI stages and the high clockspeed excluded the use of commercially availableTDI detectors. On the other hand the use of a standard matrix CCD in a TDI mode is limited by the clockspeed of thehorizontal register. We overcome this problem by the use of a frame-transfer CCD, providing the proper clockspeed in thecolumn transfer direction, but in which the image can be stored and read-out later at a moderate speed (see figure 1). In thecase of the HRVIS instrument during one spacecraft revolution the successive detector viewing conditions are the earth scenecrossing, the dark sky crossing and eventually solar passage (see figure 2). Therefore the image lines as obtained in a TDImode of the earth scene can be read-out much more slowly when the instrument is viewing dark space.
A drawback of a frame transfer CCD comes from the fact that continuous read-out of the detector is not possible as inthe case of commercially available TDI detectors. Therefore a large amount of charge can build up in the detector whencrossing bright scenes where no detection is required as e.g. passage of earth scenes where no imaging is requested andpossibly solar passage in the case of HRVIS.
To avoid oversaturation an electronic shutter within the detector is required.
O-8194-0810-7/921$4.OO SPIE Vol. 1656 High-Resolution Sensors and Hybrid Systems (1992) 1437
Downloaded From: http://proceedings.spiedigitallibrary.org/ on 07/02/2015 Terms of Use: http://spiedl.org/terms

The combination of HRVIS performance requirements, frame transfer and electronic shutter capability leads to theselection of a THOMSON-CSF CCD type TH7864. This detector has 550 (H) x 576 (V) pixels, thus enabling 288 TDIintegration steps and storage of 288 integrated lines. This detector has a per pixel effective anti-blooming/exposure controlfacility, which can be used as electronic shutter.
In order to demonstrate the technical practicability and the performance feasibility of the TDI operation mode for aTHOMSON-CSF TH7864 frame transfer CCD we built a simulation set-up. This simulation set-up is optically andradiometrically representative of the earth observation condition from the HRVIS instrument onboard a geostationary spinningspacecraft. A related testprogramme has been defined which objective is as follows:- to assess the imaging capabilities of the CCD by the execution of MTF measurements in both staring- and TDI mode of
operation. They will be performed for several spatial frequencies up to the detector Nyquist freq. f. for both low (15000el./pixel) and high (100.000 el./pixel) signal levels representing earth- and cloud scene radiances. The measurements willbe performed in small spectral bands between 600 and 900 nm in order to assess charge diffusion effects as well as in awide spectral band (700 - 900 nm).
- to assess the detection capability of small (2-5%) contrast variation with high spatial frequencies at high illuminationlevels (100.000 eipixel) in small and wide spectral bands.
- to verify the operation and effectiveness of the exposure control facility as electronic shutter.- to simulate a solar passage and valithte the additional detector clearing clockcycles which are necessary since there is no
exposure control in the storage zone of the CCD and since the Al-mask covering this zone has a finite optical density.
The execution of this test program is in progress at the present time. The aim of this paper is to describe the simulationset-up, to present first MTF results obtained with the CCD operating in a TDI mode and to compare these results bymeasurement results with the CCD in a staring reference mode.
2. OPTO-MECHANICAL LAYOUT OF THE SIMULATION SET-UP
The simulation set-up consists mainly of a black and white test pattern with a sinusoidal transmission modulation which isimaged in a reduced way onto the imaging area of the frame transfer CCD. An image motion of the test pattern is generatedby a flat rotating mirror whose speed is controlled by a close loop electronics. The mirror rotation velocity is monitored byanangular encoder which also generates the TDI transport clock at the proper speed. An opto-mechanical layout of thesimulation set-up is given in figure 3. It consists of the following elements which are supported on a stable optical bench:
- a test pattern- a test pattern illumination source- a background illumination source- a shutter and a beam splitter- spectral filters- an image reduction objective- a "target" rotating mirror assembly- the CCD and its proximity electronics- a solar simulator and a collimating lens- a "sun" rotating mirror assembly
The test patterns are photographic filmsheets which are glued between two glassplates using optical epoxy. This way ofmounting provides a flat image area and enables target change without refocussing. The test targets are mounted on amanipulator with two adjustment capabilities:- a translation in the direction of the optical axis for fine adjustment of the target image reduction factor.- a rotation around the test target centre for alignment of the stripe pattern with the CCD rows or columns. In practice, a
small 0.5 degree misalignment is required by the MTF measurements method [1].
438 / SPIE Vol. 1656 High-Resolution Sensors and Hybrid Systems (1992)
Downloaded From: http://proceedings.spiedigitallibrary.org/ on 07/02/2015 Terms of Use: http://spiedl.org/terms

The test pattern and background illumination is provided by a Köhler type of illumination using 50 Watts halogen lamps.The illumination is proven to be uniform at detector level on the 2 to 30 pixel distance over which MTF computations areperformed.
The test target and the background illuminations can be combined by an optical beamsplitter for contrast measurements.A shutter is placed in front of the background illumination source and used for scene crossing simulations.
Spectral bandfilters of 40 nanometres bandwidth are available at centrewavelengths of 600, 700, 800, 900 nanometres.Short and long cut-off filters are used with cut-off wavelengths of 495, 695 and 900 nanometres respectively. Filtercombinations allow MTF measurements for a large variety of spectral bandwidths.
Image reduction of the test pattern is performed by a two mirrors telescope which provides a high on-axis MTF at allspatial frequencies of interest. Furthermore, the inherent achromatism of the system allows spectral band changing withoutrefocusing.
The target rotating mirror provides the motion of the image of the test pattern. This flat mirror is driven by a DC-motorand controlled with an accurate rotation encoder which also generates the TDI clock frequency. The stability of the mirrorrotation velocity is beuer than 0.2% over the TDI imaging period. The dimensioning of the set-up leads to a mirror rotationof 620 revolutions per minutes which simulates the imaging condition of a 1.6 meter focal length imager operating on ageostationary 100 RPM spinning spacecraft.
The solar passage simulation requires the passage of a 14 mm diameter intense lightspot over the detector. A trade-offfor possible lightsources lead to a solution in which the arc of a 400 Watts HTI lamp is focused on the detector via anellipsoid mirror and a re-imaging lens.
The dimensioning of the solar simulator and the test set-up did not allow imaging on the CCD via the same rotatingmirror. An additional "sun" rotating mirror has been implemented to image the simulated sun on the detector. This mirror isof course synchronized with the "target" rotating mirror.
3. DESCRIPTION OF THE SIMULATION SET-UP ELECTRONICS
The functional blockdiagram of the test set-up electronics is shown in figure 4. The figure shows the electronics asintended for the TDI related measurements. For staring mode measurements the same electronics is used, but the onlyfunction of the TDI synchronization electronics module then is the generation of a continuous masterclock for the universalclockpattem generator.
Physically close to the CCD is the proximity electronics, consisting of DC-bias supplies/filters, clockbuffer circuits andvideo-amplifier.
The clockpulses for the various detector read-out modes are generated using the universal clockpattern generator of the CCDtestfacility. Via basic software, running on a Hewlett Packard 9920 computer system, virtually every desired clocksequencecan be made. For the execution of the clockcycles only an external masterclock of the highest elementary frequency isrequired. For the general detector tests a fixed clockfrequency is used, generated by the TDI synchronization module. For theTDI measurements, during TDI imaging the angular encoder of rotating mirror '1 ' is used as a synchronization/lock of themasterciock while during the rest of the cycle the fixed clockfrequency is applied.Besides the clockpulses for all CCD clocks, the universal clockpattern generator also provides synchronized clocksignals fordata-acquisition and amplifier DC-restore.
The data-acquisition is performed via a Keithley DAS-50 12-bit AD interface, placed in a slot of a PC. For the commandingof the interface and for further storage and processing of the data, software routines written in 'TCL-IMAGE', TechnicalCommand Language For Image Processing (a TPD, TNO Institute of Applied Physics development) is used.Note that during actual data-acquisition the read-out clockspeed is reduced to a value acceptable to the analog amplifier andAD-interface combination. This is necessary from accuracy point of view. It means however that not the entire CCD area can
SPIE Vol. 1656 High-Resolution Sensors and Hybrid Systems (1992) / 439
Downloaded From: http://proceedings.spiedigitallibrary.org/ on 07/02/2015 Terms of Use: http://spiedl.org/terms
be processed in one CCD read-out cycle but only a limited area (e.g. 150 x 150 pixels).
The ThI synchronization electronics in principle masters a TDI image cycle. At a certain moment when the target imagesweeps over the CCD (fixed moment w.r.t. the angular encoder reference pulse) it starts the TDI clock, which runs for aselectable number of cycles. Then the image has arrived in the storage section of the detector and the clock is switched to theread-out clock and the storage section is read-out via the programmed read-out cycle. After read-out the clock is stoppeduntil the next TDI image action.
4. MTF CALIBRATION OF THE SIMULATION SET-UP
In order to determine the detector MTF, the contribution of the simulation set-up to the overall MTF has to becalibrated. This includes the MTF contribution from:
- the test pattern illumination- the transmission modulation of the test pattern- the image reduction objective- the target rotation mirror- the read-out electronics
In order to verify the source uniformity, the illumination profile at the location of the CCD has been scanned using aphotodiode with a 20 pm pinhole in front. The scanmotion was provided by a translation stage with a micrometer screw. Dueto the uniformity of the Köhler type illumination using a diffusor between the halogen lamp and the aspheric condenser, anintensity variation lower than 1% was found over the reduced field over which the MTF is performed. The degradation of thesimulation set-up MTF due to the test pattern illumination is therefore negligible.
All films out of which the test targets were cut have been measured in term of transmission modulation by extensivemicrodensitometer scanning, in term of spatial frequencies by microscope and in term of harmonic distortion by intensitymeasurements of the diffracted orders of an He-Ne Laser source. The measurements results are summarized in table 1 . Forall targets, a general modulation value of 85% +1- 2% was found.
A Foucault knife edge measurement of the image reduction objective has been performed with an He-Ne laser at threelocations within the field of view, i.e. on-axis, at +2.5 degree and - 3.2 degree in cross-scan direction. The resulting profilesof the line spread function were converted via curve fitting and Fourier transform to an MTF figure. These measured MTFfigures were compared with predicted MTF figure as obtained from the Super OSLO ray tracing programme. On axis and inthe spatial frequency range of interest, the predicted MTF values well-matched the measured ones. Therefore the MTFcalibration value of the image reduction objective have been calculated for the different wavelengths and spectral bands ofinterest from the Super OSLO programme. The MTF calibration data are summarized in table 2. These MTF values are thosecomputed for the sagittal direction which corresponds to the ThI direction. The uncertainty margin on these calibrationvalues is +/- 5%.
Target type Modulation Frequency Distortion
1 cycle/mm 85 2% 1.000 0.004 cycles/mm -2 cycles/mm 84 2% 2.000 0.006 cycles/mm 7.0%3 cycles/mm 85 3% 3.000 0.006 cycles/mm 6.9%4 cycles/mm 85 3% 4.001 0.007 cycles/mm 8.1%S cycles/mm 86 2% 5.000 0.010 cycles/mm 8.9%
Table 1 Results of testtarget verification/calibration.
440 I SPIE Vol. 1656 High-Resolution Sensors and Hybrid Systems (1992)
Downloaded From: http://proceedings.spiedigitallibrary.org/ on 07/02/2015 Terms of Use: http://spiedl.org/terms

Spatial frequency MTF per spectral band (40 nm wide)
Normalized linepairs/mm 600 nm 700 nm 800 nm 900 nm
0.20.40.60.81.0
4.358.70
13.0417.3921.74
97%95%92%.88%86%
97%94%91%88%85%
96%93%89%85%82%
96%92%88%85%80%
Table 2 MTF calibration data
Two verifications of the rotating mirror '1' were performed. The first verification was part of the integration process. Toavoid image distortions by mirror misalignments and wobble, the mirror and its support structure were matched to a peak-to-peak error as small as 5pm over the entire mirror surface, measured w.r.t. the mirror rotation axis (measurement byHeidenhain translation probe).
The second verification concerns the rotation speed stability. The entire mirror unit demonstrated an image speedvariation which was much less: < 0.06% (maximum speed deviation). To obtain this value a (balanced) mass had to bemounted on the encoder axis. This mass suppresses the effects of the motor poles adequately. Because of the abovementioned verification, the MTF degradation from the rotating mirror is assumed to be negligible.
The video amplifier and the AD interface are potential sources of MTF degradation. Because of the 500 kHz samplingwhich is amply below the limits of the AD interface and because of the optimized amplifier bandwidth the actual MTFdegradation is already initially low.MTF is in principle defined for sinusoidal modulations. Rectangular pulses provide better results than sinusoidal waves at thesame frequency. This effect is demonstrated by the comparison of the responses of the video amplifier and the AD interfacecard on sinusoidal waves and rectangular pulses.The results of these measurements indicated that the MTF degradation from the CCD read out electronics was negligible.
5. MTF MEASUREMENTS
The MTF measurements have been performed using the following CCD operating conditions:- Spatial frequency: 0.2, 0.4, 0.6, 0.8 and 1.0 x f. (f., = 21.7 linepairs/mm, Nyquist frequency)- No. of TDI stages: 288 (full image zone height)- No. of lines used for MTF computation: � 100- Illumination level: approx. 100.000 eipixel (25% of pixel saturation)- Wavelength: small bands (40 nm FWHM) with centre frequencies at 600, 700, 800 and 900 nm and wide band 700 -
900nm- Exposure control: always active, only switched off during TDI imaging- Storage zone clearing: permanent read-out of horizontal output register at a frequency of 8 x the TDI clockfrequency- TDI clockfrequency: 745 kHz (HRVIS 100 RPM equivalent, image speed approx. 17 m/s)- Clock voltages and bias levels: typical settings as indicated by the manufacturer.
Execution of the measurements was started by optimization of the focusing of the pattern on the detector via amaximization of the detector line signal amplitude in column direction with the CCD operating in a staring mode. Then thetest pattern was rotated over a few pixels (introduction of a phase shift in order to measure minimum, maximum and allintermediate MTF values).
The universal clockpattern generator was loaded with a dedicated TDI clock scheme. The electronics delays were tunedfor the right start moment of the TDI imaging as the test image sweeps over the detector. Then MTF measurements were
SPIE Vol. 1 656 High-Resolution Sensors and Hybrid Systems (1 992) I 441
Downloaded From: http://proceedings.spiedigitallibrary.org/ on 07/02/2015 Terms of Use: http://spiedl.org/terms

made, gradually optimizing the rotating mirror speed. (Before each measurement, 20 dark measurements were taken andaveraged in order to compensate for dark signal and possible straylight).
The data resulting from an MTF measurement is a matrix filled with 150 (H) x 100 (V) pixel data. A detail of thismatrix, filled with data for a testpattern with 21.7 linepairs/mm is shown (after a contrast enhancement operation) in figure 5.
Via a Fourier transform in this matrix the period of the image modulation is determined. This period will be used for theactual MTF computation.
In the pixeldata matrix all local maxima are identified. Using the computed modulation period a search range is definedaround each local maximum. Within these ranges the local minima are identified. Then, using all max./min combinations theMTF is computed via formula 1.
MTF = Max. signal - Mm. signalMax. signal + Mm. signal
(
The results of the MTF computation are presented in the form of an histogram (figure 6), which gives the number ofmeasurements within the 150 x 100 pixel matrix having a given MTF value.
The results of the MTF measurements performed at the Nyquist frequency with the CCD operating in TDI mode aresummarized in table 3.
Wavelength Measured overallMTF
Test set-up MTF(correction factor)
Measured detectorMTF
600 nm700 nm800nm900 nm
700 - 900 nm
36%32%29%27%26%
73%72%70%68%
> 68%
49%44%41%40%
> 38%
Table 3 MTF measurements results with CCD operating in TDI mode
All MTF measurements as performed for the TDI mode have been repeated with the detector in a staring reference mode ofoperation. Care has been taken that the image transfer time from image zone was short (< 1%) w.r.t. the total integrationtime in order to avoid image smear.The results of the MTF measurements, also at the Nyquist frequency with the CCD operating in the staring mode aresummarized in table 4.
Wavelength Measured overallMTF
Test set-up MTF(correction factor)
Measured detectorMTF
600 nm700 nm800nm900 nm
700-900nm
38%34%31%29%31%
73%72%70%68%
>68%
52%47%43%43%
>45%
Table 4 MTF measurements results with CCD operating in staring mode
442 ISPIE Vol. 1656 High-Resolution Sensors and HybridSystems (1992)
Downloaded From: http://proceedings.spiedigitallibrary.org/ on 07/02/2015 Terms of Use: http://spiedl.org/terms

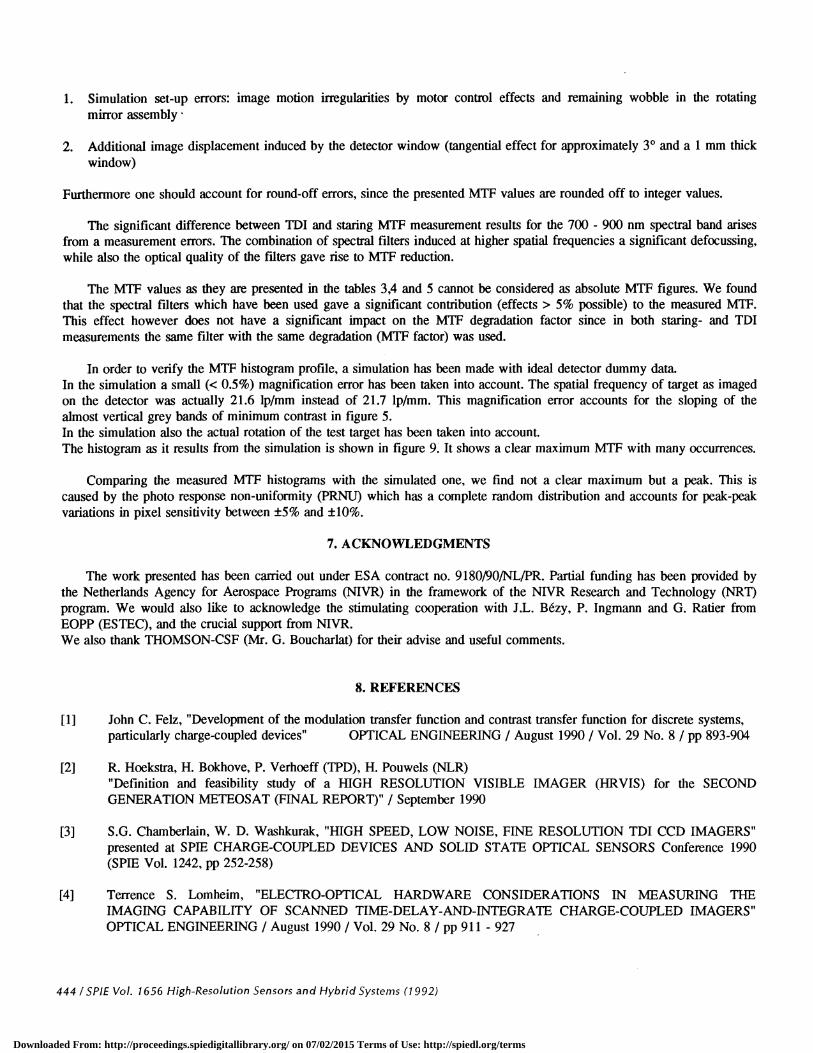
A histogram of one of the staring mode MTF measurements is shown in figure 7. In comparing histograms one should notethat the histogram for the TDI-MTF measurements is based on a 150 (H) x 100 (V) pixelmatrix while the histograms for thestaring-MTF and the simulation are based on a 150 x 150 pixel matrix.
6. ANALYSIS
The results of the MiT measurements obtained in the TDI- and the staring reference mode of operation were used tocompute a degradation factor (MTF) via formula 2:
'-TDI MTFataring X MTF (2)
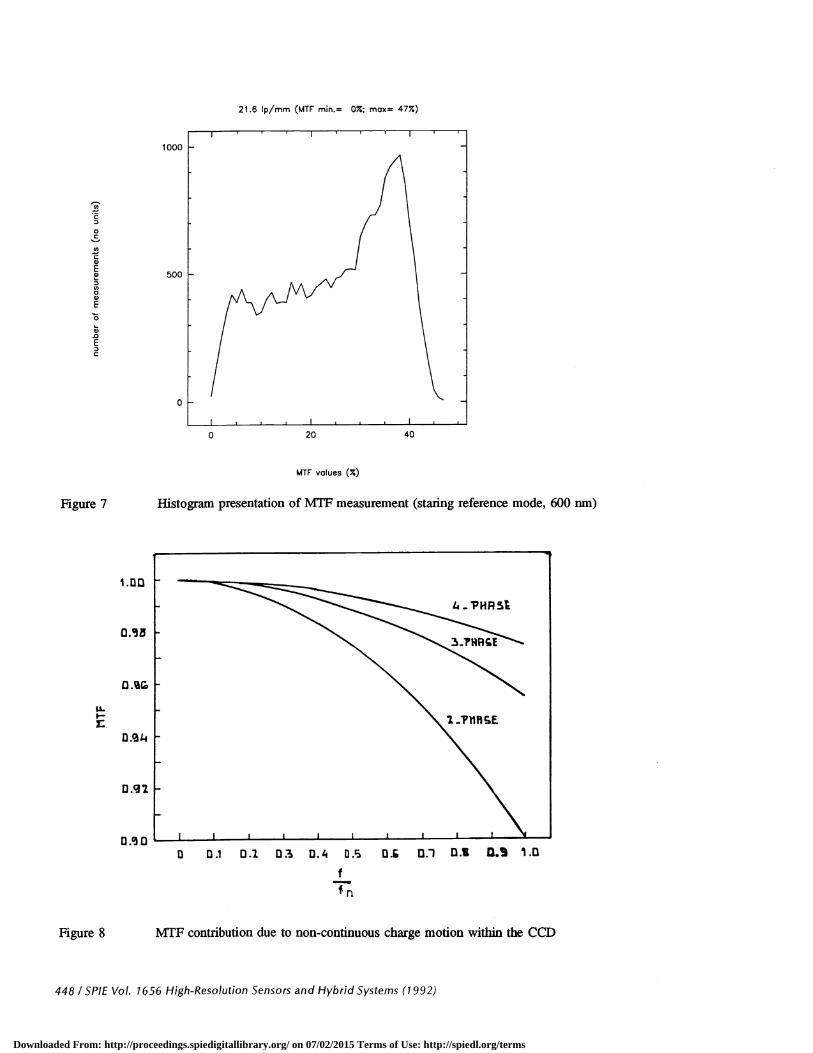
Theoretically, assuming an ideal test set-up and detector, the degradation factor should be equal to the MTF contribution dueto the non-continuous charge motion within a four-clockphase CCD (see figure 8).For the Nyquist frequency, the measured MTF contributions in the four, spectral bands as well as the computed andtheoretical MTF degradation factors are summarized in table 5.
Wavelength Measured MTF MTF degradation factor (TDI/Staring)
Staring mode ] TDI mode Measured Theory (4-phase clock)
600 nm700 nm800 nm900 nm
52%47%43%43%
49%44%41%40%
0.940.940.950.93
0.970.970.970.97
Table 5 Measured and theoretical MTF degradation factors (for Nyquist frequency)
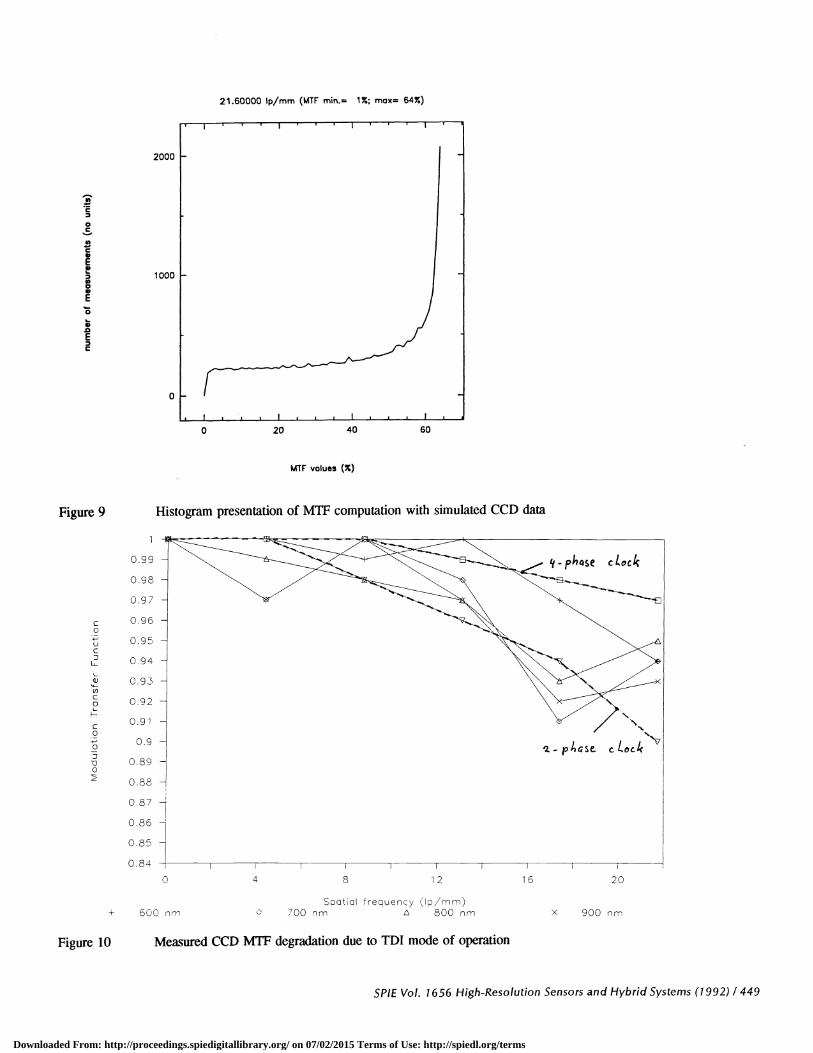
The MTF degradation factors (MTF) have been computed for the four spectral bands over the entire spatial frequencyrange up to the Nyquist frequency and are shown in figure 10 together with the theoretical MTF degradation factors for botha 4-clockphase and a 2-clockphase detector.
Comparing the results of the MTF measurements as obtained in a TDI and (reference) staring mode we noticed that:
1. there is a systematic degradation of the MTF when operating in the TDI mode
2. a systematic MTF degradation is no longer visible at the wide band (700 - 900 nm)
Such a degradation of the MTF in ThI mode is expected from the non-continuous motion of the charge during the transferthrough the CCD [2,3]. The MTF degradation caused by this non-continuous motion of the charge can be computed byFourier transform in one direction on a rectangular profile, representing the image motion during one charge transfer (1/4pixel in case of a four phase transport clock). The MTF degradation (image blur) can be described by formula 3:
MTF.JI.J1 S1flC -- () (n is the nr. of clock phases) (3)
The effect of the non-continuous motion of the charge on the MTF is visualized in figure 8.
The measured MTF degradation is generally a few percent higher than the MTF degradation expected on grounds of thenon-continuous motion of charge. However, except for measurement inaccuracies one also should account for two othersources of MTF degradation, which become particularly significant for the higher spatial frequencies. They are:
SPIE Vol. 1 656 High-Resolution Sensors and Hybrid Systems (1 992) 1 443
Downloaded From: http://proceedings.spiedigitallibrary.org/ on 07/02/2015 Terms of Use: http://spiedl.org/terms
1. Simulation set-up errors: image motion irregularities by motor control effects and remaining wobble in the rotatingmirror assembly
2. Additional image displacement induced by the detector window (tangential effect for approximately 3° and a 1 mm thickwindow)
Furthermore one should account for round-off errors, since the presented MTF values are rounded off to integer values.
The significant difference between ThI and staring MTF measurement results for the 700 - 900 nm spectral band arisesfrom a measurement errors. The combination of spectral filters induced at higher spatial frequencies a significant defocussing,while also the optical quality of the filters gave rise to MTF reduction.
The MTF values as they are presented in the tables 3,4 and 5 cannot be considered as absolute MTF figures. We foundthat the spectral filters which have been used gave a significant contribution (effects > 5% possible) to the measured MTF.This effect however does not have a significant impact on the MTF degradation factor since in both staring- and TDImeasurements the same filter with the same degradation (MTF factor) was used.
In order to verify the MTF histogram profile, a simulation has been made with ideal detector dummy data.In the simulation a small (< 0.5%) magnification error has been taken into account. The spatial frequency of target as imagedon the detector was actually 21.6 lp/mm instead of 21.7 lp/mm. This magnification error accounts for the sloping of thealmost vertical grey bands of minimum contrast in figure 5.In the simulation also the actual rotation of the test target has been taken into account.The histogram as it results from the simulation is shown in figure 9. It shows a clear maximum MTF with many occurrences.
Comparing the measured MTF histograms with the simulated one, we find not a clear maximum but a peak. This iscaused by the photo response non-uniformity (PRNTJ) which has a complete random distribution and accounts for peak-peakvariations in pixel sensitivity between and
7. ACKNOWLEDGMENTS
The work presented has been carried out under ESA contract no. 918OI9OINLIPR. Partial funding has been provided bythe Netherlands Agency for Aerospace Programs (NIVR) in the framework of the NTVR Research and Technology (NRT)program. We would also like to acknowledge the stimulating cooperation with J.L. Bézy, P. Ingmann and G. Ratier fromEOPP (ESTEC), and the crucial support from NIVR.We also thank ThOMSON-CSF (Mr. G. Boucharlat) for their advise and useful comments.
8. REFERENCES
[1] John C. Felz, "Development of the modulation transfer function and contrast transfer function for discrete systems,particularly charge-coupled devices" OPTICAL ENGINEERING IAugust 1990 I Vol. 29 No. 8 I pp 893-904
[2] R. Hoekstra, H. Bokhove, P. Verhoeff (TPD), H. Pouwels (NLR)"Definition and feasibility study of a HIGH RESOLUTION VISIBLE IMAGER (HRVIS) for the SECONDGENERATION METEOSAT (FINAL REPORT)" / September 1990
[3] S.G. Chamberlain, W. D. Washkurak, "HIGH SPEED, LOW NOISE, FINE RESOLUTION TDI CCD IMAGERS"presented at SPIE CHARGE-COUPLED DEVICES AND SOLID STATE OPTICAL SENSORS Conference 1990(SPffi Vol. 1242, pp 252-258)
[4] Terrence S. Lomheim, "ELECTRO-OPTICAL HARDWARE CONSIDERATIONS IN MEASURING THEIMAGING CAPABILITY OF SCANNED TIME-DELAY-AND-INTEGRATE CHARGE-COUPLED IMAGERS"OPTICAL ENGINEERING / August 1990 / Vol. 29 No. 8 / pp 911 - 927
444 / SPIE Vol. 1656 High-Resolution Sensors and Hybrid Systems (1992)
Downloaded From: http://proceedings.spiedigitallibrary.org/ on 07/02/2015 Terms of Use: http://spiedl.org/terms

n'nxCiiWSE INT.6MTIDN
IDI
_____________ VGE II%1ERT1tTh
/1
k LINES V(ITH m x CHWFCE EETIBM
n x CiRPE Ii1EPT)UNthu
11111 E1T0URE C.ONTRUL HTPJEUWPE IN1ER1N!
1/
jflQ_n x LHRRGE NTE69TIDN.
FYRME
TBRNF!R
SCANFIELD C £i5N 9° E.W)
CtD EAD...UUT
/
Figure 2 HRVIS viewing conditions
SPIE Vol. 1656 High-Resolution Sensors and Hybrid Systems (1992) / 445
5Tilfl IMFIGEPRER AREA x CHRRE 1NTeRfiT1flN
S[RNFIELB
"E!W11 " ttI1ENTRS CANFIELD
II
1/
Figure 1 TDI operation with a frame transfer CCD
D cLERP1NaTDL uici
UIflGE DETEt.TIUN /
Downloaded From: http://proceedings.spiedigitallibrary.org/ on 07/02/2015 Terms of Use: http://spiedl.org/terms

LtUNINT1QN
Figure 4
RDTRTN6
1'1flTU IOE
446 ISPIE Vol. 1656 High-Resolution Sensors and Hybrid Systems (1992)
TRPIWT
I LLUTIINRT1QN
SWUTTEX
DN MRMI?ULBTO
PEThDLFILTERS
RflTHT1NG IIQX '3
IMREgEIucnnNQEtTrgE.
SQWF1
1MULRTDR
Figure 3 Schematic overview of TDI opto-mecharncal test set-up
MRTIIPULRTCX
T?D LOCAL RREP NETWOF — —
Functional block diagram of test set-up electronics1E NEFWOX
Downloaded From: http://proceedings.spiedigitallibrary.org/ on 07/02/2015 Terms of Use: http://spiedl.org/terms

Figure 5 Detail of matrix with CCD data (testpattem 21.7 lp/mm)
21.6 lp/mm (MTF min.= 0%; max= 40%)
I I
1000
0C
Ca,Ea)
500aa)E
0a,.0EC
0
MTF values (%)
Figure 6 Histogram presentation of MTF measurement (TDI mode, 600 run)
SPIE Vol. 1656 High-Resolution Sensors and Hybrid Systems (1992) / 447
0 20 40
Downloaded From: http://proceedings.spiedigitallibrary.org/ on 07/02/2015 Terms of Use: http://spiedl.org/terms
0)
0C
U)C0)E00
U)aa)E
0a)
EC
21.6 lp/mm (MTF min.= 0%; max= 47%)
I I
0 20
1.00
1000
500
0
40
MTF values (%)
Figure 7 Histogram presentation of MTF measurement (staring reference mode, 600 nm)
IL
Figure 8 MTF contribution due to non-continuous charge motion within the CCD
448 / SPIE Vol. 1656 High-Resolution Sensors and Hybrid Systems (1992)
13
D .92
0 . 00 0.1 0.1 03 0./i 0.5 fl. 0.1 0.1 Q3
f
Downloaded From: http://proceedings.spiedigitallibrary.org/ on 07/02/2015 Terms of Use: http://spiedl.org/terms
lbC
0C
ClbElb
lb0lbE
0lb
EC
Figure 9
0.99
0.98
0.97
0.960
0.95C
L 0.94
0.93
j0.89
00.88
0.87
0.86
0.85
0.84
600 nmSpat(aI frequency ((p/mm)
700nm A 800nm X 900nm
Figure 10 Measured CCD MTF degradation due to TDI mode of operation
SPIE Vol. 1656 High-Resolution Sensors and Hybrid Systems (1992) /449
21.60000 p/mm (MTF min.= 17.; max= 647.)
2000 -
1000 -
0-I . I
0 20 40 60
MIF volues ()
Histogram presentation of MTF computation with simulated CCD data
0 4 8 20
Downloaded From: http://proceedings.spiedigitallibrary.org/ on 07/02/2015 Terms of Use: http://spiedl.org/terms