Venture View 2010 Charts
22
Venture View: 2010 NVCA Predictions Survey Results
Transcript of Venture View 2010 Charts
8/14/2019 Venture View 2010 Charts
http://slidepdf.com/reader/full/venture-view-2010-charts 1/22

8/14/2019 Venture View 2010 Charts
http://slidepdf.com/reader/full/venture-view-2010-charts 2/22
Venture View: 2010 VC Predictions SurveyResults
•Fourth Annual Predictions Survey of the NVCA•Conducted in Nov. 30 – Dec. 8, 2009
•More than 325 responses from VCs across the US
•For more information– Contact: Emily Mendell ([email protected])
– Contact: Channa Brooks ([email protected])

8/14/2019 Venture View 2010 Charts
http://slidepdf.com/reader/full/venture-view-2010-charts 3/22
In 2010, venture capital investmentwill:
7%
4429%
9%
11%
Increase substantially >$25 BN Increase slightly $21-25 BN Decrease slightly $
Decrease substantailly <$15 BN Remain unchanged from 2009

8/14/2019 Venture View 2010 Charts
http://slidepdf.com/reader/full/venture-view-2010-charts 4/22
In 2010, our firm will invest in:
49
18%
33%
More portfolio companies Fewer portfolio companies
The same number of portfolio companies
8/14/2019 Venture View 2010 Charts
http://slidepdf.com/reader/full/venture-view-2010-charts 5/22
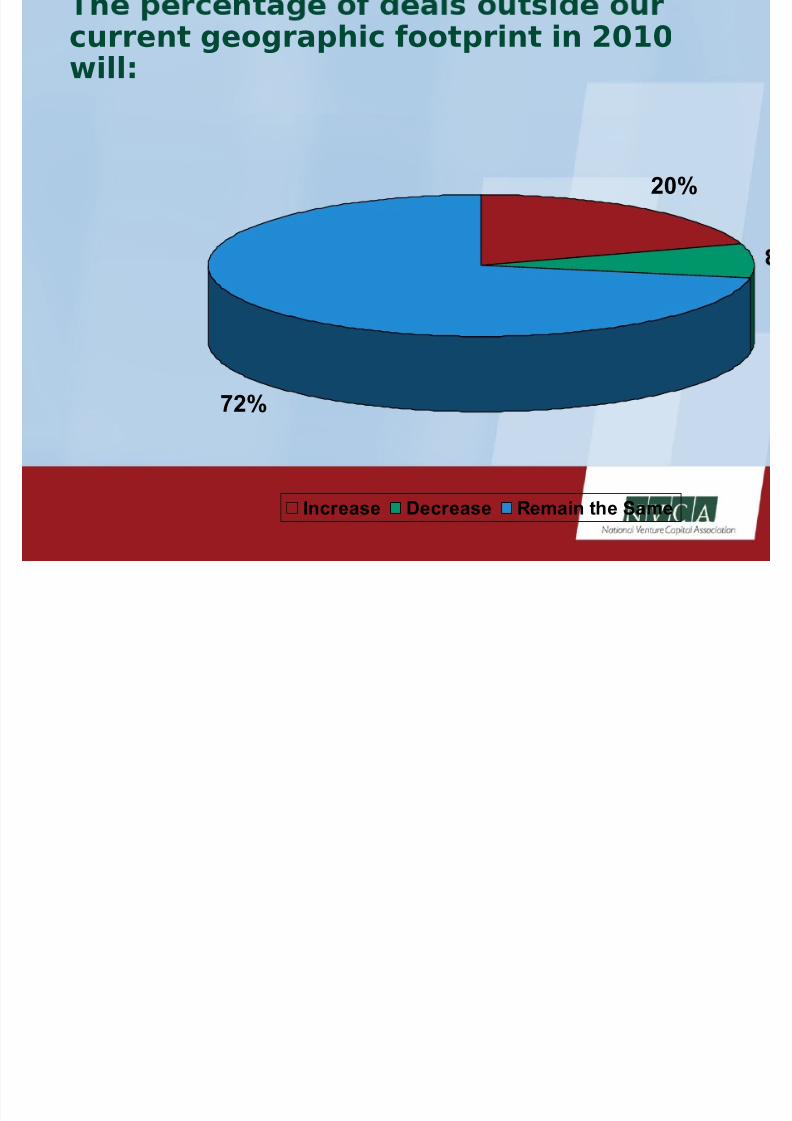
current geographic footprint in 2010will:
20%
72%
Increase Decrease Remain the Same

8/14/2019 Venture View 2010 Charts
http://slidepdf.com/reader/full/venture-view-2010-charts 6/22
Investment in 2010 in the followingsectors will:
30%
15%
26%
43%
37%
39%
20%
32%
33%
46%
54%
25%
0% 20% 40% 60
Software
Media/Entertain.
Internet
Clean Tech
8/14/2019 Venture View 2010 Charts
http://slidepdf.com/reader/full/venture-view-2010-charts 7/22
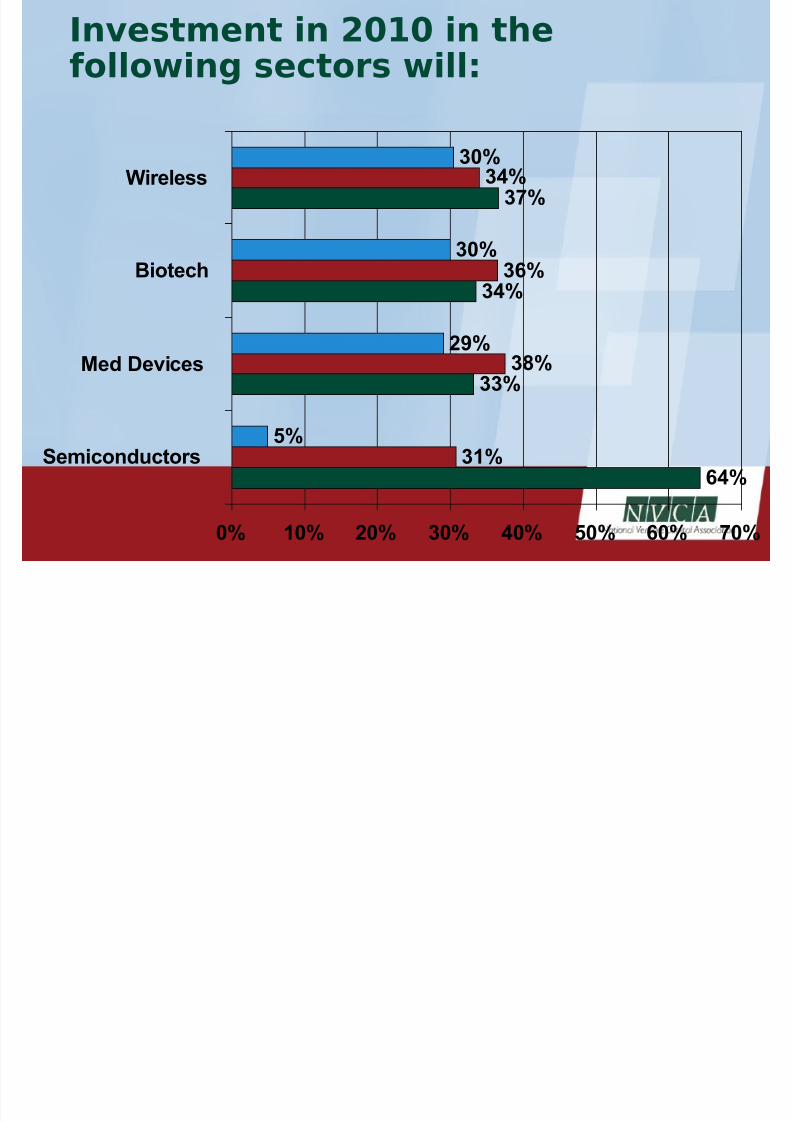
64%
33%
34%
37%
31%
38%
36%
34%
5%
29%
30%
30%
0% 10% 20% 30% 40% 50% 60% 70%
Semiconductors
Med Devices
Biotech
Wireless
Investment in 2010 in thefollowing sectors will:

8/14/2019 Venture View 2010 Charts
http://slidepdf.com/reader/full/venture-view-2010-charts 8/22
45%
27%
16%
12%
40%
53%
26%
17%
15%
20%
58%
70%
0% 20% 40% 60% 80%
Europe
Israel
India
China
Investment in 2010 in thefollowing regions will:
8/14/2019 Venture View 2010 Charts
http://slidepdf.com/reader/full/venture-view-2010-charts 9/22
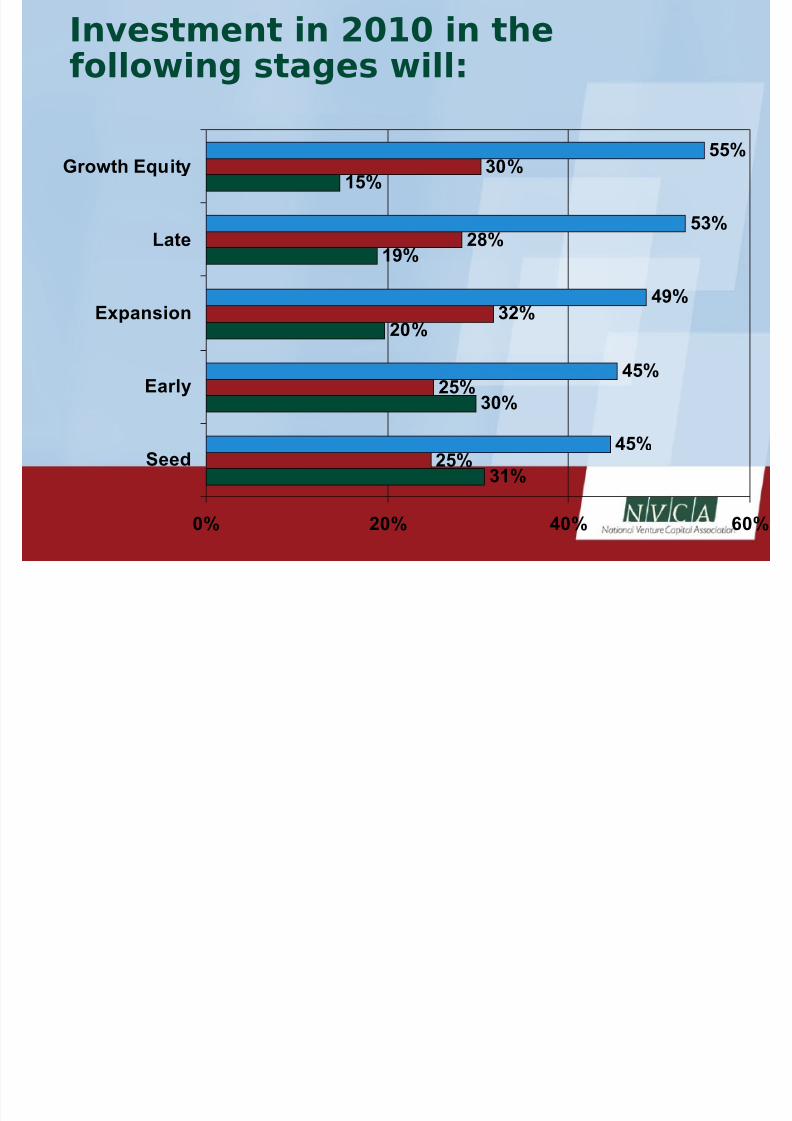
31%
30%
20%
19%
15%
25%
25%
32%
28%
30%
45%
45%
49%
53%
55%
0% 20% 40% 60%
Seed
Early
Expansion
Late
Growth Equity
Investment in 2010 in thefollowing stages will:

8/14/2019 Venture View 2010 Charts
http://slidepdf.com/reader/full/venture-view-2010-charts 10/22
In 2010 the number of venture-backedIPOs will be:
26.1%
43.3%
20.4%
10.
0%
5%10%
15%
20%
25%30%
35%
40%
45%
0-19 20-29 30-50 >50
Mean: 26.32Min: 5 Max: 120Median: 25
8/14/2019 Venture View 2010 Charts
http://slidepdf.com/reader/full/venture-view-2010-charts 11/22
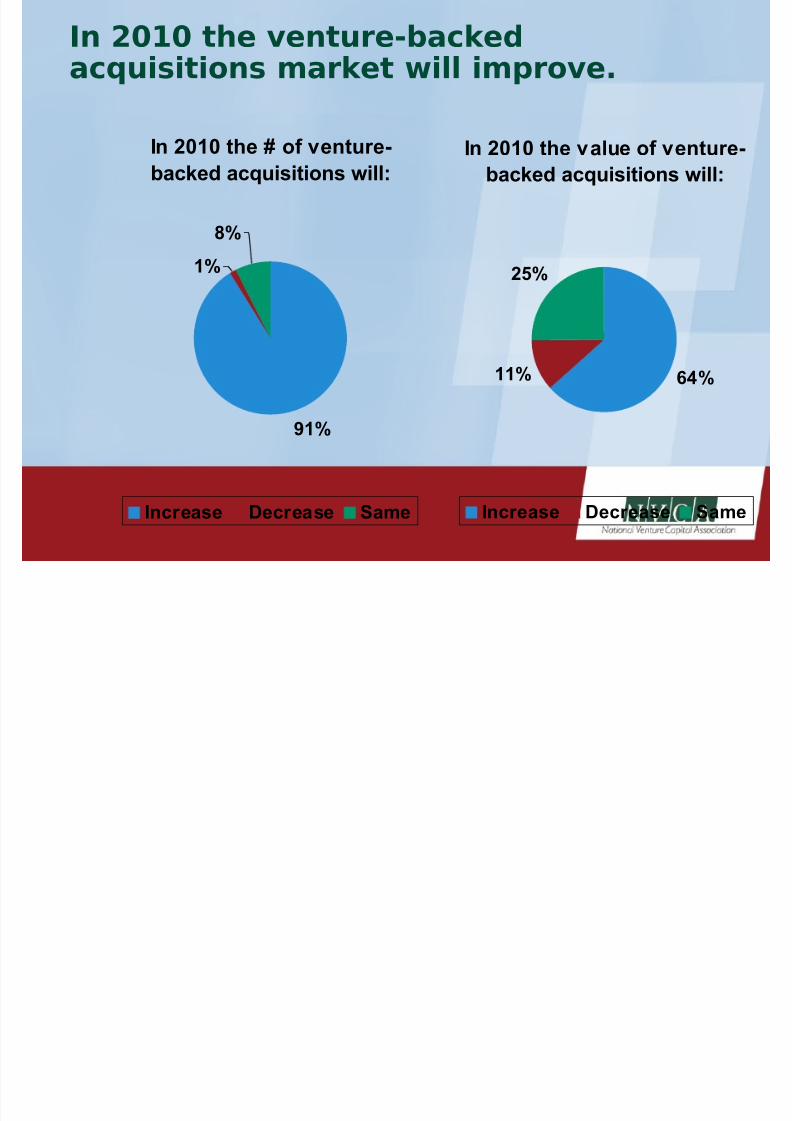
In 2010 the # of venture-
backed acquisitions will:
91%
1%
8%
Increase Decrease Same
In 2010 the value of venture-
backed acquisitions will:
64%11%
25%
Increase Decrease Same
In 2010 the venture-backedacquisitions market will improve.

8/14/2019 Venture View 2010 Charts
http://slidepdf.com/reader/full/venture-view-2010-charts 12/22
In 2010 the # of venture
investors in our firm will:
22%
15%63%
Increase Decrease Same
In 2010 the # of admin
professionals in our firm will:
12%
17%
71%
Increase Decrease Same
In 2010 firms resources are expected toremain largely unchanged.
8/14/2019 Venture View 2010 Charts
http://slidepdf.com/reader/full/venture-view-2010-charts 13/22
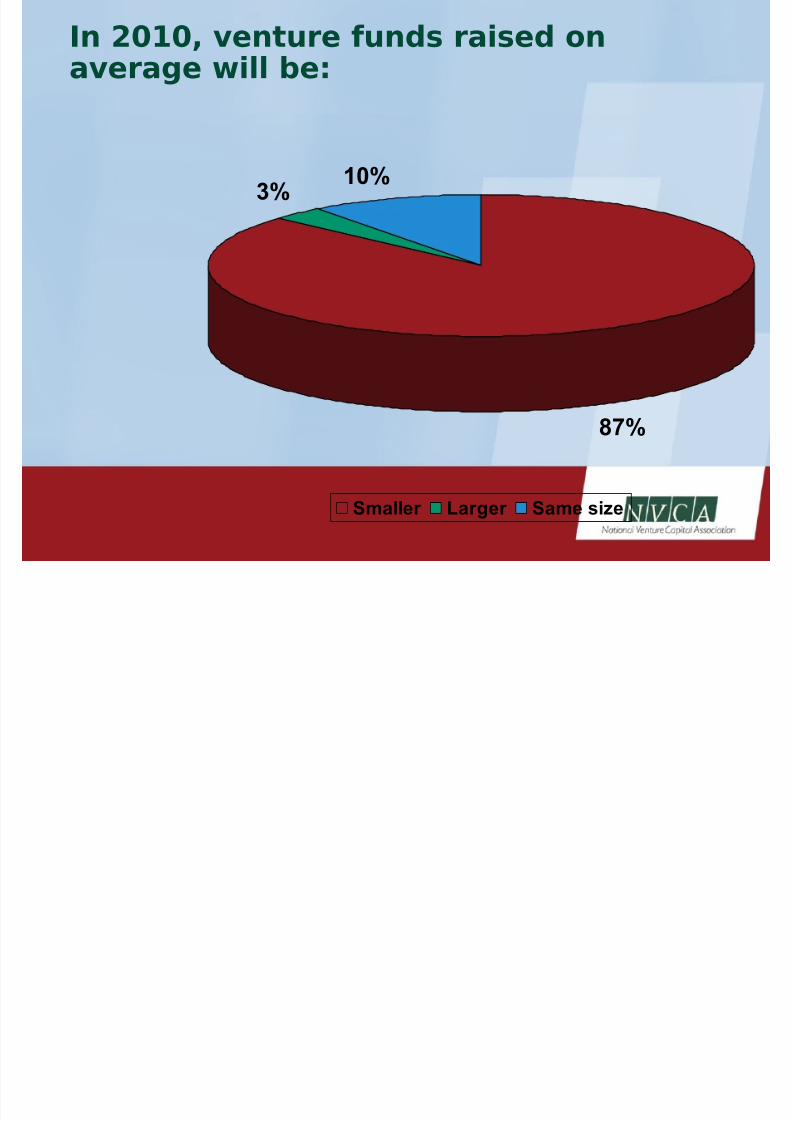
In 2010, venture funds raised onaverage will be:
87%
3%10%
Smaller Larger Same size

8/14/2019 Venture View 2010 Charts
http://slidepdf.com/reader/full/venture-view-2010-charts 14/22
In 2010, the US venture industry willsee foreign limited partners in:
27%
25%
More Funds Fewer Funds Same Number of Funds

8/14/2019 Venture View 2010 Charts
http://slidepdf.com/reader/full/venture-view-2010-charts 15/22

8/14/2019 Venture View 2010 Charts
http://slidepdf.com/reader/full/venture-view-2010-charts 16/22
In the next five years the venturecapital industry will shrink by:
20%
58%
21%1% 0%
< 15% 16-30% 31-50% 51-70% >70%
Wh t ill d diff tl i

8/14/2019 Venture View 2010 Charts
http://slidepdf.com/reader/full/venture-view-2010-charts 17/22
“Corporate venturing& job creation funds.”- Thomas O. Gephart,
Managing Partner,Ventana Capital
2010 will be Brazil's Skype
moment.” - Simon Olson,Partner, Draper Fisher Jurvetson, FIR Capital Brazil
“For 2010, we plan to broaden ourgeographic focus to include investments inEurope.” - John Huntz, Executive Director,
Arcapita Ventures
“It's the global economy, stupid. Focus on
investments in the USA targeting customersin the ROW (rest of the world).” – Trevor Loy,General Partner, Flywheel Ventures
Since Sep08 we have focused on firms that canreach breakeven on this round. In 2010 our
willingness to take finance risk will likely return.” -Bronson Lingamfelter, Associate, Rose Tech
Ventures
“In 2010 we are going toCarpe Per Diem - Sieze theday to make money for our
LPs.” - Venky Ganesan,Managing Director, Globespan
Capital Partners
“We will do more investment under betterenvironment for new deals.” - Masatoshi Ueno,
CEO/Technology, Yasuda Enterprise Development America Inc.
“We will find new mistakes to makethat we have not made before; but all
in all things look pretty strong and theteam is optimistic.” - Bob More,
General Partner, Frazier HealthcareVentures
“The IPO market for VC backed companies will finally reopen in the US and several IPOs will reach $1billion market capitalizations or more.” - Pascal Levensohn, Founder and Managing Partner,Levensohn Venture Partners
“Take more companies public.” – Richard Kramlich, General Partner/Co-Founder, NEA
We will look for valuations to
come into equilibrium and domore transactions at that time.”– Jim Hale, Founding Partner, FTV
Capital
“We will raise our next fund and continue to invest inconsumer-facing Internet companies like Twitter and
Zynga.” - Norman Fogelsong, General Partner,Institutional Venture Partners
“500K to 1M as early as possible in great teams = early stageinvesting.” - Steve Fredrick, General Partner, Grotech Ventures
What will you do differently in2010?
Relentlessly & w/seemingly undueprecision reverse
engineer the early exitto drive w/ great focuswhat founders do nowto grow their cos.” -
Becca Braun, President,
JumpStart Ventures
Wh t ill d diff tl i

8/14/2019 Venture View 2010 Charts
http://slidepdf.com/reader/full/venture-view-2010-charts 18/22
“Move to accelerate thedevelopment of investmentcandidates and portfoliocompanies.” - Greg Knudson,Director, Rocket Ventures
“2010 will likely mark the renewal of Corporate Venture Capitalas corporations will rediscover the value of tapping externalinnovation.” - Bernard Slede, Portfolio Manager, HP CorporateVenture Capital
tually spend meaningful time with investment bankers, again.” - Gerry Langeler, Managing Director, OVP Venture Par
“The makeup of seed syndicates will evolve in 2010, asmore traditional venture capitalists seek earlier accessto capital-efficient deals.” - Christine Herron, Principal,
First Round Capital
“Hopefully nothing. We're rockin' here atCatamount.” - Jed Smith, Managing Director,
Catamount Ventures
“With our new $1.2Bn NVP XI fund, we planto continue our expansion along 3 vectors: 1.
Stages (early & late)2. Regions and 3.Sectors.” - Sergio Monsalve, Principal, NVP
“More reserve capacity per deal and less deals per fund;also build broader syndicate up front at initial
investment.” - George Arida, Managing Director, Venture
Investors LLC
“Embrace moreuniversities into our seed
stage model.” - Rudy Garza, Managing Partner,
G51 Capital
As start-up capital efficiency continues to improve, we will do moreearlier stage deals.” – John Backus, Managing Partner, New Atlantic
Ventures
“Work harder, maintainhigh standards, and see
more companies.” -C.W. Newhall, GeneralPartner, Co-Founder,
NEA
“We will increase our investment pacebecause we believe this a great time to
invest - innovation and strong companiesabound!” - Jeanne M Sullivan, General
Partner, StarVest Partners L.P.
“We will fund growth more aggressivelyin 2010 as we come out of the
recession.” – Don Rainey, GeneralPartner, Grotech Ventures
“Expect to see us be more aggressiveseeding new opportunities.” - Michael
Greeley, General Partner, FlybridgeCapital Partners
What will you do differently in2010?

8/14/2019 Venture View 2010 Charts
http://slidepdf.com/reader/full/venture-view-2010-charts 19/22
Historical Data for the VentureIndustry
8/14/2019 Venture View 2010 Charts
http://slidepdf.com/reader/full/venture-view-2010-charts 20/22
0.0
20.0
40.0
60.0
80.0
100.0
120.0
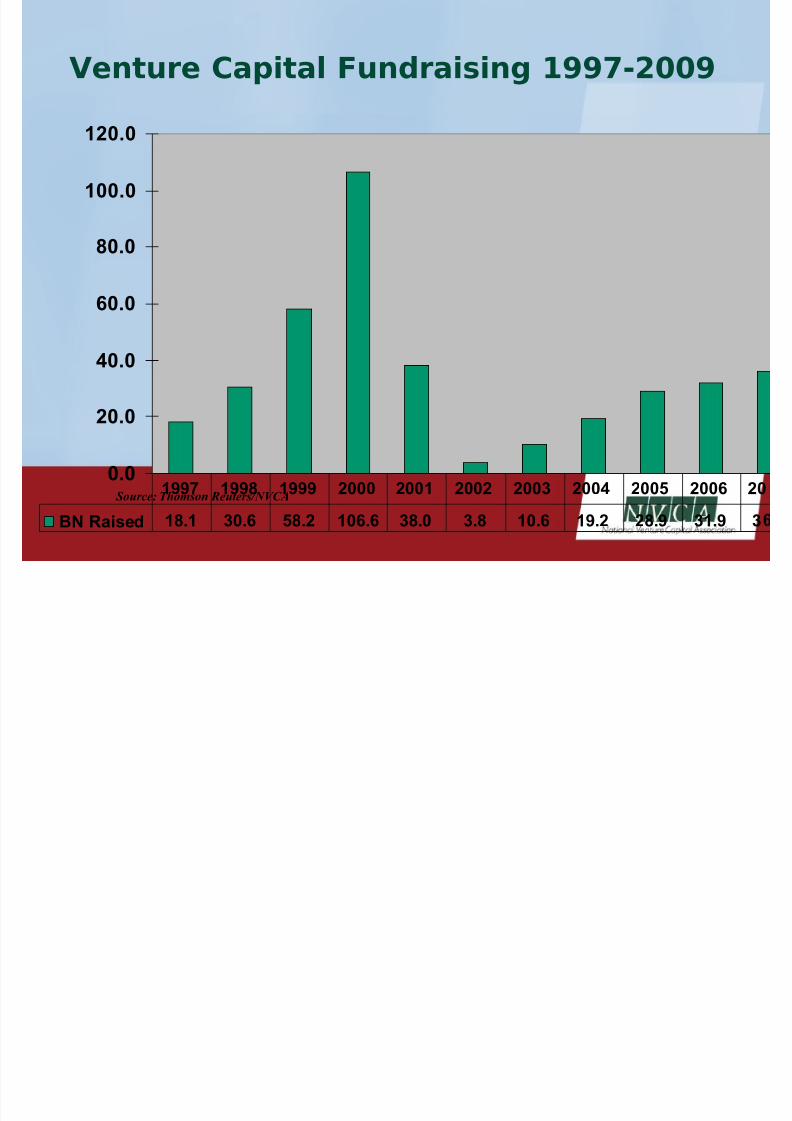
BN Raised 18.1 30.6 58.2 106.6 38.0 3.8 10.6 19.2 28.9 31.9 3
1997 1998 1999 2000 2001 2002 2003 2004 2005 2006 20 Source: Thomson Reuters/NVCA
Venture Capital Fundraising 1997-2009

8/14/2019 Venture View 2010 Charts
http://slidepdf.com/reader/full/venture-view-2010-charts 21/22
$14$20
$52
$101
$39
$21$19
$22 $23$26
$31 $28
$0
$20
$40
$60
$80
$100
$120
$
B i l l i o n s I n v e s t e d
1 9 9 7
1 9 9 8
1 9 9 9
2 0 0 0
2 0 0 1
2 0 0 2
2 0 0 3
2 0 0 4
2 0 0 5
2 0 0 6
2 0 0 7
2 0 0 8
Source: PricewaterhouseCoopers/National Venture Capital Association MoneyTree™ Report,
Data: Thomson Reuters
Venture Capital Investment 1997-2009

8/14/2019 Venture View 2010 Charts
http://slidepdf.com/reader/full/venture-view-2010-charts 22/22
0
100
200
300
400
500
600
700
N u m b e r o f I s s u e s
M&A
IPO
M&A 164 209 240 317 353 319 285 348 350 375 378
IPO 136 77 260 264 41 24 29 93 56 57 86
1997 1998 1999 2000 2001 2002 2003 2004 2005 2006 2007 Source: Thomson Reuters/National Venture Capital Association
Venture Capital Exits 1997-2009