
Ventilation standards and demand controlled ventilation...TKK 12.5.2009. J. Kurnitski © 2009....
73
TKK 12.5.2009 J. Kurnitski © 2009 Ventilation standards and demand controlled ventilation Jarek Kurnitski D.Sc., Adjunct Professor Sitra, the Finnish Innovation Fund Helsinki University of Technology, HVAC-Technology 12.5.2009 J. Kurnitski © 2009 1 TKK Air Academy Tallinn 2009
Transcript of Ventilation standards and demand controlled ventilation...TKK 12.5.2009. J. Kurnitski © 2009....
TKK12.5.2009 J. Kurnitski © 2009
Ventilation standards and demand controlled ventilation
Jarek KurnitskiD.Sc., Adjunct Professor
Sitra, the Finnish Innovation FundHelsinki University of Technology, HVAC-Technology
12.5.2009 J. Kurnitski © 2009 1TKK
Air Academy Tallinn 2009

TKK12.5.2009 J. Kurnitski © 2009
Contents
• Performance criteria for ventilation – ventilation rates• Air distribution• Finnish Indoor Environment Classification 2008 –
Sisäilmastoluokitus 2008• Demand controlled ventilation examples

TKK12.5.2009 J. Kurnitski © 2009
Indoor environmental performance of buildings
• Indoor climate (TC, IAQ, lighting, acoustics)• Energy performance and environmental performance
• In the design and in the assessment of performance of a existing building, ventilation rate is the most straightforward, however indirect measure of IAQ, together with low-polluting and dry building materials
• An example of the foot-print of indoor climate of a building according to EN 15251 (based on ventilation rate per person and very-low polluting materials)
11 %
3 %
9 %
27 %
22 %
100 %
69 %
58 %
Thermal environment, heating season
Thermal environment, cooling season
Indoor air quality
IV III II I

TKK12.5.2009 J. Kurnitski © 2009
Performance criteria for ventilation
• Ventilation (outdoor air flow) has to be adequate to remove and dilute the indoor generated pollutants and humidity, and provide acceptable level of contaminants in the indoor air
• Source control the first alternative to improve indoor air quality• Ventilation shall be energy efficient and arranged so that it does not
deteriorate indoor air quality and climate, and does not cause any harm to the occupants or to the building
• Ventilation rates should be based on the pollution loads and use of the building
• Many standards and a lot of scientific evidence related to ventilation

TKK12.5.2009 J. Kurnitski © 2009
Evidence on SBS, PAQ, sick-leave, productivity (non-residential)
• Ventilation and performance of office work in relation to 6.5 L/s per person (Seppänen 2006)• Ventilation and short-time sick leaves in open-plan offices (Milton 2000)
0
0.5
1
1.5
2
2.5
Outdoor air supply rate (L/s per person)
% sick leave
12 24
35% lower
0
0.5
1
1.5
2
2.5
Outdoor air supply rate (L/s per person)
% sick leave
12 24
35% lower
Outdoor air supply rate (L/s per person)
Perf
orm
ance
0 10 20 30 40 50 60
1.01
1.00
1.02
1.03
1.04
1.05

TKK
Ventilation often linked with temperature control
12.5.2009 J. Kurnitski © 2009
• Relative performance as a function of temperature REHVA Guidebook 6 (2006)

TKK12.5.2009 J. Kurnitski © 2009
Low ventilation increases humidity and symptoms in residences
Risk (odds ratio) of symptoms of asthma and allergy (wheezing, rhinitis, eczema) as a function of ventilation rates in single family houses (Bornehag et al. 2005)
1
2
3
0 0.17 0.26 0.38 0.62 h-1
Median air change in homes
1
2
3
0 0.17 0.26 0.38 0.62 h-1
Median air change in homes
0
5
10
15
20
=0.25 0.25- 0.50 >0.50Air change rate (h-1)
( )
>100mites per 0.1g mattress dust(P=0.024)
Prevalence of house dust mites in homes (Harving et al. 1993) Prevalence of house dust mites in homes (Harving et al. 1993)

TKK
Main ventilation standards
• General standards (indoor climate), system standards and component standards
• CEN CR 1752:1998 Ventilation for buildings. Design criteria for the indoor environment
• EN 15251:2007 Criteria for the Indoor environment including thermal, indoor air quality, light and noise
• ASHRAE 62.1 (2007) Ventilation for acceptable indoor air quality• ASHRAE 62.2 (2007) Ventilation and acceptable indoor air quality in
low-rise residential buildings
• EN 13779:2007 Ventilation for non-residential buildings – Performance requirements for ventilation and room-conditioning systems
• (ISO 7730 & ASHRAE 55 – thermal comfort standards)

TKK
System standards
• EN 13779:2007 Ventilation for non-residential buildings – Performance requirements for ventilation and room-conditioning systems
• EN 14788 Ventilation for buildings - Design and dimensioning of residential ventilation systems
• EN 12792 Ventilation for buildings - Symbols, terminology and graphical symbols
• EN 15241:2007 Ventilation for buildings - Calculation methods for energy losses due to ventilation and infiltration in commercial buildings
• EN 15242:2007 Ventilation for buildings - Calculation methods for the determination of air flow rates in buildings including infiltration
• EN 15243:2007 Ventilation for buildings — Calculation of room temperatures and of load and energy for buildings with room conditioning systems
• …

TKK
Component standards (some examples)
• EN 13053 Ventilation for buildings — Air handling units — Rating and performance for units, components and sections
• EN 12237 Ventilation for buildings – Ductwork – Strength and leakage of circular metal sheet ducts
• EN 13141-7 Ventilation for buildings — Performance testing of components/products for residential ventilation — Part 7: Performance testing of a mechanical supply and exhaust ventilation units (including heat recovery) for mechanical ventilation systems intended for single family dwellings
• EN 13141-8 Ventilation for buildings - Performance testing of components/products for residential ventilation - Part 8: Performance testing of unducted mechanical supply and exhaust ventilation units [including heat recovery] for mechanical ventilation systems intended for a single room
• …• + many EUROVENT standards

TKK12.5.2009 J. Kurnitski © 2009
Pollutant mass balance
qv the volume flow rate of supply air in m3/sG the net mass flow rate of emission to the room air in mg/sCin the allowed concentration in the room in mg/m3
Co the concentration in the supply air in mg/m3
ε
the ventilation efficiency, (ε = 1 for complete mixing to ε = 2 for ideal piston flow)
qV qV
G Cin
εCinCo
( )1 1εoin
v CCGq−
=
TKK12.5.2009 J. Kurnitski © 2009
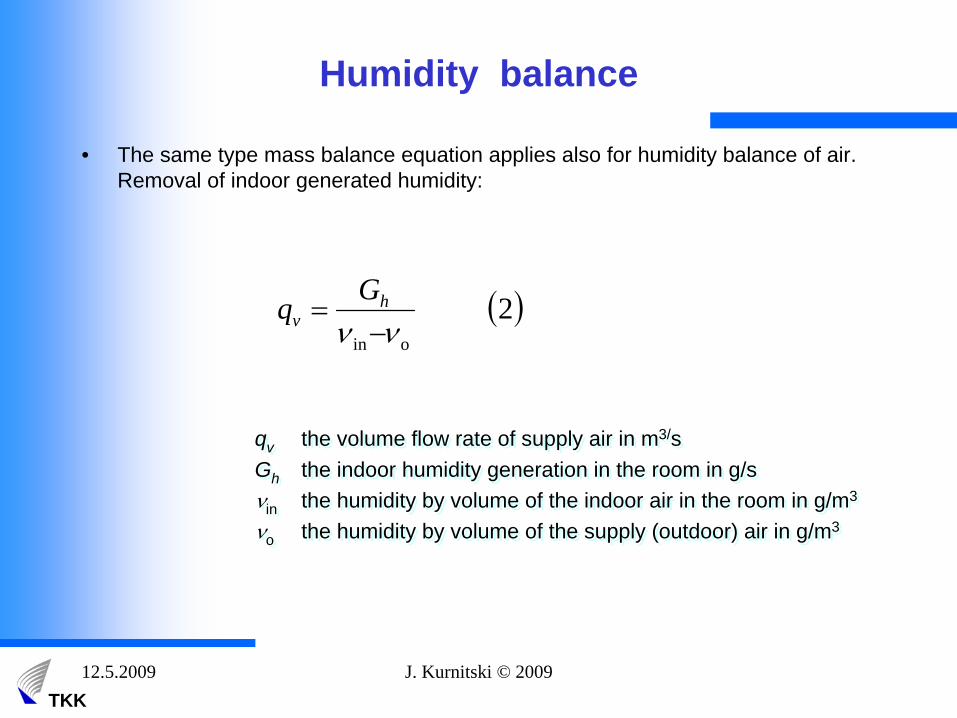
Humidity balance
• The same type mass balance equation applies also for humidity balance of air. Removal of indoor generated humidity:
( )2 oin νν −
= hv
Gq
qv the volume flow rate of supply air in m3/sGh the indoor humidity generation in the room in g/sν
in the humidity by volume of the indoor air in the room in g/m3
ν
o the humidity by volume of the supply (outdoor) air in g/m3
qv the volume flow rate of supply air in m3/sGh the indoor humidity generation in the room in g/sνin the humidity by volume of the indoor air in the room in g/m3
νo the humidity by volume of the supply (outdoor) air in g/m3

TKK12.5.2009 J. Kurnitski © 2009
Ban smoking indoors to reduce need for ventilation
0
5
10
15
20
25
Vent
ilatio
n, L
/s p
er p
erso
n
ΔO2-2 %
CO25000 ppm
BODYODOUR
80 %
ETSODOUR
1 cig / 2 h
277ETS NICOTINE 1 μg / m³
Ventilation rate per person depends on the criteria
Oxygen is never the critical criteria
Acceptable long term level of ETS cannot be achieved with ventilation

TKK12.5.2009 J. Kurnitski © 2009
Time dependent concentration
• Different pollutants – check all relevant ones (applies mainly for industrial ventilation)
• As a rule, source control is preferable to ventilation• Eq.(1) is for a steady-state and assumes that all pollution generated in room is
carried out with the airflow – no other sinks in the room• When the emission-period is short, the stationary equilibrium-concentration may
not be achieved or the airflow can be reduced for a given maximum concentration level. The time-dependency:
( )3 1)0()( ⎟⎟⎠
⎞⎜⎜⎝
⎛−+=−
⋅− tVq
vinoin
v
eqGCCtC
Cin (t) the concentration in the room at time t in mg/m3
Co the concentration in the supply air in mg/m3
Cin (0) the concentration in the room at the beginning (t = 0) in mg/m3
qv the volume flow rate of supply air in m3/sG the mass flow rate of emission in the room in mg/sV the volume of air in the room in m3
t the time in s

TKK12.5.2009 J. Kurnitski © 2009
From IAQ to ventilation rate (buildings designed for human occupancy)
• There do not exist a common standard index for the IAQ which will allow to use Eqs. (1)–(3) for determination of required ventilation rate
• Acceptable concentration of many various pollutants in indoor air is not known, especially for the mixtures of hundreds of the compounds found in the indoor air
• IAQ may be expressed as the required level of ventilation or carbon dioxide (CO2 ) concentration
• CO2 can be used as a surrogate of ventilation rates, but its use to measure ventilation is uncertain as its concentration in buildings seldom reaches steady state due to variations in occupancy, ventilation rates and outdoor air concentration
• Steady state values of carbon dioxide concentration can be calculated from CO2 generation of 0.00567 l/s per occupant in office buildings

TKK12.5.2009 J. Kurnitski © 2009
From IAQ to ventilation rate
• IAQ is influenced by emission from people and their activities (bio effluent, smoking), and from building, furnishing as well as from ventilation and air conditioning system itself (i.e. building components)
• The required ventilation is based on health and comfort criteria. In most cases the health criteria will also be met by the required ventilation for comfort. Health effects may be attributed to specific components of emission and if you reduce concentration of one source you also reduce concentration of others.
• Comfort is more related to the perceived air quality (odor, irritation). In this case different sources of emission may have an odor component that adds to the odor level.
• There is however no general agreement how different sources of emission should be added together.

TKK12.5.2009 J. Kurnitski © 2009
EN 15251 & ASHRAE 62
• In the latest standards (EN 15251, ASHRAE 62.1 and 62.2) the criteria is expressed as addition of people (smoking, non-smoking) and building components. The total ventilation rate for a room:
Bptot qAqnq ⋅+⋅=
qtot total ventilation rate of the room, l/s n design value for the number of the persons in the room,-qp ventilation rate for occupancy per person, l/s, persA room floor area, m2
qB ventilation rate for emissions from building, l/s,m2
qtot total ventilation rate of the room, l/s n design value for the number of the persons in the room,-qp ventilation rate for occupancy per person, l/s, persA room floor area, m2
qB ventilation rate for emissions from building, l/s,m2

TKK12.5.2009 J. Kurnitski © 2009
Ventilation rates for occupants (qp ) only (EN 15251)
EN 15251
• Category I (high): 10 l/s, pers• Category II (medium): 7 l/s, pers• Category III (basic): 4 l/s, pers.
• Category I (high): 10 l/s, pers• Category II (medium): 7 l/s, pers• Category III (basic): 4 l/s, pers.
Body odor (bio effluent) criteria for persons entering the room (in ASHRAE for persons staying in the room)
Body odor (bio effluent) criteria for persons entering the room (in ASHRAE for persons staying in the room)

TKK12.5.2009 J. Kurnitski © 2009
Ventilation rates (qB ) for the building emissions (EN 15251)
• An example of ventilation rates for offices depending on the pollution load in three categories (EN 15251)
Category Very low polluting building, l/s, m2
Low polluting building, l/s, m2
Non low-polluting building, l/s, m2
I (high) 0,5 1,0 2,0 II (medium) 0,35 0,7 1,4 III (basic) 0,3 0,4 0,8
Category Occupants only, l/s, m2
Low-polluting Building, l/s, m2
Non low-polluting Building, l/s, m2
I (high) 1.0 2.0 3.0 II (medium) 0.7 1.4 2.1 III (basic) 0.4 0.8 1.2

TKK12.5.2009 J. Kurnitski © 2009
Ventilation rates for residences (EN 15251)

TKK12.5.2009 J. Kurnitski © 2009
Ventilation rates for residences (EN 15251)

TKK12.5.2009 J. Kurnitski © 2009
Summary on ventilation rates
• Minimum ventilation rate 10–15 l/s per person, app. 1 l/s per m2 in office buildings with normal occupant density
• For better IAQ and productivity up to 2 l/s per m2 can be recommended for typical landscape and cellular offices
• This is supported by latest reviews by Seppänen and Fisk (2004) and Fisk and Seppänen (2007) that summarise the effect of ventilation in respect of health and productivity as follows:•
ventilation rates below 10 l/s per person are associated with a significantly higher prevalence of health or perceived air quality outcomes
•
increases in ventilation rates above 10 l/s per person, up to approximately 20 l/s per person, are associated with a significant decrease in the prevalence of SBS (sick building syndrome) symptoms or with improvements in perceived air quality and task performance and productivity.
•
relative to natural ventilation, air conditioning is often associated with a statistically significant increase in the prevalence of one or more SBS symptoms
•
For the residential buildings it is summarized that the ventilation rates below 0.5 ach (air change per hour) are a health risk in Nordic residential buildings (Wargocki et al. 2002 and Levin and Sundell 2007) concerning dwellings in a cold climate.

TKK12.5.2009 J. Kurnitski © 2009
Typical ventilation rates in the design
• l/s per person difficult to use in the design (occupant density is often not known)
• l/s per m2 values are common design specification
• Typical airflow rates:– 2 l/s per m2, 2.5 1/h in offices/commercial buildings– 3…4 l/s per m2, 3…4 1/h in classrooms– 0.35…0.5 l/s per m2, 0.5…0.7 1/h in homes
– If No of person known, 10 l/s per person (concert halls etc.)
– Still a lot of variation in national codes especially for homes

TKK12.5.2009 J. Kurnitski © 2009
Air distribution
• The airflow pattern in a ventilated room depends on the selection and location of supply air devices whereas extract air devices have only small effect on it
• This is due to high momentum (air jet) of supply air compared to almost zero velocity near the suction point of extract air
Air distribution to the occupied zone:• serve supply air • avoid stagnant air• avoid draft

TKK12.5.2009 J. Kurnitski © 2009
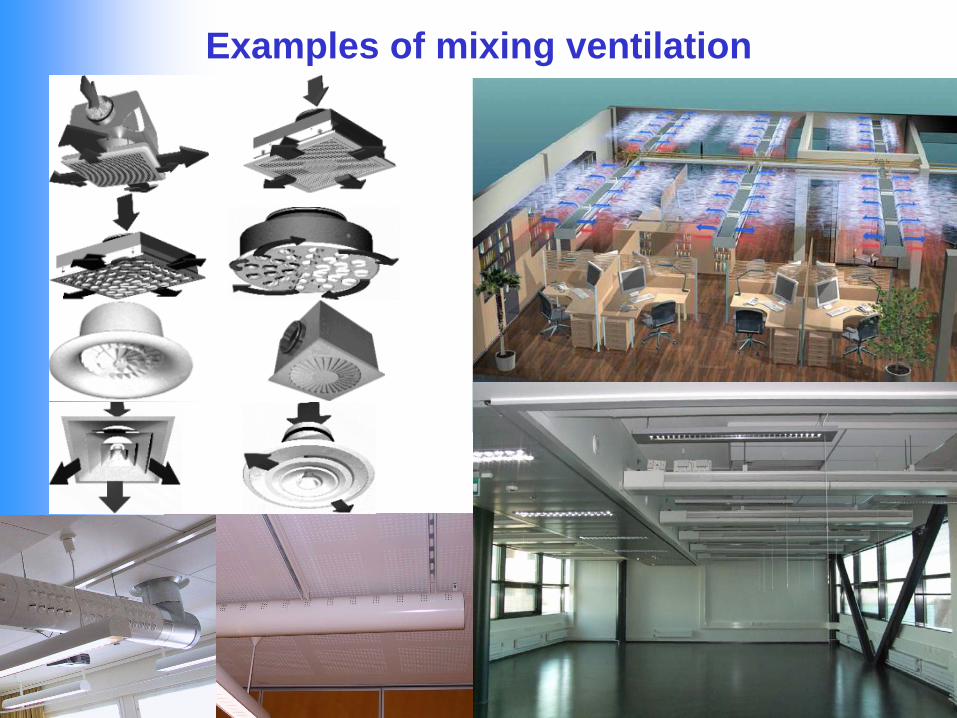
Mixing and displacement ventilation• There are two main types of airflow pattern:
– mixing (dilution) ventilation and– displacement ventilation.
Mixing flow pattern
Displacement flow pattern
• Mixing ventilation is used in rooms with normal height (most homes and offices) and it can be provided with supply air diffusers, fan-coils or chilled beams etc. Complete mixing ⇒ the pollutants concentration diluted with ventilation is equal in the whole room .
• Especially in high rooms such as concert halls, auditoriums etc it is more efficient to bring fresh supply air directly to breathing zone. In displacement ventilation a stratified flow is created using a few degrees lower supply air temperature than room temperature.
TKK12.5.2009 J. Kurnitski © 2009
Examples of mixing ventilation

TKK12.5.2009 J. Kurnitski © 2009Skistad et al. 2002, REHVA Guidebook no 1 on Displacement Ventilation
6 - 8 L/s=
10 L/s
Use high efficiency air distribution in rooms (applies mainly in high rooms)
Displacement air distribution Mixing air distribution

TKK12.5.2009 J. Kurnitski © 2009
Piston flow
• The opposite of the mixing flow pattern is the ideal piston flow in which the air flow is laminar and the room air is not mixed at all with the supply air
• This flow pattern with maximum possible ventilation effectiveness is used in special cases such as operating theatres and other super clean rooms
Laminar piston flow pattern

TKK12.5.2009 J. Kurnitski © 2009
Demand controlled ventilation
• CAV, VAV, AQCV• Air flows in the rooms can controlled according to the contaminant
loads or concentrations, term G in equation (1) • A room sensor can be one of the following: carbon dioxide, mixed-gas,
attendance, combined CO2 /mixed-gas, combined CO2 /temperature or combined CO2 /CO. At present mainly CO2 , temperature and attendance sensors are used for AQCV in normal spaces due to cost and unreliability of other types of sensors. CO-sensors are used in special cases such as large garages.
SENSOR • CO2 • ODOUR • VOC • PARTICLES
Ctrl
Ven
tila
tio
nra
te,q
v
CO -
concentration2
Min(~600 ppm)
Max(~1000 ppm)
Max
Min

TKK
The Finnish IAQ Classification System Sisäilmastoluokitus 2008
Building and constructions
HVAC systems Classification of Building materials
Classification of ventilation
components
Instructions for design and construction (P)
Requirements for building products (M)
Target values for indoor air quality and climate (S)

TKK
Aiming at high IAQ and TC
• The clients of building industry want better indoor environment that just a minimum requirements
• Significance of indoor climate for health, comfort and productivity has been well recognized
• The voluntary IAQ classification and labeling system is a tool for setting targets “above minimum”

TKK
Target values (S)
• Three categories– S1 “individual”– S2 “comfortable”– S3 “satisfactory”
• Specified from client’s and engineer’s viewpoints• For ventilation rates, similar approach to EN 15251

TKK
How it works?
IAQ and TC standard S1 or S2
HVAC-design values
Design specifications for moisture safety
Building site moisture control specifications
P1 ventilation cleanliness P1 construction cleanliness
M1 materials M1 ventilation products
End result complies with S1 or S2 targets after 6 months use
Design criteria
Construction criteria
Commissioning
Operation
Commissioning spec.

TKK
Tekniset tavoitearvot
• Kriteerit tavoitearvoille– terveyden ja viihtyisyyden kannalta merkittäviä– rakennusprosessin osapuolten hallittavissa– todennettavissa luotettavasti kohtuukustannuksin
• Sisäilmastoluokitus 2008:ssa:– operatiivinen lämpötila– ilman liikenopeus– hiilidioksidipitoisuus– radonpitoisuus– valaistussuureet (viittaus standardiin)– akustisen suunnittelun suureet (viittaus standardiin)

TKK
Osa tavoitearvoista on korvattu teknisillä vaatimuksilla
• TVOC, ammoniakki, formaldehydi, hajut käytettävä vähäpäästöisiämateriaaleja
• pienhiukaset käytettävä tuloilman suodatusta F8/F7 (vilkasliikenteisten katujen lähellä F9/F8)
• pöly ja lika rakennuksen ja ilmanvaihtokanavien pintojen puhtausvaatimukset
• mikrobit vaatimus veden- ja kosteudenhallinta-suunnitelmasta• tupakansavu sisätiloissa tupakointi kielletty

TKK
Ulkolämpötila (24 h keskiarvo) [ ]°C
Operatiivinen lämpötila oleskeluvyöhykkeellä [ ]3029282726252423222120191817
°C
-15 -10 -5 0 5 10 15 20 25
Enimmäisarvo
Vähimmäisarvo
top
S3 3029282726252423222120191817
Lämpötilan tavoitearvot

TKK
Ulkolämpötila (24 h keskiarvo) [ ]°C
Operatiivinen lämpötila oleskeluvyöhykkeellä [ ]3029282726252423222120191817
°C
-15 -10 -5 0 5 10 15 20 25
Enimmäisarvo
Vähimmäisarvo
top
Lämpötilan tulee pysyä alueella ± 1,0 .top °C 90 % käyttöajasta
S2 3029282726252423222120191817
Lämpötilan tavoitearvot

TKK
Ulkolämpötila (24 h keskiarvo) [ ]°C
3029282726252423222120191817
-15 -10 -5 0 5 10 15 20 25
Enimmäisarvo
Vähimmäisarvo
top
Operatiivisen lämpötilan on oltava tila-/ huoneisto-kohtaisesti aseteltavissa välillä ± 1,5 .top °C
Lämpöti lan tulee pysyä alueella ± 0,5 .top °C 95 % käyttöajasta
S1Operatiivinen lämpötila oleskeluvyöhykkeellä [ ]3029282726252423222120191817
°C
Lämpötilan tavoitearvot

TKK
Lämmitys- ja jäähdytysjärjestelmien suunnitteluarvoja
S1 S2 S3Jäähdytysjärjestelmän suunnitteluarvo °C 25 25 --Lämmitysjärjestelmän suunnitteluarvo °C 21,5 21,5 21,5Lämpötilan tilakohtainen säädettävyys, talvi °C 20…23 -- --Lämpötilan tilakohtainen säädettävyys, kesä°C 23…25 -- -Ilman nopeus, tilma =21 °C m/s <0,14 <0,17 <0,20Ilman nopeus, tilma =23 °C m/s <0,16 <0,20 <0,25Ilman nopeus, tilma =25 °C m/s <0,20 <0,25 <0,35Pystysuuntainen lämpötilaero (0,1/1,1 m) °C <2 <3 <4Lattian pintalämpötila, vähintään °C 19 19 17Lattian pintalämpötila, enintään (lattialämm.)°C 29 29 31Ilman suhteellinen kosteus, talvi % >25 -- --

TKK
Ilman laadun tavoitearvot
S1 S2 S3• CO2 -pitoisuus 750 900 1200• Radonpitoisuus 100 100 200
• Olosuhteiden pysyvyys, tsto 95 % 90 % --• Olosuhteiden pysyvyys, asunnot 90 % 80 % --
Võrdluseks: Energiatõhususe miinimumnõuded (määrus §10):

TKK
SI2008: Tavoitearvoja täydentävät vaatimukset S1- ja S2-luokissa
• M1-luokan materiaalien käyttö• P1-luokan rakennustyöt• P1-luokan ilmanvaihtojärjestelmä
– F8-luokan tuloilmansuodatus• Suunnitelmallinen kosteudenhallinta

TKK
Cleanliness criteria for ventilation components
• Oil concentration g/m2 of– ducts <0.05– terminal units and dampers <0.05– pressed components <0.3
• Mineral fibres (MMVF), f/cm3 <0.01
• Dust concentration, g/m2 <0.5
• Odour– acceptability of air quality passing
through the components >0.05

TKK
Cleanliness criteria for ductworks
P1P1P1
P2 P2 Not accepted
Brush cleaned

TKK
• Construction and installation works are critical regarding the cleanliness of the ventilation system

TKK

TKK
M1 labeled products
• Today there are over 1200 classified products by over 110 producers.
• The largest product groups: – Plaster, rendering, putties,
fillers, flooring, paints and varnishes, building boards and mineral wool.
• See www.rts.fi for complete listing

TKK
Experience from practice since 1995
• Over 1200 materials with M1-label -->reduces emissions by a factor of 10
• S1 targets have been met in building projects-->realistic• Category S2 well accepted as target level-->above minimum• Several new materials and products available -->helps product
development
0
100
200
300
400
500
600
700
800
900
1996 199719981999 20002001 20022003 2004 2005 2006 2007
1000

TKK
PVC Parquets
Adhesives Paints
All materials
M1
Non classif ied
447
385
1000
460
873
90 8245
44 660
100200300
400
500600
700
800
900
1000
TVOC SER [µg/m 2h]
n=9n=6
n=6
n=6
n=36n=20 n=58
n=495
n=5
n=35
n=102
VOC emissions from M1-classified and non-classified products
M1
(VTT Building and Transport)

TKK
Use of M1-products and control of moisture gives good IAQ
10401080
680
530 540
200
150
285
160
55
150120
60100
0
200
400
600
800
1000
1200
B108/107 B125/126 B303/304 3B/4B avo A619/B605 6B avo
TVO
C, μ
g/m
31.8.200126.9.200120.2.2003
S3
S2
S1
Helsinki Univ. of Tech / HVAC-lab.Measured results: Tuomainen et al. 2003, Saarela et al. 2004
TKK
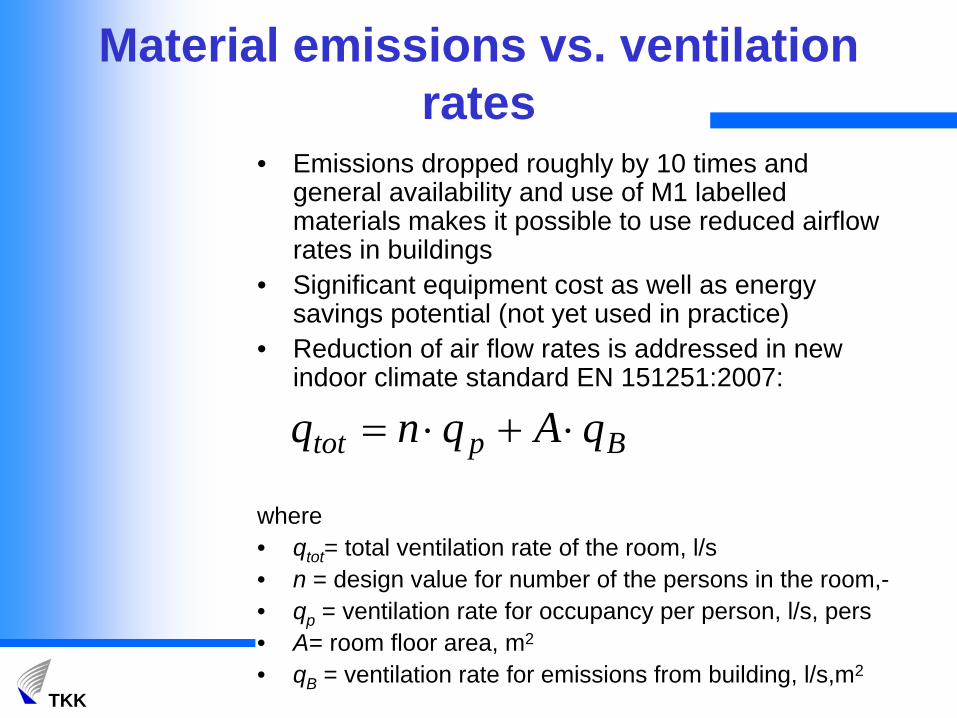
Material emissions vs. ventilation rates
• Emissions dropped roughly by 10 times and general availability and use of M1 labelled materials makes it possible to use reduced airflow rates in buildings
• Significant equipment cost as well as energy savings potential (not yet used in practice)
• Reduction of air flow rates is addressed in new indoor climate standard EN 151251:2007:
where• qtot = total ventilation rate of the room, l/s • n = design value for number of the persons in the room,-• qp = ventilation rate for occupancy per person, l/s, pers• A= room floor area, m2
• qB = ventilation rate for emissions from building, l/s,m2
Bptot qAqnq ⋅+⋅=
TKK
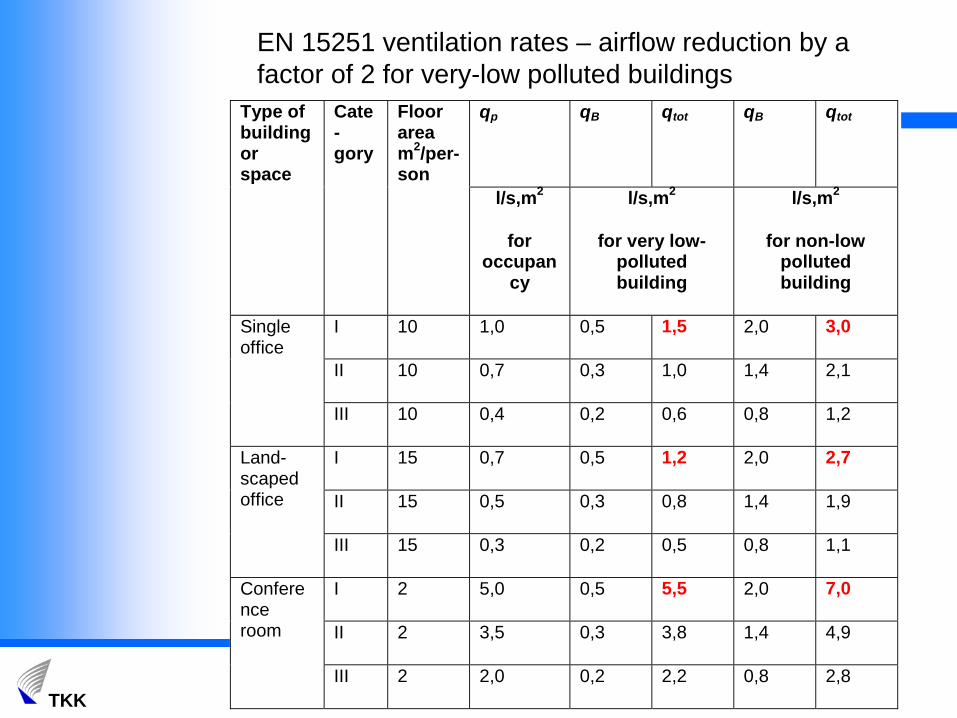
EN 15251 ventilation rates – airflow reduction by a factor of 2 for very-low polluted buildings
qp
qB
qtot
qB
qtot
Type of building or space
Cate-gory
Floor area m2/per-son
l/s,m2
for occupan
cy
l/s,m2
for very low-polluted building
l/s,m2
for non-low polluted building
I 10 1,0 0,5 1,5 2,0 3,0
II 10 0,7 0,3 1,0 1,4 2,1
Single office
III 10 0,4 0,2 0,6 0,8 1,2
I 15 0,7 0,5 1,2 2,0 2,7
II 15 0,5 0,3 0,8 1,4 1,9
Land-scaped office
III 15 0,3 0,2 0,5 0,8 1,1
I 2 5,0 0,5 5,5 2,0 7,0
II 2 3,5 0,3 3,8 1,4 4,9
Conference room
III 2 2,0 0,2 2,2 0,8 2,8

TKK
Ilmanvaihdon mitoitus
• Ulkoilmavirrat standardin EN-15251:2007 mukaisesti. • Noudatettaessa Sisäilmastoluokituksen ohjeita voidaan rakennuksissa,
joissa tupakointi on kielletty, käyttää ulkoilmavirtojen mitoituksessa erittäin vähäpäästöisen rakennuksen mitoitusarvoja– S1-luokka: 0,5 l/s,lattia-m2 + 10 l/s, henkilö– S2-luokka: 0,5 l/s,lattia-m2 + 7 l/s, henkilö
• Huonelämpötilan hallinta tai varautuminen muunto-joustoon saattaa edellyttää suurempia ilmavirtoja.
• Erityisistä epäpuhtauslähteistä johtuvien päästöjen aiheuttama ilmanvaihdon tarve on otettava tapauskohtaisesti huomioon.
• Ilmavirtoja on voitava säätää tilojen käytön muuttuessa.• Normaalin käyttöajan ulkopuolella on rakennuksessa oltava
perusilmanvaihto 0,1…0,2 l/s,m2

TKK
Esimerkkejä tilakohtaisista ilmavirroista
Tila Lattia-ala m2/hlö
S1-luokka S2-luokka S3-luokka / D2
dm3/s per henkilö
dm3/s per neliö
dm3/s per henkilö
dm3/s per neliö
dm3/s per
henkilödm3/s
per neliöToimitila, normaali tilatehokkuus 12 16 1,5 13 1,5 1,5Toimitila, suuri tilatehokkuus 8 14 2,0 11 1,5 1,5Neuvotteluhuone 3 12 4,0 9 4,0 8 4,0Taukotila, kahvio 1,5 11 7,0 8 5,0 5,0Hotellihuone 10 15 1,5 12 1,0 10 1,0Käytävä ja porrashuone 1 0,5 0,5Hissikuilu 8 8 8
Luokkahuone 2 11 5,5 8 4,0 6 3,0Luentosali 1 11 10,5 8 7,5 6 6,0Käytävä, aula koulussa 2 11 5,5 8 4,0 4,0Aula 6 13 2,0 10 2,0 2,0Päiväkoti 3 12 4,0 9 2,5 6 2,5Päiväkodin märkäeteinen (poisto) 5 5 5
TKK
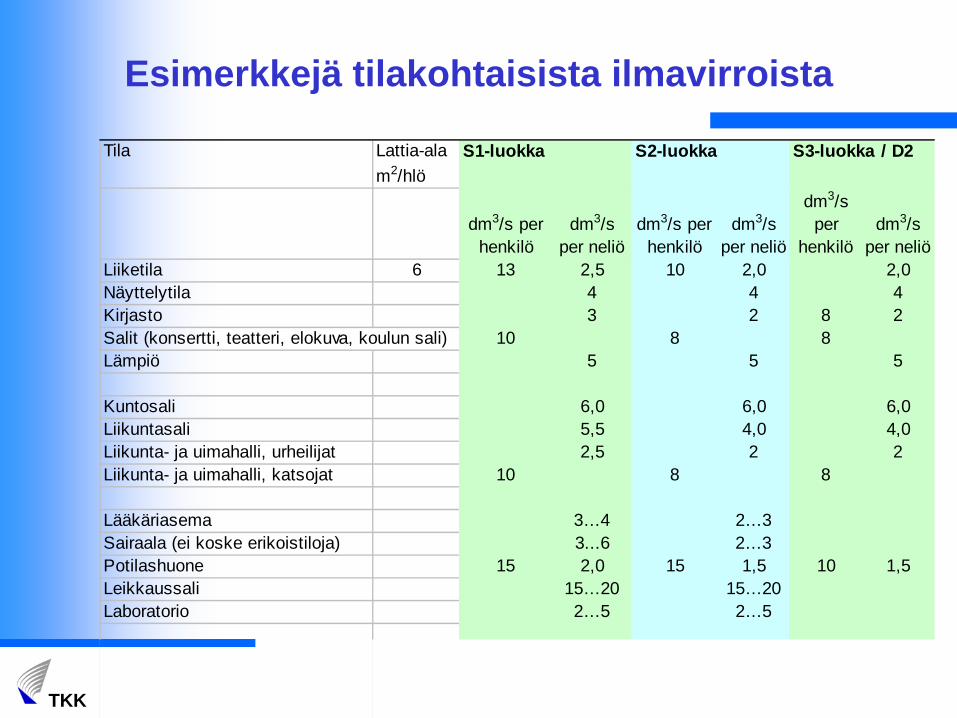
Esimerkkejä tilakohtaisista ilmavirroista
Tila Lattia-ala m2/hlö
S1-luokka S2-luokka S3-luokka / D2
dm3/s per henkilö
dm3/s per neliö
dm3/s per henkilö
dm3/s per neliö
dm3/s per
henkilödm3/s
per neliöLiiketila 6 13 2,5 10 2,0 2,0Näyttelytila 4 4 4Kirjasto 3 2 8 2Salit (konsertti, teatteri, elokuva, koulun sali) 10 8 8Lämpiö 5 5 5
Kuntosali 6,0 6,0 6,0Liikuntasali 5,5 4,0 4,0Liikunta- ja uimahalli, urheilijat 2,5 2 2Liikunta- ja uimahalli, katsojat 10 8 8
Lääkäriasema 3…4 2…3Sairaala (ei koske erikoistiloja) 3...6 2…3Potilashuone 15 2,0 15 1,5 10 1,5Leikkaussali 15…20 15…20Laboratorio 2…5 2…5

TKK
Basic question of IEQ: how to manage temperature and air distribution in classrooms with highly varying loads?
South classroom: 30 students + solar radiation = cooling need
North classroom, 15 students: heating need
No air conditioning, cost efficient ventilation system: • Constant ventilation or demand controlled ventilation • Supply air temperature compensation (cooling with outdoor air)
The same system should serve all classrooms

TKK
Temperature compensation + flow control
• Supply air temperature and air flow rate control for cooling (with outdoor air + night ventilative cooling) – T and CO2 controlled ventilation (DCV)
Air-handling unit
Radiator andthermostatic valve
District heating supply
District heating return
District heating substation
Ven
tila
tio
nra
te,q
v
CO -
concentration2
Min(~600 ppm)
Max(~1000 ppm)
Max
Min
TS 22
23 TE19
16

TKK
Room temperature and CO2 performance (Kurnitski et al. 2008)
• Sample of schools:– 6 schools 1910-1960– 10 schools 1960-1970– 10 schools 1970-1980– 28 schools 1980-2000– 6 schools 2000-
• Room temperature data during one week in May (21-25.5.2007, mean outdoor temperature 13°C) from 63 classrooms. Data from the school time, from 8:00 to 14:00 on week-days.
18
20
22
24
26
28
0 0,2 0,4 0,6 0,8 1
Cumulative frequency, -
Roo
m te
mpe
ratu
re, °
C

TKK
Temperature in August (warm period) 14-30.8.2007, just after summer holidays
20
22
24
26
28
0 0,2 0,4 0,6 0,8 1
Cumulative frequency, -
Indo
or te
mpe
ratu
re, °
C
y = 0,39x + 18,92R2 = 0,84
20
22
24
26
28
30
6 10 14 18 22 26Outdoor temperature, °C
Indo
or te
mpe
ratu
re, °
C
y = 0,23x + 20,96R2 = 0,79
20
22
24
26
28
30
6 10 14 18 22 26Outdoor temperature, °C
Indo
or te
mpe
ratu
re, °
C

TKK
Temperature simulations
• 2 or 6 classroom simulations with part load vs. full load occupancy• Determining air flow rate and the control curve needed for the temperature
control (no cooling!)• CAV vs. DCV and heating season vs. summer performance
30 students South
20 studentsSouth
20 students South
20 studentsNorth
20 students North
30 students North
0
5
10
15
20
25
30
35
6:00
6:45
7:30
8:15
9:00
9:45
10:30
11:15
12:00
12:45
13:30
14:15
15:00
15:45
16:30
17:15
18:00
Time, hh:mm
No
of p
erso
ns
30 students/South20 students/North

TKK
Results, summer
• Two ventilation rates, 6 L/s per person, 180 L/s per classroom in total or 10 L/s per person, 300 L/s per classroom in total.
• For both rates CAV system and DCV system with CO2 and temperature control was simulated. DCV system had two air flow steps, 100 % and 40% of total airflow.
South classroom in the summer
1819202122232425262728293031
0 50 100 150 200 250 300 350Time, h
Roo
m te
mpe
ratu
re, °
C
CAV 180l/sDCV 180l/s, 40% / 100% CAV 300l/sDCV 300l/s, 40% / 100%
North classroom in the summer
1819202122232425262728293031
0 50 100 150 200 250 300 350Time, h
Roo
m te
mpe
ratu
re, °
C
CAV 180l/sDCV 180l/s, 40% / 100%
CAV 300l/sDCV 300l/s, 40% / 100%
DCV 300 l/s with night ventilative cooling <100 °Ch above 25 °C
TKK
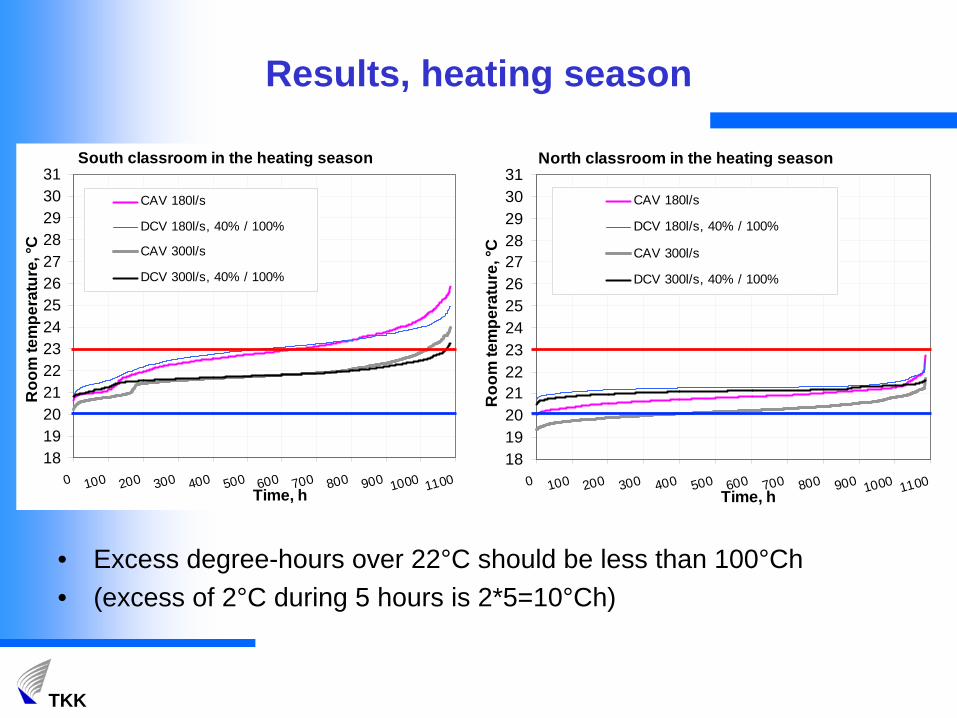
Results, heating season
• Excess degree-hours over 22°C should be less than 100°Ch• (excess of 2°C during 5 hours is 2*5=10°Ch)
South classroom in the heating season
1819202122232425262728293031
0 100 200 300 400 500 600 700 800 900 1000 1100Time, h
Roo
m te
mpe
ratu
re, °
C
CAV 180l/s
DCV 180l/s, 40% / 100%
CAV 300l/s
DCV 300l/s, 40% / 100%
North classroom in the heating season
1819202122232425262728293031
0 100 200 300 400 500 600 700 800 900 1000 1100Time, h
Roo
m te
mpe
ratu
re, °
C
CAV 180l/s
DCV 180l/s, 40% / 100%
CAV 300l/s
DCV 300l/s, 40% / 100%

TKK
Which system works in all conditions?
Sum of degree hours in weekdays at 08:00-15:00, °Ch Heating season Summer periodVentilation system and classroom orientation Over 22°C Below 20°C Over 25°C Below 22°C
Criterion, °Ch 100 0 100 100CAVSouth classroom 300 L/s 181 0 200 118South classroom 300 L/s, with solar protection glasses 92 0 116 47North classroom 300 L/s, with low occupancy 0 56 11 212CAV + heating coil in supply duct for each classroomSouth classroom 300 L/s, with solar protection glasses 96 0 114 70North classroom 300 L/s, with low occupancy 0 0 11 106DCV 40-100%South classroom 120-300 L/s, with solar protection glasses 99 0 162 15North classroom 120-300 L/s, with low occupancy 0 0 7 105DCV 40-100% + night ventilative coolingSouth classroom 120-300 L/s, with solar protection glasses 99 0 83 31North classroom 120-300 L/s, with low occupancy 0 0 4 114

TKK
Temperature controlEffective temperature control was possible by:
1. Supply air temperature going down to 14-15 °C with free cooling 2. Demand controlled ventilation (T and CO2 control to avoid excessive
cooling in North facade classrooms at part load)3. Ventilation rate of 10 L/s per person (5 L/s per m2)
Supply air temperaturecontrol curve
13
14
15
16
17
18
19
17 18 19 20 21 22 23 24
Exhaust air temperature °C
Supp
ly a
ir te
mpe
ratu
re °C
Supply air to classrooms in theheating seasonSupply air to classrooms in thesummer
TKK
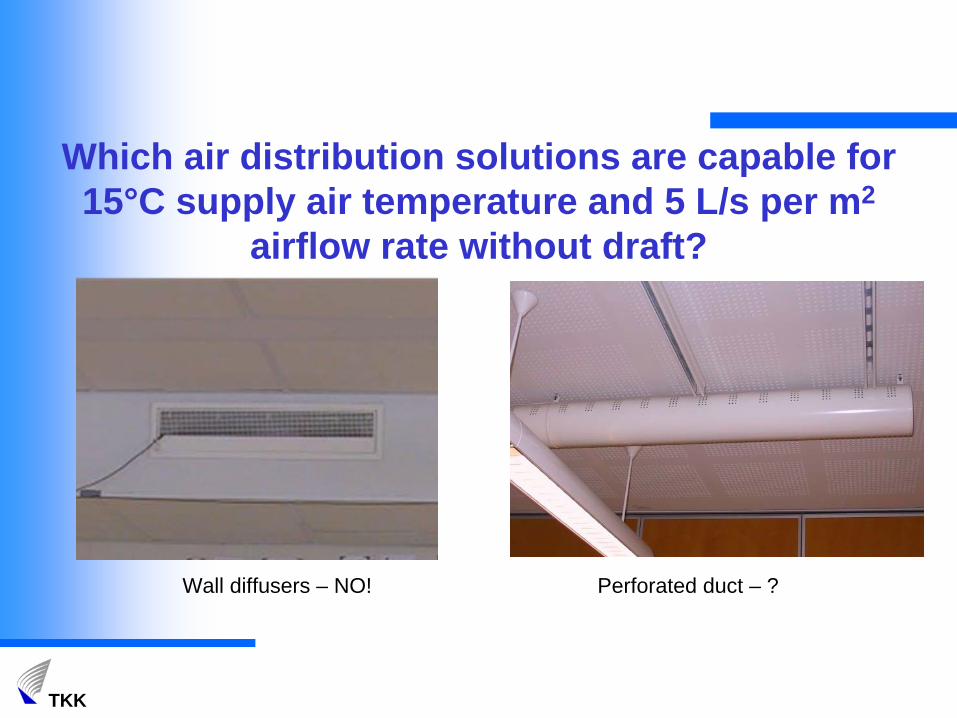
Which air distribution solutions are capable for 15°C supply air temperature and 5 L/s per m2
airflow rate without draft?
Wall diffusers – NO! Perforated duct – ?

TKK
Duct diffusers – YES Ceiling diffusers – YES
E F
Duct diffusers – YES Displacement diffusers – ?

TKK
Toimistoesimerkki (KesEn tutkimushanke TKK)
2.12.20 09
TKK
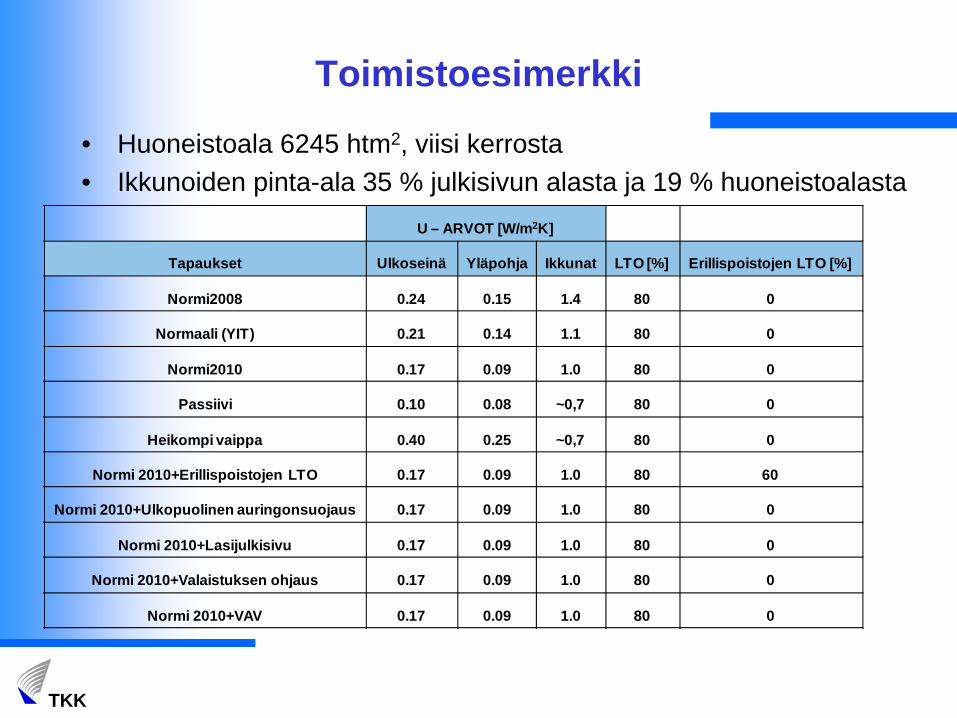
Toimistoesimerkki
• Huoneistoala 6245 htm2, viisi kerrosta • Ikkunoiden pinta-ala 35 % julkisivun alasta ja 19 % huoneistoalasta
U – ARVOT [W/m2K]
Tapaukset Ulkoseinä Yläpohja Ikkunat LTO [%] Erillispoistojen LTO [%]
Normi2008 0.24 0.15 1.4 80 0
Normaali (YIT) 0.21 0.14 1.1 80 0
Normi2010 0.17 0.09 1.0 80 0
Passiivi 0.10 0.08 ~0,7 80 0
Heikompi vaippa 0.40 0.25 ~0,7 80 0
Normi 2010+Erillispoistojen LTO 0.17 0.09 1.0 80 60
Normi 2010+Ulkopuolinen auringonsuojaus 0.17 0.09 1.0 80 0
Normi 2010+Lasijulkisivu 0.17 0.09 1.0 80 0
Normi 2010+Valaistuksen ohjaus 0.17 0.09 1.0 80 0
Normi 2010+VAV 0.17 0.09 1.0 80 0

TKK
Energiankulutuksen laskenta: IDA-ICE- malli
• 9 laskentavyöhykettä• Säädata: Helsinki 2001• Lämmitys 21 ° C ja jäähdytys 25 °C• IV: 2,0 dm3/s/m2 paitsi neuvotteluhuoneet
0,5-4,0 dm3/s/m2
• IV:n käyntiaika Ma-Pe klo 6-18• Valaistus 12 W/m2
• Laitteet 150 W/hlö (tietokone)• 1 hlö/huone, avotoimistot 0.1 hlö/m2
• Läsnäoloprofiilit 7-18
4. krs
3. krs

TKK
Eri laskentavaihtoehtojen ostoenergiatkWh/htm2/a
Normi 2010
Normi2008
Normaali (YIT) Passiivi
Heikompi vaippa
Erillisp. LTO
Ulkop. auringons.
Lasi-julkisivu
Valaist. ohj. VAV
Tilojen lämmitys 25 37 30 18 34 16 26 35 27 24Tuloilman lämmitys 10 11 11 10 11 10 11 11 11 2
Tilojen jäähdytys 17 16 16 15 12 17 15 30 10 31Tuloilman jäähdytys 8 8 8 8 8 9 8 8 8 4
LKV 6 6 6 6 6 6 6 6 6 6Puhaltimet 15 15 15 15 15 17 15 15 15 6
Pumput 0 0 0 0 0 0 0 0 0 0Valaistus 30 30 30 30 30 30 30 30 17 30Laitteet 24 24 24 24 24 24 24 24 24 24
Lämmitys 42 54 47 34 51 32 42 51 44 31Jäähdytys (COP=1) 25 25 24 23 20 26 23 39 19 34
Sähkö 69 69 69 69 69 71 69 69 57 60TOT 136 147 139 126 140 128 134 159 119 126
kWh/htm2/aNormi 2010
Normi2008
Normaali (YIT) Passiivi
Heikompi vaippa
Erillisp. LTO
Ulkop. auringons.
Lasi-julkisivu
Valaist. ohj. VAV
Lämmitys 0.7 29 38 33 24 36 22 30 36 31 22Jäähdytys (kauko) 0.4 10 10 10 9 8 10 9 16 8 14
Sähkö 2.0 138 138 138 138 138 141 138 138 113 120TOT 177 185 180 171 182 174 176 189 151 156

TKK
Lisäinvestointien kannattavuus – Sähkön hinnanmuutossähkön hinta 0.10 €/kWh ja kaukolämmön hinta 0,055 €/kWh:
sähkön hinta 0.15 €/kWh ja kaukolämmön hinta 0,055 €/kWh:
sähkön hinta 0.20 €/kWh ja kaukolämmön hinta 0,055 €/kWh:
Normi Normaali Heikompi Normi Erillisp. Ulkop. Lasi‐ Valaist.2008 (YIT) Vaippa 2010 Passiivi LTO Auringons. julkisivu ohjaus VAV
Lisäinvestoiniti ‐ € ‐123000 ‐75400 ‐58000 0 143000 19000 29884 802700 31380 197400Kustannuslisä ‐ % ‐1 % ‐0,7 % ‐0,5 % 0,0 % 1,3 % 0,2 % 0,3 % 7,1 % 0,3 % 1,7 %Ostoenergia ‐ kWh 827315 781915 799876 752197 702235 703514 751223 848637 673920 655739Ostoenergia €/a 67622 65036 65610 63552 60598 61453 63237 70393 55073 65574Säästöä suhteessa normitaloon €/a ‐4070 ‐1485 ‐2059 0 2953 2098 315 ‐6841 8479 6766Maksuaika 3% korolla (vuotta) ‐ yli 40 11 yli 40 ei ikinä 4 yli 40Aika kunnes epäkannattava 3% korolla (vuotta) Alle 90 Alle 500 Alle 70 ‐
Normi Normaali Heikompi Normi Erillisp. Ulkop. Lasi‐ Valaist.2008 (YIT) Vaippa 2010 Passiivi LTO Auringons. julkisivu ohjaus VAV
Lisäinvestoiniti ‐ € ‐123000 ‐75400 ‐58000 0 143000 19000 29884 802700 31380 197400Kustannuslisä ‐ % ‐1 % ‐0,7 % ‐0,5 % 0,0 % 1,3 % 0,2 % 0,3 % 7,1 % 0,3 % 2 %Ostoenergia ‐ kWh 827315 781915 799876 752197 702235 703514 751223 848637 673920 655739Ostoenergia €/a 92199 89515 89630 88197 85016 86742 87591 96745 75081 79808Säästöä suhteessa normitaloon €/a ‐4002 ‐1318 ‐1433 0 3181 1455 606 ‐8548 13116 8389Maksuaika 3% korolla ‐ yli 40 17 yli 40 ei ikinä 3 40Aika kunnes epäkannattava 3% korolla (vuotta) Alle 90 Alle 500 Alle 500 ‐
Normi Normaali Heikompi Normi Erillisp. Ulkop. Lasi‐ Valaist.2008 (YIT) Vaippa 2010 Passiivi LTO Auringons. julkisivu ohjaus VAV
Lisäinvestoiniti ‐ € ‐123000 ‐75400 ‐58000 0 143000 19000 29884 802700 31380 197400Kustannuslisä ‐ % ‐1 % ‐0,7 % ‐0,5 % 0,0 % 1,3 % 0,2 % 0,3 % 7,1 % 0,3 % 2 %Ostoenergia ‐ kWh 827315 781915 799876 752197 702235 703514 751223 848637 673920 655739Ostoenergia €/a 116776 113994 113649 112842 109433 112031 111946 123098 95088 102830Säästöä suhteessa normitaloon €/a ‐3934 ‐1152 ‐807 0 3409 811 896 ‐10256 17754 10012Maksuaika 3% korolla ‐ yli 40 40 yli 40 ei ikinä 2 31Aika kunnes epäkannattava 3% korolla (vuotta) Alle 100 Alle 500 Alle 500 ‐

TKK
Lisäinvestointien kannattavuus - Sähkön ja kaukolämmön hinnanmuutos
sähkön hinta 0.15 €/kWh ja kaukolämmön hinta 0,085 €/kWh:
sähkön hinta 0.20 €/kWh ja kaukolämmön hinta 0,11 €/kWh:
Normi Normaali Heikompi Normi Erillisp. Ulkop. Lasi‐ Valaist.2008 (YIT) Vaippa 2010 Passiivi LTO Auringons. julkisivu ohjaus VAV
Lisäinvestoiniti ‐ € ‐123000 ‐75400 ‐58000 0 143000 19000 29884 802700 31380 197400Kustannuslisä ‐ % ‐1 % ‐0,7 % ‐0,5 % 0,0 % 1,3 % 0,2 % 0,3 % 7,1 % 0,3 % 2 %Ostoenergia ‐ kWh 827315 781915 799876 752197 702235 703514 751223 848637 673920 655739Ostoenergia €/a 102272 98285 99214 95976 91432 92674 95515 106393 83293 85667Säästöä suhteessa normitaloon €/a ‐6297 ‐2310 ‐3239 0 4543 3301 460 ‐10417 12682 10309Maksuaika 3% korolla ‐ yli 40 7 yli 40 ei ikinä 3 29Aika kunnes epäkannattava 3% korolla (vuotta) 30 alle 150 27 ‐
Normi Normaali Heikompi Normi Erillisp. Ulkop. Lasi‐ Valaist.2008 (YIT) Vaippa 2010 Passiivi LTO Auringons. julkisivu ohjaus VAV
Lisäinvestoiniti ‐ € ‐123000 ‐75400 ‐58000 0 143000 19000 29884 802700 31380Kustannuslisä ‐ % ‐1 % ‐0,7 % ‐0,5 % 0,0 % 1,3 % 0,2 % 0,3 % 7,1 % 0,3 % 2 %Ostoenergia ‐ kWh 827315 781915 799876 752197 702235 703514 751223 848637 673920 655739Ostoenergia €/a 135244 130072 131221 127103 121197 122907 126473 140785 110145 113571Säästöä suhteessa normitaloon €/a ‐8140 ‐2969 ‐4118 0 5906 4197 630 ‐13682 16958 13532Maksuaika 3% korolla ‐ yli 40 5 yli 40 ei ikinä 2 20Aika kunnes epäkannattava 3% korolla (vuotta) 21 48 19 ‐

TKK
Toimistoesimerkin yhteenveto (KesEn tutkimushanke TKK)
• Vaipan lisälämmöneristäminen ei taloudellisesti kannattavaa. Ei sen takia, että rakentamiskustannukset olisivat niin suuria, mutta energiansäästö hyvin vähäinen. (Siis pientalotason lämmöneristys ei ole järkevä toimistorakennuksessa.)
• Tarpeenmukainen iv (VAV) ei vielä taloudellisesti kannattavaa • Erillispoistojen LTO kannattava jo nyt• Valaistuksen ohjaus kannattava jo nyt• Tulokset eivät ole herkkiä energian hinnan muutokselle


![Technote 21 Demand Controlled Kitchen Ventilation (DCKV) · Demand Controlled Kitchen Ventilation (DCKV) [CASE STUDY] Table 2. Fort Lee Bldg. 18208 Fan Motor Electrical Power Savings.](https://static.fdocuments.in/doc/165x107/6010f848504d2c55ac02cb38/technote-21-demand-controlled-kitchen-ventilation-dckv-demand-controlled-kitchen.jpg)


![Dual controlled modes of mechanical ventilation [onarılmış]](https://static.fdocuments.in/doc/165x107/5871a5ac1a28abda6a8b471f/dual-controlled-modes-of-mechanical-ventilation-onarilmis.jpg)