
Ventilation, Heat, Moisture and Gas Flow Modeling with MULTIFLUX Presenters: George Danko, Professor...
57
Ventilation, Heat, Moisture and Gas Flow Modeling with MULTIFLUX Presenters: George Danko, Professor Pedram Rostami, PhD Graduate Research Assistant Jon Fox, PhD Graduate Research Assistant Contributors: Davood Bahrami, Assistant Research Professor Ray Grymko, MS student William Asante, MS student Date: June 21 st , 2012 Location: Salt Lake City, UT
-
Upload
domenic-wilson -
Category
Documents
-
view
215 -
download
0
Transcript of Ventilation, Heat, Moisture and Gas Flow Modeling with MULTIFLUX Presenters: George Danko, Professor...

Ventilation, Heat, Moisture and Gas Flow Modeling with MULTIFLUX
Presenters:George Danko, ProfessorPedram Rostami, PhD Graduate Research AssistantJon Fox, PhD Graduate Research Assistant
Contributors:Davood Bahrami, Assistant Research ProfessorRay Grymko, MS studentWilliam Asante, MS student
Date: June 21st, 2012
Location: Salt Lake City, UT

2
Progress Summary1) Task 1.2. User interface design for MULTIFLUX (Task 1.2c. )
• Progress: Continued the Graphical User Interface (GUI) development• Plan for next quarter: Continue the user interface implementation
2) Task 1.4. Gas liberation/storage/application model-element (Task 1.4c. )• Progress: Studied and conceptually designed the gas contaminant adsorption
model-elements in MULTIFLUX.• Plan for next quarter: Continue the study, apply it in numerical examples;
design experimental comparison with data from mines.3) Task 2.1 Development-end Ventilation application(Task 2.1c. )
• Progress: Further studied characterization of the development-end module and presented the results to SME Annual Meeting. Also studied the effect of local cooling at Banshee drift at Barrick’s GoldStrike mine as an industrial application.
• Plan for next quarter: Continue with testing of the development-end template with the GUI.
4) Task 2.2 Ventilation with combined compressed air power application(Task 2.2a. )
• Progress: This task is complete• Plan for next quarter: No activity is planned
3
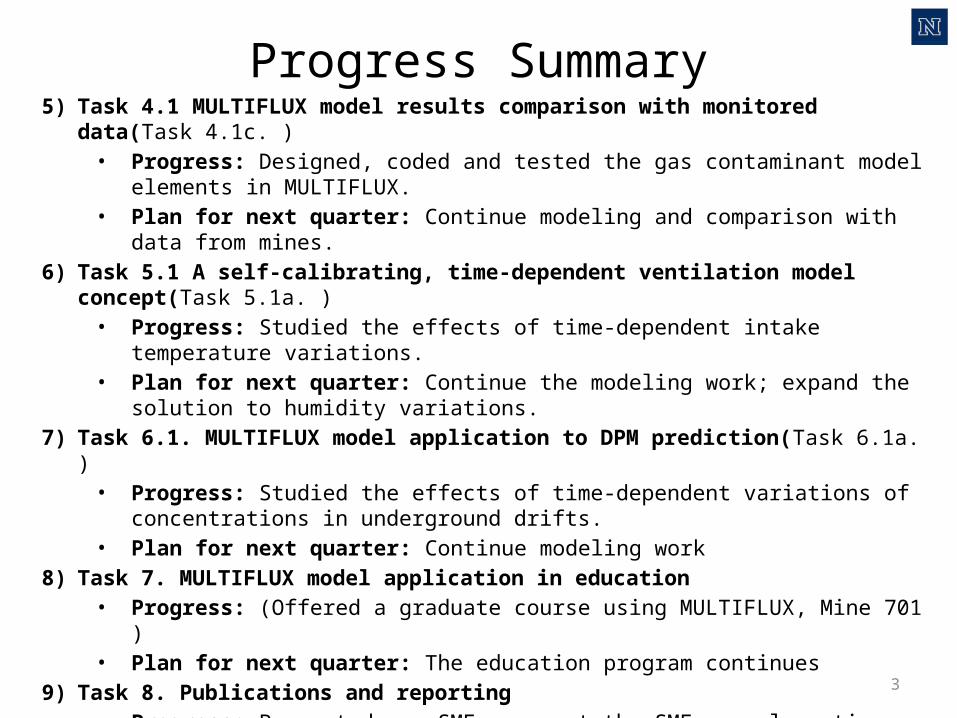
Progress Summary5) Task 4.1 MULTIFLUX model results comparison with monitored data(Task 4.1c. )
• Progress: Designed, coded and tested the gas contaminant model elements in MULTIFLUX.• Plan for next quarter: Continue modeling and comparison with data from mines.
6) Task 5.1 A self-calibrating, time-dependent ventilation model concept(Task 5.1a. )• Progress: Studied the effects of time-dependent intake temperature variations.• Plan for next quarter: Continue the modeling work; expand the solution to humidity
variations.7) Task 6.1. MULTIFLUX model application to DPM prediction(Task 6.1a. )
• Progress: Studied the effects of time-dependent variations of concentrations in underground drifts.
• Plan for next quarter: Continue modeling work8) Task 7. MULTIFLUX model application in education
• Progress: (Offered a graduate course using MULTIFLUX, Mine 701 )• Plan for next quarter: The education program continues
9) Task 8. Publications and reporting• Progress: Presented one SME paper at the SME annual meeting. Submitted the 2nd progress
report in Phase 3. Worked on completing and submitting four papers to the 14th North American Mine Ventilation Symposium (NAMVS) in Utah.
• Plan for next quarter: Continue with publications and reporting

4
Mackay Team Overview• Industry contributions and publications
• Goals, research approach & findings this year Equivalent and hydraulic diameters
Transient temperature variations
Contaminant spread and transient, modeling approach
Complex Ventilation and Contaminant Simulation with
MULTIFLUX
VOD simulation with MULTIFLUX
MULTIFLUX GUI development
Side-by-side comparison of MULTIFLUX
Development end MULTIFLUX sub-model template

5
Project Participants• PI George Danko, PhD, University of Nevada, Reno
1664 N. Virginia St., Mailstop 173, Reno, NV 89557
Phone: (775)784-4284; Fax: (775)784-1833; E-Mail: [email protected]• Co-PI Davood Bahrami, Ph.D., University of Nevada, Reno
1664 N. Virginia St., Mailstop 173, Reno, NV 89557
Phone: (775)784-4210; Fax: (775)784-1833; E-Mail: [email protected]• Co-PI Pierre Mousset-Jones, Ph.D., University of Nevada, Reno
1664 N. Virginia St., Mailstop 173, Reno, NV 89557
Phone: (775)784-6959; Fax: (775)784-1833; E-Mail: [email protected]• GRA Pedram Rostami, PhD student
1664 N. Virginia St., Mailstop 173, Reno, NV 89557
Phone: (775)784-4209; Fax: (775)784-1833; E-Mail: [email protected]• GRA Jon Fox, PhD student
1664 N. Virginia St., Mailstop 173, Reno, NV 89557
Phone: (775)784-4185; Fax: (775)784-1833; E-Mail: [email protected]• GRA Raymond Grymko, MS student
1664 N. Virginia St., Mailstop 173, Reno, NV 89557
Phone: (775)784-4209; Fax: (775)784-1833; E-Mail: [email protected]• GRA Rajeev Gunda, MS student
1664 N. Virginia St., Mailstop 173, Reno, NV 89557
Phone: (775)784-4209; Fax: (775)784-1833; E-Mail: [email protected]
• GRA William Asante, MS student
1664 N. Virginia St., Mailstop 173, Reno, NV 89557
Phone: (775)784-4210; Fax: (775)784-1833; E-Mail: [email protected]
• Industrial Partner Barrick Goldstrike Mining Co.

6
Industry Professional Contributions
• Rajeev Gunda (MS Mining, August ’11) – Employed at AMEC, Phoenix, AZ – Ventilation Engineer, starting November 2011.
• Raymond Grymko (MS Mining, August ’12) – Employed at Vale Inco, Sudbury, Ontario, Canada – Ventilation Engineer, starting June 2012.

7
Publications1) Bahrami D., Danko G., Fox J., Robertson K., 2012 “Development-End Cooling
Study.” 14th US/North American Mine Ventilation Symposium, Salt Lake City, Utah.
2) Danko G., and Bahrami D., 2012. “Convective, Diffusive and Dispersive Transport of Gaseous Constituencies by Ventilation.” 14th US/North American Mine Ventilation Symposium, Salt Lake City, Utah.
3) Danko G., Bahrami D., and Mousset-Jones P., 2011 “Ventilation and climate simulation with the MULTIFLUX code.” The 2nd International Conference on mining, Mine Safety and Mine Environment Protection, Xi'an, Shaanxi, China.
4) Danko G., and Bahrami D., 2011 “Ventilation, Heat, Moisture and Gas Flow Modeling with MULTIFLUX.” Third Outreach Seminar, Barrick Goldstrike Mine, Nevada.
5) Danko G., and Bahrami D., Asante W. K., Rostami P., and Grymko R., 2012 “Temperature variations in underground tunnels.” 14th US/North American Mine Ventilation Symposium, Salt Lake City, Utah.
6) Fox J., Danko G., and Bahrami D., 2012 “Development End Characterization Through Response Curves.” SME Annual Meeting, Seattle, Washington.
8
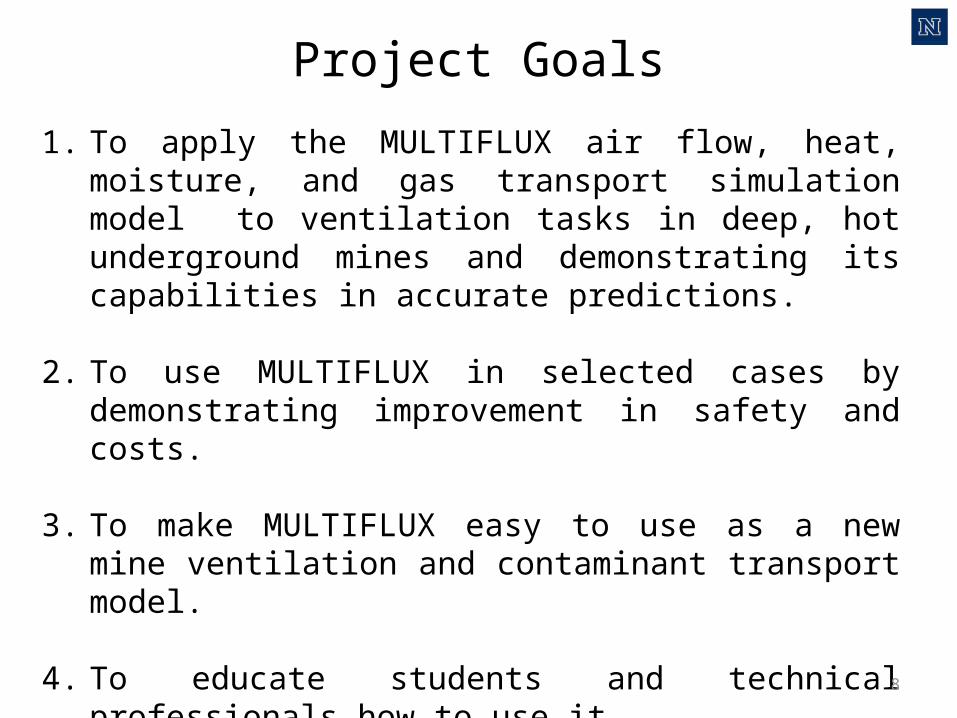
1. To apply the MULTIFLUX air flow, heat, moisture, and gas transport simulation model to ventilation tasks in deep, hot underground mines and demonstrating its capabilities in accurate predictions.
2. To use MULTIFLUX in selected cases by demonstrating improvement in safety and costs.
3. To make MULTIFLUX easy to use as a new mine ventilation and contaminant transport model.
4. To educate students and technical professionals how to use it.
Project Goals
9
Description of the research approach
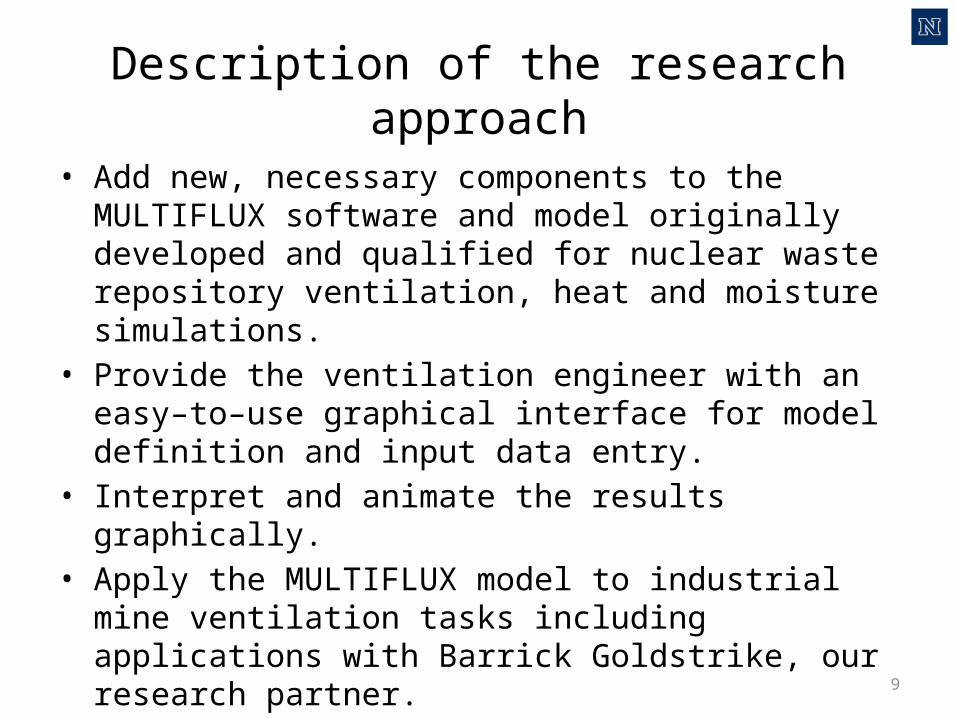
• Add new, necessary components to the MULTIFLUX software and model originally developed and qualified for nuclear waste repository ventilation, heat and moisture simulations.
• Provide the ventilation engineer with an easy–to–use graphical interface for model definition and input data entry.
• Interpret and animate the results graphically.• Apply the MULTIFLUX model to industrial mine
ventilation tasks including applications with Barrick Goldstrike, our research partner.
• Work with a total of six students as research assistants.

10
Project Findings1) MULTIFLUX is used in predicting the performance of a spot cooler at the Barrick
GoldStrike mine. An advanced modeling approach was used to predict the cooling effect of an air chiller if it is installed outby from the working face. The net results show that the spot cooler with 11oC of chilling capacity is cooling the air at the working face by about 6oC.
2) An artificial numerical dispersion error in the simulation results and systematic solution error in the travel time of concentration front , both depending on the discretization scheme and the refinement of the grid were found. But a solution used in MULTIFLUX can be made free of both errors even if relatively large grid sizes are used.
3) The test cases and benchmarking applications reviewed show that MULTIFLUX captures the relevant heat and moisture transport processes excellently than methods which use the simple Gibson age function.
4) MULTIFLUX outperforms Ventsim, which provides only an approximate, but not an exact solution for the transient model. Therefore, we believe that MULTIFLUX is a correct transient model for the contaminant spread in a mine airway.
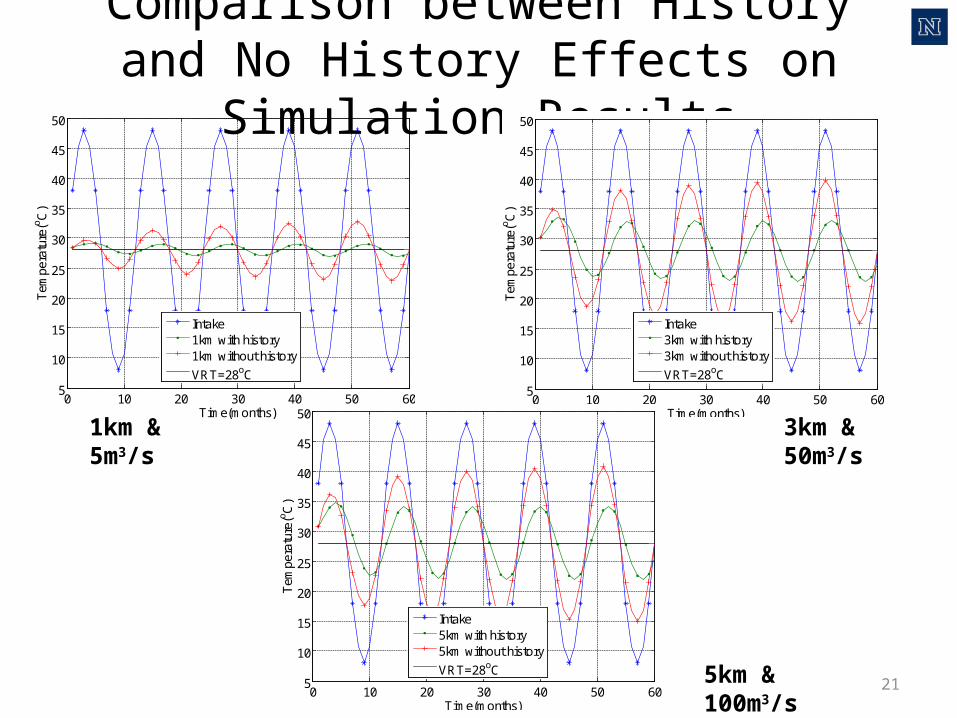
5) With no temperature history effect in MULTIFLUX, its results are in very good agreement with the other models, namely, with perfect, near-perfect, and very good agreement with Vuma, Climsim, and Ventsim, respectively, but when MULTIFLUX is modeled with temperature history effect very significant disagreements are obtained with the other models.
6) Pre-modeling the development end allows for fine mesh evaluation throughout the mine-wide ventilation model. Results of modeling yields response functions for primary air mass parameters, which respond to intake air mass variations.

Transport Model Elements For Conservative Scalar
• Transport processesThe transport of a chemically non-reactive, single-component substanceScalar substance may be:
• Bulk Mass• Water vapor Concentration• Contaminant Concentration• Heat
Six transport modes which are of interest in mine ventilation: • Advection• Diffusion• Dispersion • Convection • Accumulation or discharge ( Source or Sink)
11

Numerical Applications
Two mine ventilation examples are presented to demonstrate the performance of the numerical solution method used in MULTIFLUX for simulating traveling of contaminant concentration with the ventilating air;
1) A simple air flow network with a diagonal airway
2) A single drift
12

(B) (C)
(D) (E) (F)
Network Example 1 : Contaminant travel in MULTIFLUX with D=0.05 m2/s and Ventsim with default configuration
13
(A)
0 500 1000 1500 2000 25000
5
10
15
20
Time (seconds)
Co
nce
ntr
atio
n (
%)
MULTIFLUX, 0 disp.Ventsim, default config.

0 500 1000 1500 2000 25000
5
10
15
20
Time (seconds)
Co
nce
ntr
atio
n (
%)
MULTIFLUX, 0 disp.Ventsim, default config.
Locations:
A: x=10 m
B: x=250 m
C: x=500 m
D: x=750 m
E: x=1000 m
Network Example 2 : Contaminant travel in MULTIFLUX with D=0.0 m2/s and Ventsim with default configuration
141000m
1m/sCB D E
A
A
B
C
D
E

0 500 1000 1500 2000 25000
5
10
15
20
Time (seconds)
Co
nce
ntr
atio
n (
%)
MULTIFLUX, D=0.2 m/s2
Ventsim, default config.
Locations:
A: x=10 m
B: x=250 m
C: x=500 m
D: x=750 m
E: x=1000 m
E
Network Example 1 : Contaminant travel in MULTIFLUX with D=0.05 m2/s and Ventsim with default configuration
151000m
1m/sCB D E
A
A BC
D

Conclusions• An artificial, numerical dispersion may occur in the simulation results
of fast-traveling concentration transients transported by advection. Numerical dispersion is an error in the simulation, depending on the discretization scheme and the refinement of the grid.
• In addition to the numerical dispersion, another, systematic solution error may appear in the travel time of the concentration front. This error also depends on the discretization scheme and the refinement of the grid.
• A solution used in MULTIFLUX, a new mine ventilation, heat, moisture, and contaminant transport model and code, was presented which can be made free of both numerical dispersion and the systematic error in concentration travel time even if relatively large grid size is used.
16

17
Pedram Rostami
• Equivalent and hydraulic diameters• Transient temperature variations• Contaminant spread and transient, modeling
approach• Complex Ventilation and Contaminant
Simulation with MULTIFLUX

18
Equivalent and hydraulic diameters
• Equivalent diameter of a rectangular opening is defined as the diameter of a circular opening having the same pressure loss.
• The hydraulic diameter, dh, is used to determine the dimensionless Reynolds number to see if a flow is turbulent or laminar.
dh = 4*A/P
• Since equivalent diameter results in simplified calculations, current ventilation programs use this instead of the actual geometry of the drifts.
19
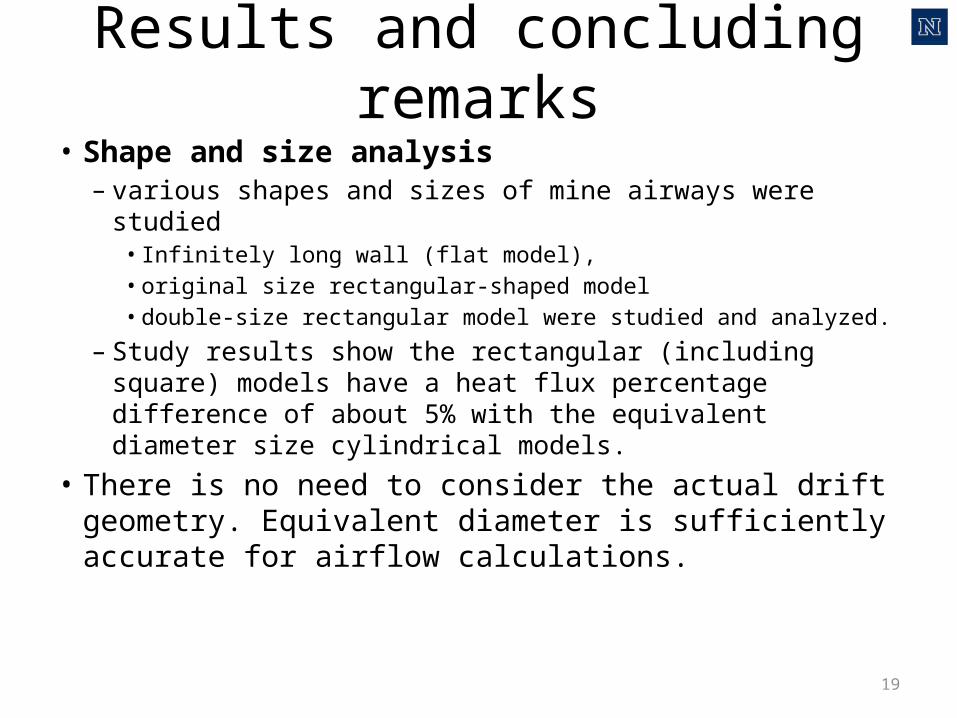
Results and concluding remarks• Shape and size analysis
– various shapes and sizes of mine airways were studied • Infinitely long wall (flat model), • original size rectangular-shaped model• double-size rectangular model were studied and analyzed.
– Study results show the rectangular (including square) models have a heat flux percentage difference of about 5% with the equivalent diameter size cylindrical models.
• There is no need to consider the actual drift geometry. Equivalent diameter is sufficiently accurate for airflow calculations.

20
Transient temperature variations
• The thermal flywheel is effectively storage and release of heat from the intake air into the intake airways as a function of the diurnal and seasonal change in surface temperatures
• It can be considered as a damping effect.• Heat stored by hot intake air into intake airway walls is released in the
cooler time periods (mostly evenings)– This lowers the predicted underground temperatures during the day (compared
to theoretical values) but – increases the underground temperatures (when wall temperatures are now
hotter than intake air temperatures) during the night (effectively a phase shift)
• Currently used mine ventilation and climate models, apply the Gibson function for wall heat flux without superposition.– a step-change model element that erases the true temperature history
• Refer to ”Temperature variations in underground tunnels” by G. Danko, D. Bahrami, P. Rostami, W. K. Asante, and R. Grymko
Flywheel effect in underground mining
21
0 10 20 30 40 50 605
10
15
20
25
30
35
40
45
50
Tem
pera
ture
(oC
)
Time(months)
Comparison between History and No History Effects on Simulation Results
0 10 20 30 40 50 605
10
15
20
25
30
35
40
45
50
Tem
pera
ture
(oC
)
Time(months)
0 10 20 30 40 50 605
10
15
20
25
30
35
40
45
50
Tem
pera
ture
(oC
)
Time(months)
5 6 7 8 9 10 11 1244.5
45
45.5
46
46.5
47
47.5
48
48.5
49
49.5
50
Intake5km with history5km without history
VRT=28oC
5 6 7 8 9 10 11 1244.5
45
45.5
46
46.5
47
47.5
48
48.5
49
49.5
50
Intake3km with history3km without history
VRT=28oC
5 6 7 8 9 10 11 1244.5
45
45.5
46
46.5
47
47.5
48
48.5
49
49.5
50
Intake1km with history1km without history
VRT=28oC
1km & 5m3/s 3km & 50m3/s
5km & 100m3/s
22
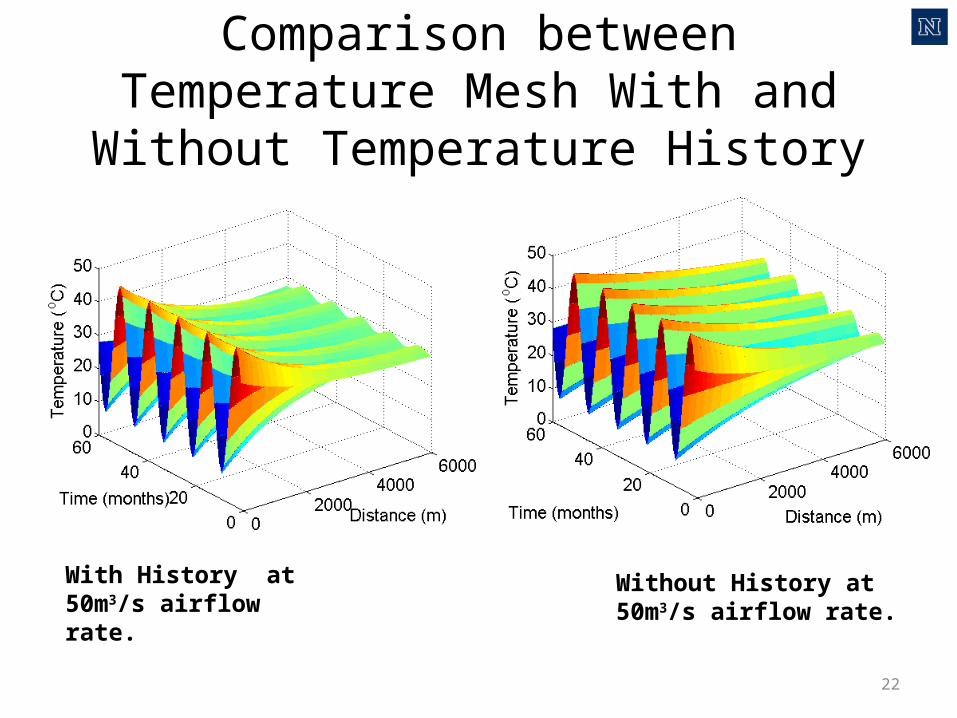
Comparison between Temperature Mesh With and Without Temperature History
With History at 50m3/s airflow rate.
Without History at 50m3/s airflow rate.

23
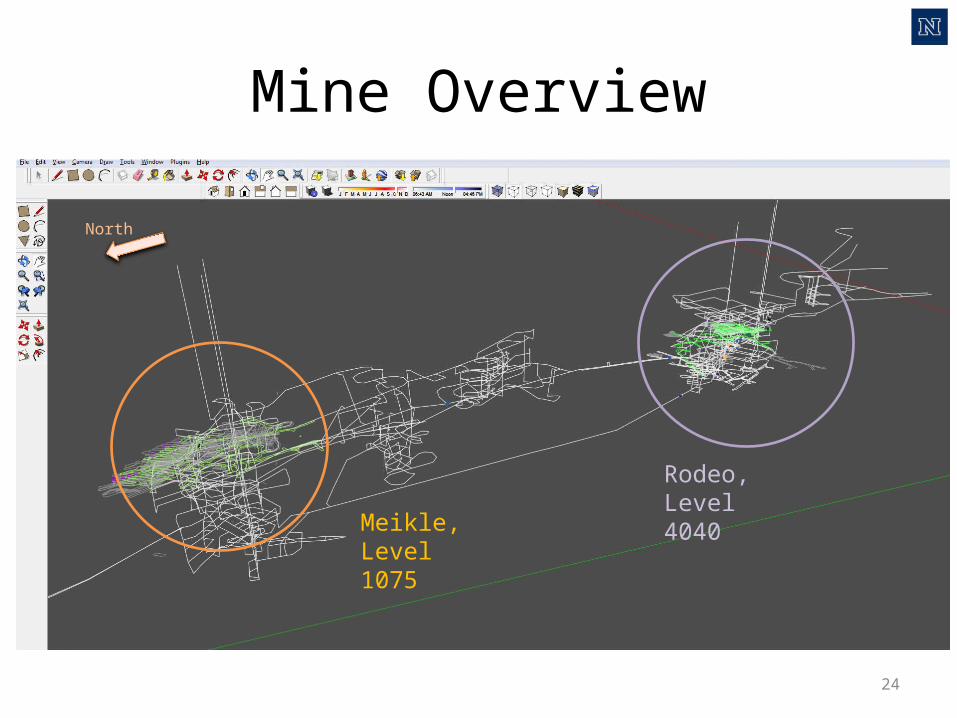
• Barrick Goldstrike, modeling approach is described in the following.
• Type of contaminants: SO2 and CO are selected as the two problematic gases.
• Sources of contaminants:• Strata• Operating machinery• Blasting operations• Ventilation recirculation
Contaminant spread and transient modeling
24
Mine Overview
Rodeo, Level 4040
Meikle, Level 1075
North

25
Rodeo
CO2 Monitoring Station
SO2 Monitoring Station
Working Zones
CO Monitoring Station
North
Active Face
Junction

26
Meikle
Working ZonesNorth
Active Face
Junction

27
Heat and Water Distribution
MineProduction
per day (TPD)
number of work zones
compressed air (cms)
Electric Energy
Consumption per mine**
Diesel Consumption per mine (l/s)
Diesel heat per mine (W)
Diesel processed
water per mine (kg/s)
Diesel required air per mine
(kg/s)
Other processed water per
mine (kg/s)Junction Source/Sink
(cms)Total Heat
sources/sinks (W)
Total processed
water (kg/s)
Rodeo 627 3 0.2832 1.32E+06 0.011547545 429383.9302 0.022542656 0.207855818 5.33E-01 1498 0.2832 429383.9302 5.55E-01
Rodeo 836 4 0.3776 1.76E+06 0.015396727 572511.9069 0.030056875 0.277141091 7.10E-01 1482 0.3776 572511.9069 7.40E-01
Rodeo 418 2 0.1888 8.78E+05 0.007698364 286255.9535 0.015028438 0.138570545 3.55E-01 1483 0.1888 286255.9535 3.70E-01
Rodeo 418 2 0.1888 8.78E+05 0.007698364 286255.9535 0.015028438 0.138570545 3.55E-01 1479 0.1888 286255.9535 3.70E-01
Meikle 422 2 0.346 1.22E+06 0.015614667 580615.7653 0.030482328 0.281064 1.97E+00 117 0.346 580615.7653 1.99626
Meikle 211 1 0.173 6.11E+05 0.007807333 290307.8827 0.015241164 0.140532 9.83E-01 120 0.173 290307.8827 0.99813
Meikle 211 1 0.173 6.11E+05 0.007807333 290307.8827 0.015241164 0.140532 9.83E-01 142 0.173 290307.8827 0.99813
Meikle 211 1 0.173 6.11E+05 0.007807333 290307.8827 0.015241164 0.140532 9.83E-01 165 0.173 290307.8827 0.99813
Meikle 211 1 0.173 6.11E+05 0.007807333 290307.8827 0.015241164 0.140532 9.83E-01 127 0.173 290307.8827 0.99813
Meikle 211 1 0.173 6.11E+05 0.007807333 290307.8827 0.015241164 0.140532 9.83E-01 137 0.173 290307.8827 0.99813
Meikle 211 1 0.173 6.11E+05 0.007807333 290307.8827 0.015241164 0.140532 9.83E-01 141 0.173 290307.8827 0.99813
Meikle 211 1 0.173 6.11E+05 0.007807333 290307.8827 0.015241164 0.140532 9.83E-01 149 0.173 290307.8827 0.99813
Total: 4200 20 2.5954 10330000 0.112607 4187178.688 0.219826881 2.026926 10.799 1098 2.5954 4187178.688 11.0188
** Electrical power consumption is not considered in the heat simulation. The electricity is assumed to be used mainly by, hoisting, pumps and lighting of the mine.

28
Complex Ventilation and Contaminant Simulation with MULTIFLUX
• Dispersion of contaminant gas can happen due:– Along the length of the airway through natural dispersion.– From low velocity flow to high velocity in the center of the airway.– In the Cross-sectional area of the airflow depending on the
concentration zone.– And finally the convective dispersion from the forced air.
• Current codes use a simple algorithm which distributes Contaminants in a linear velocity fashion, and assumes perfect mixing at intersections.
• This method is fine for studies through broad mine areas, but is not recommended for analysis of contaminant diffusion on a small scale level
Background

29
Spatial Issue
• Due to the location of a source and ventilation system spatial inhomogeneity arises.
• In addition to this spatial variability there is also temporal variability – processes coming on and going off line and ventilation rates
changing with time.• While the worker is moving in this complex environment the
concentration level of air he is breathing may be different from the average.
• What is a safe zone!– Exposure is limited or not harmful!
• Where is the safe zone?

30
Average Concentration level

31
Methodology
• A CFD model needs to be established.• This master model will be used to run various
scenarios.• Results will be compared and analyzed.• Considering the geometry source terms,
machinery and obstacles in the airway we can:– Propose a distance in which the flow is mixed
enough and any measurements of contamination would represent the average value.

32
Temporal Issue
• When and at what concentrations level?– Be able to predict arrival time and concentration
levels at any given point in the mine network. • We need:
– Calculate a dispersion coefficient that represent all types of diffusions mentioned before in the airway.
– Use the representing dispersion coefficient for a larger scale contaminant modeling.
– Model In a non-CFD code.

33
• Concentration• Arrival time• Dilution

34
Methodology
• CFD model will be established using gathered data from the mine.
• This master model will be verified and used again in various ventilation scenarios to calculate the dispersion coefficient and compare the findings to the spatial issue.
• The calculated parameters will be used in future predictions of contaminant arrival and concentrations at a given point using MULTIFLUX code.

35
Data collection and calibration of the model
• This investigation of contaminant behavior can be achieved by gathering required data from actual mine scenario.
• This data collection set is one the most crucial steps in modeling and verification of findings.
• Two sets of database are needed to address the temporal and spatial issues.
• FIRST SET – The first data set includes three stations located 100meters apart from each other in a
long airway. – We need to take 10 measurements of velocity and contamination concentrations in each
station for three different scenarios of, 1) no airflow, 2) laminar and 3) turbulent.
• SECOND SET – The second set of data base would include measurements of velocity and concentrations
before and after the contaminant source. We need to know the airway properties (geometry, obstructions and heat transfer properties), to find a distance from which the measurements would represent the average of the mixture.

36

37
38
Jon Fox
• VOD Simulation with MULTIFLUX• MULTIFLUX GUI Development• Side-by-side comparison of MULTIFLUX,
Ventsim & Vuma vs. VnetPC/Climsim• Development end MULTIFLUX sub-model
template

39
VOD Simulation with MULTIFLUX
• Define control architecture.• Vary one big underground booster fan.• Study mass flow cross effects among affected
ventilation districts.

40
Mine-wide ventilation control flow chart
Mine design and production schedule
Manual observation
Mine personnel location Sensors
(Wi-Fi tags)
Diesel Particulate
Sensors (DPM)
Equipment location
and monitoring
Sensors (Wi-Fi tags)
Temperature and
humidity Sensors
(WBT DBT)
Airflow rate and direction Sensors
(Qv
Qm)
Gas Sensors
(CO CO2 SO2 . . .
)
Mine data communication network (Ethernet, DH+, fiber-optic...) and Manual communication system (Leaky feeder, tunnel radio, Wi-Fi, ultra-low frequency...)
Administrative reporting
Event-based manual control
(Emergency VOD time-
of-day)
Mine ventilation
and climate control model
Automatic ventilation
control (VOD)
Automatic emergency
control (fire, evacuation)
Mine monitoring database servers
Mine display system
Notification to mining personnel
(Cap lamps)
Air conditioners,
chillers
Blast gas fans
Air doors, regulators Room fans
Booster fans
Major exhaust
fans
Check: Threshold Limit Values, Time Weighted Averages, Short Term Exposure Limits, Ceiling Limits

• Modulate twin Joy M84 booster fans at 1450 level– Variable frequency modeled @ 50%
Change in Airflow Directions From Variable Fan Modulation
41

42
Change in Airway Velocities Due To Fan Modulation
Modulate twin Joy M84 booster fans at 1450 levelVariable frequency modeled at 50% pressure
Affected airways are shown in red
Start End QΔ ab %Δ280 286 -26.622 -101%
305 227 15.675 179%
Affected Airways - Percentage Change in Airflow RateStart End ΔQab % Δ Previous New Start End ΔQab % Δ Previous New
280 286 -26.622 -101% 26.412 -0.20943 475 478 -6.721 -192% 3.4943 -3.2267286 296 -26.622 -101% 26.412 -0.20943 1062 1061 -3.9417 -129% 3.0483 -0.89347411 410 -33.943 -157% 21.575 -12.368 1061 1056 -3.9167 -130% 3.0056 -0.91109418 411 -33.943 -157% 21.575 -12.368 1056 1057 -3.9167 -130% 3.0056 -0.91109410 412 -33.943 -157% 21.575 -12.368 1421 1455 -12.983 -592% 2.1931 -10.789412 415 -33.943 -157% 21.575 -12.368 1342 1209 -11.912 -819% 1.454 -10.458415 417 -33.943 -157% 21.575 -12.368 1902 1867 -0.22717 -122% 0.18642 -0.04075
1270 1258 -23.28 -147% 15.831 -7.4483 1043 1042 -3.0427 -1676% 0.18154 -2.86111280 1270 -23.28 -147% 15.831 -7.4483 1044 1043 -3.0427 -1676% 0.18154 -2.86111286 1280 -23.28 -147% 15.831 -7.4483 1046 1044 -3.0427 -1676% 0.18154 -2.86111287 1286 -23.28 -147% 15.831 -7.4483 1047 1045 -3.0427 -1676% 0.18154 -2.86111288 1287 -23.28 -147% 15.831 -7.4483 1045 1046 -3.0427 -1676% 0.18154 -2.86111289 1288 -23.28 -147% 15.831 -7.4483 1051 1047 -3.0427 -1676% 0.18154 -2.86111291 1289 -23.28 -147% 15.831 -7.4483 1057 1051 -3.0427 -1676% 0.18154 -2.86111197 1196 -23.263 -147% 15.793 -7.4704 658 757 -0.17297 -114% 0.1514 -0.021561198 1197 -23.263 -147% 15.793 -7.4704 429 425 0.32736 157% -0.20841 0.118961201 1198 -23.263 -147% 15.793 -7.4704 1342 1244 11.912 819% -1.454 10.4581206 1201 -23.263 -147% 15.793 -7.4704 400 398 4.6321 218% -2.1234 2.50871208 1206 -23.263 -147% 15.793 -7.4704 324 226 6.0118 175% -3.4439 2.56781248 1208 -23.263 -147% 15.793 -7.4704 226 227 6.0118 175% -3.4439 2.56781196 1291 -23.263 -147% 15.793 -7.4704 329 323 6.0118 175% -3.4439 2.5678
811 808 -29.569 -207% 14.304 -15.265 325 324 6.0118 175% -3.4439 2.5678989 988 -12.632 -138% 9.1362 -3.4963 323 325 6.0118 175% -3.4439 2.5678991 989 -12.632 -138% 9.1362 -3.4963 332 329 6.0118 175% -3.4439 2.5678
1462 1502 -10.644 -174% 6.1307 -4.5137 336 332 6.0118 175% -3.4439 2.56781012 1015 -10.377 -195% 5.3298 -5.0474 1462 1458 10.644 174% -6.1307 4.5137
399 1492 -4.7941 -137% 3.5036 -1.2906 305 277 15.675 179% -8.7679 6.9068

43
Conclusions
• Careful model exercises are needed VOD to understand cross-effects on dynamic changes.
• Variations of VOD control components must be carefully evaluated.
• Future research findings will drive new developments in ventilation control architecture.

44
MULTIFLUX GUI Development• Network definition is made in Google SketchUp• Airway branch definition is by:
– graphical template selection and– Interactive user’s data input

45
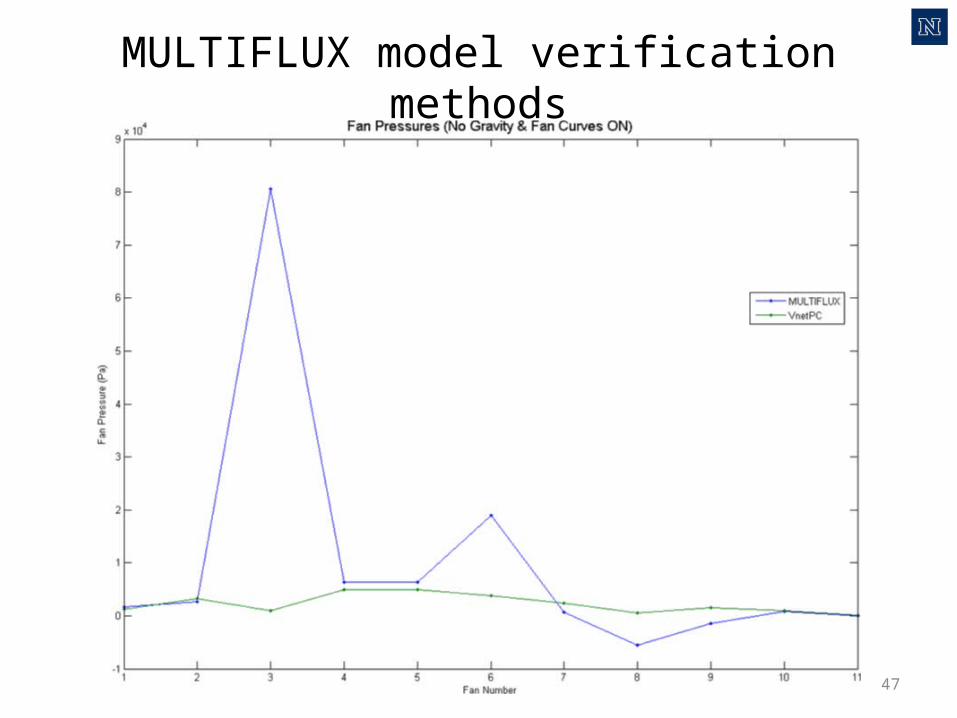
Side-by-side comparison of MULTIFLUX, Ventsim & Vuma vs. VnetPC/Climsim
• Base model of Garson nickel mine with aerodynamic simulation in VnetPC and thermodynamic simulation in Climsim.
• Verification methods have been validated in Matlab.• Comparison of dry bulb and wet bulb predictions are the
meter of modeling performance.

46
MULTIFLUX model verification methods
47
MULTIFLUX model verification methods

48
MULTIFLUX Graphical User Interface Google SketchUp Workspace

49
Ventsim model

50
Vuma model

51
Conclusions• Without a tutor properly versed in each simulation
software, the probability of creating an accurate model is spotty at best.
• Having reliable technical support that can guide the student through the intricacies of the model configuration is paramount when comparative simulations are required.
• Until extreme resistances, either zero or (practically) infinite, are resolved into realistic resistances even the base case airflow model is suspect.

52
Development end MULTIFLUX sub-model template
• Cooling capacity prediction and parametric studies are being conducted to support the design or the development of single-entry drifts
• A new set of data has been obtained from the Barrick Gold strike Mine complex for model verification
• The goal of the study is to model and apply a development-end template and determine the performance of the proposed chiller in providing workable environment at the face

53
Ventilation configuration for the Banshee development end

54
Geometry, specification & measurement locations for the Banshee development end

Pressure distribution along drift and duct with 2.7kPa back pressure behind the bulkhead.
55
Drift airflow direction
duct Duct airflow direction
drift
Pressure distribution with three fan locations, p3.

56
Drift airflow direction
duct
duct airflow direction
drift
Dry bulb temperature distribution along drift and duct
57
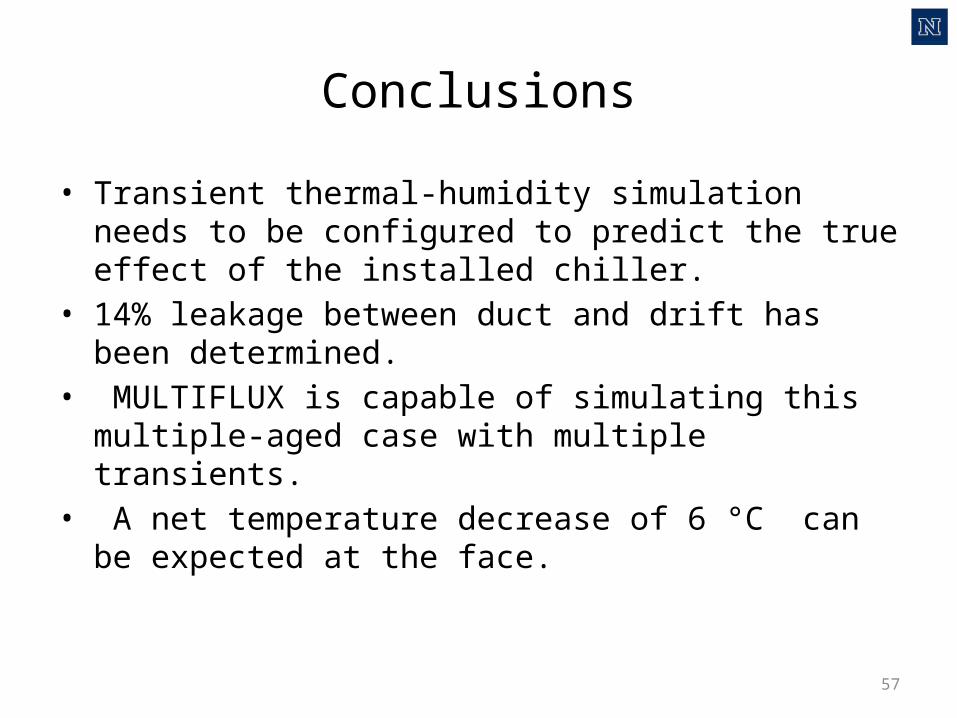
Conclusions
• Transient thermal-humidity simulation needs to be configured to predict the true effect of the installed chiller.
• 14% leakage between duct and drift has been determined.
• MULTIFLUX is capable of simulating this multiple-aged case with multiple transients.
• A net temperature decrease of 6 °C can be expected at the face.


