Venous Thrombosis Analytic Validity - Centers for Disease ... · Future analyses should be aimed at...
33
ANALYTIC VALIDITY different, technology? Question 8: Is the test qualitative or quantitative? Question 9: How often is a test positive when a mutation is present? Question 10: How often is the test negative when a mutation is not present? Question 11: Is an internal quality control program defined and externally monitored? Question 12: Have repeated measurements been made on specimens? Question 13. What is the within- and between-laboratory precision? Question 14: If appropriate, how is confirmatory testing performed? Question 15: What range of patient specimens have been tested? Question 16: How often does the test fail to give a useable result? Question 17: How similar are results obtained in multiple laboratories using the same, or VTE – 2004 - 3 Analytic Validity 2-1
-
Upload
truonghanh -
Category
Documents
-
view
216 -
download
3
Transcript of Venous Thrombosis Analytic Validity - Centers for Disease ... · Future analyses should be aimed at...

ANALYTIC VALIDITY
different, technology?
Question 8: Is the test qualitative or quantitative? Question 9: How often is a test positive when a mutation is present? Question 10: How often is the test negative when a mutation is not present? Question 11: Is an internal quality control program defined and externally monitored? Question 12: Have repeated measurements been made on specimens? Question 13. What is the within- and between-laboratory precision? Question 14: If appropriate, how is confirmatory testing performed? Question 15: What range of patient specimens have been tested? Question 16: How often does the test fail to give a useable result? Question 17: How similar are results obtained in multiple laboratories using the same, or
VTE – 2004 - 3 Analytic Validity 2-1

ANALYTIC VALIDITY
The DNA tests for both factor V Leiden (FVL PRO) are
Question 8: Is the test qualitative or quantitative?
) and prothrombin G20210A mutation (qualitative (e.g., a specific mutation is reported as present or absent).
VTE – 2004 - 3 Analytic Validity 2-2

ANALYTIC VALIDITY
Question 9:
Summary
• 0.6%) by allele and 0.8% by individual (95 percent CI 0.5-1.2%)
• • •
•
• G20210A mutation
• •
G20210A mutation
Definitions
also be called the analytic detection rate.
How often is a test positive when a mutation is present? Question 10: How often is the test negative when a mutation is not present?
Based on data from the American College of Medical Genetics and the College of American Pathologists (ACMG/CAP) Molecular Genetics Survey Set MGL
The overall error rate for factor V Leiden (FVL) testing is 0.5 percent (95 percent CI 0.3-
The analytic sensitivity is 99.1 percent (95 percent CI 98.7-99.5%), for factor V Leiden The analytic sensitivity was essentially constant between 1999 and 2001 The analytic specificity is 99.7 percent (95 percent CI 99.6-99.9%) for factor V Leiden
The overall error rate for prothrombin G20210A mutation testing is 0.5 percent (95 percent CI 0.3-0.6%) by allele and 0.8 percent by individual (95 percent CI 0.5-1.1%) The analytic sensitivity is 98.8 percent (95 percent CI 98.2-99.3%) for prothrombin
The analytic sensitivity was essentially constant between 1999 and 2001 The analytic specificity is 99.8 percent (95 percent CI 99.7-99.9%) for prothrombin
Analytic performance is summarized by the sensitivity and specificity of the detection system. Analytic sensitivity is the proportion of positive test results, when a detectable mutation is present (i.e., the test is designed to detect that specific mutation). The analytic sensitivity may
Analytic specificity is the proportion of negative test results when no detectable mutation is present. Analytic specificity can also be expressed in terms of the analytic false positive rate. This would be the proportion of positive test results when no detectable mutations are present (1analytic specificity).
Optimal source(s) of data Basing analytic performance estimates on external proficiency testing has drawbacks, including:
• mixing of clinical and research laboratories • few challenges • reporting summary results in ways that do not allow a straightforward computation of
analytic sensitivity and specificity • challenges that do not represent the ‘mix’ of genotypes expected in a screening program
(e.g., too few negative tests).
Future analyses should be aimed at providing reliable method- and, possibly, mutation-specific analytic performance estimates. One approach for collecting such data might include the following steps:
VTE – 2004 - 3 Analytic Validity 2-3

• An independent body [such as the College of American Pathologists, American College of Medical Genetics, Food and Drug Administration or the Coriell Institute of Medical
Included in the standard set, however, would
•
sequencing).
•
lower 95 percent confidence interval). be derived.
laboratories using its reagents.
Research (Camden, NJ)] would develop a standard set of samples, most of which would be randomly selected from the general population. also be additional, less common genotypes The sample set would then be available for method validation. Correct genotypes would be arrived at by consensus, or, if disagreements emerged, by a reference method (e.g.,
The current validation practice of having a laboratory (or manufacturer) run a series of samples with unknown genotype is inadequate, since there is no ‘gold standard’ with which to compare. For example, how can a laboratory running an unknown sample determine whether a positive finding is a true, or a false, positive? Ideally, this blinded sample set would be available to manufacturers as part of the pre-market approval process, with the understanding that multiple laboratories using these commercial reagents would be asked by the manufacturer to analyze portions the sample set independently. This initial assay validation process is distinct from assay control samples that are discussed later (Question 13).
Appropriate sample size for determining analytic sensitivity and specificity has been discussed in detail in an earlier ACCE review (Prenatal Cystic Fibrosis Carrier Screening). In brief, a target sensitivity (or specificity) can be chosen, along with an acceptable lower limit (assumed to be the
Given these targets, the number of necessary samples can For example, if a laboratory chose a target specificity of 98 percent and wanted to
rule out a specificity of 90 percent, it would need to correctly identify at least 49 of 50 known negative samples (estimated using the binomial distribution). When the estimates approach 100 percent and include relatively tight confidence intervals, it may not be economically feasible for individual laboratories to create the data. However, this could be attained by a consortium of laboratories using the same methodology, or by a manufacturer that forms a consortium of
All of these analyses could be done using a 2x2 table, and all rates could be accompanied by 95 percent confidence intervals (CI).
The ACMG/CAP external proficiency testing scheme Background and Definitions As part of ACMG/CAP external proficiency testing in the United States, purified DNA from established cell lines (derived from human cells with known mutations http://locus.umdnj.edu/ccr/qc/DNAQC.html) is distributed to enrolled laboratories. Many of these laboratories are likely to be providing clinical services, but reagent manufacturers and research laboratories also participate. In 2003, there were 189 participants reporting factor V Leiden results and 181 participants reporting prothrombin G20210A mutation results. A false positive result occurs when the laboratory reports finding a mutation in the sample, when none is present. A false negative result occurs when a laboratory reports no mutation, but a mutation for which it tests is, in fact, present in the sample.
The present analysis, which uses the ACMG/CAP data, initially examines the rates of these two types of errors independently, by chromosome (e.g., the results on one chromosome are counted separately from the results reported for the other).
VTE – 2004 - 3 Analytic Validity 2-4

Error rates for the ACMG/CAP external proficiency testing scheme Table 2-1 shows the number of alleles tested and the results from the ACMG/CAP Molecular Genetics Survey from 1999 to
False Negative
Year N (%)
1999-A 1 (0.2) 1999-B 0 2000-A 3 (0.4) 2000-B 1 (0.1) 2001-A 7 (0.7) 2001-B 2 (0.2) 2002-A 1 (0.1) 2002-B 1 (0.1) 2003-A 0
All 16 (0.2)
2003 for factor V Leiden. FVL
0.6%) of the PRO For all data between 1999 and 2003, 6063
errors (e.g., false positive).
Table 2-1. Results of the ACMG/CAP Molecular Genetics Survey
Number of
Labs Tested Correct
) Incorrect
)
False Positive
)
115 460 459 (99.8) 1 (0.2) 0 (0.0) 0 0 0 0 0
124 742 735 (99.2) 7 (0.8) 4 (0.5) 140 838 837 (99.9) 1 (0.1) 0 (0.0) 156 940 930 (98.9) 10 (1.1) 3 (0.4) 152 912 908 (99.6) 4 (0.4) 2 (0.2) 165 990 988 (99.8) 2 (0.2) 1 (0.1) 177 1040 1038 (99.8) 2 (0.2) 1 (0.1) 189 1132 1131 (99.9) 1 (0.1) 1 (0.1)
7054 7026 (99.6) 28 (0.4) 12 (0.2)
Overall, 0.5 percent (95 percent CI 0.3% to 0.6%) of the alleles were incorrectly identified. For all data between 1999 and 2003, 7039 of 7072 chromosomes were correctly identified (99.5%, 95 percent CI 99.4% to 99.7%). Table 2-2 shows the number of alleles tested and the results from the ACMG/CAP Molecular Genetics Survey from 1999 to 2003 for prothrombin G20210A mutation (PRO). Overall, 0.5 percent (95 percent CI 0.3% to
alleles were incorrectly identified. of 6092 chromosomes were correctly identified (99.5%, 95 percent CI 99.4% to 99.7%). Appendix 1 contains a complete listing of the sample challenges, the responses, and the types of
Factor V Leiden Mutation Testing:
Type of Incorrect Result
Alleles N (% N (% N (%
VTE – 2004 - 3 Analytic Validity 2-5

Table 2-2. Prothrombin G20210A Mutation Testing: Results of the ACMG/CAP
False Negative
Year N (%)
1999-A 0 1999-B 4 (4.3) 2000-A 2 (0.35) 2000-B 7 (0.9) 2001-A 3 (0.3) 2001-B 1 (0.1) 2002-A 0 2002-B 1 (0.1) 2003-A 1 (0.1)
All 19 (0.3)
(95% CI)
Number of
Labs Tested Correct
) Incorrect
)
False Positive
)
0 0 0 0 0 24 96 90 (93.7) 6 (6.3) 2 (2.2) 100 600 596 (99.3) 4 (0.7) 2 (0.35) 123 738 731 (99.0) 7(0.9) 0 (0.0) 138 834 829 (99.4) 5 (0.6) 2 (0.3) 134 804 802 (99.8) 2 (0.2) 1 (0.1) 154 922 0 0 171 1024 1022 (99.8) 2 (0.2) 1 (0.1) 181 1084 1082 (99.8) 2 (0.2) 1 (0.1)
6100 6072 (99.5) 28 (0.5) 9 (0.2)
mutations.
Table 2-3. Data from the ACMG/CAP Molecular Genetics Survey
Year Analytic
) Analytic
Specificity
Molecular Genetics Survey
Type of Incorrect Result
Alleles N (% N (% N (%
922 (100)
Tables 2-3 and 2-4 make use of the ACMG/CAP external proficiency testing data (Appendix 1) to compute the analytic sensitivity and specificity for factor V Leiden and prothrombin G20210A
Analytic Performance for Identifying Factor V Leiden Mutations According to
Sensitivity (% (95% CI)
1999 99.6 (98.7-100) 100 2000 99.0 (97.9-99.9) 99.7 (99.3-100) 2001 99.0 (98.4-99.7) 99.4 (99.0-99.9) 2002 99.6 (99.0-100) 100 2003 98.9 (97.9-100) 100
All 99.1 (98.7-99.5) 99.7 (99.6-99.9)
VTE – 2004 - 3 Analytic Validity 2-6

Table 2-4. Analytic Performance for Identifying Prothrombin G20210A Mutations According to Data from the ACMG/CAP Molecular Genetics Survey
Year Analytic
) Analytic
Specificity
1999 91.7 (83.7-99.6) 95.8 (90.1-100) 2000 97.4 (95.7-99.1) 99.8 (99.5-100) 2001 99.2 (98.5-100) 99.7 (99.4-100) 2002 99.6 (99-100) 99.9 (99.8-100) 2003 99.4 (98.3-100) 99.9 (99.7-100)
All 98.8 (98.2-99.3) 99.8 (99.7-99.9)
correctly classified.
Sensitivity (% (95% CI) (95% CI)
Sensitivity and specificity by person rather than by chromosome It is possible to compute analytic sensitivity and specificity according to whether a person’s genotype has been correctly classified, rather than whether an individual chromosome has been
That is, the genotype is correct or incorrect when detectable mutations are present (analytic sensitivity), or the genotype is correct or incorrect when no detectable mutations are present (analytic specificity). Tables 2-5 and 2-6 show the results of this analytic approach, stratified by the year that proficiency testing results were obtained. Overall error rates of 0.8 percent (95% CI 0.5-1.2%) and 0.8 percent (95% CI 0.5-1.1%) were found for factor V Leiden and prothrombin G20210A mutation testing, respectively, for testing in US laboratories.
VTE – 2004 - 3 Analytic Validity 2-7

Table 2-5. Analytic Performance for Identifying Factor V Leiden Mutations Based on the ACMG/CAP Molecular Genetics Survey, Classified According to Whether a Person’s
Correct )
Incorrect ) Totals
1999 229 (99.2) 1 (0.8) 2000-A 245 (98.8) 3 (1.2) 2000-B 139 (99.3) 1 (0.7) 2001-A 310 (98.7) 4 (1.3) 2001-B 302 (99.3) 2 (0.7) 2002-A 0 0 2002-B 175 (99.4) 1 (0.6) 2003-A 373 (98.9) 4 (1.1)
Totals 1771 (99) 18 (0.9)
1999 0 0 2000-A 120 (97.6) 3 (2.4) 2000-B 279 (100) 0 2001-A 153 (98.1) 3 (1.9) 2001-B 150 (98.7) 2 (1.3) 2002-A 491 (99.2) 4 (0.8) 2002-B 352 (99.7) 1 (0.3) 2003-A 189 (100) 0
Totals 1736 (99.3) 12 (0.7)
Genotype is Correctly Identified
Detectable mutation present N (% N (%
Detectable mutation not present
230 248 140 314 304
0 176 377
1789
0 123 279 156 152 495 353 189
1748
OVERALL ERROR RATE 30 (0.8) 3537
VTE – 2004 - 3 Analytic Validity 2-8

Table 2-6. Analytic Performance for Identifying Prothrombin G20210A Mutations Based on the ACMG/CAP Molecular Genetics Survey, Classified According to Whether a
Correct )
Incorrect ) Totals
1999 22 (91.6) 2 (8.4) 2000-A 98 (98) 2 (2) 2000-B 118 (95.9) 5 (4.1) 2001-A 135 (97.8) 3 (2.2) 2001-B 266 (99.2) 2 (0.8) 2002-A 152 (100) 0 2002-B 168 (98.8) 2 (1.2) 2003-A 179 (99.4) 1 (0.6)
Totals 1138 (98.5) 17 (1.5)
1999 23 (95.8) 1 (4.2) 2000-A 198 (99) 2 (1) 2000-B 246 (100) 0 2001-A 276 (99.3) 2 (0.7) 2001-B 134 (100) 0 2002-A 304 (99.7) 1 (0.3) 2002-B 342 (100) 0 2003-A 361 (99.7) 1 (0.3)
Totals 1884 (99.6) 7 (0.4)
Person’s Genotype is Correctly Identified
Detectable mutation present N (% N (%
Detectable mutation not present
24 100 123 138 268 152 170 180
1155
24 200 246 278 134 305 342 362
1891
OVERALL ERROR RATE 24 (0.8) 3046
VTE – 2004 - 3 Analytic Validity 2-9

The National External Quality Assessment Schemes (NEQAS) includes data from available from
129 152 114 172 184 61 64 70 76
1022
86 102 113 59
December 2000 60 (96.8) 2 (3.2) 62 April 2001 61 0 61
September 2001 63 0 63 January 2002 69 0 69
May 2002 151 0 151
Table 2-7.
Correct )
Incorrect ) Totals
July 1999 126 (97.7) 3 (2.3) November 1999 152 0
April 2000 111 (97.4) 3 (2.6) August 2000 167 (97.1) 5 (2.9)
181 (98.4) 3 (1.6) April 2001 61 0
September 2001 64 0 January 2002 69 (98.6) 1 (1.4)
May 2002 76 0
Totals 1007 (98.5) 15 (1.5)
July 1999 86 0 November 1999 102 0
April 2000 113 0 August 2000 59 0
the United Kingdom and Europe. Data for the Factor V Leiden/Molecular Genetics of Thrombophilia External Quality Assessment Programme are listed in Tables 2-7 and 2-8.
Analytic Performance for Identifying Factor V Leiden Mutations based on the NEQAS Factor V Leiden External Quality Assessment Programme, Classified According to Whether the Genotype is Correctly Identified
Detectable mutation present N (% N (%
December 2000
Detectable mutation not present
Totals 764 (99.7) 2 (0.3) 766
OVERALL ERROR RATE 17 (0.9) 1788
VTE – 2004 - 3 Analytic Validity 2-10

Table 2-8. Analytic Performance for Identifying Prothrombin G20210A Mutations Based on the NEQAS Molecular Genetics of Thrombophilia External Quality Assessment
36 0
106 56 182 61 63 67 74
645
74 98 105 56 61 61 62 66
147
Correct )
Incorrect ) Totals
July 1999 36 0 November 1999 0 0
April 2000 105 (99) 1 (1) August 2000 55 (98.2) 1 (1.2)
181 (99.4) 1 (0.6) April 2001 61 0
September 2001 63 0 January 2002 64 (95.5) 3 (4.5)
May 2002 74 0
Totals 639 (99.1) 6 (0.9)
July 1999 74 0 November 1999 98 0
April 2000 105 0 August 2000 56 0
60 (98.4) 1 (1.6) April 2001 61 0
September 2001 62 0 January 2002 66 0
May 2002 146 (99.3) 1 (0.7)
Programme, Classified According to Whether the Genotype is Correctly Identified
Detectable mutation present N (% N (%
December 2000
Detectable mutation not present
December 2000
Totals 728 (99.7) 2 (0.3) 730
OVERALL ERROR RATE 8 (0.6) 1375
As can be seen, the two quality assurance programs give similar results (overall error rate of 0.8 percent for factor V Leiden and prothrombin G20210A mutation testing in the U.S., and 0.9 and 0.6, respectively, in the UK and Europe).
References
ACMG/CAP Molecular Genetics Survey Sets (1999, 2000, 2001, 2002, 2003) College of American Pathologists, Northfield, IL.
VTE – 2004 - 3 Analytic Validity 2-11

Appendix 1. Data used to calculate analytic sensitivity and specificity
Pathologists (ACMG/CAP). participants since 1999. 11 indicates the 11th
survey in 1999). the genotype of the sample.
The tables also
Table 2-9. Leiden (R506Q mutation)
Labs Genotype Correct Incorrect
99 MGL-11 115 R506Q/WT 114 228 0 1 1 1
99 MGL-12 115 R506Q/WT 115 230 0
Totals 1999 460 alleles 459 1
115 + 115
Tables 2-9 through 2-13 summarize the factor V Leiden external proficiency testing results obtained by the American College of Medical Genetics and the College of American
Samples with known genotypes have been distributed to The first columns of the tables contain the distribution label (99 MGL
DNA sample distributed as part of the Molecular Genetics Laboratory The second columns contain number of participating laboratories, followed by
The number of laboratories reporting specific genotypes is then provided, along with a tabulation of their ‘correct’ and ‘incorrect’ responses. contain the denominator for calculating the analytic sensitivity and specificity in a box, along with the yearly (and summary) totals.
Computations for the 1999 ACMG/CAP Proficiency Testing Surveys: factor V
Reported Alleles Distribution
R506Q/WT WT/WT
R506Q/WT
Sensitivity Specificity 115 + 115
VTE – 2004 - 3 Analytic Validity 2-12

Table 2-10. Computations for the 2000 ACMG/CAP Proficiency Testing Surveys: factor V Leiden (R506Q mutation)
Labs Genotype Correct Incorrect
00 MGL-01 124 R506Q/WT 122 244 0 2 2 2
00 MGL-02 124 R506Q/WT 123 246 0 1 1 1
00 MGL-03 123 WT/WT 120 240 0 2 2 2 1 R506Q/R506Q 0 2
00 MGL-13 140 R506Q/WT 139 278 0 1 1 1
00 MGL-14 140 WT/WT 140 280 0
00 MGL-15 139 WT/WT 139 278 0
Totals 2000 1580 alleles 1572 8
Reported Alleles Distribution
R506Q/WT WT/WT
R506Q/WT WT/WT
WT/WT R506Q/WT
R506Q/WT WT/WT
WT/WT
WT/WT
Sensitivity 124+124+140 Specificity 124+124+246+140+280+278
VTE – 2004 - 3 Analytic Validity 2-13

Table 2-11. Computations for the 2001 ACMG/CAP Proficiency Testing Surveys: factor V Leiden (R506Q mutation)
Labs Genotype Correct Incorrect
01 MGL-01 157 R506Q/R506Q 153 R506Q/R506Q 306 0 4 4 4
01 MGL-02 157 R506Q/WT 154 308 0 1 3 3
01 MGL-03 156 WT/WT 153 306 0 3 3 3
01 MGL-13 152 R506Q/R506Q 151 R506Q/R506Q 302 0 1 0 2
01 MGL-14 152 WT/WT 151 302 0 1 R506Q/R506Q 0 2
01 MGL-15 152 R506Q/WT 152 304 0
Totals 2001 1852 alleles 1838 14
Reported Alleles Distribution
R506Q/WT
R506Q/WT WT/WT
WT/WT R506Q/WT
WT/WT
WT/WT
R506Q/WT
Sensitivity 314+157+304+152 Specificity 157+312+304+152
VTE – 2004 - 3 Analytic Validity 2-14

Table 2-12. Computations for the 2002 ACMG/CAP Proficiency Testing Surveys: factor V Leiden
Labs Genotype Correct Incorrect
02 MGL-01 165 R506Q/WT 164 328 0 1 1 1
02 MGL-02 165 R506Q/WT 165 330 0
02 MGL-03 165 WT/WT 164 328 0 1 1 1
02 MGL-07 176 R506Q/WT 175 350 0
1 1 1
02 MGL-08 167 WT/WT 166 332 0 1 1 1
02 MGL-09 177 WT/WT 177 354 0
Totals 2002 2030 alleles 2026 4
Reported Alleles Distribution
R506Q/WT WT/WT
R506Q/WT
WT/WT R506Q/WT
R506Q/WT WT/WT
WT/WT R506Q/WT
WT/WT
Sensitivity 165+165+176 Specificity 165+165+330+176+334+354
VTE – 2004 - 3 Analytic Validity 2-15

Table 2-13. Computations for the 2003 ACMG/CAP Proficiency Testing Surveys: factor V Leiden
Labs Genotype Correct Incorrect
03 MGL-01 189 R506Q/WT 188 376 0 1 1 1
03 MGL-02 188 R506Q/WT 188 376 0
03 MGL-03 189 WT/WT 189 378 0
Totals 2003 1132 alleles 1131 1
188+189 Specificity 188+189+378
Totals 99-03 7072 7039 33
Reported Alleles Distribution
R506Q/WT WT/WT
R506Q/WT
WT/WT
Sensitivity
VTE – 2004 - 3 Analytic Validity 2-16

Tables 2-14 through 2-18 summarize the prothrombin G20210A mutation external proficiency testing results obtained by the American College of Medical Genetics and the College of
1999).
participants since 1999.st
The tables also
Table 2-14. Prothrombin G20210A Mutation
Labs Genotype Correct Incorrect
99 MGL-21 24 WT/WT 23 46 0 1 20210/20210 0 2
99 MGL-22 24 20210/20210 22 20210/20210 44 0 2 0 4
Totals 1999 96 alleles 90 6
48 Specificity 48
American Pathologists (ACMG/CAP). Samples with known genotypes have been distributed to The first column of the tables contain the distribution label (99 MGL-21
indicates the 21 DNA sample distributed as part of the Molecular Genetics Laboratory survey in The second columns contain number of participating laboratories, followed by the
genotype of the sample. The number of laboratories reporting specific genotypes is then provided, along with a tabulation of their ‘correct’ and ‘incorrect’ responses. contain the denominator for calculating the analytic sensitivity and specificity in a box, along with the yearly (and summary) totals.
Computations for the 1999 ACMG/CAP Proficiency Testing Surveys:
Reported Alleles Distribution
WT/WT
WT/WT
Sensitivity
VTE – 2004 - 3 Analytic Validity 2-17

Table 2-15. Computations for the 2000 ACMG/CAP Proficiency Testing Surveys: Prothrombin G20210A Mutation
Labs Genotype Correct Incorrect
00 MGL-01 100 WT/WT 98 196 0 2 2 2
00 MGL-02 100 20210/WT 98 196 0 2 2 2
00 MGL-03 100 WT/WT 100 200 0
00 MGL-16 123 20210/20210 118 20210/20210 236 0 3 3 3 2 0 4
00 MGL-17 123 WT/WT 123 246 0
00 MGL-18 123 WT/WT 123 246 0
Totals 2000 1338 alleles 1327 11
Reported Alleles Distribution
WT/WT 20210/WT
20210/WT WT/WT
WT/WT
20210/WT WT/WT
WT/WT
WT/WT
Sensitivity 100+246 Specificity 200+100+200+246+246
VTE – 2004 - 3 Analytic Validity 2-18

Table 2-16. Computations for the 2001 ACMG/CAP Proficiency Testing Surveys: Prothrombin G20210A Mutation
Labs Genotype Correct Incorrect
01 MGL-01 139 WT/WT 139 278 0
01 MGL-02 138 20210/WT 135 270 0 3 3 3
01 MGL-03 139 WT/WT 137 274 0 2 2 2
01 MGL-16 134 WT/WT 134 268 0
01 MGL-17 134 20210/20210 133 20210/20210 266 0 1 1 1
01 MGL-18 134 20210/WT 133 266 0 1 20210/20210 1 1
Totals 2001 1636 alleles 1629 7
138+268+134 Specificity 278+138+278+268+134
Totals 99-01 3070 alleles 3046 24
Reported Alleles Distribution
WT/WT
20210/WT WT/WT
WT/WT 20210/WT
WT/WT
20210/WT
20210/WT
Sensitivity
VTE – 2004 - 3 Analytic Validity 2-19

Table 2-17. Computations for the 2002 ACMG/CAP Proficiency Testing Surveys: Prothrombin G20210A Mutation
Labs Genotype Correct Incorrect
02 MGL-01 154 WT/WT 154 308 0
02 MGL-02 153 20210/WT 153 306 0
02 MGL-03 154 WT/WT 154 308 0
02 MGL-13 171 WT/WT 171 342 0
02 MGL-14 170 20210/20210 168 20210/20210 336 0 2 2 2
02 MGL-15 171 WT/WT 171 342 0
Totals 2002 1946 alleles 1944 2
153+340 Specificity 308+153+308+342+342
Reported Alleles Distribution
WT/WT
20210/WT
WT/WT
WT/WT
20210/WT
WT/WT
Sensitivity
VTE – 2004 - 3 Analytic Validity 2-20

Table 2-18. Computations for the 2003 ACMG/CAP Proficiency Testing Surveys: Prothrombin G20210A Mutation
Labs Genotype Correct Incorrect
03 MGL-01 181 WT/WT 180 360 0 1 1 1
03 MGL-02 180 20210/WT 179 358 0
1 1 1
03 MGL-03 181 WT/WT 181 362 0
Totals 2003 1084 alleles 1082 2
180 Specificity 362+180+362
Totals 99-03 6092 alleles 6063 29
Reported Alleles Distribution
WT/WT 20212/WT
20210/WT WT/WT
WT/WT
Sensitivity
VTE – 2004 - 3 Analytic Validity 2-21

ANALYTIC VALIDITY
Question 11:
Summary
• •
such as CLIA, CAP or New York State
Definition Internal quality controlworking properly.
•
• • To the
applied and well understood.
quality control procedures. Given that the
Is an internal quality control program defined and externally monitored?
Internal quality control procedures are well described in several published sources External monitoring is provided through inspections conducted by accrediting organizations
is a set of laboratory procedures designed to ensure that the test method is An internal quality control program includes documentation that high
standards are being practiced to ensure that: reagents used in all aspects of genetic testing are of high quality to allow successful test completion, all equipment is properly calibrated and maintained, good laboratory practices are being applied at every level of genetic testing. extent possible, all steps of the testing process must be controlled.
Quality control procedures Techniques that are used for analyzing DNA for factor V Leiden and prothrombin G20210A mutations are the same as those used for other molecular testing. These techniques are widely
As a result, it has been possible to design and publish generic internal quality control procedures, which many molecular laboratories already have in place. Table 2-19 lists published guidelines that, among other topics, describe reagent quality control, equipment calibration and maintenance, education of the technical staff, and other internal
The purpose of the quality control procedures is to rigorously control all steps of the DNA testing process to minimize the potential for test failure. internal procedures for establishing and maintaining good laboratory practice are readily available (Neumaier et al., 1998), the important next step will be to encourage, assist, and require laboratories to apply and document appropriate quality control procedures.
VTE – 2004 - 3 Analytic Validity 2-22

Table 2-19. Guidelines, Recommendations, and Checklists that Address Internal Quality Control Issues and Requirements.
Source / Reference
Federal Register 1992;57:7002-3
Genetic Testing Under CLIA
Molecular Diagnostic Methods for Genetic Diseases: Approved Guidelines Standards MM1-A Vol 20 #7
www.cap.org
Genet Med 3: 139148.
External monitoring
genetic testing laboratories than CLIA is in the process of
Guidelines, Recommendations and Checklists
Clinical Laboratory Improvement Amendments of 1988
Federal Register 2000;65: 25928-24934
New York State Laboratory Standards (9/00) www.wadsworth.org/labcert/download.htm
National Committee for Clinical Laboratory
College of American Pathologists Checklist
Standards and Guidelines for Clinical Genetics Testing American College of Medical Genetics www.faseb.org/genetics/acmg/stds
American College of Medical Genetics Guidelines Grody WW, Griffin JH, Taylor AK, Korf R, Heit JA. 2001. American College of Medical Genetics consensus statement on factor V Leiden mutation testing.
All clinical laboratories performing genetic testing must comply with general regulations under the Clinical Laboratory Improvement Amendments (CLIA) and a CLIA certification should be considered the minimum acceptable level of external monitoring. One shortcoming of having only a CLIA certification is that CLIA inspectors often have less experience in evaluating
other certifying organizations. upgrading its regulations regarding genetic testing. The Task Force on Genetic Testing concluded that the current CLIA requirements are insufficient to ensure quality of molecular genetic testing. Laboratories certified by CAP or by New York State Health Department will have undergone a more rigorous external monitoring that requires specific procedures and documentation.
References: Holtzman NA, Watson MS. 1997. Promoting Safe and Effective Genetic Testing in the United
States. Final report of the Task Force on Genetic Testing. http://www.nhgri.nih.gov /ELSI/TFGT_final/, pp. 1-72.
Neumaier M, Braun A, Wagener N. 1998. Fundamentals of quality assessment of molecular amplification methods in clinical diagnosis. Clin Chem 44:12-26.
VTE – 2004 - 3 Analytic Validity 2-23

ANALYTIC VALIDITY
Question 12:
Summary
•
G20210A mutations •
•
variety of technologies.
An earlier
inspections by certifying agencies.
Have repeated measurements been made on specimens?
Having information about repeated measurements on the same specimen is important for determining the type and rate of errors in detecting factor V Leiden and prothrombin
External proficiency testing programs are the only available source of data for repeated measurements on the same specimen by multiple laboratories All clinical laboratories test control samples repeatedly, but results are not usually reported
Measurements made on the same specimen in different laboratories Multiple laboratories have made repeated measurements on the same specimen, utilizing a
A collaborative external proficiency testing program, jointly administered by the American College of Medical Genetics and the College of American Pathologists (ACMG/CAP) provides up to six factor V Leiden and prothrombin G20210A mutation DNA challenges each year, along with a summary report of the results. section in Analytic Validity (Questions 9 and 10) provides more details about the results of this program. In summary, the between-laboratory replication of a single specimen’s genotype for factor V Leiden is between 98.9 percent and 99.9 percent and for prothrombin G20210A mutation is between 93.7 percent and 99.9 percent (see Tables 2-1 and 2-2).
Measurements made repeatedly on the same sample within a laboratory It is common practice for repeated measurements to be made on the same specimen (a control specimen) within a laboratory. For each assay, a positive control is usually included for testing. This internal documentation will remain within the laboratory but will be available for on-site
Thus, one avenue for collection of these data would again be to use laboratory survey instruments. This type of quality control information is not currently accessible for this review.
VTE – 2004 - 3 Analytic Validity 2-24

ANALYTIC VALIDITY
since such testing is qualitative.
Question 13. What is the within- and between-laboratory precision?
This question is not applicable to factor V Leiden and prothrombin G20210A mutation analysis, This question is only relevant to quantitative measurements.
VTE – 2004 - 3 Analytic Validity 2-25

ANALYTIC VALIDITY
Question 14:
Summary
• ) •
• • •
Definition
If the
be sufficient to identify and correct the error. Given that proficiency testing in Europe found 90
If appropriate, how is confirmatory testing performed?
Confirmatory testing is additional testing to confirm the finding of a mutation(sSuch testing should be considered when a factor V Leiden or prothrombin G20210A mutation is identified It can be useful for identifying occasional false positive test results There is little information about how often confirmatory testing corrects an error The type of confirmatory testing depends on the clinical circumstances, sample type and testing methodology
Confirmatory testing is performed to ensure that the initially positive test result is correct.
Importance of confirmatory testing The analytic specificity is currently estimated to be 99.7 percent for factor V Leiden and 99.8 percent for prothrombin G20210A mutation (Question 10). It is important, therefore, to determine how often ‘false positive’ results will be identified upon confirmatory testing. error is due to clerical or laboratory sample mix-up, simple retesting of an additional aliquot may
percent of the errors to be of this type (Dequeker and Cassiman, 2000), confirmatory testing can be expected to eliminate many of the false positive results. This issue is dealt with in more detail under Clinical Validity (Questions 21 and 22).
In the thrombosis clinic at the University of Vermont Medical School, confirmatory testing for factor V Leiden is not done. At Leiden University Medical Center’s clinical laboratory, the genotype of factor V Leiden is determined by PCR, and a random sample is retested (personal communication Carla Vossen, Astrid van Hylckama Vlieg).
At times, testing for activated Protein C (APC) resistance may be used as a substitute for DNA testing, or as a confirmatory test once a mutation has been found. The factor V Leiden mutation leads to a decreased response of plasma to the anticoagulant action of activated Protein C, socalled APC resistance. Several methods for the detection of APC resistance have been developed including, a partial thromboplastin time-based test. However, APC resistance is not caused exclusively by the factor V Leiden mutation. Recently de Visser et al (1999) described an increased risk of venous thrombosis due to APC resistance in the absence of the factor V Leiden mutation. In this situation, DNA analysis can be performed to identify cases with factor V Leiden (Bertina, 1994).
VTE – 2004 - 3 Analytic Validity 2-26

Gap in Knowledge: Performance of Confirmatory Testing
l setting.
mutations.
References
2000. Am J Hum Genet 67:A274.
et al. 1994.
Nature 369:64-67.
Blood 93:1271-1276.
Little or no information has been found on the application of confirmatory testing to identify false positive test results in a clinica According to proficiency testing data, these false positive results should occur and might be identified as part of routine confirmatory testing of individuals found to be positive for factor V Leiden or prothrombin G20210A
Dequeker E, Cassiman J. Genetic Proficiency testing in diagnostic laboratories – quality control is the message.
Bertina RM, Koeleman BP, Koster T, Rosendaal FR, Dirven RJ, de Ronde H, Mutation in blood coagulation factor V associated with resistance to activated protein C.
de Visser MCH, Rosendaal FR, Bertina RM. 1999. A reduced sensitivity for activated protein C in the absence of factor V Leiden increases the risk of venous thrombosis.
VTE – 2004 - 3 Analytic Validity 2-27

ANALYTIC VALIDITY
Question 15:
Summary
• •
•
• •
., 1996; Loader ., 1996; et al., 1996; Grody et al., 1997).
et al., 1998). et al., 1998). In an
What types of patient samples have been tested?
Both whole blood and buccal lysates are acceptable for screening Blood samples are more expensive and require collection at a medical facility, but are associated with more generous amounts of high quality DNA. Buccal lysates are less expensive and can be collected at home, but are associated with smaller amounts of lower quality DNA.
Factor V Leiden and prothrombin G20210A mutation analysis has been successfully performed in a variety of specimens using available methodologies.
Testing can be performed on: whole blood (purified DNA and lysates), buccal lysates (cheekbrush, swab and mouthwash)
Blood samples are the most reliable method of collecting large amounts of high quality DNA, but a trained phlebotomist is needed, thereby increasing costs and requiring that specimens be collected at a medical facility. Buccal cells obtained by scraping, brushing or mouthwash yield adequate amounts of DNA for screening purposes (Doherty et al et alWitt This technique can be used to collect samples at the physician’s office or at home. Buccal samples have the disadvantage of less DNA, higher failure rates, and less documentation of chain of custody. Buccal lysates can be frozen and stored for years and still be tested successfully (Bradley A comparison of test results from blood and buccal mouthwash samples showed consistent results (Baty informal survey of commercial laboratories offering factor V Leiden and prothrombin G20210A mutation testing, all accepted both blood and buccal specimens (W Allan, personal communication).
References
Baty D, Terron KA, Mechan D, Harris A, Pippard MJ, Goudie D. 1998. Development of a multiplex ARMS test for mutations in the HFE gene associated with hereditary hemochromatosis. J Clin Pathol 51:73-74.
Bradley LA, Johnson DD, Palomaki GE, Haddow JE, Robertson NH, Ferrie RM. 1998. Hereditary haemochromatosis mutation frequencies in the general population. J Med Screen 5:34-36.
Doherty RA, Palomaki GE, Kloza EM, Erickson JL, and Haddow JE. 1996. Couple-based prenatal screening for cystic fibrosis in primary care settings. Prenat Diagn 16:307-404.
VTE – 2004 - 3 Analytic Validity 2-28

Grody WW, Dunkel-Schetter C, Tatsugawa ZH, Fox MA, Fang CY, Cantor RM, et al. 1997. PCR-based screening for cystic fibrosis carrier mutations in an ethnically diverse pregnant population. Am J Hum Genet 60:935-947.
et al. 1996. Cystic 59:234-
247. et al. 1996. Cystic fibrosis
. Am J Hum Genet 58:823-835.
Loader S, Caldwell P, Kozyra A, Lenenkron JC, Boehm CD, Kazazian HH, fibrosis carrier population screening in the primary care setting. Am J Hum Genet
Witt DR, Schaefer C, Hallam P, Wi S, Blumberg B, Fishbach A, heterozygote screening in 5,161 pregnant women
VTE – 2004 - 3 Analytic Validity 2-29
ANALYTIC VALIDITY
Question 16:
Summary
• into pre-analytic, analytic and post-analytic phases
• appropriateness of testing.
•
• •
Table 2-20
Table 2-20. factor V Leiden or Prothrombin G20210A Testing
None
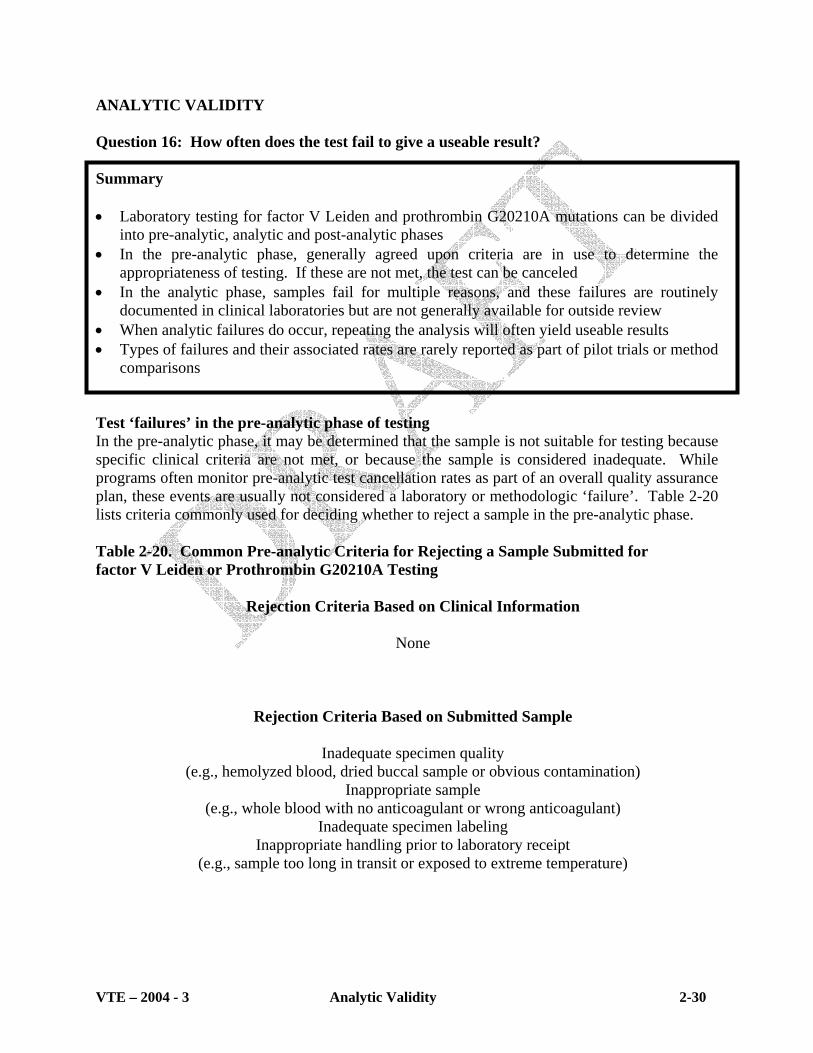
How often does the test fail to give a useable result?
Laboratory testing for factor V Leiden and prothrombin G20210A mutations can be divided
In the pre-analytic phase, generally agreed upon criteria are in use to determine the If these are not met, the test can be canceled
In the analytic phase, samples fail for multiple reasons, and these failures are routinely documented in clinical laboratories but are not generally available for outside review When analytic failures do occur, repeating the analysis will often yield useable results Types of failures and their associated rates are rarely reported as part of pilot trials or method comparisons
Test ‘failures’ in the pre-analytic phase of testing In the pre-analytic phase, it may be determined that the sample is not suitable for testing because specific clinical criteria are not met, or because the sample is considered inadequate. While programs often monitor pre-analytic test cancellation rates as part of an overall quality assurance plan, these events are usually not considered a laboratory or methodologic ‘failure’. lists criteria commonly used for deciding whether to reject a sample in the pre-analytic phase.
Common Pre-analytic Criteria for Rejecting a Sample Submitted for
Rejection Criteria Based on Clinical Information
Rejection Criteria Based on Submitted Sample
Inadequate specimen quality (e.g., hemolyzed blood, dried buccal sample or obvious contamination)
Inappropriate sample (e.g., whole blood with no anticoagulant or wrong anticoagulant)
Inadequate specimen labeling Inappropriate handling prior to laboratory receipt
(e.g., sample too long in transit or exposed to extreme temperature)
VTE – 2004 - 3 Analytic Validity 2-30

Test failures during the analytic phase of testing Failures of individual samples or assays occur when preset quality control standards are not met
Many assay
Only a
regulatory agencies such as CLIA and CAP.
can often yield a satisfactory result.
Clinical Utility Section (Question 34).
For this reason, this type of
and test results are not reportable. Failures can arise for a number of reasons such as improperly processed samples, problems with component reagents, or equipment malfunction. failures within the clinical molecular genetic laboratory are due to operator error. Automation and programs to properly train laboratory personnel can avoid most of these problems. few medical technology programs, however, currently provide adequate molecular components in their programs. Documentation of failures and subsequent corrective action is required by
Unfortunately, failure rates and other information on assay robustness are often not published as part of pilot trials or method evaluations. Available data suggest, however, that repeating the analysis of an individual sample or assay run
An irretrievable assay failure occurs when an apparently suitable specimen is submitted and approved for testing, but the assay yields a result that is clinically uninterpretable. Failures of this type are most often related to the quality of the original sample. Procedural problems during specimen processing and DNA extraction can also be responsible. Success rates for obtaining clinically interpretable results are close to 100 percent for blood samples. Buccal samples have a somewhat lower success rate as a result of poor sampling (inadequate number of cells), sample contamination, desiccation (exposure to extreme heat), or inadequate sensitivity of the testing methodology to account for the lower concentration and quality of the sample.
Test failures in the pot-analytic phase of testing Post-analytic failures, such as incorrect or inadequately interpreted results are considered separately from analytic test failures, as part of a review of overall quality assurance in the
Gap in Knowledge: Overall, and method-specific failure rates- Clinical laboratories are required to document test failures, as described above. information should be readily available from laboratories participating in external proficiency testing administered by the ACMG/CAP. Gathering this information could be accomplished though the use of a supplemental question attached to a routine distribution or, alternatively, the data could be collected via an externally funded, independent project.
VTE – 2004 - 3 Analytic Validity 2-31

ANALYTIC VALIDITY
Summary
•
•
•
account.
Even if available, such
To
Question 17: How similar are results obtained in different laboratories?
Data derived from external proficiency testing can be used to judge the consistency of results from different laboratories Stratification of results by methodology does not currently yield reliable information because of the small number of laboratories participating in proficiency testing and the large number of methodologies, Overall, the results from multiple laboratories appear to be similar, regardless of the methodology used, if the panel of mutations employed by individual laboratories is taken into
Comparing results from different laboratories using the same or similar methodologies The only potential source of data for evaluating differences in factor V Leiden or prothrombin G20210A mutation tests result from multiple laboratories using the same (or a similar) method would be derived from external proficiency testing. However, the relatively small number of participants and the relatively large number of methods (Table 2-21) preclude obtaining meaningful method-specific analyses. comparisons might be complicated, because laboratories in the same methodological category may be using different commercial or in-house reagent components and protocols. For example, although three laboratories might be grouped under the ARMS™ methodology, one might use a prepared kit, a second might use commercially prepared ASRs (analyte specific reagents), and the third might use in-house reagents. Each may also be targeting a different set of mutations. All of these factors would make the comparison nearly equivalent to comparing different methodologies. help in comparing methodologies, the ACMG/CAP MGL Survey Reports might consider stratifying results into broad methodological categories.
Analytic methodologies used for factor V Leiden and prothrombin G20210A mutation analysis Table 2-21 lists categories of methodologies that are used to detect factor V Leiden and prothrombin G20210A mutations by laboratories participating in proficiency testing programs in the United States (ACMG/CAP MGL Survey), along with the proportions using each method. Because many laboratories utilize “home brew” assays, these categories are not homogeneous.
VTE – 2004 - 3 Analytic Validity 2-32

Table 2-21. Testing Methods Utilized by 189 US Laboratories Performing factor V Leiden
Analysis According to External Surveys for 2003
Testing Method FVL )
PRO )
and gel electrophoresis 54 (28) 42 (23)
Invader Assay 61 (32) 58 (32) Allele-specific PCR/ARMS 20 (10) 16 (9)
LightCycler 36 (19) 36 (20)
and gel electrophoresis
5 (3) 18 (10)
4 (2) 4 (2) 9 (5) 7 (4)
References
College of
Mutation Analysis and 181 US Laboratories Performing Prothrombin G20210A Mutation
N (% N (%
PCR with restriction endonuclease digestion
PCR with mismatched primer introducing allele-specific restriction enzyme site
PCR followed by allele-specific hybridization Other methods
ACMG/CAP Molecular Genetics Survey Sets (1999, 2000, 2001, 2002, 2003) American Pathologists, Northfield, IL.
VTE – 2004 - 3 Analytic Validity 2-33