Venn Diagrams - University of Notre Damedgalvin1/10120/10120_S16/Topic02_6p... · 2016-01-12 ·...
31
Venn Diagrams We can visual subsets of a universal set, and how they interact/overlap, using Venn diagrams, as shown below. On the left, the brown shaded region is A ∩ B. It is also (A 0 ∪ B 0 ) 0 . On the right, the shaded area is A ∩ B.
Transcript of Venn Diagrams - University of Notre Damedgalvin1/10120/10120_S16/Topic02_6p... · 2016-01-12 ·...

Venn Diagrams
We can visual subsets of a universal set, and how theyinteract/overlap, using Venn diagrams, as shown below.
On the left, the brown shaded region is A ∩B. It is also(A′ ∪B′)′. On the right, the shaded area is A ∩B.

Venn Diagrams
Some more examples:

Venn Diagrams

Compute the elements of various subsets
Example If A = {1, 2, 3, 4}, B = {2, 4, 6, 8} andC = {3, 4, 5, 6} are subsets of the universal setU = {1, 2, 3, . . . , 10}, list the elements of the setA′ ∪ (B ∩ C).
A′ = {5, 6, 7, 8, 9, 10}, B ∩ C = {4, 6} soA′ ∪ (B ∩ C) = {4, 5, 6, 7, 8, 9, 10}.

Venn diagrams for presentations
Venn diagrams using two or three sets are often used inpresentations.

Venn diagrams for presentations
Venn diagrams of more sets are possible, but tend to beconfusing as a presentation tool because of the number ofpossible interactions. The following diagrams show Venndiagrams for five sets on the left and for 7 sets on the right.
09/07/2006 10:31 PM5-VD-ellipses-colour.gif 404!396 pixels
Page 1 of 1http://www.combinatorics.org/Surveys/ds5/gifs/5-VD-ellipses-colour.gif
09/07/2006 10:36 PMAdelaideColor.gif 595!599 pixels
Page 1 of 1http://www.combinatorics.org/Surveys/ds5/gifs/AdelaideColor.gif

The Inclusion-Exclusion PrincipleFor any finite set, S, we let n (S) denote the number ofobjects in S.
Example If A = {1, 2, 3, 4, 5, 6, 7} andB = {5, 6, 7, 8, 9, 10} then n(A) = 7 and n(B) = 6
The Inclusion Exclusion Principle
n (A ∪B) = n (A) + n (B)− n (A ∩B) .
Example Check that this works for A and B from theexample above.
A ∪B = {1, 2, 3, 4, 5, 6, 7, 8, 9, 10}, n (A ∪B) = 10.A ∩B = {5, 6, 7}, n (A ∩B) = 3.
10 = 7 + 6− 3

The Inclusion-Exclusion PrincipleNote that if two sets A and B do not intersect, thenn (A ∩B) = 0 and hence n (A ∪B) = n (A) + n (B).
Formula 1 Now apply this to a set and its complement toget
n (A′) = n (Ac) = n (U)− n (A)
where U is the universal set.
Formula 2 The shaded region below is A ∩Bc and(A ∩Bc) ∩ (A ∩B) = ∅ so
n (A ∩Bc) = n (A)− n (A ∩B)

Venn diagrams and the Inclusion Exclusion Principle
We can sometimes use the inclusion-exclusion principleeither as an algebraic or a geometric tool to solve aproblem. We can use a Venn diagram to show the numberof elements in each basic region to display how the numbersin each set are distributed among its parts.

Venn diagrams and the Inclusion Exclusion Principle
With A = {1, 2, 3, 4, 5, 6, 7}, B = {5, 6, 7, 8, 9, 10} as abovewe saw that n (A ∩B) = 3, hence the 3 in the region ofintersection, the yellow bit.
I Since n (A) = 7, formula 2 says that for the magentaregion, n (A ∩Bc) = 7− 3.
I Similarly, since n (B) = 6, formula 2 says that for thegreen region n (Ac ∩B) = 6− 3.
I Note 10 = n (A ∪B) = 4 + 3 + 3.

More Inclusion-Exclusion
In general, the Inclusion-Exclusion Principle is an equationrelating four numbers. Hence if you know three of them,you can work out the fourth.
Example Let A and B be sets, such that n (A) = 10 andn (B) = 12 and n (A ∪B) = 15, then how many elementsare in the set A ∩B?
n (A ∪B) = n (A) + n (B)− n (A ∩B) so15 = 10 + 12− n (A ∩B) OR n (A ∩B) = 7.

More Inclusion-Exclusion
Example Let A and B be sets, such that n (A ∪B) = 20,n (B) = 10 and n (A ∩B) = 5, then how many elements arein the set A? (Solve this using both methods: algebra anda Venn diagram)
Algebra: n (A ∪B) = n (A) + n (B)− n (A ∩B) so20 = n (A) + 10− 5 OR n (A) = 15.

More Inclusion-Exclusion
Geometric:

More Inclusion-ExclusionExample A survey of a group of students, revealed that 60of them liked at least one of the cereals, Frosted Flakes orLucky Charms. If 50 of them liked Frosted Flakes and 46 ofthem liked Lucky Charms,
(a) How many of them liked both cereals?n (FF ) = 50; n (LC) = 46; n (FF ∪ LC) = 60 son (FF ∩ LC) = 50 + 46− 60 = 36.
(b) Draw a Venn diagramshowing the results of thesurvey.
(c) How many students liked Frosted Flakes but did notlike Lucky Charms?

More Inclusion-Exclusion
Example A survey of 70 students revealed that 64 ofthem liked to learn visually. How many of them did not liketo learn visually?By formula 1, the answer is 70− 64 = 6.
Example 68 students were interviewed about theirmusic preferences. 66 of them liked at least one of themusic types, Rap, Classical and Eighties. How many didn’tlike any of the above music types?n (R ∪ C ∪ E) = 66 and n (U) = 68, so by formula 1, thennumber who didn’t like any of the above music types is
n((R ∪ C ∪ E)c
)= 68− 66 = 2.

More Inclusion-Exclusion
Example In a survey of 70 students on Movie preferences,the students were asked whether they liked the movies“The Breakfast Club” and “Ferris Bueller’s Day Off”. (Allstudents had seen both movies and the only options foranswers were like/dislike.) 50 of the students said theyliked “The Breakfast Club” and 25 of them said they didn’tlike “Ferris Bueller’s Day Off”. All students liked at leastone of the movies.(a) How many students said they liked both movies?(b) Display the survey results on a Venn diagram.

More Inclusion-Exclusion
n (U) = 70.
From Figure 3 we see 45 =n (U)−n (DOc) students didlike “Ferris Bueller’s DayOff”.
Fill in the Venn dia-gram.
For part (a),25.

More Inclusion-Exclusion
Example In a survey of a group of 70 movie-goers, 62 likedthe movie “Catching Fire”, 42 liked the movie “Divergent”and 39 liked both movies.
(a) Represent this information on a Venn Diagram.
(b) Use the Venn diagram to find how many of thosesurveyed did not like either movie. 5.
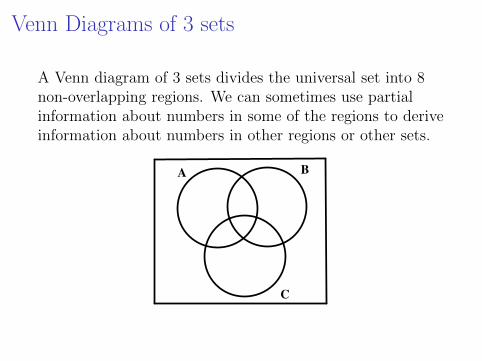
Venn Diagrams of 3 sets
A Venn diagram of 3 sets divides the universal set into 8non-overlapping regions. We can sometimes use partialinformation about numbers in some of the regions to deriveinformation about numbers in other regions or other sets.
C
BA

Venn Diagrams of 3 sets
Example The following Venn diagram shows the numberof elements in each region for the sets A,B and C whichare subsets of the universal set U .
32
610
14
3
2
C
BAFind the number of elementsin each of the following sets:
(a) A ∩B ∩ C 2
(b) B′ 3 + 2 + 4 + 10 = 19
(c) A ∩B 3 + 2 = 5
(d) C 2 + 4 + 2 + 1 = 9
(e) B ∪ C 9 + 3 + 6 = 18

Venn Diagrams of 3 setsExample In a survey of a group of 68 Finite Mathstudents, 62 liked the movie “The Fault in our Stars”, 42liked the movie “The Spectacular Now” and 55 liked themovie “The Perks of Being a Wallflower”. 32 of them likedall 3 movies, 39 of them liked both “The Fault in OurStars” and “The Spectacular Now”, 35 of them liked both“The Spectacular Now” and “The Perks of Being aWallflower” and 49 of them liked both “The Fault in OurStars” and “The Perks of Being a Wallflower”. Representthis information on a Venn Diagram. n (U) = 68;
n (F ) = 62; n (S) = 42; n (P ) = 55. n (F ∩ S) = 39;n (P ∩ S) = 35; n (F ∩ P ) = 49. n (F ∩ S ∩ P ) = 32.

Venn Diagrams of 3 sets
Example In a survey of a group of 68 Finite Mathstudents (Spring 2006), 50 said they liked Frosted Flakes,49 said they liked Cheerios and 46 said they liked LuckyCharms. 27 said they liked all three, 39 said they likedFrosted Flakes and Cheerios, 33 said they liked Cheeriosand Lucky Charms and 36 said they liked Frosted Flakesand Lucky Charms. Represent this information on a VennDiagram. How many didn’t like any of the cerealsmentioned? n (U) = 68; n (FF ) = 50; n (Ch) = 49;n (LC) = 46. n (FF ∩ Ch) = 39; n (LC ∩ Ch) = 33;n (FF ∩ LC) = 36. n (FF ∩ Ch ∩ LC) = 27.

Venn Diagrams of 3 setsExample The results of a survey of 68 Finite Mathstudents(Spring 2006) on learning preferences were asfollows: 64 liked to learn visually, 50 liked learning throughlistening and 36 liked learning Kinesthetically. 21 likedusing all three channels, 47 liked to learn visually andthrough listening, 35 liked to learn both visually andkinesthetically, 21 liked to learn through listening andkinesthetically. How many preferred only visual learning?n (U) = 68; n (V ) = 64; n (L) = 50; n (K) = 36;n (V ∩ L) = 47; n (V ∩K) = 35; n (L ∩K) = 21.n (V ∩ L ∩K) = 21.

Old Exam questions for Review1 In a group of 30 people, 15 run, 13 swim, 13 cycle, 5run and swim, 8 cycle and swim, 9 run and cycle, and 5 doall three activities. How many of the 30 people neither runnor cycle?
(a) 8 (b) 10 (c) 9 (d) 12 (e) 11
n (U) = 30; n (R) = 15; n (S) = 13; n (C) = 13.n (R ∩ S) = 5; n (C ∩ S) = 8; n (R ∩ C) = 9.R ∩ C ∩ S = 5.
Answer is 6 + 5 = 11 or (e)

Old Exam questions for Review
2 Out of 50 students who exercise regularly, 25 jog, 20 playbasketball and 15 swim. 10 play basketball and jog, 5 playbasketball and swim, 7 jog and swim and 2 people do allthree. How many students do not do any of these activities?
(a) 10 (b) 15 (c) 4 (d) 0 (e) 2n (U) = 50; n (J) = 25; n (B) = 20; n (S) = 15.n (B ∩ J) = 10; n (B ∩ S) = 5; n (J ∩ S) = 7;n (B ∩ J ∩ S) = 2;
Answer is 10 or (a)

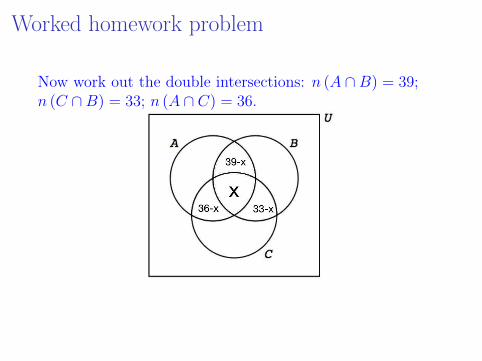
Worked homework problemHere is an example of a type of problem from thehomework. Given 3 subsets A, B and C of a universal setU , suppose n (U) = 68; n (A ∪B ∪ C) = 64; n (A) = 50;n (B) = 49; n (C) = 46. n (A ∩B) = 39; n (C ∩B) = 33;n (A ∩ C) = 36. Fill in the Venn diagram.
We do not know n (A ∩B ∩ C) or this would just beanother example of earlier problems.

Worked homework problem
Denote n (A ∩B ∩ C) by x.
Worked homework problem
Now work out the double intersections: n (A ∩B) = 39;n (C ∩B) = 33; n (A ∩ C) = 36.

Worked homework problemNow work out the sets: n (A) = 50; n (B) = 49; n (C) = 46.
For example, if y denotes the part of A outside of B ∪ C,
50 = y + (39− x) + (36− x) + x = y + 75− x
soy = x− 25
The others are similar.

Worked homework problem
Since
64 =n (A ∪B ∪ C) = x + (39− x) + (36− x) + (33− x)
+ (x− 25) + (x− 23) + (x− 23) = x + (108− 71) =
x + 37
Hence n ((A ∪B ∪ C)c) = 68− 64 = 4.

Worked homework problem