VEMN Merrimack River Watershed Study Design Workbook Study Design Workbo… · VEMN Merrimack River...
124
. VEMN Merrimack River Watershed Study Design Workbook Final Report November, 1997 Prepared by: The Volunteer Environmental Monitoring Network with assistance from River Watch Network C/O Merrimack River Watershed Council 56 Island Street P.O. Box 1377 Lawrence, MA 01842 This project was funded through a grant from EPA Region I (X 001885) to the New England Interstate Water Pollution Control Commission (NEIWPCC) for the Merrimack River Initiative (MRI). This report was prepared using the best available information and technology at the time.
Transcript of VEMN Merrimack River Watershed Study Design Workbook Study Design Workbo… · VEMN Merrimack River...
.
VEMN Merrimack River Watershed
Study Design Workbook
Final Report
November, 1997
Prepared by:
The Volunteer Environmental Monitoring Network with assistance from River Watch Network
C/O Merrimack River Watershed Council 56 Island Street P.O. Box 1377
Lawrence, MA 01842
This project was funded through a grant from EPA Region I (X 001885) to the New England Interstate Water Pollution Control Commission (NEIWPCC) for the Merrimack River Initiative (MRI). This report was prepared using the best available information and technology at the time.
Merrimack River Watershed Study Design Workbook i
THE MERRIMACK RIVER INITIATIVE
The Merrimack River Initiative began in 1988 as an agreement between the U.S. Environmental Protection Agency, the State of New Hampshire, the Commonwealth of Massachusetts, and the New England Interstate Water Pollution Control Commission to collaborate on water quality issues. This initiated a dialogue to examine issues and problems in the watershed, thereby resulting in a proposal for funding and further work toward expanding the watershed approach. The watershed approach is different from other water resource planning efforts in several ways. First, the approach is "resource based" using the watershed as the management unit rather than looking at a specific portion of a river, as is usually the case. This allows planners to examine the cumulative impact of all activity in the watershed. Second, it strives to be a holistic approach. It considers issues of surface and groundwater quality and quantity along with human use and natural functions in the watershed. Lastly, it builds partnerships. The Initiative brings together public and private groups, state and federal agencies, industry and environmental groups all with a common goal.
For more information contact:
NEIWPCC, 255 Ballardvale Street, 2nd Floor, Wilmington, MA 01887 U.S. EPA Library, One Congress Street, Boston, MA 02114 Riverways Program, MA DFWELE, 1 00 Cambridge Street, Room 1901, Boston, MA 02202 NH DES, P.O. Box 95, Hazen Drive, Concord, NH 03301 NH OSP, 2 1/2 Beacon Street, Concord, NH 03301 MRWC, 56 Island Street, P. 0. Box 1377, Lawrence, MA 01840 Lakes Region Planning Commission, 103 Main Street, Rte. 3, Meredith, NH 03253 Central NH Regional Planning Commission, 329 Daniel Webster Hwy., Boscawen, NH 03303 Southern NH Planning Commission, University Center, 400 Commercial St., Manchester, NH 03101 Nashua Regional Planning Commission, 115 Main St., P.O. Box 847, Nashua, NH 03061 Northern Middlesex Council of Governments, Gallagher Terminal, Floor 3B, 11 5 Thorndike St., Lowell, MA 01852 Merrimack Valley Planning Commission, 160 Main Street, Haverhill, MA 01830

iiiiMerrimack River Watershed Study Design Workbook ii
Merrimack River Watershed Study Design Workbook Second Edition, November 1997
Principal Authors: • Geoff Dates, River Watch Network • Alicia Lehrer, Merrimack River Watershed Council
Contributing Authors: • Jerry Schoen, Massachusetts Water Watch Partnership • Rick McVoy, Massachusetts Department of Environmental Protection
WHAT IS THE VEMN? The Volunteer Environmental Monitoring Network (VEMN) is a program of the Merrimack River Watershed Council (MRWC). The VEMN is a collaboration among agencies, businesses, groups and individuals working to monitor restore, and maintain the ecological health of the land and waters of the Merrimack River Watershed. The overall purpose is to coordinate a network of new and existing river, lake, and watershed monitoring groups and to provide technical and organizational guidance to that network.
Volunteer river and lake monitoring groups have been active in the Merrimack Watershed and throughout New England since the 1970s. State and federal agencies have been monitoring these waters for decades. The Merrimack River Initiative (MRI) began in 1988 to examine the watershed as a whole and identify and promote actions to restore and maintain a water quality/water use balance. One of the initial recommendations of the MRI was to establish a watershedwide citizen environmental monitoring network to collect information that can be used by state and federal agencies for planning, permitting, and flagging compliance actions.
In 1994, the Merrimack River Initiative provided startup funding for the VEMN. We established two basic goals: 1) To help volunteer monitoring groups generate information that is highlyvalued
and used by a broad range of environmental decisionmakers, from individual property owners and town boards to state and federal agencies.
2) To help citizen groups maintain and enhance the value of their monitoring programs for their own chosen goals and objectives.
The MRWC offered office space and administrative support and the VEMN is now a program of the MRWC.
iiiiiiMerrimack River Watershed Study Design Workbook iii
In 1997 the MRI produced a management plan for the watershed. 1 This plan has a number of important recommendations for monitoring in the watershed: • Survey and evaluate BMPs [Best Management Practices] currently being implemented
in the watershed, • Expand water quality monitoring to focus on nonpoint source impacts, • Expand water quality monitoring programs to focus on preservation of nonimpacted
waters, and • Coordinate monitoring efforts.
This document reflects those recommendations and it provides guidance that will enable volunteer and school monitors to respond to them.
1 Merrimack River Initiative, 1997. Watershed Connections: Merrimack River Initiative Management Plan, New England Interstate Water Pollution Control Commission, Wilmington MA.
Merrimack River Watershed Study Design Workbook IV
Table of Contents
INTRODUCTION 1
What Is A Study Design? An Overview of the Process 1 Why Write a Study Design? 3 Study Design and Quality Assurance Project Plans 5 Where To Get Help 8 How To Use This Document 8
STEP 1: GETTING STARTED 10
Organizing A Technical Committee: Background Information 10 Steps To Organizing A Technical Committee: 12 Preliminary Watershed Assessment: Background Information 13 Steps To Preliminary Watershed Assessment 19 What Should Go Into Your Study Design 20 How Does This Relate to a QAPP? 20
STEP 2: WHY ARE YOU MONITORING? 21
Issues and Questions: Background Information 21 Issues and Questions In the Watershed 22 Steps To Identifying Issues and Questions 27 Users and Uses of Monitoring Information: Background Information 28 Data Quality Goals: Background Information 30 Data Uses Appropriate for the Data Quality Goals 32 Steps to Identifying Users and Uses of Monitoring Information and a Data Quality Goal 34 What Should Go Into Your Study Design: 34 How Does This Relate to a QAPP? 35
STEP 3: WHAT WILL YOU MONITOR? 35
Watershed Indicators: Background Information 35 Things To Consider In Selecting Indicators 43 Steps To Selecting Indicators 46 What Should Go Into Your Study Design: 46 How Does This Relate to a QAPP? 46
STEP 4: WHAT ARE YOUR DATA QUALITY OBJECTIVES? 48
Data Quality Objectives: Background Information 48 Steps To Setting Data Quality Objectives 52 In Your Study Design: 52 How Does This Relate to a QAPP? 53
STEP 5: HOW WILL YOU MONITOR? 54
Monitoring Methods: Background Information 54 Things To Consider In Selecting Methods: 61
Merrimack River Watershed Study Design Workbook V
Steps To Selecting Methods 63 What Should Go Into Your Study Design 64 How Does This Relate to a QAPP? 65
STEP 6: WHERE WILL YOU MONITOR? 66
General Monitoring Location Approaches: Background Information 67 Types of Monitoring Sites: Background Information 69 Practical Site Selection Considerations 73 SiteSpecific Sampling Location Considerations for Water and Benthic Macroinvertebrates 73 Where Will You Analyze Samples? 75 Steps to Selecting Monitoring Locations 77 What Should Go Into Your Study Design 78 How Does This Relate to a QAPP? 79
STEP 7: WHEN WILL YOU MONITOR? 80
Scheduling Your Monitoring: Background Information 80 Steps to Scheduling Your Monitoring 83 What Should Go Into Your Study Design 83 How Does This Relate to a QAPP? 83
STEP 8: WHAT ARE YOUR QUALITY ASSURANCE MEASURES? 84
The Basics of Quality Assurance: Background Information 86 A Closer Look At Quality Control and Evaluation 88 A Closer Look At Quality Assurance for Data Management 97 Steps to Deciding Quality Assurance 98 What Should Go Into Your Study Design 99 How Does This Relate to a QAPP? 99
STEP 9: HOW WILL YOU MANAGE, ANALYZE, AND REPORT THE DATA? 100
The Data To Information Process: Background Information 100 Steps To A Data Management, Analysis, and Reporting System 106 What Should Go Into Your Study Design 108 How Does This Relate to a QAPP? 108
STEP 10: WHAT ARE THE TASKS AND WHO WILL DO THEM? 109
Project Tasks and Organization: Background Information 109 How Does This Relate to a QAPP? 114
REFERENCES 116
Appendix 1: Study Design Worksheets
Appendix 2: VEMN River Sample Site Evaluation Sheet
Merrimack River Watershed Study Design Workbook Page 1
INTRODUCTION
In this chapter: • What Is A Study Design? An Overview of the Process • Why Write A Study Design? • Study Design and Quality Assurance Project Plans • Where To Get Help • How To use This Document
Designing a scientificallycredible and realistic monitoring effort involves making choices about the why, what, how, where, when, and who of your monitoring effort.
This document guides you through the process of developing a study design. It explains the steps you go through in deciding why, what, how, where, and when you will monitor, who will carry out the tasks, and what your quality assurance measures will be. For each step, it lists the tasks to be done, where to go to get information, and how to write up your study design.
A companion document, VEMN Guide to Volunteer Watershed Monitoring Options in the Merrimack River Watershed, provides some of the raw material you will need to make choices among the various monitoring options. It recommends specific indicators and methods, site location considerations, times of day/year and frequency, data analysis, QA/QC measures, and training needed to answer specific questions and meet specific data quality goals.
Together, these two documents should provide you with everything you need to write a study design which addresses issues important to your group and matches your human and financial resource capabilities.
WHAT IS A STUDY DESIGN? AN OVERVIEW OF THE PROCESS
A study design is a written document that describes the choices you make about why, what, where, when, who, and how you intend to monitor the water. We suggest a tenstep process:
Step 1: Getting Started Organize A Technical Committee and Do A Preliminary Watershed Assessment
Start out by forming a technical committee of people who can provide you with advice and assistance in preparing your study design and by researching the
INTRODUCTION
Merrimack River Watershed Study Design Workbook Page 2
resource conditions and issues in your watershed by doing a Preliminary Watershed Assessment.
Step 2: Why Are You Monitoring? The next step in your study design is to define the questions you would like to answer by monitoring. Why are you monitoring? What specific waterrelated questions are you trying to answer?
Step 3: What Will You Monitor?
The Merrimack River Watershed is a very complicated system of interrelated physical, chemical, and biological characteristics. The characteristics that are measurable are often referred to as “indicators. 2 ” Which indicators you choose to monitor will depend upon the question(s) you are asking as well as your available human and financial resources.
Step 4: What Are Your Data Quality Goals? Who is expected to use your monitoring information? How will they use it? How accurate does your information need to be? These are expressed in terms of data quality goals, or your general intentions and hopes for use of your data. They are listed for each survey. The one(s) that the survey addresses are checked.
Step 5: How Will You Monitor?
Determining how you will monitor involves making choices as to the appropriate monitoring approach, as well as the specific field and lab methods that you will use.
Step 6: Where Will You Monitor? Sampling locations are selected to answer your question(s). This guide lists site selection criteria for each survey.
Step 7: When Will You Monitor? Next, you will put together your sampling schedule. Since the time of day, holding frequency, and time of year sampled greatly affect your results, consider these when you establish the sampling schedule. This guide suggests the frequency, time of day and year in, and weather conditions for each survey.
Step 8: What Are Your Quality Assurance Measures?
2 The Intergovernmental Task Force on Monitoring Water Quality (ITFM) defines "environmental indicator" as follows: "A measurable feature which singly or in combination provides managerially and scientifically useful evidence of environmental and ecosystem quality or reliable evidence of trends in quality." ITFM, 1993 Report, Technical Appendixes, Appendix A.
INTRODUCTION
Merrimack River Watershed Study Design Workbook Page 3
Quality Assurance (QA) measures are the operating procedures used to assure and assess the quality of the information you collect. QA is designed to assure that the information you collect meets your data quality goals as described in Step 4. This guide suggests quality assurance measures for each indicator for each survey.
Step 9: How Will You Manage, Analyze, and Report the Data?
Dealing with data involves converting raw data into useful information that sheds light on the answers to your monitoring questions.
Step 10: What Are the Tasks and Who Will Do Them?
This chapter briefly describes the major tasks and key program personnel that might be associated with a monitoring program.
WHY WRITE A STUDY DESIGN? A study design describes your monitoring effort and the rationale behind it. We cannot emphasize enough the usefulness of preparing a written study design. A study design may be the most important step in organizing your whole monitoring effort. 3 Think of it this way: In 10 years someone is looking at your water quality data and wants to know how you came up with those numbers. This person should be able to find out by reading your study design document.
A study design serves some very important purposes for your group and to the people you hope will use your data:
• it forces you to focus on what you are trying to accomplish with your monitoring program,
• it prevents waste of time and money on equipment and procedures that are inappropriate for your group or goals,
• it allows you to select the best monitoring strategy to address the issues that are important to you and your community,
• it allows everyone who might use your data to have confidence in the results since you clearly document your sampling and analysis methods and quality assurance procedures,
• it prevents changes in personnel in your organization from destroying the continuity of your monitoring plan because anyone can read your study design and pick up where the last person left off,
• it allows your group to reevaluate your monitoring study every year and make changes as needed,
3 For information on how to organize a monitoring program, see River Watch Network’s “Program Organizing Guide,” Montpelier VT 1995 and the “Adopt a Stream Workbook” by MA Riverways Programs, Boston MA 1988.
INTRODUCTION
Merrimack River Watershed Study Design Workbook Page 4
• if you are using federal funds to monitor your waters, you will be required to prepare a “Quality Assurance Project Plan” (QAPP). You can very quickly and easily convert your study design document into a QAPP. Guidance for volunteer monitoring groups on preparing QAPPs can be found in The Volunteer Monitor’s Guide to Quality Assurance Project Plans .

INTRODUCTION
Merrimack River Watershed Study Design Workbook Page 5
STUDY DESIGN AND QUALITY ASSURANCE PROJECT PLANS
If your program is using U.S. Environmental Protection Agency (USEPA) funds, you must have an EPAapproved Quality Assurance Project Plan (QAPP) before sample collection begins. The QAPP is a written document that outlines the procedures a monitoring project will use to ensure that the samples participants collect and analyze, the data they store and manage, and the reports they write are of high enough quality to meet project needs. EPA guidance on the preparation of QAPPs is available from EPA Office of Wetlands Oceans and Watersheds in The Volunteer Monitor’s Guide to Quality Assurance Project Plans (ask for document #EPA 841B96003).
So, what’s the difference between a QAPP and a study design? Let’s take a look at the content:
The Study Design The study design is a technical document, formatted and written to be understandable to you and your group, and any one who wants to know the design of your monitoring effort. It’s focused on documenting your choices in a consistent manner, but in less detail than the QAPP. The Study Design has five main parts which document the choices you will make:
Part 1: Monitoring Rationale Background information, monitoring questions, and data quality
goals Part 2: Monitoring Design
A. Indicators B. Data Quality Objectives C. Sampling Methods D. Analytical Methods E. Sampling Site Criteria G. Sampling Sites H. Analysis Locations I. Sampling and Analysis Dates J. Time of Day for Sampling K. Weather Conditions
Part 3: Quality Assurance/Quality Control A. General Measures B. Internal and External Quality Control Measures C. Evaluation of QC Results D. Response Actions
Part 4: Data Analysis A. Information To Be Recorded On Field and Lab Sheets
INTRODUCTION
Merrimack River Watershed Study Design Workbook Page 6
B. Field and Lab Sheet Handling C. Data Entry and Validation D. Data Summary E. Data Analysis F. Reporting the Data
Part 5: Project Tasks and Personnel A. Major Tasks B. Paid and Volunteer Positions. C. Technical Committee Membership D. Training Process E. Manuals to be used
The QAPP A QAPP is a technical document formatted to meet the needs of EPA reviewers and designated data users targeted by your program. It’s focused on documenting the choices in a consistent manner among a wide variety of program types across the country. The QAPP has 23 elements:
Project Management 1) Title and Approval page 2) Table of Contents 3) Distribution List 4) Project/Task Organization 5) Problem Identification/Background 6) Project/Task Description 7) Data Quality Objectives for Measurement Data 8) Training Requirements/Certification
Measurement Data Acquisition 10) Sampling Process Design 11) Sampling Methods Requirements 12) Sample Handling and Custody Requirements 13) Analytical Methods Requirements 14) Quality Control Requirements 15) Instrument/Equipment Testing, Inspection, and Maintenance
Requirements 16) Instrument Calibration Frequency 17) Inspection/Acceptance Requirements for Supplies 18) Data Acquisition Requirements 19) Data Management
Assessment and Oversight 20) Assessment and Response Actions 21) Reports
Data Validation and Usability 22) Data Review, Validation, and Verification Requirements
INTRODUCTION
Merrimack River Watershed Study Design Workbook Page 7
23) Validation and Verification Methods 24) Reconciliation with Data Quality Objectives.
As you can see, a QAPP is very thorough and detailoriented. It describes all the details of your field and lab procedures.
INTRODUCTION
Merrimack River Watershed Study Design Workbook Page 8
Should You Do A QAPP or A Study Design? Unless you’re required to do a QAPP, we strongly suggest that you start with a study design. We think that the preparation is easier, more intuitive, and you’re less likely to get lost in the forest of details that a QAPP requires. In short, you’ll be able to focus on making good choices, rather than all the details.
Once you’ve done a study design, it’s a fairly easy step to a QAPP. Most of the elements required by a QAPP will be in your study design, but perhaps not in as much detail. To make it easier for you, if there’s a QAPP in your future, we’ve crossreferenced the study design steps in this workbook to the QAPP elements listed in the in The Volunteer Monitor’s Guide to Quality Assurance Project Plans.
If you follow the guidance in this workbook, you should be able to fairly easily prepare a QAPP, should you need one.
WHERE TO GET HELP
You need not embark on this journey alone. Help is available through the VEMN: • The VEMN staff and partners will conduct workshops on writing study designs
upon request and at regularly scheduled times. • The VEMN staff and partners are available for personal and telephone
consultations so that we may facilitate the process for any group willing to design their monitoring study.
• The VEMN Guide to Volunteer Watershed Monitoring Options in the Merrimack River Watershed can significantly reduce some of the effort of researching and describing field and laboratory methods and quality control procedures.
HOW TO USE THIS DOCUMENT
Use this document to guide you through the process of designing a study. Use the VEMN Guide to Volunteer Watershed Monitoring Options in the Merrimack River Watershed to help you choose indicators, methods, sites, frequency, training requirements, and quality assurance/quality control measures.
THE CHAPTERS
Each chapter in this workbook corresponds to a step in the study design process. In general, each chapter is organized as follows:
• Background Information: This section contains background information to help you understand what’s involved with the particular study design step.
• Steps To Making the Study Design Decisions: This section suggests the steps you might go through to make the relevant study design decisions.
• What Should Go Into the Study Design: This section lists the information that should go into your study design.
INTRODUCTION
Merrimack River Watershed Study Design Workbook Page 9
• How The Step Relates to a QAPP: The box at the end of each chapter lists the elements of a QAPP that roughly correspond to the particular section of the study design. This will help you should you need to convert your study design to a QAPP some day.
THE APPENDICES
We’ve included three appendices to help you complete your study design:
Appendix 1: Study Design Outline and Forms – This outlines the entire study design in one place. It also contains forms which you can use to manually fill in the information needed in some of the study design parts.
Appendix 2: VEMN River Sample Site Evaluation Sheet – Fill out this form when you are field checking your river sampling sites.
Good luck and don’t forget that help is a phone call away!
Merrimack River Watershed Study Design Workbook Page 10
STEP 1: GETTING STARTED
In This Chapter: • Organizing A Technical Committee: Background Information • Steps To Organizing A Technical Committee • Preliminary Watershed Assessment: Background Information • Steps To Preliminary Watershed Assessment • What Should Go Into Your Study Design • How Does This Relate To a QAPP?
You’ve got to start somewhere. We suggest starting by forming a technical committee and doing a bit of research on your watershed.
ORGANIZING A TECHNICAL COMMITTEE: BACKGROUND INFORMATION
A technical committee consists of people who can provide you with advice and assistance in a number of areas: in preparing your study design, troubleshooting problems, and interpreting your results. This committee can help you evaluate your program’s success and areas that need improvement. A technical committee is also a good way to involve and build interest from different organizations in your community for your program.
Who should be on your technical committee? They can be experts in different fields, or simply people who know your watershed well. Here are some of the agencies, organizations, and people who might be helpful on your technical committee: • NH Dept. of Environmental Services • Environmental Consulting Firms • MA Dept. of Environmental Protection • Local Planning Commissions • MA Riverways Program • Local Conservation Commissions • River Watch Network • University Cooperative Extension • MA Water Watch Partnership • Public Works Departments • Watershed Associations • Basin Teams (in MA) • MRWC’s VEMN Coordinator • Local Boards of Health • University Cooperative Extension • College and University Faculty
STEP 1: GETTING STARTED
Merrimack River Watershed Study Design Workbook Page 11
• Business Environmental Compliance • Soil and Water Conservation Districts Officers
Look at your technical committee as an interdisciplinary group that can provide your with valuable help and advice at meetings and as individual resource people you can call on for specific types of help.
STEP 1: GETTING STARTED
Merrimack River Watershed Study Design Workbook Page 12
STEPS TO ORGANIZING A TECHNICAL COMMITTEE: Step 1: Determine what expertise you need on your technical committee.
Suggested areas of expertise include: • river/lake biology • river/lake chemistry • river/lake hydrology • how state agencies work • local river/lake uses and problems • data interpretation • data management • business environmental
compliance • field and lab methods • laws and regulations
Step 2: Identify the resource people you will approach to be on your technical committee. Don’t forget local businesses, they often have environmental compliance staff who can provide good expertise and good connections with the business community.
Step 3: Clarify what the role of your technical committee will be and write up a job description for it. Include how much time you are asking from people. The technical committee might only meet when there is a technical issue to resolve, such as reviewing and commenting on your study design or helping you interpret the results. Members can be available by phone to help you figure out problems with a laboratory procedure, for example.
Sample Job Description: Technical Committee: Role: Advise project staff on the technical aspects of the
program. Responsibilities: • Decide on data use goals and data quality objectives to
address the program goals and objectives. • Develop study questions. • Review, and comment on the study design. • Recommend, review, and comment on quality
assurance/quality control procedures. • Assist staff in solving technical problems with the
monitoring. • Review and comment on drafts of manuals and training
materials • Review protocols annually and recommend changes as
needed. • Assist staff in interpreting the results. • Review and comment on reports

STEP 1: GETTING STARTED
Merrimack River Watershed Study Design Workbook Page 13
• Attend two meetings and be available as needed for advice • Commit to about 20 hours per year to review documents,
attend meetings, and provide telephone.
Step 4: Ask the resource people you identified in study design Step 2 to serve on the committee. Give or send them a copy of the job description and be clear as to what is expected of them in terms of their time and expertise. Remember, you’re asking professionals to donate services. The least you can do is let them know the extent of the donation you’re requesting so they can decide if it’s something they can do.
PRELIMINARY WATERSHED ASSESSMENT: BACKGROUND INFORMATION
Designing a watershed monitoring program requires that you learn as much as you can about environmental conditions in your watershed before you get your feet wet. This basic research will help you focus your monitoring on providing information that adds something to this body of knowledge. This research will also assure that the information you gather will be useful. To do this, we suggest that you begin with a preliminary watershed assessment.
A preliminary watershed assessment is the collection of new and existing information on conditions and processes at the watershed level. This information can be used to identify problem areas for corrective action; to decide on whether, where, and what type of monitoring is needed; and to bolster watershed awareness at all levels, from the individual landowner to state and federal permits.
A preliminary watershed assessment is actually the beginning of your monitoring. It has two parts:
1) Research Existing and Historical Conditions: a compilation of existing information from a literature search and workshops, and
2) Field Surveys: easilygathered visual observations on various watershed characteristics, conditions, and activities.
More detailed information on how to carry out a preliminary watershed assessment is contained in the Training Manual for Core VEMN Monitoring Parameters and Methods. In the next chapter (study design Step 2: “Why Are You Monitoring?”), we’ll discuss how to use this information to frame monitoring questions.
A. Research Existing and Historical Conditions
STEP 1: GETTING STARTED
Merrimack River Watershed Study Design Workbook Page 14
The focus of your research should be to try to find out what’s known about conditions now and in the past: the ecological integrity of the watershed; how the waters are being used; what special values or attributes they have; and what the threats to the ecological integrity, uses and values are.
We suggest two kinds of research techniques: 1) the literature search to find out what’s going on in the watershed and what
state regulations say conditions should be 2) uses, values, and threats workshops to find out from watershed residents
what they know about the watershed
1) LITERATURE SEARCH
A literature search involves tracking down the existing written documents that can shed light on historical and current environmental conditions in your watershed. Following are a few suggested source of this type of information: • State Water Quality Assessments (305b Reports) • Basin Plans • Special Studies (e.g. Wasteload Allocation Studies) • Discharge Monitoring Reports • US Fish and Wildlife Service or state fishery agency inventories • Regional and Municipal Plans • US Geological Survey (USGS) Topographic Maps • USGS Water Resource Data Reports • National Weather Service Climatological Data • Natural Resource Conservation Service (NRCS) Soil Survey Maps • U.S. Army Corps of Engineers hydrologic investigations • Federal Emergency Management Agency flood hazard studies • Utility reports for hydropower dam relicensing • University Research reports, especially the Water Resources Research
Institutes
The literature search should be focused on finding out what’s going on in your watershed and what state regulations say about what conditions should be like to meet management goals. These two aspects of the literature search are discussed below.
LITERATURE SEARCH : FIND OUT WHAT’S GOING ON IN YOUR WATERSHED
What’s going on in your watershed is a big topic. To help you focus, we’ve listed some specific types of information you should look for. These are organized by the parts of the watershed, from the water column to upland areas. Don’t just focus on the water itself – look at the whole watershed:
STEP 1: GETTING STARTED
Merrimack River Watershed Study Design Workbook Page 15
The Water Column Look for information on the physical, chemical, and biological conditions of the water itself. Examples include: • water clarity • current velocity • temperature • plankton • algae • bacteria • human water uses • attitudes towards the water • pollution discharges directly to • concentration of various
chemical the water elements or compounds
The River Channel or Lake Basin The river channel or lake basin extends from the top of one bank to the other. In rivers, the channel carries the surface runoff. In lakes, the basin holds the water. It includes the river or lake bed (the bottom of the channel) and the banks. Important characteristics to get information on include: • bottom and bank characteristics • rooted aquatic plant
coverage • bank vegetative cover and stability • habitat types and quality • channel and bank alteration • geomorphic processes and
changes
The Shoreline The shoreline generally extends from the top of the channel (bank) to the next height of land. It comprises the land area immediately adjacent to the river or lake that drains directly into it. Depending on the slope, this area may carry floodwater regularly and would be called a floodplain. The first height of land is frequently a formation that the river created long ago. It may be the top of an old river bank when the river was at a higher elevation – known as a river terrace. It may be a glaciallydeposited ridge. This area has a large influence on the river. Important characteristics to get information on include: • vegetative cover and type • groundwater flows to the river • types of soils or lake • habitat quality • land use types and intensity
The Corridor The corridor is generally defined as the area from the first river or lake terrace to the first ridge. This is a vague definition, especially in low gradient coastal watersheds. Think of it as the immediate valley that contains the lake or through which the river flows. Surface
STEP 1: GETTING STARTED
Merrimack River Watershed Study Design Workbook Page 16
runoff flows directly into the water body, perhaps through short intermittent channels. Important characteristics to get information on include: • amount and type of vegetation • groundwater flows to the river • land use types and intensity or lake • types of soils • habitat types and quality
Upland Areas Upland areas include the rest of the watershed. Runoff from these areas may not have the same direct impact on the water body that runoff from shorelines or channels will. Important characteristics to get information on include: • amount and type of vegetation • types of soils • land use types and intensity • groundwater flows to the
river • habitat types and quality or lake
LITERATURE SEARCH: RESEARCH YOUR STATE’S WATER QUALITY STANDARDS
This type of literature contains the rules that define the environmental conditions that must be met. Perhaps the most important documents to get a hold of are: • NH Surface Water Quality Regulations • MA Surface Water Quality Standards
The standards consist of:
Designated uses: The uses of the water – such as swimming, public water supply, fishing, aquatic life habitat, irrigation, and industrial processing and cooling – that are to be achieved and protected.
Classifications: All the waters in the watershed are segmented and each segment is assigned to a classification: A or B (in NH) and A, B, or C (in MA). Designated uses are assigned to each classification. It’s important to note that the uses assigned to each classification are not necessarily uses that are actually achieved. Rather, they are uses to be achieved and protected.

STEP 1: GETTING STARTED
Merrimack River Watershed Study Design Workbook Page 17
Criteria: For each classification, water quality criteria describe the conditions which need to be achieved in order to support the designated uses. These conditions are described for various water quality indicators such as bacteria, temperature, dissolved oxygen, pH, etc. There are two types of criteria: numerical and narrative
* Numerical Criteria specify a level or a range of levels for each indicator needed to support the designated uses for each class. For example, in New Hampshire, Class B waters can contain no more than 406 Escherichia coli bacteria per 100 mL to support swimming.
* Narrative Criteria are general statements about the conditions for each indicator needed to support the designated uses for each class. For example, for color and turbidity in Massachusetts for Class B waters: “These waters shall be free from color and turbidity in concentrations or combinations that are aesthetically objectionable or would impair any use assigned to this Class. ”
2) USES, VALUES, AND THREATS WORKSHOPS
Public workshops are a great way to involve watershed residents in your program, to learn about how your river or lake is being used, what people think is important, and problem areas. They are also a good way to build a list of potential monitoring volunteers. After all, they came to your workshop, they must be interested in the water!
Give members of your watershed communities an opportunity to help you identify waterrelated uses, special attributes and problems by holding one or more Uses, Values, and Threats Workshops. At these workshops, explain your program ideas. Then assemble the topographic maps, or some other clear base maps, that cover your watershed. Invite participants to identify and locate water use areas, special attributes and problem areas using labeled or colorcoded “postit” notes. You can learn a surprising amount about your water body through this exercise.
Examples of Uses, Values and Threats:
Uses • Swimming • Fishing • Irrigation • Public Water Supply • Waste Assimilation •
Canoeing/Kayaking Values • Aquatic Life Habitat • Flood Storage
STEP 1: GETTING STARTED
Merrimack River Watershed Study Design Workbook Page 18
• Scenic Quality • Wildlife Habitat • Unique Natural Features • Ecosystem Functions
Threats/Problems
• Channel Alterations • Pollution Discharges • Sedimentation of Aquatic Habitat • Polluted Runoff • Combined Sewer Overflows • Loss of Habitat • Conflicts Among Uses • Flow Alterations • Loss of Riparian Vegetation
B. Conduct Visual Field Surveys These involve easilygathered visual observations on various watershed characteristics, conditions, and activities There are numerous methodologies available, including the following:
• Windshield Watershed Survey for Volunteers: Massachusetts Watershed Partnership
• Shoreline Survey for Volunteers: Massachusetts Riverways Programs • Watershed nonpoint Source Evaluation and Site Assessment: University
of New Hampshire Cooperative Extension Service. • River Walk: River Watch Network and Vermont Department of
Environmental Conservation • Streamwalk: EPA Region 10
STEP 1: GETTING STARTED
Merrimack River Watershed Study Design Workbook Page 19
STEPS TO PRELIMINARY WATERSHED ASSESSMENT
Step 1: Identify and delineate your watershed area of interest. Get a map of watersheds within the Merrimack River watershed. These are available from the NH DES, the MA DEP, New England Interstate Water Pollution control Commission, and the Merrimack River Watershed Council. We suggest that you pick a watershed that you’ll be able to cover adequately with your assessment, considering your group’s resources, time availability, and energy. Delineate this on a topographic map, and use this map as your reference map.
Step 2: Research existing information on your watershed
1) Conduct a literature search: Contact government agencies and/or visit your local, regional, university, or state library to get copies of existing reports that include your river or lake. Identify the following: • Water Classifications and Designated Uses: Look at the NH or MA water
pollution control law and/or the water quality standards to find this. • Human activities that might cause problems • Land uses throughout the watershed • Evidence of problems and or conflicts • What, if anything, is being done to address problems
2) Hold a “uses, values, and threats” workshop: Identify • Actual uses • Actual values (such as important scenic or habitat areas • Actual threats – human activities that might cause problems • Reports of actual problems
Step 3: Identify the key areas, conditions and processes that you wish to monitor and where you wish to monitor them. Based on your literature search and workshops, identify a few of the key areas of the watershed where it seems as though monitoring information would be most useful. Try to identify some of the general conditions and processes you might want to monitor in the field. For example, your research might turn up the fact that there are fish kills in the late summer in a particular river reach or lake embayment and the causes are unknown. You may want to focus on those areas and processes that affect fish health.
Step 4: Select and carry out a preliminary watershed assessment field methodology. Pick a field survey tool that gathers the type of field information that seems most relevant to the area, processes, and conditions you wish to assess. In our example above, make sure that the survey contains some observations that relate to the habitat and health requirements of fish.
STEP 1: GETTING STARTED
Merrimack River Watershed Study Design Workbook Page 20
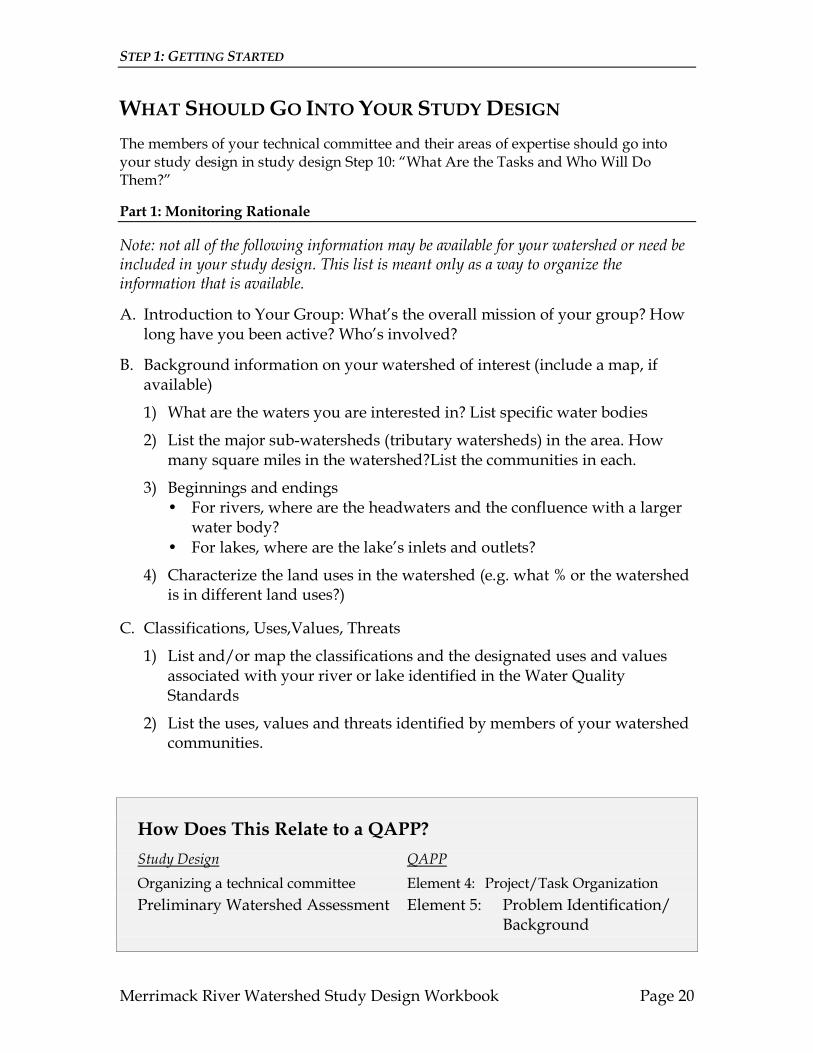
WHAT SHOULD GO INTO YOUR STUDY DESIGN
The members of your technical committee and their areas of expertise should go into your study design in study design Step 10: “What Are the Tasks and Who Will Do Them?”
Part 1: Monitoring Rationale
Note: not all of the following information may be available for your watershed or need be included in your study design. This list is meant only as a way to organize the information that is available.
A. Introduction to Your Group: What’s the overall mission of your group? How long have you been active? Who’s involved?
B. Background information on your watershed of interest (include a map, if available)
1) What are the waters you are interested in? List specific water bodies
2) List the major subwatersheds (tributary watersheds) in the area. How many square miles in the watershed?List the communities in each.
3) Beginnings and endings • For rivers, where are the headwaters and the confluence with a larger
water body? • For lakes, where are the lake’s inlets and outlets?
4) Characterize the land uses in the watershed (e.g. what % or the watershed is in different land uses?)
C. Classifications, Uses,Values, Threats
1) List and/or map the classifications and the designated uses and values associated with your river or lake identified in the Water Quality Standards
2) List the uses, values and threats identified by members of your watershed communities.
How Does This Relate to a QAPP? Study Design QAPP Organizing a technical committee Element 4: Project/Task Organization Preliminary Watershed Assessment Element 5: Problem Identification/
Background
Merrimack River Watershed Study Design Workbook Page 21
STEP 2: WHY ARE YOU MONITORING?
In This Chapter: • Issues and Questions: Background Information • Issues and Questions in the Watershed • Steps To Identifying Issues and Questions • Background Information on Users and Uses of Monitoring Information • Background Information on Data Quality Goals • Data Uses Appropriate for the Data Quality Goals • Steps to Identifying Users and Uses of Monitoring
Information and Data Quality Goals • What Should Go Into Your Study Design • How Does This Relate To a QAPP?
Unless you’ve got lots of free time on your hands, you want your monitoring effort to collect the most useful information with the least amount of time and expense. We suggest that any monitoring program should start with one or more questions that address issues faced by decisionmakers in your watershed. Your monitoring activities should then be designed to answer these questions.
ISSUES AND QUESTIONS: BACKGROUND INFORMATION
In study design Step 1, you conducted some background research about current environmental conditions and human uses in your watershed: uses, values, and threats. These uses, values, and threats are used to identify issues. Issues can be existing or potential conflicts among these uses and values. Issues can also concern the existing or potential impacts of these threats on uses and values.
From the issues, you frame specific monitoring questions that would help you address those issues. For example, if the issue you’re concerned about is a conflict between a waste discharge and swimming at your favorite swimming hole, you might frame the following monitoring question: Is swimming in the swimming hole a health risk? If your issue is the threat of polluted runoff from a
STEP 2: WHY ARE YOU MONITORING?
Merrimack River Watershed Study Design Workbook Page 22
large paved area on a river, you might frame the following question: What is the impact of the parking area on the ecological health of the river? If the loss of lakeshore vegetation is your issue of concern, you might frame the following question: What is the impact of the loss of shoreline vegetation on aquatic plants and animals in the littoral zone? Questions can be framed many ways, but the more specific the better.
ISSUES AND QUESTIONS IN THE WATERSHED
This section lists the suggested issues and questions that volunteer monitoring can address in the Merrimack River Watershed. The issues have been identified by various committees and reports of the Merrimack River Initiative. The questions have been identified by the VEMN Steering Committee as desirable and appropriate to address these issues.
The questions are divided into two types: basic questions about the watershed and monitoring questions. Basic questions are general. Monitoring questions are more specific and might address an information need. The basic question is listed first, then the issue it addresses, followed by specific monitoring questions.
Use these questions as a starting point, but make them specific to your waters and concerns.
Basic Question I: Is the River System Or Lake Supporting Its Uses and Values?
Issue Addressed: Maintain water quality for beneficial water uses and values.
Monitoring Questions:
A. Is human water contact recreation a health risk? 1) primary water contact recreation: accidental ingestion of water is likely –
swimming, water skiing, windsurfing, etc 2) secondary water contact recreation: accidental ingestion of water is unlikely
but possible – boating, wading, fishing, etc
B. Does the water meet MA and NH Water Quality Standards?
C. Is eating the aquatic life a health risk? 1) fish 2) shellfish 3) turtles
D. Do physical, chemical and biological lake / river conditions support healthy aquatic life when compared with regional reference conditions?
STEP 2: WHY ARE YOU MONITORING?
Merrimack River Watershed Study Design Workbook Page 23
E. Do lake / river conditions support economic uses (irrigation / water supply, snow, industrial, etc.)?
F. Are the existing standards adequate for their designated water uses and values and restoring and maintaining ecological integrity?
STEP 2: WHY ARE YOU MONITORING?
Merrimack River Watershed Study Design Workbook Page 24
Basic Question II: What Are the Impacts of Human Alterations of the River System Or Lake On Human Use and Ecological Integrity?
Issue Addressed: The impacts of pollution sources and various water uses on human use and ecological integrity of the river system or lake.
Monitoring Questions:
A. What are the impacts of water withdrawals on human use and ecological integrity of the river system or specific water bodies?
B. What are the impacts of nonpoint source (NPS) pollution on human use and ecological integrity of the river system or specific water bodies? 1) developed areas 2) dairy farms 3) construction 4) onsite septic systems 5) logging 6) parking lots
C. What are the impacts of point discharges on human use and ecological integrity of the river system or specific water bodies?
D. What are the impacts of flow management on human use and ecological integrity of the river system or specific water bodies?
E. What are the impacts of water uses on erosion and subsequent impacts on human use and ecological integrity of the river system or specific water bodies?
F. Is water quality having a positive or negative effect on economic conditions (i.e. property values, tourism, industrial locations)?
Basic Question III: How Effective are Site Specific and Watershed wide Water and Land Management Strategies In Restoring and Protecting Human Use and Ecological Integrity?
Issue Addressed: The effectiveness of water quality protection and improvement measures in restoring and maintaining human use and ecological integrity.
Monitoring Questions:
A. What is the effectiveness of best management practices (BMPs) to control polluted runoff in restoring and protecting human use and ecological integrity of the river system or specific water bodies? 1) developed areas 2) dairy farms 3) construction 4) onsite septic systems 5) logging
STEP 2: WHY ARE YOU MONITORING?
Merrimack River Watershed Study Design Workbook Page 25
6) parking lots
B. What is the effectiveness of land use planning and zoning in restoring and protecting human use and ecological integrity of the river system or specific water bodies?
C. How effectiveness is remediation for restoring and protecting the ecological integrity and/or human use of the river system or specific water bodies?
D. What is the effectiveness of water pollution control facilities (wastewater treatment plants or onsite systems) in restoring and protecting human use and ecological integrity of the river system or specific water bodies?
E. What is the effectiveness of habitat / stream restoration in restoring and protecting human use and ecological integrity of the river system or specific water bodies?
Basic Question IV: Are Permit Conditions Effective?
Issue Addressed: Effectiveness of permits in restoring and maintaining human use and ecological integrity of the river system or specific water bodies.
Monitoring Questions:
A. Are permit conditions being met? 1) NPDES, (Wastewater Discharge Permits) 2) FERC (Hydropower Permits and Licenses) 3) Dredge and Fill 4) Water Withdrawal 5) Stream Alteration
B. Are permit (e.g. NPDES, FERC, Dredge and Fill, Water Withdrawal, Stream Alteration) conditions adequate to restore and maintain human use and ecological integrity of the river system or specific water bodies?
Basic Question V: Where are Problem Areas That Should Be A High Priority for Remediation?
Issue Addressed: Pollution source identification.
Monitoring Questions:
A. What and where are the specific pollution sources (sites) that are impairing human use and ecological integrity of water bodies?
B. Which pollution sources should be the highest priority for remediation?
C. Where are candidate areas for resource (e.g. fish habitat) restoration?
STEP 2: WHY ARE YOU MONITORING?
Merrimack River Watershed Study Design Workbook Page 26
Basic Question VI: Where Are Special Natural and Cultural Resources?
Issue Addressed: Locating resources for protection.
Monitoring Questions:
A. Where is the access for swimming, boating, and fishing?
B. Is access for swimming, boating, and fishing adequate?
C. Where are the habitats for rare, threatened or endangered species?
D. Where are the outstanding physical features (e.g. waterfalls and gorges)?
E. Where are habitats for important game species (e.g. spawning and nursery areas)?
F. Where are the important waterdependent tourism attractions?
Basic Question VII: Are Conditions Changing?
Issue Addressed: Tracking trends and changes over time.
Monitoring Questions:
A. Are the answers to any of the above questions changing over time(years)? 1) What conditions? 2) Where? 3) How 4) Why?
STEP 2: WHY ARE YOU MONITORING?
Merrimack River Watershed Study Design Workbook Page 27
STEPS TO IDENTIFYING ISSUES AND QUESTIONS
Step 1: Identify the issues facing your river or lake and what is being done, if anything, to address them. Based on your research, identify the issues which will need to be addressed in order for your river or lake to support designated and identified uses and values, deal with the threats, and solve the problems.
There may already be efforts underway to address these problems, at the federal, state, or local level. Find out who’s doing what to address the issue(s) you’ve identified.
Step 2: Identify what you need to know about the river or lake in order to address the issues, to define and evaluate the extent of the problems, or to evaluate the effectiveness of solutions. Based on your research and workshops it may be that you haven’t identified any waterrelated problems. The issue may be lack of information about the present condition of the waterbody and monitoring can help you fill the gap.
Step 3: Identify the specific questions you have about your river or lake. Come up with the questions that, if answered through monitoring, will provide the information needs you identified in study design Step 2 .
STEP 2: WHY ARE YOU MONITORING?
Merrimack River Watershed Study Design Workbook Page 28
USERS AND USES OF MONITORING INFORMATION: BACKGROUND INFORMATION
Volunteer monitors are faced with a fundamental question common to all project planners; how do you produce the highest quality product for the least amount of work, expertise and money – all of which seem to be in chronically short supply? The answer to this rests on the relationship between the producer (the data provider) and the consumer (the data user). What are the user's expectations for quality of the product? Depending on the user, the expectations may vary greatly. The farmer and the agency scientist may have very different ideas on what constitutes credible data. A volunteer program can make just as big a mistake, by “overdesigning” the program spending too much on fancy equipment, training and technique – as by taking too little care. On the one hand, overdesign can mean fewer sites or dates can be monitored, or it could mean that the group “burns out” faster. On the other hand, all effort may be wasted if the target audience does not respect and will not use the data.
To establish a program that is "just right" in terms of efficiency and rigor, we recommend some simple rules:
• know what you want to use the data for • know who you want to use the data, and what their expectations are • develop data quality objectives that meet your target audiences’ needs • design and conduct sampling programs that achieve those data quality objectives • don't spend any more effort than is necessary!
In this section, we’ll review the basics of the first two rules – users and uses of watershed monitoring data.
Users and Uses of Watershed Monitoring Data
Data uses and data users are different things that are closely tied together. A data use is an activity, program, or forum that achieves an end with the help of the data, or information. Examples: a court case that charges someone with violating a discharge permit, development of a fisheries management plan, determining if a public beach is safe for swimming, or educating the watershed association's board (and the larger community) on the general health of the river. Data users are the people and institutions who make the decisions. Examples (based on those above): the judge deciding the case, the fisheries agency, the town health officer – and the bathers, the watershed association and the general public. The challenge for the volunteer monitor is to determine which actions and which decisionmakers are important enough to convince, and then figure out what they need in order to be convinced.
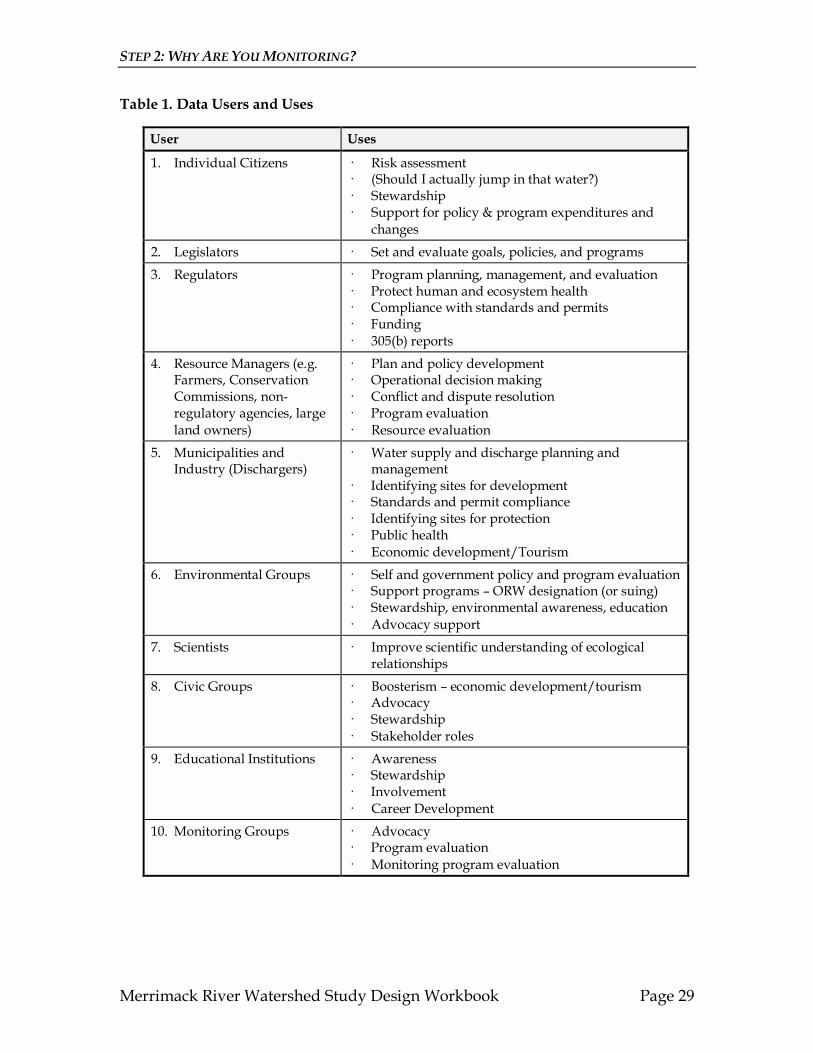
To help volunteer monitors on the latter question, we have developed a list – based on our experience – of common data users and uses of water monitoring data.
STEP 2: WHY ARE YOU MONITORING?
Merrimack River Watershed Study Design Workbook Page 29
Table 1. Data Users and Uses
User Uses
1. Individual Citizens · Risk assessment · (Should I actually jump in that water?) · Stewardship · Support for policy & program expenditures and
changes
2. Legislators · Set and evaluate goals, policies, and programs
3. Regulators · Program planning, management, and evaluation · Protect human and ecosystem health · Compliance with standards and permits · Funding · 305(b) reports
4. Resource Managers (e.g. Farmers, Conservation Commissions, non regulatory agencies, large land owners)
· Plan and policy development · Operational decision making · Conflict and dispute resolution · Program evaluation · Resource evaluation
5. Municipalities and Industry (Dischargers)
· Water supply and discharge planning and management
· Identifying sites for development · Standards and permit compliance · Identifying sites for protection · Public health · Economic development/Tourism
6. Environmental Groups · Self and government policy and program evaluation · Support programs – ORW designation (or suing) · Stewardship, environmental awareness, education · Advocacy support
7. Scientists · Improve scientific understanding of ecological relationships
8. Civic Groups · Boosterism – economic development/tourism · Advocacy · Stewardship · Stakeholder roles
9. Educational Institutions · Awareness · Stewardship · Involvement · Career Development
10. Monitoring Groups · Advocacy · Program evaluation · Monitoring program evaluation
STEP 2: WHY ARE YOU MONITORING?
Merrimack River Watershed Study Design Workbook Page 30
DATA QUALITY GOALS: BACKGROUND INFORMATION
Once you’ve identified the intended users and uses of your data, you need to establish data quality goals. These are narrative statements that link the quality of data with the intended use of the data. Most of your other monitoring decisions (what, how, where, how often) will be based on your data quality goals.
We’ve identified four possible data quality goals for the VEMN: 1) Level of quality necessary to meet legal, regulatory and scientific peer review
requirements 2) Meets evaluation and assessment requirements of state and federal agencies. 3) Meets requirements for evaluation, assessment and management at the
community or watershed level. 4) Data quality sufficient to increase awareness and knowledge of resource
values and conditions.
These goals are arranged in decreasing order of the scientific rigor required to meet them. They are not the only possible goals. Think of the following goals as benchmarks along a continuum of rigor, expense, time, and commitment. A brief discussion of each follows:
1) Level of quality necessary to meet legal, regulatory and scientific peer review requirements.
This goal, requires a very high level of scientific rigor that can stand up to the highest level of scrutiny in a court of law, regulatory proceeding, or peer review for a scientific journal that reports research results. Meeting this goal will require that you use the most precise, accurate and sensitive methods available and that you undertake a rigorous program to assure the quality of your results. This is a very difficult and potentially prohibitively expensive goal to meet. Given some of the inherent issues associated with using nonprofessionals to collect data, it’s highly unlikely that data collected by volunteer monitors will be used this way.
2) Meets evaluation and assessment requirements of state and federal agencies.
Evaluation and assessment are data uses that enable decisionmakers to make non regulatory water management decisions about allocating staff and funding resources to address problems. Data that meets this goal can be included in EPA and state biennial reports to Congress (also known as 305(b)) reports that describe the extent to which waters support their designated uses and values. This goal requires that the indicators; the precision, accuracy, and sensitivity of the methods; the sites; the frequency; and the quality assurance measures you choose match or are equivalent to those used by agency programs. While still a challenging goal, state and federal agencies in the watershed have begun to use volunteer monitoring data gathered in this way. Remember that your audience here are professional water resources people who understand the limits of your ability to collect water monitoring data, but who
STEP 2: WHY ARE YOU MONITORING?
Merrimack River Watershed Study Design Workbook Page 31
also need data to supplement their own. Depending on the nature of the monitoring, meeting this goals may require substantial human and financial resources.
STEP 2: WHY ARE YOU MONITORING?
Merrimack River Watershed Study Design Workbook Page 32
3) Meets requirements for evaluation, assessment and management at the community or watershed level.
Evaluation, assessment, and management decisions at the community or watershed level typically involve municipal and landowner land and water planning and use decisions. It may be as simple as an individual deciding whether or not the water is clean enough to swim in or a farmer deciding whether or not to fence dairy cows out of the stream. Or it may involve local regulations that protect water quality by establishing undeveloped areas along the water body. This goal requires that the indicators; the precision, accuracy, and sensitivity of the methods; the sites; the frequency; and the quality assurance measures you choose convince both professional and nonprofessional water resource managers at the community level that your data is reliable. While a degree of scientific rigor is required, your methods may be geared toward identifying gross problems, for example, rather than subtle changes over time and space. Community level resource managers may or may not have a good understanding of aquatic ecosystems and monitoring, so you may need to educate them at the same time. Many volunteer monitoring groups meet this goal using relatively easy and inexpensive methods.
4) Data quality sufficient to increase awareness and knowledge of resource values and conditions.
Awareness of water resource values and conditions is a prerequisite for public support of efforts to restore, protect, and maintain water resources. In this case, then audience is the general public. Your monitoring program should be tailored toward increasing public understanding of problems, opportunities, and special resource values that enhance the quality of life in the area. This does not require rigorous sampling and analytical methods. Many school water monitoring programs, for example, use simple and inexpensive methods just to expose get students to experience the water itself, teach the concept of monitoring, and to reveal ecological processes at work in the real world. All volunteer monitoring programs meet this goal to one degree or another, just by getting people to experience their local stream or lake.
Many programs start with the least rigorous goal, and evolve into more sophisticated efforts over time. Which data quality goal(s) you select depends on the intended users and uses or your data.
DATA USES APPROPRIATE FOR THE DATA QUALITY GOALS
This section lists appropriate data uses for each of the four data quality goals described above. By consulting this list – and consulting the VEMN for assistance in applying it to a particular survey, volunteer monitors should be able to design programs that are tailored to the intended users and uses.
Level 1 Uses: LEVEL OF QUALITY NECESSARY TO MEET LEGAL, REGULATORY, AND SCIENTIFIC PEER REVIEW REQUIREMENTS.
• inclusion in 305(b) reports • determine compliance with permit requirements
STEP 2: WHY ARE YOU MONITORING?
Merrimack River Watershed Study Design Workbook Page 33
• enforce pollution control laws and regulations • improve scientific understanding
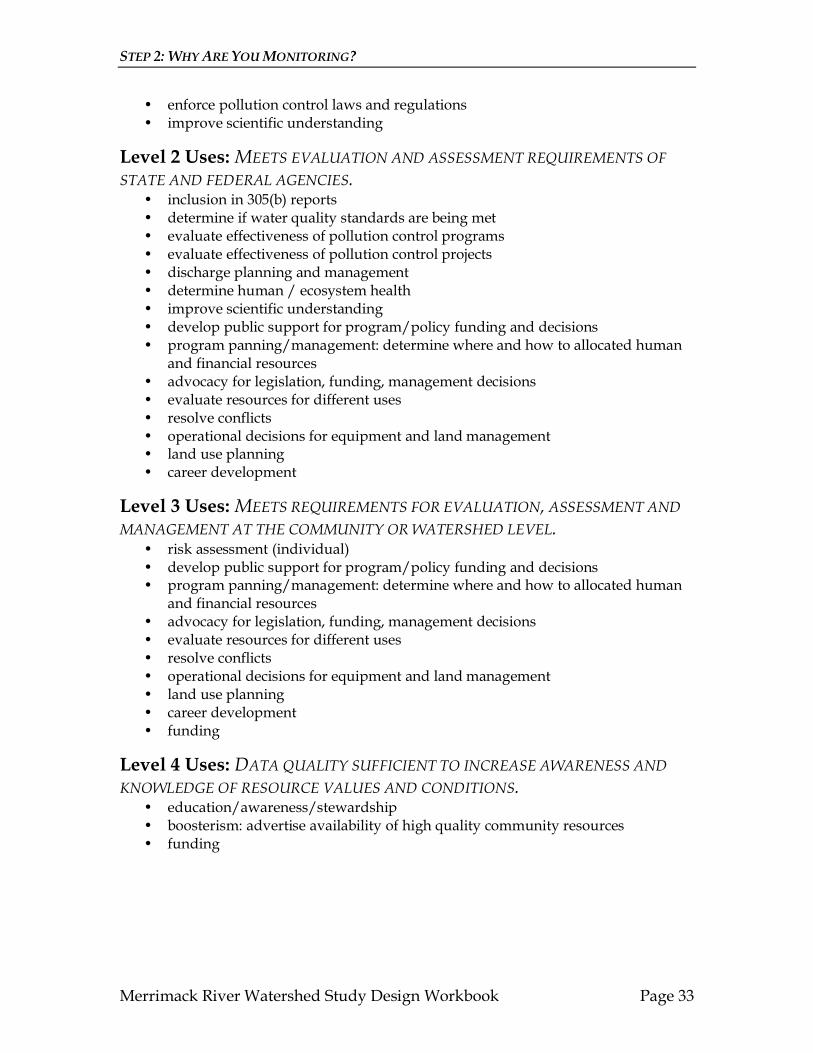
Level 2 Uses: MEETS EVALUATION AND ASSESSMENT REQUIREMENTS OF STATE AND FEDERAL AGENCIES.
• inclusion in 305(b) reports • determine if water quality standards are being met • evaluate effectiveness of pollution control programs • evaluate effectiveness of pollution control projects • discharge planning and management • determine human / ecosystem health • improve scientific understanding • develop public support for program/policy funding and decisions • program panning/management: determine where and how to allocated human
and financial resources • advocacy for legislation, funding, management decisions • evaluate resources for different uses • resolve conflicts • operational decisions for equipment and land management • land use planning • career development
Level 3 Uses: MEETS REQUIREMENTS FOR EVALUATION, ASSESSMENT AND MANAGEMENT AT THE COMMUNITY OR WATERSHED LEVEL.
• risk assessment (individual) • develop public support for program/policy funding and decisions • program panning/management: determine where and how to allocated human
and financial resources • advocacy for legislation, funding, management decisions • evaluate resources for different uses • resolve conflicts • operational decisions for equipment and land management • land use planning • career development • funding
Level 4 Uses: DATA QUALITY SUFFICIENT TO INCREASE AWARENESS AND KNOWLEDGE OF RESOURCE VALUES AND CONDITIONS.
• education/awareness/stewardship • boosterism: advertise availability of high quality community resources • funding
STEP 2: WHY ARE YOU MONITORING?
Merrimack River Watershed Study Design Workbook Page 34
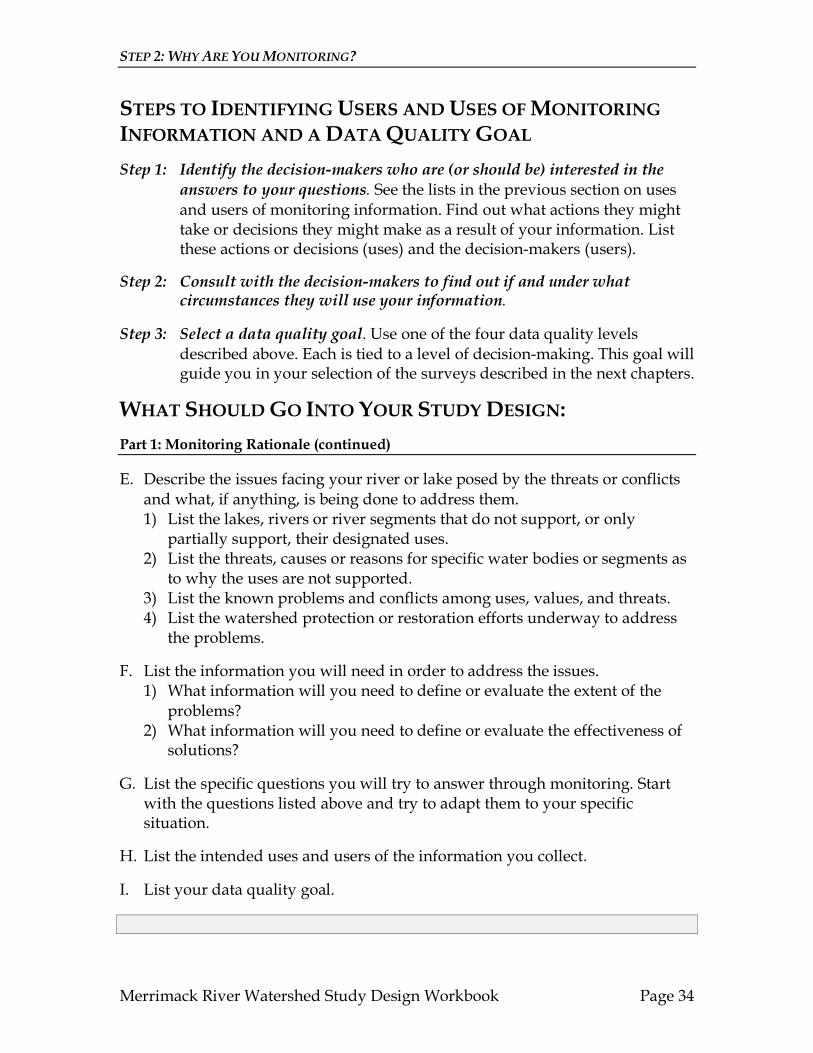
STEPS TO IDENTIFYING USERS AND USES OF MONITORING INFORMATION AND A DATA QUALITY GOAL
Step 1: Identify the decisionmakers who are (or should be) interested in the answers to your questions. See the lists in the previous section on uses and users of monitoring information. Find out what actions they might take or decisions they might make as a result of your information. List these actions or decisions (uses) and the decisionmakers (users).
Step 2: Consult with the decisionmakers to find out if and under what circumstances they will use your information.
Step 3: Select a data quality goal. Use one of the four data quality levels described above. Each is tied to a level of decisionmaking. This goal will guide you in your selection of the surveys described in the next chapters.
WHAT SHOULD GO INTO YOUR STUDY DESIGN: Part 1: Monitoring Rationale (continued)
E. Describe the issues facing your river or lake posed by the threats or conflicts and what, if anything, is being done to address them. 1) List the lakes, rivers or river segments that do not support, or only
partially support, their designated uses. 2) List the threats, causes or reasons for specific water bodies or segments as
to why the uses are not supported. 3) List the known problems and conflicts among uses, values, and threats. 4) List the watershed protection or restoration efforts underway to address
the problems.
F. List the information you will need in order to address the issues. 1) What information will you need to define or evaluate the extent of the
problems? 2) What information will you need to define or evaluate the effectiveness of
solutions?
G. List the specific questions you will try to answer through monitoring. Start with the questions listed above and try to adapt them to your specific situation.
H. List the intended uses and users of the information you collect.
I. List your data quality goal.
STEP 2: WHY ARE YOU MONITORING?
Merrimack River Watershed Study Design Workbook Page 35
How Does This Relate to a QAPP? Study Design QAPP Why Are You Monitoring? Element 4: Project/Tasks Organization
(Data Users) Element 5: Problem
Identification/Background
STEP 3: WHAT WILL YOU MONITOR?
In This Chapter: • Watershed Indicators: Background Information • Things To Consider In Selecting Indicators • Steps To Selecting Indicators • What Should Go Into Your Study Design • How Does This Relate To a QAPP?
The Merrimack River Watershed is a very complicated system of interrelated physical, chemical, and biological characteristics. Measurable characteristics are often referred to as “indicators.” Indicators can tell us about pollution and other forces that stress the ecosystem, the extent to which the ecosystem is exposed to that stress, and how it responds. Indicators can also tell us how good a place it is for living organisms, – its habitat quality. Which indicators you choose to monitor will depend upon the question(s) you are asking as well as your available human and financial resources.
WATERSHED INDICATORS: BACKGROUND INFORMATION
In this section, we’ll focus on describing the different types of indicators that are on the VEMN “menu.” In the following section, “Things To Consider In Selecting Indicators,” we’ll explain how to choose among them the ones that will best answer your questions.
When you think about all the indicators you could measure to monitor a watershed, your head may start to hurt. Fortunately, we’ve narrowed the list down a bit.
We’ve organized our menu into the following categories:
STEP 3: WHAT WILL YOU MONITOR?
Merrimack River Watershed Study Design Workbook Page 36
• Biological Indicators • Physical and Chemical Water Column Indicators • Physical Habitat Indicators • Public Health Indicators • NonPoint Source Site Indicators
Each is described below.
STEP 3: WHAT WILL YOU MONITOR?
Merrimack River Watershed Study Design Workbook Page 37
VEMN Biological Indicators
These are indicators that tell us something about how the living things in the watershed ecosystem respond to natural stresses (like floods and droughts) and humancaused stresses (like pollution or changes in habitat).
Fecal Coliform and E. coli Bacteria: Fecal coliforms and E. coli are bacteria that are common in the intestines and feces of warmblooded animals. They are used both as indicators of the presence of sewage or animal manure in the water and as indicators of the health risk of swimming and other water contact recreation. Fecal coliforms are used in MA, E. coli are used in NH, per their water quality standards.
Benthic Macroinvertebrates: These are critters without backbones that live on the river bottom. They include aquatic insects such as mayflies, mollusks, crustaceans, and worms. They are good indicators of ecological conditions and human impacts, since they are integral to the river’s food web and the mix of critters present reflects both water and habitat quality.
Aquatic Vegetation (lakes): Aquatic vegetation is an important part of a lake ecosystem, especially in nearshore areas. Rooted plants provide habitat for aquatic animals and are an important source of oxygen. Some are nuisances, causing dramatic habitat alterations and interference with recreational uses. The types, density, diversity, and growth patterns are important characteristics to assess.
Chlorophyll a: Chlorophyll a is a green pigment found in all plants. It is used to quantify the abundance of algae in water. When chlorophyll a degrades, it converts to pheophytin. The ratio of chlorophyll a to pheophytin is used to determine the health of the algae sampled.
Physical and Chemical Water Column Indicators
These are indicators that tell us something about how the physical properties and chemical elements and compounds in the water column or channel respond to natural and humancaused stresses.
Turbidity (for rivers only): Turbidity describes how the particles suspended in the water affect its clarity. It is an indicator of the presence of suspended sediment from erosion, which can decrease biological activity, raise water temperatures, and clog fish gills and gravel spawning areas. Turbidity results are usually reported as nephelometric turbidity units (NTUs), which measure the amount of light scattering by suspended particles.
Dissolved Oxygen (DO): DO is the presence of oxygen gas molecules in the water. Since it is critical to many biological and chemical processes in the
STEP 3: WHAT WILL YOU MONITOR?
Merrimack River Watershed Study Design Workbook Page 38
water and essential for aquatic life, dissolved oxygen is an indicator of the capability of the aquatic ecosystem to support life.
Biochemical Oxygen Demand (BOD): BOD is a measurement of the amount of oxygen consumed by organic matter and associated microorganisms and through chemical oxidation in the water over a period of time, usually 5 days. Measuring the biochemical oxygen demand (BOD) of the water tells us whether oxygen demanding wastes might cause low DO levels at times.
pH: pH is a measure of the acidity of the water. Since pH affects many biological and chemical reactions in the water and most organisms have a preferred range, it is a good indicator of capability of the aquatic ecosystem to support life.
Total Alkalinity: This is a measure of the water’s ability to neutralize acids – the higher the alkalinity levels, the more acidneutralizing capacity the water has. This is important for aquatic ecosystems because it protects against changes in pH, which can harm aquatic life.
Conductivity: This is a measure of the water’s ability to pass an electrical current. This ability depends on the presence of inorganic dissolved solids made up of ions (particles that carry a positive or negative electrical charge). Since a wide range of materials conduct electricity, conductivity’s primary importance is as an indicator of general pollution, rather than a measure of any specific pollutant.
Total Phosphorus: Phosphorus is an essential nutrient for plant growth and metabolic reactions in plants and animals. Together with nitrogen, it is the primary source of food energy in the aquatic ecosystem. Too much phosphorus can cause too much biological activity, resulting in undesirable effects such as algae blooms. Phosphorus occurs in various forms in the water, usually as some variation of the phosphate molecule (PO4). Dissolved in water, phosphate is very available for plant. Bound to organic matter or in large complex molecules, it is less available. Total phosphorus includes all the forms. It is a good indicator of enrichment from various sources, such as sewage, manure, or fertilizer. In many fresh waters, especially lakes, phosphorus is the nutrient in short supply, so that relatively small additions can cause accelerated biological activity.
Temperature: Since temperature affects many biological and chemical reactions in the water and most organisms have a preferred range, it is a good indicator of capability of the aquatic ecosystem to support life.
Nitrogen: Nitrogen is a gas in the atmosphere. It combines with oxygen or hydrogen to produce various compounds – ammonia, nitrates, and nitrates. Is
STEP 3: WHAT WILL YOU MONITOR?
Merrimack River Watershed Study Design Workbook Page 39
an essential nutrient for plant growth and metabolic reactions in plants and animals. Together with phosphorus, it is the primary source of food energy in the aquatic ecosystem. Too much of certain forms of nitrogen can cause too much biological activity and cause undesirable effects. It is also toxic to babies in high concentrations. Nitrogen occurs in various forms, both organic and inorganic in the water, some of which are more available for plant growth than others. In some waters, nitrogen is the nutrient in short supply, so that relatively small amounts can cause impacts. Three forms of nitrogen are recommended as indicators in this guide: ammonia, nitrates, and total. Ammonia Nitrogen: Ammonia (NH3 ) is produced when organic nitrogen and/or urea break down. It is a byproduct of sewage decomposition. It is naturally present in surface waters, and can be toxic to aquatic life at relatively low concentrations (<1.0 mg/l). Nitrate Nitrogen: Nitrate (NO3 ) is produced naturally by nitrogenfixing plants and lightning acting on atmospheric nitrogen or ammonia. Nitrate is a form of nitrogen readily used by plants. In excess, it can cause excessive biological activity in surface waters and can be toxic to infants.
STEP 3: WHAT WILL YOU MONITOR?
Merrimack River Watershed Study Design Workbook Page 40
Total Kjeldahl Nitrogen (TKN): This refers to the total of organically bound nitrogen and ammonia. By analyzing samples for both ammonia and total Kjeldahl nitrogen, organic nitrogen can be calculated. This enables you to estimate how much nitrogen is in the system is in organic form, intermediate form (ammonia) and inorganic form (nitrate). It may tell you how much comes from sewage, versus fertilizer, for example.
Solids: Solids include materials that are dissolved or suspended in the water column, or can be settle out of it. Total solids include all of these. They affect water clarity and can reduce photosynthesis and higher temperatures. Dissolved solids include various ions of calcium, chlorides, nitrate, phosphate, iron, sulfur and others that will pass though a 2 micron pore. These affect the water balance in the cells of aquatic organisms, making it difficult for them to maintain position in the water column.
Secchi Depth Transparency (for lakes only): Transparency describes scattering and absorption of light by small particles and molecules in the water. This is most commonly expressed as the depth at which a black and white patterned device known as a secchi disk disappears from sight. The more transparent the water, the lower the depth at which the disk disappears. Reduced transparency has the same effects as elevated turbidity. Secchi transparency is also used as a general indicator of the ecological condition of lakes.
VEMN Physical Habitat Structure and Quality Indicators
These are indicators that tell us something about how the physical structure of the watershed responds to natural and humancaused stresses.
River, riparian, lakeshore, and watershed characteristics, uses, values, and threats: These are qualitative (observed, rather than measured) indicators that provide evidence of stress from human activities and the response of the watershed ecosystem
River Habitat Quality: This involves a suite of characteristics that are important to the survival of the animals in the river. They include the following:
• Current Velocity: How fast the water is important to the amount of energy critters need to expend to maintain position..
• Bottom Composition: The mix of materials that make up the bottom (bedrock, boulder, cobble, gravel, sand, mud, organic debris) determines the types and stability of surfaces critters can attach to, live under, hide behind, or burrow into.
• Embeddedness: The extent to which larger particles (boulder, cobble, and gravel) are surrounded by fine sediment. High embeddedness reduces available habitat for bottomdwelling critters.
STEP 3: WHAT WILL YOU MONITOR?
Merrimack River Watershed Study Design Workbook Page 41
• Velocity/Depth Regimes (Rivers): The presence of all four regimes (slow deep, slowshallow, fastdeep, fastshallow) provides a healthy diversity of habitat opportunities for stream critters.
• Channel Alteration: Straightening or confining the stream channel reduces habitat complexity and opportunities for stream critters.
• Sediment Deposition: Changes the composition of the river bottom, the shape of the channel, and reduces habitat diversity.
• Fish Cover: The presence of submerged logs, stable undercut banks, overhanging rocks and other places that provide shelter from predators for fish.
• Riffle Characteristics (Rivers): Frequent and welldeveloped riffles provide diverse habitat and feeding opportunities for many stream critters.
• Channel Flow Status (Rivers): The amount of river bottom exposed. Frequent exposure reduces the available habitat.
• Bank Characteristics: These include bank vegetation, eroding and unstable banks and other characteristics. A stable vegetated bank provides food and shade to the aquatic habitat and prevents contamination from reaching it.
• Riparian Zone Characteristics: This zone of land along the river or lake serves a number of important ecological functions: shading, nutrient and sediment trap, food, and bank stability. The width of this zone and its vegetative composition determine how well it performs these functions.
• Shading: The shade provided by trees and other vegetation helps moderate water temperatures in the summer and provides food for aquatic animals.
• Channel Sinuosity (Rivers): A meandering channel provides a diversity of bottom, flow, and habitat conditions.
• Pool Variability: A mix of large and small, deep and shallow pools provide a diversity of habitat conditions.
Since the relative importance of these characteristics varies with the critter (for example fish or macroinvertebrates), you select a suite of characteristics most important to your critter of concern. Analyzing this suite of indicators is known as habitat assessment.
River Flow: This is the volume of water passing a point expressed in cubic feet or meters per second. Flow is sometimes referred to as “discharge.” Flow affects the river’s physical characteristics, such as erosion and sedimentation, bottom composition, amount of the bottom that’s covered with water, etc.
STEP 3: WHAT WILL YOU MONITOR?
Merrimack River Watershed Study Design Workbook Page 42
Lake Level: Lake level is the elevation of the water surface elevation relative to a fixed elevation. This affects the lake’s physical characteristics, such as erosion and sedimentation, bottom composition, amount of the nearshore lake bottom that’s covered with water, etc.
Rainfall: Rainfall affects the amount of water that gets to the river or lake and the amount and quality of surface runoff that may carry contamination and cause erosion.
River Channel Characteristics (wadeable waters only): River channel characteristics are the various physical features of the river channel that reflect geological and hydrological changes over time. The river channel is a dynamic land form that is constantly moving as water erodes the land surface. It also responds to humancaused changes in watershed land use and alterations of the river channel. These characteristics form the physical foundation of the river system and provide habitat for aquatic life. Characteristics recommended by the VEMN are • Bottom Composition: The mix of materials that make up the bottom (see
river habitat quality) • Embeddedness: The extent to which larger particles (boulder, cobble, and
gravel) are surrounded by fine sediment. (see river habitat quality) • Channel Cross Section: measuring the dimensions of a “slice” of the channel
from side to side. • Longitudinal Profile: measuring the gradient of a “slice” of the channel from
upstream to downstream.
Public Health Indicators
These indicators tell us something about the extent to which people are exposed to diseases and about the human health response to this exposure.
Fecal Coliform, E. coli, and Enterococcus Bacteria: These are bacteria that are common in the intestines and feces of warmblooded animals. They are used for public health purposes as an indicator of exposure of humans to disease causing organisms in water and shellfish. For water contact recreation – E. coli are recommended by EPA as the preferred indicator in fresh water and enterococcus in marine waters. For shellfish consumption – fecal coliform bacteria are recommended by the National Shellfish Sanitation Program as the preferred indicator.
Information on the Behavior and Health Status of Water or Shellfish Users: Simple epidemiological surveys can give us information on the extent to which water users or shellfish consumers are exposed to diseasecausing

STEP 3: WHAT WILL YOU MONITOR?
Merrimack River Watershed Study Design Workbook Page 43
organisms. These are best used in conjunction with water sampling and analysis for bacteria or other contaminants of concern at water contact recreation areas or shellfish beds.
NonPoint Source Site Indicators
These are various visual indicators of the generation, transport, treatment, and export of pollution from various types of land use sites (e.g. construction, logging, cropland). The types of indicators observed vary depending on the type of site being assessed.
Indicators of Pollution Production: These are visual indicators that nonpoint source pollution is being generated at a site. Examples would include sediment being dislodged, the presence of manure piles, etc.
Indictors of Transport: These are visual indicators that there is a transport route from the pollution source through the site (for example, a surface water drainage pathway from the source).
Indicators of Pollution Control: These are visual indicators that some sort of attempt is being made to reduce the pollution being generated at or transported from the site. Examples would include detention ponds or barriers.
Indicators of Export: These are visual indicators that pollution is leaving the site and reaching surface water. An example would be a drainage pathway directly to a stream or lake.
THINGS TO CONSIDER IN SELECTING INDICATORS
As you can see, there are many possible indicators to measure. Before you run for the nearest exit, read on. It’s not as difficult as it may seem.
In the first place, your job of selecting indicators is made easier by the fact that we’ve already weeded out a host of them. Indicators, such as heavy metals and many complex chemical contaminants such as pesticides, are not recommended for volunteer monitoring since they are difficult to sample and require expensive and sophisticated laboratory equipment and procedures to analyze.
Second, we’ve assembled indicators into packages we call “surveys.” These packages relate to the questions listed in the previous chapter and are described in detail the VEMN Guide to Volunteer Watershed Monitoring Options in the Merrimack River Watershed:
A. Preliminary Watershed Assessment
B. Water Contact Health Risk Assessment
C. Water Quality Standards Assessment
STEP 3: WHAT WILL YOU MONITOR?
Merrimack River Watershed Study Design Workbook Page 44
D. Baseline Monitoring: Rivers and Lakes D1 Rigorous Baseline Monitoring: Wadeable Rivers D2 Rigorous Baseline Monitoring: NonWadeable Rivers D3 Basic Baseline Monitoring: Wadeable Rivers D4 Basic Baseline Monitoring: NonWadeable Rivers D5 Rigorous Baseline Monitoring: Lakes D6 Basic Baseline Monitoring: Lakes
E. Wastewater Treatment Plant Impact Assessment F1. Rigorous Wastewater Treatment Plant Impact Assessment F2. Basic Wastewater Treatment Plant Impact Assessment
F. NonPoint Source Pollution Impact Assessment F1. Rigorous NonPoint Source Pollution Impact Assessment F2. Basic NonPoint Source Pollution Impact Assessment
G. NPS Site Evaluation
H. Stormwater Discharge Monitoring
I. Wastewater Compliance Survey
The Guide lists the menu of indicators associated with each survey. Not only that, each survey includes recommended methods, site selection, frequency and timing, data analysis, quality assurance/quality control, and training required for each survey.
If you’re unsure of where to start, we recommend the Preliminary Watershed Assessment and the Water Quality Standards Assessment. The Preliminary Watershed Assessment
is a good starting point for any group. The Water Quality Standards Assessment, though it uses rigorous methods, produces data with a clear analysis process and clear data uses
and users.
Finally, to select from the menu of indicators associated with each survey, remember that selecting indicators is a logical process that considers your specific monitoring question and your capabilities. And, you’ve set up a technical committee to help you make these choices (right?). Here are some things to consider when selecting indicators:
Scientific Considerations: • Does it help answer your question? • Can you observe or measure and quantify it? • Does it respond to changes over a reasonable time period? • Does it respond to the impacts you’re evaluating? • Can you isolate the conditions that cause it to change? • Does it integrate effects over time and space? • Does it respond to changes in other indicators? • Is it a true measure of an environmental condition? • Is there a benchmark or reference condition against which to evaluate it? • Does it provide early warning of changes?
STEP 3: WHAT WILL YOU MONITOR?
Merrimack River Watershed Study Design Workbook Page 45
Practical and Program Considerations: • Do you have the human and financial resources to measure it? • How difficult is it to monitor? • Does it help you understand a major component of the ecosystem? • Is it understandable/explainable to your target audience?
So, get a grip, get the Guide and read on . . .
STEP 3: WHAT WILL YOU MONITOR?
Merrimack River Watershed Study Design Workbook Page 46
STEPS TO SELECTING INDICATORS
Step 1: Tentatively select a survey from the VEMN Guide to Volunteer Watershed Monitoring Options. Use the Guide and consult with your technical committee and/or VEMN staff to help you determine which survey will best help you answer your questions. You’ll notice that there are “basic” and “rigorous” versions of some of the surveys. If your data quality goal is to increase awareness and knowledge of resource values and conditions, then choose the “basic” version. If your goal is to meet evaluation and assessment requirements of state and federal agencies, the choose the “rigorous” version. If it’s to meet community evaluation, assessment and management requirements, either might do. Select rigorous for now and reconsider in light of your capabilities to carry out the methods involved (see chapter 4). If you are unsure of which survey to take on, start with the Preliminary Watershed Assessment. If you have the capability to do rigorous lab analysis, consider the Water Quality Standards Assessment.
Step 2: Find out what human and financial resources will be required to monitor the indicators. You’ll need to consult with VEMN staff and/or members of your technical committee who are familiar with how these indicators are sampled and analyzed. You can also Appendix 1 of the VEMN Guide to Volunteer Watershed Monitoring Options to get a sense of what’s involved to analyze the indicators. Find out how much time, money, equipment and expertise are required to monitor each indicator.
Step 3: For the survey you’ve selected, select the indicators that are most relevant and practical for your water body and your capabilities. Use the scientific and practical considerations listed in the previous section to help you select the most appropriate indicators. Remember, the indicators listed for each survey are a menu – you don’t have to monitor all of them! Your human and financial resources and expertise may limit the water quality indicators your can monitor. None of this is necessarily final. You may want to revisit your selections after you’ve determined your data quality objectives and methods (in the next chapter).
WHAT SHOULD GO INTO YOUR STUDY DESIGN: Part 2: Monitoring Design
A. List the indicators you will monitor and briefly describe why you selected each one (what will it tell you?)
How Does This Relate to a QAPP?
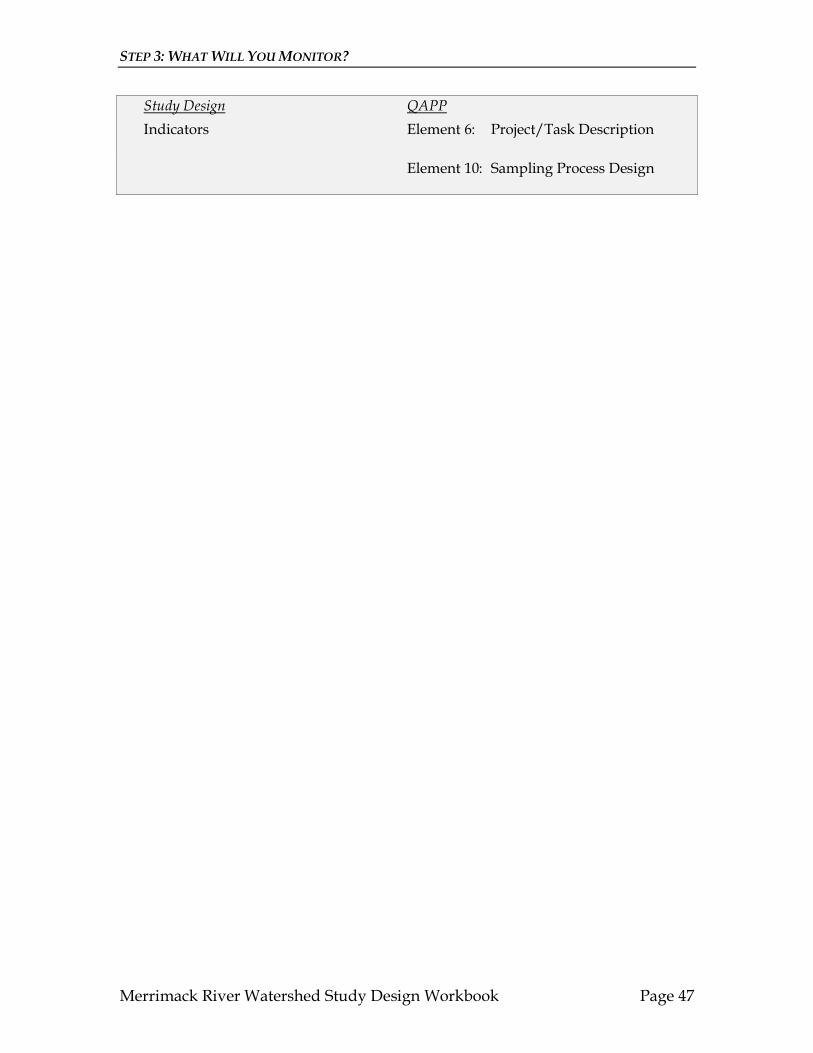
STEP 3: WHAT WILL YOU MONITOR?
Merrimack River Watershed Study Design Workbook Page 47
Study Design QAPP Indicators Element 6: Project/Task Description
Element 10: Sampling Process Design

Merrimack River Watershed Study Design Workbook Page 48
STEP 4: WHAT ARE YOUR DATA QUALITY OBJECTIVES?
In This Chapter: • Data Quality Objectives: Background Information • Steps To Setting Data Quality Objectives • What Should Go Into Your Study Design • How Does This Relate To a QAPP?
You now have one or more monitoring questions, intended data uses and users, an overall data quality goal, and a preliminary list of indicators you wish to measure. The next step is for you to define the quality standards your data must meet in order to be useful. These standards are known as data quality objectives.
Data quality objectives are the quantitative (numerical) and qualitative (narrative) terms you use to describe how good your data need to be in order to be useful. You determine data quality objectives, for each type of sample and each indicator, in order to meet your overall data quality goal. The objectives guide you in your selection of sampling and analytical methods – you match your methods to your data quality objectives.
Note that setting data quality objectives before you actually monitor may be optional. If you don’t have to prepare a quality assurance project plan and you don’t have to meet the specific objectives of your data users, you may skip this step for now. Once you’ve actually determined your capabilities, you may be better able to set these objectives based on your actual monitoring experience. In any case, data quality objectives can (and should) be changed once you’ve determined your capabilities. They are not carved in stone.
For the most part, quantitative data quality objectives apply to collecting and analyzing water samples. Qualitative objectives are usually used for aquatic life, habitat, and observational monitoring.
DATA QUALITY OBJECTIVES: BACKGROUND INFORMATION
In this section, we’ll define some of the basic terms that express data quality objectives. We’ve divided them into objectives for sampling and objectives for analysis:
STEP 4: WHAT ARE YOUR DATA QUALITY OBJECTIVES??
Merrimack River Watershed Study Design Workbook Page 49
Data Quality Objectives for Sampling
These apply to your overall process for collecting samples, including your sites and frequency. They will help you decide how many samples and at what frequency you want to collect them. They will help you select the number and types of sites to sample. They will help you determine the specific sampling places at each site. You’ll need to revisit your data quality objectives for sampling after you’ve decided on sites and frequency (study design steps 6 and 7).
Following are the categories of data quality objectives for sampling:
Completeness: the percentage of the total number of samples that you must actually collect in order to consider your data set “complete.” For various reasons, your volunteers will likely not collect samples at every site on every date. If there are too many of these “holes” in your data, analysis will be difficult. So you need to set a target. For example, you might decide that your data set is complete if least 80% (say, 4 out of 5) of the samples are collected at each site during the season.
Representativeness: the extent to which the samples you collect reflect the true environmental condition or population you are monitoring. This relates to where in the river system, or water column, or in the stream or lake cross section you take your samples. It may also relate to the number of samples you take at a site. Data quality objectives for representativeness can be narrative and/or numerical. For example, your data quality objective might be to collect 3 replicate samples at each site, from a specific depth location in the water column, in a reach that represents riffle habitat in a river.
Comparability: the extent to which data from one study can be compared with past data from the same study or another one. You may want to compare your data with that collected by the MA DEP last year. Or you may want to compare your data this year with data you collected five years ago. This is a narrative, rather than a numerical objective. For example, you might say that you wish to compare your secchi disk readings of this summer with those of the NH DES for past 5 years. That means you’ll need to use the same method this summer as the NH DES did for the past five summers.
You set data quality objectives for sampling for each type of sample you will collect (for example water or river bottom).
Data Quality Objectives for Analysis
These apply to each indicator you are monitoring. They will help you select an appropriate analytical method for each indicator.
Detection Limit: the lowest concentration of a given indicator that your methods or equipment can detect and report as greater than “0.” Any reading below this point is considered unreliable and would instead be reported as the detection limit itself. The detection limit you set should be based on levels you need to be able to measure in order to detect problems or changes over time, depending on your monitoring question(s). For example, let’s say you determine (from consultations with state water quality officials) that problem concentrations of phosphorus in your river are at or above 0.05 mg/L. In
STEP 4: WHAT ARE YOUR DATA QUALITY OBJECTIVES??
Merrimack River Watershed Study Design Workbook Page 50
order to be able to reliably detect this concentration, your technical committee advises you to be able to measure down to 0.01 mg/L. This would become your detection limit. In certain lakes, you might have to measure an order of magnitude more sensitive (0.001 mg/L). You would use this detection limit to select a method. For example, if you have selected a method that uses a color wheel as the colorreading instrument for this test 4 , you may only be able to reliably detect down to 0.1 mg/l – that device would not meet your data quality objective for phosphorus. So, you would consider an electronic instrument that could detect those levels. You may be able to find the detection limit for an instrument from its manufacturer. Be aware, however, that there’s a difference between the ability of an instrument to read a color or concentration (instrument detection limit) and the detection limit of the whole method (sometimes referred to as the “method detection limit”) which would include every step in a laboratory procedure, only one of which is the limit of the instrument.
Measurement Range: the range of reliable measurement of an instrument or measuring device. Any reading above the upper limit or below the lower limit (your detection limit) is considered unreliable. The measurement range should include the range of levels that you need to be able to measure for each indicator. For example, the MA water quality standards say that results for pH should fall between 6.5 8.3 pH units, and that results should not fall more than 0.5 units outside of the background range. So, your measurement range should include this range. Actually, your measurement range should be quite a bit broader than this, to enable you to detect problem levels and changes over time and to detect at least 0.5 units outside of the range Let’s also say you wish to detect trends over time in an acidified lake where you regularly get results in the 5.1 6.0 range. Your technical committee might advise you to have a measurement range of 4.0 10.0. You would need to select a method that would enable you to measure this range.
Precision: the degree of agreement among repeated measurements of the same indicator on the same sample. This tells you how consistent and reproducible your field and laboratory methods are. Precision is usually expressed as ± (plus or minus) a given level. For example, a precision objective of ± 0.1 mg/l means that two measurements of the same sample should not be greater or less than each other by more than 0.1 mg/l. For example, if you measure the same sample twice for dissolved oxygen and come up with concentrations of 6.3 and 9.7 mg/l, the precision would be ±. 3.4 mg/L. If the water quality standard for dissolved oxygen is 7.0 mg/l, you don’t really know if you violated the standard or not. Though you will likely never get exactly the same result, your method should be precise enough to give you confidence that differences among your samples are due to real differences in levels, not the imprecision your analytical method. Data quality objectives for precision are usually expressed relative to quality control samples (see study design Step 8: “What Are Your Quality Assurance Measures?”).
Accuracy: how close a measurement of an indicator is to the “true” or expected value. This tells you how close to being “right” your measurements are, assuming you know
4 the test relies on turning the sample a color in direct proportion to the concentration. This color is then read optically or measured using an electronic device.

STEP 4: WHAT ARE YOUR DATA QUALITY OBJECTIVES??
Merrimack River Watershed Study Design Workbook Page 51
what the true value is. True values can be a known concentration of an indicator that you or another lab makes up and you analyze. Or, the true can be the results of the measurement of an indicator in a sample by a certified professional or government lab. Here, you are assuming that their results are the true value. If you and that lab analyze the same sample, you would compare your results with theirs to determine your accuracy. In either case, you don’t know with 100% certainty that the known concentration or the results from a certified lab is the true value, since errors in making up concentrations or measurements can occur even in the best laboratory. Another way of assessing accuracy is through an “expected” value. In this case, a portion of a real river or lake water sample is treated by adding a known amount and concentration of the indicator being measured, then measuring the concentration. This should increase the concentration in the sample relative to an untreated portion of the same sample by a predictable, or expected, amount. Accuracy is usually expressed as a ± (plus or minus) a given level. For example, an accuracy objective of ± 0.1 mg/l means the difference between your measurement and that of the true or expected value should not be greater or less than 0.1 mg/l. Data quality objectives for accuracy are usually expressed relative to quality control samples (see study design Step 8: “What Are Your Quality Assurance Measures?”)
You set data quality objectives for analysis for each indicator you will measure (for example bacteria or benthic macroinvertebrates).
Setting Data Quality Objectives
Determining appropriate data quality objectives may be difficult. Essentially, this step is asking you to predict how good your data will be before you really know. Your data users may be helpful here – they may have objectives that you need to meet in order for them to use your data. If not, you may have to set tentative objectives, verify through experimentation that you can meet them, and possibly change them based on your experience.
In any case, remember that you determine your own data quality goal. If you can’t meet the data quality objectives associated with that goal, you can always change the goal.
STEP 4: WHAT ARE YOUR DATA QUALITY OBJECTIVES??
Merrimack River Watershed Study Design Workbook Page 52
STEPS TO SETTING DATA QUALITY OBJECTIVES
Step 1: Determine whether you need to set data quality objectives for your data users. If you’re using federal funds and preparing a Quality Assurance Project Plan (QAPP), you will need to. Otherwise, it may be optional. If you are not preparing a QAPP, consult with your most rigorous data users to find out if they require you to set objectives.
Step 2: Consult with your most rigorous data users and find out if they have established data quality objectives for each of your sample types and indicators. If so, consider using their objectives.
Step 3: Consult with your technical committee and/or VEMN staff to help you determine if you need to set data quality objective. At this point, you may not need to set data quality objectives. Your technical committee and/or VEMN staff may recommend that you get a season’s worth of sampling under your belt, then set objectives based on your actual capabilities.
Step 4: If needed, with your technical committee and/or VEMN staff, establish preliminary data quality objectives for each type of sample and for each indicator. Consult the “VEMN Guide to Volunteer Watershed Monitoring Options” for a list of recommended methods for the survey you’ve selected. Consult with people who have experience in these methods to help you set preliminary objectives.
Step 5: Revisit your data quality objectives after your first sampling season. Did you meet them? Can you meet them.
Step 6: Adjust your data quality objectives (and possibly your goal) according to actual experience. You may need to adjust your data quality objectives to meet your capabilities. Be sure to consult with your technical committee and data users to confirm that your adjustments are acceptable. If not, you may have set unrealistic expectations for your program and you may need to revisit your overall data quality goal.
IN YOUR STUDY DESIGN: Part 2: Monitoring Design (continued)
B. List your data quality objectives for sampling for each type of sample. 1) Completeness 2) Representativeness 3) Comparability
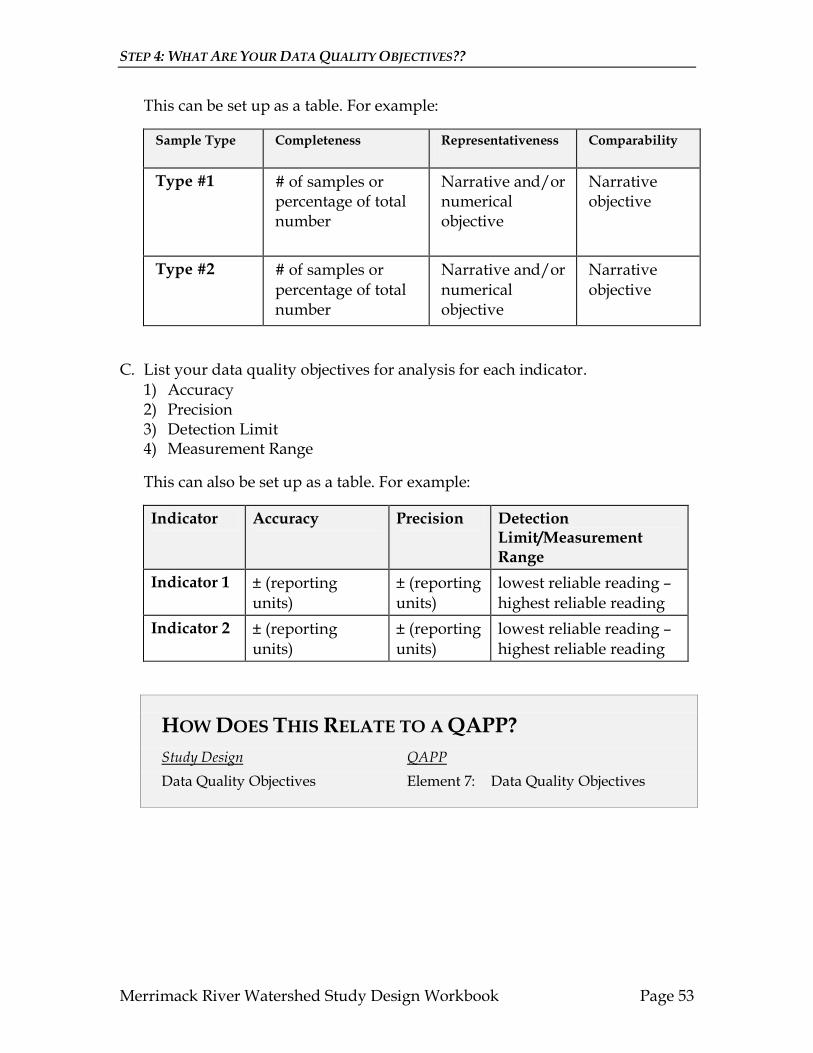
STEP 4: WHAT ARE YOUR DATA QUALITY OBJECTIVES??
Merrimack River Watershed Study Design Workbook Page 53
This can be set up as a table. For example:
Sample Type Completeness Representativeness Comparability
Type #1 # of samples or percentage of total number
Narrative and/or numerical objective
Narrative objective
Type #2 # of samples or percentage of total number
Narrative and/or numerical objective
Narrative objective
C. List your data quality objectives for analysis for each indicator. 1) Accuracy 2) Precision 3) Detection Limit 4) Measurement Range
This can also be set up as a table. For example:
Indicator Accuracy Precision Detection Limit/Measurement Range
Indicator 1 ± (reporting units)
± (reporting units)
lowest reliable reading – highest reliable reading
Indicator 2 ± (reporting units)
± (reporting units)
lowest reliable reading – highest reliable reading
HOW DOES THIS RELATE TO A QAPP? Study Design QAPP Data Quality Objectives Element 7: Data Quality Objectives

Merrimack River Watershed Study Design Workbook Page 54
STEP 5: HOW WILL YOU MONITOR?
In This Chapter: • Monitoring Methods: Background Information • Things To Consider In Selecting Methods • Steps To Selecting Methods • What Should Go Into Your Study Design • How Does This Relate To a QAPP?
Back in study design Step 3, you tentatively selected a “survey” from the list in the VEMN Guide to Volunteer Watershed Monitoring Options that addresses your question(s). Now it’s time to firm up that selection in light of your data quality objectives (from the previous study design step) and your capabilities to use the methods associated with each.
Chapter III of the VEMN Guide to Volunteer Watershed Monitoring Options contains “Monitoring Options” tables that list the recommended analytical methods for each water quality indicator listed in each survey. So, if you’ve selected one of these surveys, all you need to do is become familiar with what’s involved in the recommended methods, make your final selection of indicators based on your ability to carry out these methods, and, where several methods are listed for an indicator, choose one method that best meets your data quality objectives.
MONITORING METHODS: BACKGROUND INFORMATION
Monitoring methods for a particular indicator basically involve observing or measuring to detect the presence or determine the abundance or concentration of the indicator in the medium you’re sampling. Sometimes a sample of the medium (e.g. water, river bottom) is collected in a container and then analyzed in the field or lab. Sometimes, the medium is analyzed directly, without collecting a sample, for example when you stick a probe directly into a river or lake to measure dissolved oxygen or pH. Sometimes, the indicator is just observed without touching it at all, as when you note the color of the water or ask a survey respondent a question.
STEP 5: HOW WILL YOU MONITOR?
Merrimack River Watershed Study Design Workbook Page 55
In this section, we’ll define some of the basic monitoring terms and concepts that you will need to understand your monitoring options. We’ll describe the types of methods for the two parts of monitoring: sampling and analysis.
STEP 5: HOW WILL YOU MONITOR?
Merrimack River Watershed Study Design Workbook Page 56
Sampling Methods
Following is some background information on the type of sampling containers, quantity of sample to be collected and sample preservation techniques for the different types of sampling media: water, benthic macroinvertebrates, habitat, public health, and nonpoint source sites. In your study design, you will create a table summarizing this information.
TYPES OF WATER SAMPLES
Water samples can be collected in various ways:
• Grab Samples: These are samples collected in some type of container by dipping the container in the water and filling it to some predetermined level.
• Integrated Samples: These are samples collected from various depths or locations across a transect that are combined into one sample for analysis.
• Multiple Depth Samples: These are individual samples collected at various depths and analyzed separately.
• Direct Measurement: The indicator is measured directly from the water without collecting a sample.
Sample Handling Requirements
How you handle the sample, from the time it’s collected until you analyze it, can affect your results. If the samples are not analyzed upon collection, then they may need to be preserved in various ways, depending on the indicator. Sample handling includes the type of container you use, the amount of sample you collect, whether and how you preserve the sample, and the holding time between sampling and analysis:
• Sample Containers: Sample containers have different designs, are made out of different materials, and (if they are to be reused) must be cleaned (and possibly sterilized) to remove all traces of previous samples. The design, material, and treatment of sampling containers are important in determining the container’s ability to capture a sample, the tendency of an indicator to bind to the container, and how easy it is to clean the container. For example, if you are trying to detect low levels of a particular indicator, your results may be affected by the extent to which the indicator remains attached to the container wall from previous samples.
• Sample Size: The amount of sample that must be collected to perform the analysis.
• Preservation: The concentration of some indicators changes over time. For example, dissolved oxygen levels in your sample container can change if there is any photosynthetic activity. Preservation stabilizes the indicator so that it remains at the concentration it was at the time of collection.
STEP 5: HOW WILL YOU MONITOR?
Merrimack River Watershed Study Design Workbook Page 57
• Maximum Holding Time: The maximum holding time is the amount of time that the sample can be stored from the time of collection until it is analyzed and still yield accurate results. Preservation is accounted for in setting the holding times.
Your sampling method should specify the sample handling requirements for each of these factors. Common sampling containers, sample sizes, preservation techniques, and holding times are listed in the table below:
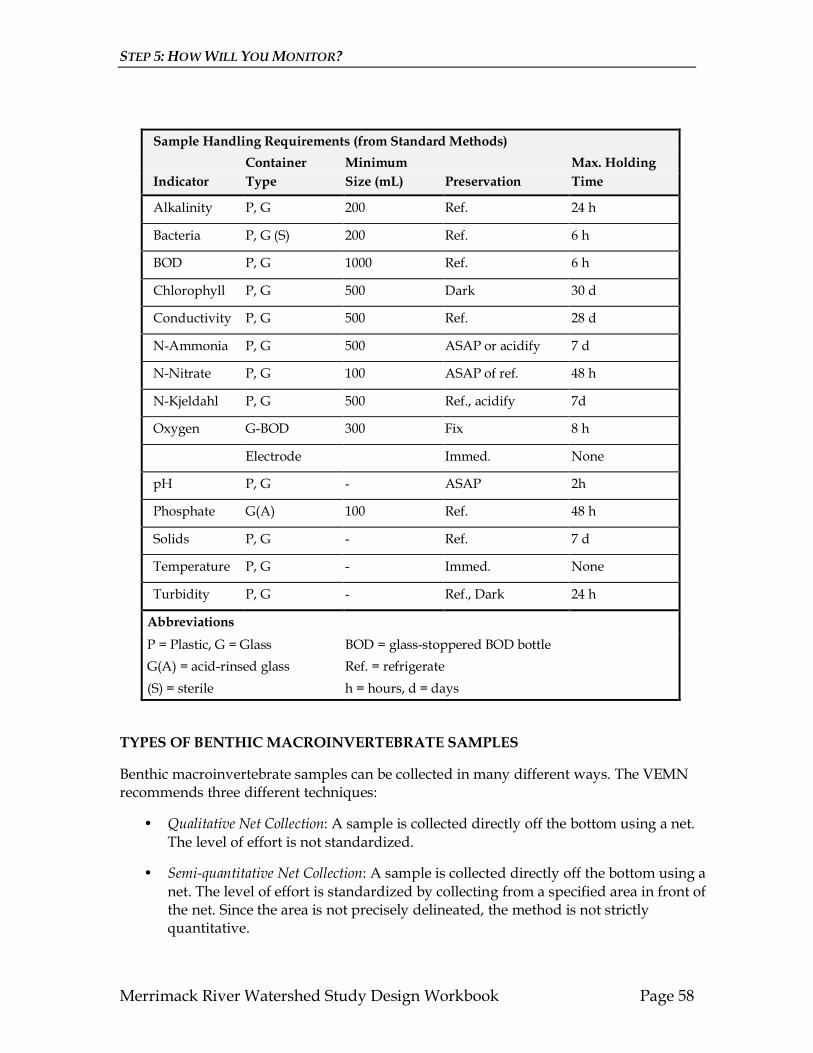
STEP 5: HOW WILL YOU MONITOR?
Merrimack River Watershed Study Design Workbook Page 58
Sample Handling Requirements (from Standard Methods) Container Minimum Max. Holding
Indicator Type Size (mL) Preservation Time
Alkalinity P, G 200 Ref. 24 h
Bacteria P, G (S) 200 Ref. 6 h
BOD P, G 1000 Ref. 6 h
Chlorophyll P, G 500 Dark 30 d
Conductivity P, G 500 Ref. 28 d
NAmmonia P, G 500 ASAP or acidify 7 d
NNitrate P, G 100 ASAP of ref. 48 h
NKjeldahl P, G 500 Ref., acidify 7d
Oxygen GBOD 300 Fix 8 h
Electrode Immed. None
pH P, G ASAP 2h
Phosphate G(A) 100 Ref. 48 h
Solids P, G Ref. 7 d
Temperature P, G Immed. None
Turbidity P, G Ref., Dark 24 h
Abbreviations
P = Plastic, G = Glass BOD = glassstoppered BOD bottle G(A) = acidrinsed glass Ref. = refrigerate (S) = sterile h = hours, d = days
TYPES OF BENTHIC MACROINVERTEBRATE SAMPLES
Benthic macroinvertebrate samples can be collected in many different ways. The VEMN recommends three different techniques:
• Qualitative Net Collection: A sample is collected directly off the bottom using a net. The level of effort is not standardized.
• Semiquantitative Net Collection: A sample is collected directly off the bottom using a net. The level of effort is standardized by collecting from a specified area in front of the net. Since the area is not precisely delineated, the method is not strictly quantitative.
STEP 5: HOW WILL YOU MONITOR?
Merrimack River Watershed Study Design Workbook Page 59
• Quantitative Rock Baskets: A sample is collected by placing rockfilled baskets on the bottom and allowing them to be colonized. The time they are left out is standardized at six weeks and the colonization area in each basket is roughly the same. This is the most quantitative collection method recommended by the VEMN.
For laboratory analysis, benthic macroinvertebrate samples are typically preserved in 90% ethyl alcohol.
TYPES OF PHYSICAL HABITAT SAMPLES
Habitat is typically sampled in one of two ways: • Visual estimates of each of the habitat characteristics, or
• Field measurements of each of the habitat characteristics.
TYPES OF PUBLIC HEALTH SAMPLES
Public health is sampled for exposure and for the incidence of disease. Exposure is It is typically sampled as follows:
• Water Samples: these are then analyzed for the contaminant of concern
• Fish or Shellfish Samples: these are then analyzed for the contaminant of concern
The incidence of disease is typically sampled as follows:
• Epidemiological Surveys: these are administered to the target population of water users or shellfish consumers.
TYPES NONPOINT SOURCE SITES SAMPLES
These sites are typically sampled for various visual indicators using:
• Visual Estimates: the occurrence and extent of nonpoint source site indicators is estimated visually.
Analysis Methods
Analysis methods are the specific procedures that you use to determine the presence, concentration, or abundance of the indicator you are measuring. Analysis can be done in the field, by direct measurement, for example, or the sample is brought to a lab.
Chapter III of the VEMN Guide to Volunteer Watershed Monitoring Options contains “Monitoring Options” tables that list the recommended analytical methods for each water quality indicator listed in each survey. The “Examples of Methods (Source)” column in the tables lists examples of methods that are appropriate for each indicator/tool in order to meet the data quality goals of the survey. The table does not list all the appropriate methods. In most cases, there are a number of methods that are appropriate. We list the examples as a reference point we know the methods listed will meet the stated data quality goals. Equivalent methods are certainly acceptable, if the people or organizations that you expect to use your data approve.
STEP 5: HOW WILL YOU MONITOR?
Merrimack River Watershed Study Design Workbook Page 60
Following is a partial annotated list of the sources of analytical methods recommended by the VEMN:
• VEMN (MRWC): Training Manual for Core VEMN Monitoring Parameters and Methods – This manual explains how to do a Preliminary Watershed Assessment and a Water Quality Standards Assessment. We suggest starting with this manual. It is based on adaptations of RWN, MassWWP, and MA Riverways methods.
• American Public Health Association’s Standard Methods for the Examination of Water and Wastewater (generally referred to as “Standard Methods”) – This book is the standard reference for the analysis of water samples. In this thick book you will find procedures to analyze most any water quality indicator you can think of. However, it is written in a technical style that assumes a certain level of experience with laboratory procedures. Often you will find several methods for analyzing a given indicator. The emphasis is on rigorous methods.
• Global Rivers Environmental Education Network (Mark Mitchell and William Stapp): Field Manual for Water Quality Monitoring – One of the first userfriendly water quality monitoring manuals, now in its 11th edition. This is aimed primarily at schools and focuses on basic methods, some of which are adaptations of Standard Methods..
• Massachusetts Riverways Programs: Adopt A Stream Shoreline Survey – This manual explains how to do a shoreline survey, from planning it to analyzing the results and developing an action plan.
• Massachusetts Water Watch Partnership, Manual for Water Quality Monitors – This manual focuses on how to do a windshield survey and how to analyze core indicators in rivers and lakes. This manual uses adaptations of Standard Methods with rigorous quality control.
• River Watch Network: Testing the Waters: Physical and Chemical Vital Signs of a River– This manual focuses on water sampling and analysis for schools and beginning monitoring groups. It’s one step up in rigor from the GREEN manual in that it uses adaptations of Standard Methods.
• River Watch Network: Living Waters: Using Benthic Macroinvertebrates and Habitat to Assess the Health of Rivers– This manual is a menu of methods to sample and analyze benthic macroinvertebrates and habitat. Methods range from simple field assessments to rigorous collection, identification, and data analysis techniques.
• U. S. EPA Methods for Chemical Analysis of Water and Wastes– This out of print lab manual is comparable to Standard Methods, though less comprehensive. It is still used by EPA labs and is frequently referenced as a source of lab methods. In most cases, however, the methods are in Standard Methods in updated form.
• U.S. EPA: Rapid Bioassessment Protocols for Use In Streams and Rivers – This manual is meant for professional aquatic biologists to use to assess benthic macroinvertebrates, habitat and fish in the field. It is not especially userfriendly for schools and volunteer groups, and the methods require the assistance of a professional.
STEP 5: HOW WILL YOU MONITOR?
Merrimack River Watershed Study Design Workbook Page 61
• U.S. EPA Methods Manuals: These manuals focus on field methods to monitor streams, lakes, and estuaries. They are wellillustrated and clear, though limited to relatively simple field methods.
Volunteer Stream Monitoring: A Methods Manual Volunteer Lake Monitoring: A Methods Manual Volunteer Estuary Monitoring: A Methods Manual
• U.S. Forest Service: Stream Channel Reference Sites– This document describes field techniques for assessing stream channel morphology by establishing longterm reference sites and measuring various physical stream channel characteristics.
• Monitoring Equipment Manufacturers’ Adaptations of Standard Methods – Various manufacturers (Hach and LaMotte being the most common) have adapted Standard Methods and other procedures for use with their equipment and supplies. IN many cases, VEMN and others use these adaptations because they are user friendly and produce reliable results. Some are EPAapproved, but beware! Some of their adaptations are not specifically EPAapproved, only the method they’re basing their adaptations on.
• University of NH Cooperative Extension: Following the Flow (Nonpoint Source Pollution Site Evaluation) – This manual explains how to do a nonpoint source site evaluation. It’s the only one we know of that focuses on assessing the land sites themselves.
Appendix 1 of the VEMN Guide to Volunteer Watershed Monitoring Options describes the analytical methods for each of the indicators listed in each of “Monitoring Options” tables in Chapter III of the Guide. Consult it to get a sense of what’s involved with each method.
THINGS TO CONSIDER IN SELECTING METHODS: Since the surveys in the VEMN Guide list monitoring methods appropriate for each indicator, your job is fairly simple. You need to select appropriate indicators. For some indicators, more than one method is recommended. So, you still may need to make some choices on methods. Here are some things to consider:
Scientific Considerations:
• Does it meet your data quality objectives? How accurate is it? How precise (reproducible) is it? What is its detection limit?
• Will it measure the indicator in the range that you need? • What lab facilities are required? • What equipment is required? • Does it yield samples that are representative? • Is it comparable to methods used by agencies collecting similar
information?
STEP 5: HOW WILL YOU MONITOR?
Merrimack River Watershed Study Design Workbook Page 62
Practical and Program Considerations:
• Do you have the human and financial resources to do it? • How difficult is it? • How timeconsuming is it? • Will it produce data useful to the target audience?

STEP 5: HOW WILL YOU MONITOR?
Merrimack River Watershed Study Design Workbook Page 63
STEPS TO SELECTING METHODS
Step 1: Review the “Monitoring Options” table in the VEMN Guide to Volunteer Watershed Monitoring Options document for the survey you’ve selected. Note the methods listed in the “Examples of Methods” column in the table.
Step 2: Read the description of each method suggested for your survey in Appendix 1 of the VEMN Guide to Volunteer Watershed Monitoring Options document. For surveys that have “basic” and “rigorous” options, familiarize yourself with the methods for each.
Step 3: Consult with your technical committee and/or VEMN staff to help you determine whether you have the human and financial resources and capability to carry out the methods listed. Review your data quality goal and objectives (if established). Do the methods meet the objectives? Can you carry out these methods? If not, which ones can you do? Note that you may not need to measure all of the indicators listed. You also may need to switch from the rigorous to basic version of the survey.
Step 4: Finalize your selection of a survey and, within that survey, which indicators you will monitor and methods you will use.
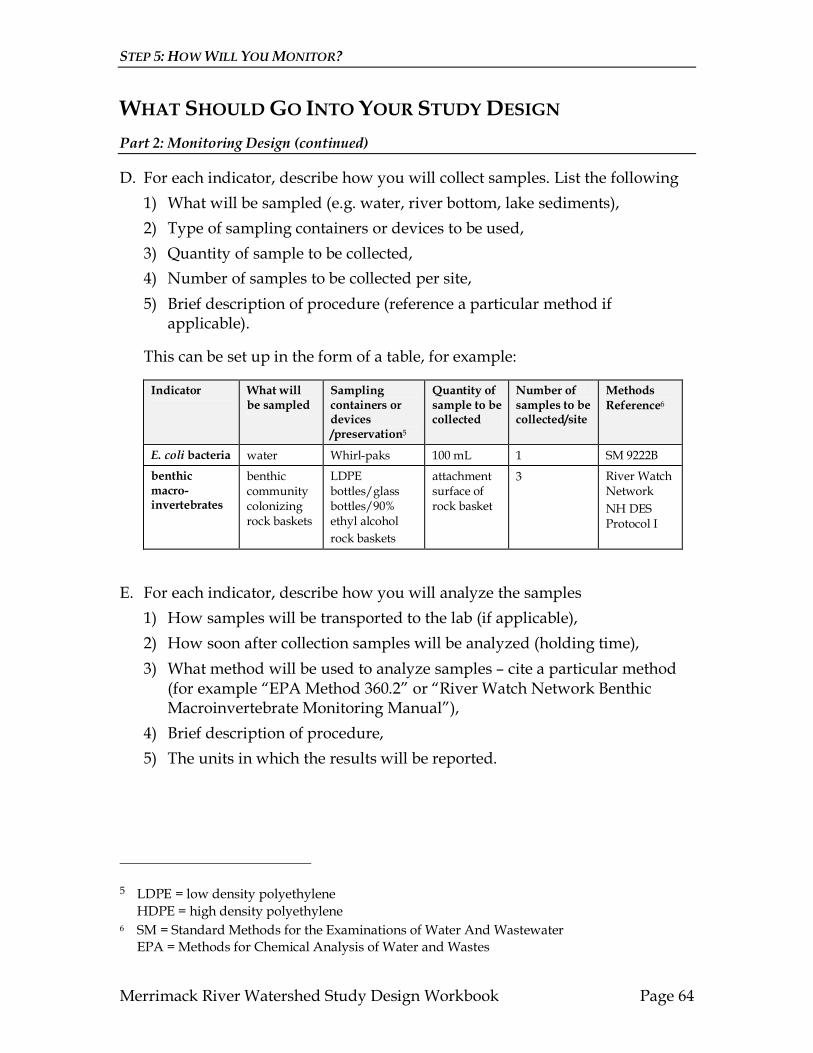
STEP 5: HOW WILL YOU MONITOR?
Merrimack River Watershed Study Design Workbook Page 64
WHAT SHOULD GO INTO YOUR STUDY DESIGN
Part 2: Monitoring Design (continued)
D. For each indicator, describe how you will collect samples. List the following 1) What will be sampled (e.g. water, river bottom, lake sediments), 2) Type of sampling containers or devices to be used, 3) Quantity of sample to be collected, 4) Number of samples to be collected per site, 5) Brief description of procedure (reference a particular method if
applicable).
This can be set up in the form of a table, for example:
Indicator What will be sampled
Sampling containers or devices /preservation 5
Quantity of sample to be collected
Number of samples to be collected/site
Methods Reference 6
E. coli bacteria water Whirlpaks 100 mL 1 SM 9222B benthic macro invertebrates
benthic community colonizing rock baskets
LDPE bottles/glass bottles/90% ethyl alcohol rock baskets
attachment surface of rock basket
3 River Watch Network NH DES Protocol I
E. For each indicator, describe how you will analyze the samples 1) How samples will be transported to the lab (if applicable), 2) How soon after collection samples will be analyzed (holding time), 3) What method will be used to analyze samples – cite a particular method
(for example “EPA Method 360.2” or “River Watch Network Benthic Macroinvertebrate Monitoring Manual”),
4) Brief description of procedure, 5) The units in which the results will be reported.
5 LDPE = low density polyethylene HDPE = high density polyethylene
6 SM = Standard Methods for the Examinations of Water And Wastewater EPA = Methods for Chemical Analysis of Water and Wastes
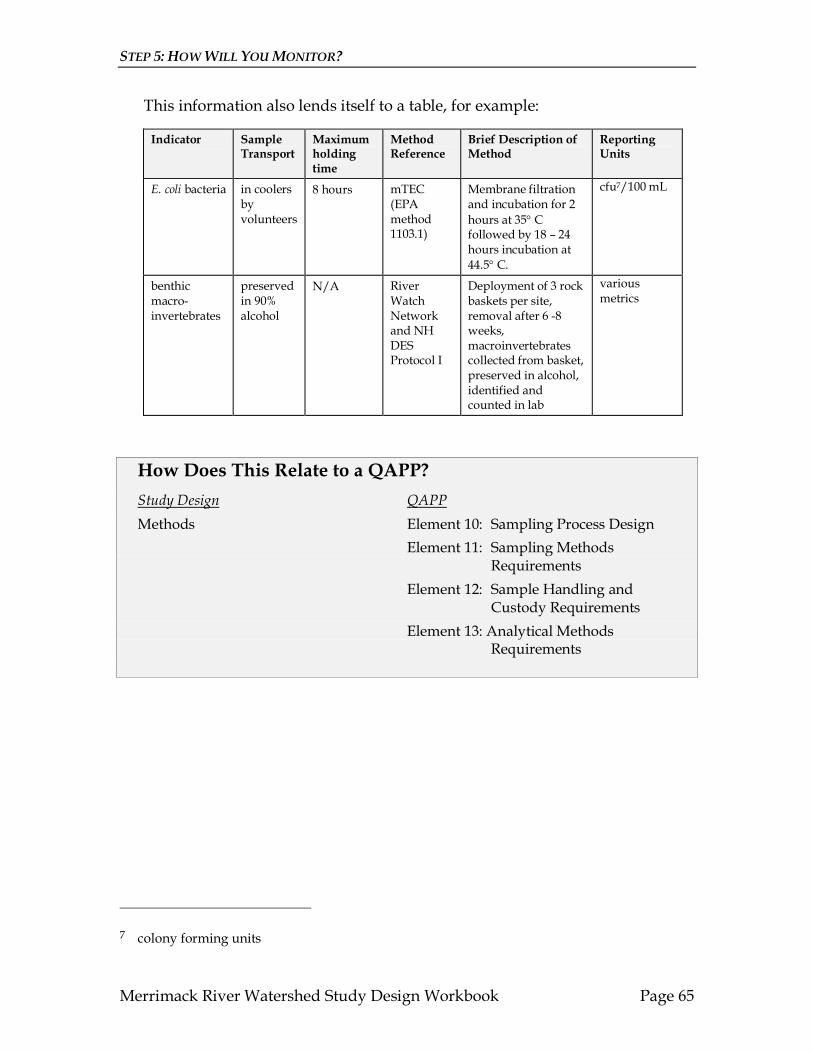
STEP 5: HOW WILL YOU MONITOR?
Merrimack River Watershed Study Design Workbook Page 65
This information also lends itself to a table, for example:
Indicator Sample Transport
Maximum holding time
Method Reference
Brief Description of Method
Reporting Units
E. coli bacteria in coolers by volunteers
8 hours mTEC (EPA method 1103.1)
Membrane filtration and incubation for 2 hours at 35° C followed by 18 – 24 hours incubation at 44.5° C.
cfu 7 /100 mL
benthic macro invertebrates
preserved in 90% alcohol
N/A River Watch Network and NH DES Protocol I
Deployment of 3 rock baskets per site, removal after 6 8 weeks, macroinvertebrates collected from basket, preserved in alcohol, identified and counted in lab
various metrics
How Does This Relate to a QAPP? Study Design QAPP Methods Element 10: Sampling Process Design
Element 11: Sampling Methods Requirements
Element 12: Sample Handling and Custody Requirements
Element 13: Analytical Methods Requirements
7 colony forming units
Merrimack River Watershed Study Design Workbook Page 66
STEP 6: WHERE WILL YOU MONITOR?
In This Chapter: • General Monitoring Location Approaches: Background Information • Types of Monitoring Sites: Background Information • Site Specific Sampling Locations for Water and Benthic
Macroinvertebrates • Practical Site Selection Considerations • Where Will You Analyze Samples? • Steps to Selecting Monitoring Locations • What Should Go Into Your Study Design • How Does This Relate To a QAPP?
In your monitoring rationale (Study Design Step 1), you identified your waters of interest. Now it’s time to identify the specific locations at which you will collect monitoring information.
When researchers select the number of sampling locations they will monitor, they may use complex mathematical equations that are geared to producing the type of data they want. For our purposes, we will describe a nonmathematical approach to do selecting sampling locations.
This chapter works from the general to the specific. First, to help you establish the overall geographic scale of your monitoring, we’ll start out describing the general monitoring location approaches. Then we’ll describe the different types of monitoring sites within these general approaches. Then we’ll describe some sitespecific sampling location considerations – where at the site to collect samples, measurements, or observations. Next, we’ll describe some practical considerations that you need to think about when selecting sites. Finally, we’ll cover the basic options for where to analyze samples.
Remember, the VEMN Guide to Volunteer Watershed Monitoring Options lists site selection criteria and types of sites for each type of survey you’ve selected.
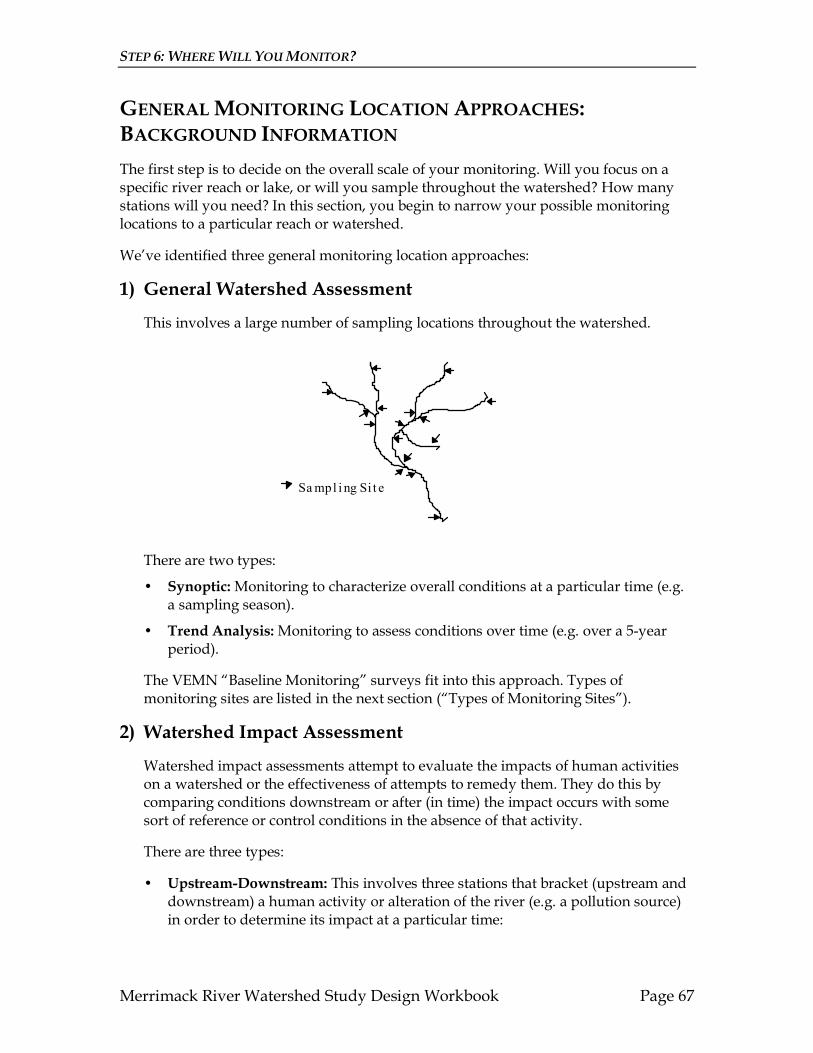
STEP 6: WHERE WILL YOU MONITOR?
Merrimack River Watershed Study Design Workbook Page 67
GENERAL MONITORING LOCATION APPROACHES: BACKGROUND INFORMATION
The first step is to decide on the overall scale of your monitoring. Will you focus on a specific river reach or lake, or will you sample throughout the watershed? How many stations will you need? In this section, you begin to narrow your possible monitoring locations to a particular reach or watershed.
We’ve identified three general monitoring location approaches:
1) General Watershed Assessment
This involves a large number of sampling locations throughout the watershed.
Sampl i ng Si t e
There are two types:
• Synoptic: Monitoring to characterize overall conditions at a particular time (e.g. a sampling season).
• Trend Analysis: Monitoring to assess conditions over time (e.g. over a 5year period).
The VEMN “Baseline Monitoring” surveys fit into this approach. Types of monitoring sites are listed in the next section (“Types of Monitoring Sites”).
2) Watershed Impact Assessment
Watershed impact assessments attempt to evaluate the impacts of human activities on a watershed or the effectiveness of attempts to remedy them. They do this by comparing conditions downstream or after (in time) the impact occurs with some sort of reference or control conditions in the absence of that activity.
There are three types:
• UpstreamDownstream: This involves three stations that bracket (upstream and downstream) a human activity or alteration of the river (e.g. a pollution source) in order to determine its impact at a particular time:
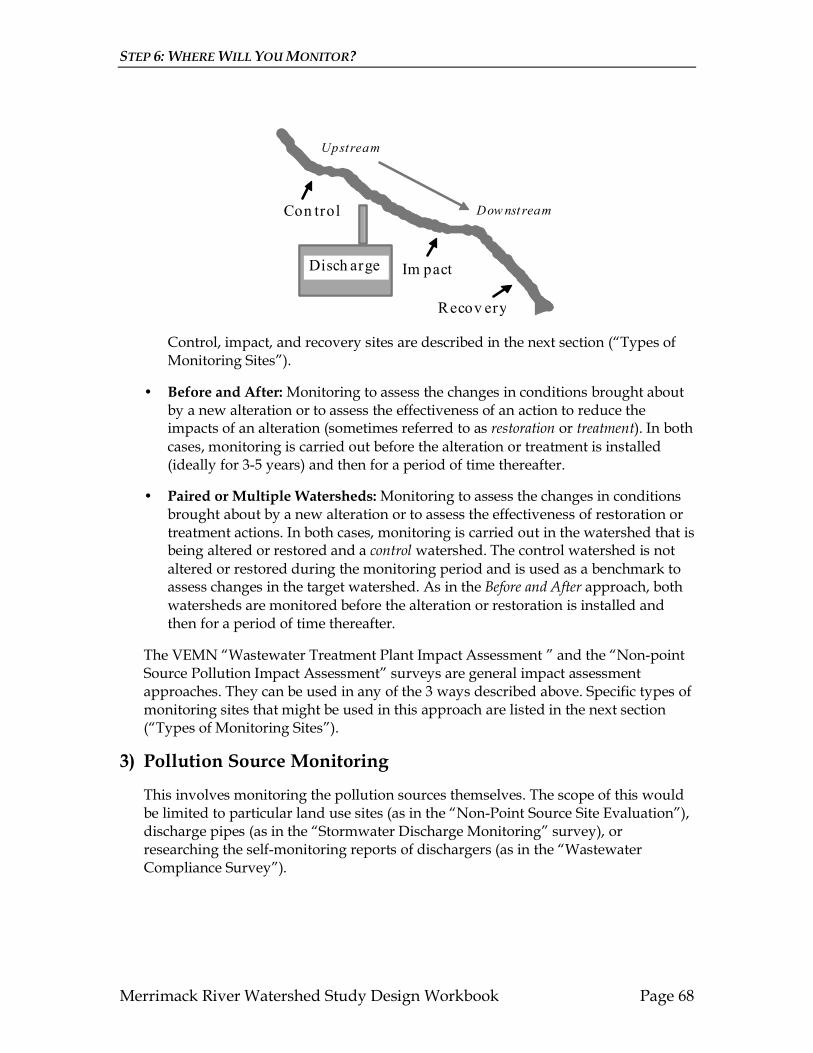
STEP 6: WHERE WILL YOU MONITOR?
Merrimack River Watershed Study Design Workbook Page 68
Con trol
Im pact
Recov ery
Disch arge
Upstream
Downst ream
Control, impact, and recovery sites are described in the next section (“Types of Monitoring Sites”).
• Before and After: Monitoring to assess the changes in conditions brought about by a new alteration or to assess the effectiveness of an action to reduce the impacts of an alteration (sometimes referred to as restoration or treatment). In both cases, monitoring is carried out before the alteration or treatment is installed (ideally for 35 years) and then for a period of time thereafter.
• Paired or Multiple Watersheds: Monitoring to assess the changes in conditions brought about by a new alteration or to assess the effectiveness of restoration or treatment actions. In both cases, monitoring is carried out in the watershed that is being altered or restored and a control watershed. The control watershed is not altered or restored during the monitoring period and is used as a benchmark to assess changes in the target watershed. As in the Before and After approach, both watersheds are monitored before the alteration or restoration is installed and then for a period of time thereafter.
The VEMN “Wastewater Treatment Plant Impact Assessment ” and the “Nonpoint Source Pollution Impact Assessment” surveys are general impact assessment approaches. They can be used in any of the 3 ways described above. Specific types of monitoring sites that might be used in this approach are listed in the next section (“Types of Monitoring Sites”).
3) Pollution Source Monitoring
This involves monitoring the pollution sources themselves. The scope of this would be limited to particular land use sites (as in the “NonPoint Source Site Evaluation”), discharge pipes (as in the “Stormwater Discharge Monitoring” survey), or researching the selfmonitoring reports of dischargers (as in the “Wastewater Compliance Survey”).
STEP 6: WHERE WILL YOU MONITOR?
Merrimack River Watershed Study Design Workbook Page 69
TYPES OF MONITORING SITES: BACKGROUND INFORMATION
In this section, we’ll review the different types of monitoring sites:
1) General Watershed Assessment Sites
2) River Impact Assessment Sites
3) Pollution Source Monitoring Sties
4) Public Health Monitoring Sties
1) General Watershed Assessment Sites
These sites would be relevant to the “Water Quality Standards” and “Baseline Monitoring” surveys when your focus is on an entire watershed or tributary watershed.
Watershed Reference Sites: These are sites that are in the leastdeveloped parts of the watershed and represent “leastimpaired” conditions. They are used as a benchmark against which to judge natural and human caused changes in the watershed, upstream to downstream and over time. Note that it is important to find these sites throughout the watershed in order to capture leastimpaired conditions along the natural continuum of change. Then, it will be possible to separate natural changes from those caused by humans.
River Impact Assessment Sites (see section 2 below): These include upstream reference, impact, and recovery sites that bracket some sort of human alteration of the river system. Locate these three sites wherever you wish to assess impacts in the watershed.
Fish Habitat Area Sites: There may be various types of habitat areas, including areas designated as “cold water” and “warm water” habitat, and others which may be used by fish as spawning, nursery, or resting areas. The idea is to assess conditions that affect fish species which use these sites.
Benthic Macroinvertebrate Macrohabitats: These are riverine sites that include riffles, runs, and pools: • Riffle Sites: Shallow (12’ deep), fastmoving (0.4 2.5 feet per second), cobble
bottom areas.
• Run Sites: Deeper (>2’ deep), moderately fastmoving (0.4 2.0 feet per second), sand and gravel bottom areas.
• Pool Sites: Deep (>2’ deep), slowmoving (<0.4 feet per second) mudbottom areas known as pools.

STEP 6: WHERE WILL YOU MONITOR?
Merrimack River Watershed Study Design Workbook Page 70
Within these larger macrohabitat areas and at each site, there will also be microhabitats that include different types of habitat structures: cobble bottoms, large woody debris, aquatic vegetation, and submerged bank vegetation.
Water Use Sites: These are sites where various types of human water use occur, such as swimming areas (formal and informal), boat launch areas, fishing access areas, and water supply intakes. The idea is to assess conditions that affect these uses at these sites.
Tributary Impact Assessment Sites: These sites assume that the tributary may be considered a pollution discharge to the main stem of the river. The idea is to bracket the mouth of each tributary assessed with four sites:
• Tributary Reference Sites: These sites are in the main stem of the river, upstream of the confluence with the tributary. They represent conditions in the main stem prior to the impact of the tributary.
• Tributary Impact Sites: These sites are in the main stem of the river, downstream of the confluence with the tributary, where the water from the tributary is completely mixed with the main stem 8 . Impact sites represent conditions in the main stem after the impact of the tributary.
• Tributary Recovery Sites: These sites are in the main stem of the river, downstream of the impact site. They represent conditions in the main stem after the impacts of the tributary have begun to diminish.
• Tributary Integrator Sites: These sites are at the mouth of the tributary. They represent the condition of the tributary before it enters the main stem.
Lake Assessment Sites: The big differences between monitoring lakes and monitoring rivers are that the water flow through lakes is much slower than in rivers and lakes tend to be deeper. Frequently, in summer and winter, lakes stratify into layers of similar temperature that don’t mix until spring and fall. So, in order to know what’s going on in a lake, you need to look vertically in the water column as well as in different parts of the lake. Following are some different types of lake assessment sites that account for the horizontal and vertical variations:
8 This is not an easy thing to determine. It depends on the current velocity, the distance from the tributary outlet to the farthest bank, the depth of flow, and the hydraulic forces across the stream. You may need to actually sample across the stream at various distances downstream of the tributary to determine where complete mixing occurs.

STEP 6: WHERE WILL YOU MONITOR?
Merrimack River Watershed Study Design Workbook Page 71
• Deepest Sites: The water in the deepest places in the main lake and in embayments tends to be the most representative of critical conditions in the lake. At these sites, you need to decide at what depth(s) you will take samples in order to assess the condition of different layers (see the “SiteSpecific Sampling Location Considerations for Water and Benthic Macroinvertebrates” section below for a fuller discussion of depth considerations).
• Mouths of Tributaries (Inlets): These are the same as the “tributary integrator sites” described above. They represent the condition of the tributary before it enters the lake.
• Lake Outlet: These sites are where the lake spills over a dam or enters a river. They represent the conditions of the water as it leaves the lake.
• Water Use Sites: These are sites where various types of human water use occur, such as swimming areas (formal and informal), boat launch areas, fishing access areas, and water supply intakes. The idea is to assess conditions that affect these uses at these sites.
• Near Shore Areas: Sites near the lakeshore are frequently the most heavily used an biologically productive areas of the lake. Many of the water use sites are here as are many of the places most suitable for nuisance aquatic weed growth.
2) River Impact Assessment Sites
These include at least three sites that bracket some sort of human alteration of the river system. These sites would be relevant to the “Wastewater Treatment Plant Impact Assessment ” and the “Nonpoint Source Pollution Impact Assessment” surveys when your focus is assessing human alteration of the river.
Upstream Reference (Control) Sites: These sites are upstream of some sort of human alteration of the river. They represent conditions in the river prior to the impact of the alteration.
Impact Sites: These sites are downstream of some sort of human alteration of the river. They represent conditions in the river after the impact of the alteration.
Recovery Sites: These sites are downstream of some sort of human alteration of the river. They represent conditions in the river after the impacts of the alteration have begun to diminish.
3) Pollution Source Monitoring Sites
STEP 6: WHERE WILL YOU MONITOR?
Merrimack River Watershed Study Design Workbook Page 72
In some cases, you may want to monitor a pollution source itself, in addition to your instream monitoring of the receiving water. This might be useful in an impact assessment, for example. These sites are used in the “NPS Site Evaluation ” and the “Stormwater Discharge Monitoring” surveys when your focus is assessing the character or quality of the alteration itself.
Stormwater Discharge Outlets: If the alteration you are assessing includes stormwater, sampling the discharge itself will represent the quality of the water being discharged to the river.
Nonpoint Source Pollution Sites: These are land sites that involve land uses that have the potential to generate polluted runoff, such as construction sites, farms, logging sites, and others.
4) Public Health Monitoring Sites
The focus for these sites are areas where people are coming into contact with the water or aquatic life. Examples include: • swimming areas (formal and informal), • boat launch areas, • fishing access areas, • shellfishing beds, • water supply intakes.
The idea is to collect samples of water or fish at these sites to assess whether they are contaminated. Then some basic epidemiological information about exposure and incidence of health problems is collected from people that come in contact with water or aquatic life to see if there is a link.

STEP 6: WHERE WILL YOU MONITOR?
Merrimack River Watershed Study Design Workbook Page 73
PRACTICAL SITE SELECTION CONSIDERATIONS
Finally, there are a few practical considerations when selecting your sites:
• For water sampling in rivers, the sites should be well mixed. In deeper rivers, that means that you should try to select sites where upstream turbulence has mixed the water column. Sample well below tributaries to avoid sampling the tributary plume when what you want is the main stem.
• You may want to monitor sites that have been monitored by your state water quality agency in the past.
• Sites should be safely accessible. Avoid steep, slippery or eroding banks.
• Be sure to get landowner permission before you select a site that requires entering private property.
• Pick a manageable number of sites for your volunteer base. Usually, two or three sites per volunteer team is plenty.
• Consider how far people will need to drive to access the sites. If you have a choice, pick sites that are easily accessible and easy to find.
SITESPECIFIC SAMPLING LOCATION CONSIDERATIONS FOR WATER AND BENTHIC MACROINVERTEBRATES
Once you’ve identified the general area of the river or lake where you plan to sample, you must also specify where at the site the samples will be collected. This is usually specified in the sampling method, but it’s worth mentioning here. For water sampling, the two main issues are where in the water column and where across the river you will collect samples:
Where In the Water Column (what depth)?
In Rivers
The main thing to think about is whether the water is evenly mixed from surface to bottom. If not, water quality may vary quite a bit at different depths, due to different water velocities. This is especially true for sediment in deep rivers with smooth bottoms. In this case, the different velocities at different depths would each be capable of carrying certain size particles in certain quantities. In these rivers, you may need to collect samples from multiple depths, depending on the indicator you are monitoring. Otherwise, a sample collected about 8” below the surface may be sufficient. In shallow, high velocity, turbulent streams, we generally make the assumption that the
STEP 6: WHERE WILL YOU MONITOR?
Merrimack River Watershed Study Design Workbook Page 74
water mixes fairly evenly from top to bottom. In these streams, water samples should be about half way between the surface and the bottom.
In Lakes
As described above, lakes are usually not homogenous throughout the water column. Generally, lakes stratify into three layers determined by the different density of water at different temperatures. These are the eplimnion, the metalimnion, and the hypolimnion, from surface to bottom. So, for some indicators, such as dissolved oxygen and nutrients, samples should be collected from each layer. These samples may be analyzed separately if your questions concern conditions at each layer. If not, the samples may be combined into a depthintegrated sample.
Where Across the Transect?
Water, habitat, and aquatic communities can also vary significantly across the river or lake (the transect due to uneven mixing of the indicator you are measuring. So, where you decide to collect the sample is important.
In Rivers
In general, we recommend that water samples and most measurements be collected in the main river current and away from the banks. at sites where the river seems to be evenly mixed. Uneven mixing across rivers occurs where tributaries join, downstream of structures such as dams or diversions, and at meanders. In these cases, you may want to collect samples at regular intervals across the stream. These samples can be analyzed separately, if you wish to measure the variation across the stream, or combined into an integrated sample to “average” the variation.
In Lakes
Obviously, lakes are going to vary even more dramatically across than rivers. This is especially true when the lake has many bays and coves. We recommend the deepest part of the main lake and bays for overall characterization and near shore areas for water use assessment and aquatic weed monitoring.
What Type of Microhabitat for Benthic Macroinvertebrates?
For the most part, the VEMN recommends sampling the cobblebottom micro habitats at riffle macrohabitats, largely because they contain the most abundant and diverse communities. However, if riffles and cobble are not available, rock baskets can be suspended in the water column in “run” type macrohabitats. Other microhabitats can be sampled directly, including aquatic vegetation, large woody debris, leaf packs, and root wads along the banks.
STEP 6: WHERE WILL YOU MONITOR?
Merrimack River Watershed Study Design Workbook Page 75
WHERE WILL YOU ANALYZE SAMPLES? Where you analyze 9 samples – in the field or in a lab – depends on the water quality indicators and methods you’ve chosen. For some indicators, there’s a choice.
In the Field
Field analysis is specified for indicators that will change during transport to the lab (for example, temperature). For others, such as dissolved oxygen or benthic macroinvertebrates, samples can be preserved ("fixed") in the field, and analyzed later in the lab.
Field meters may be used for some indicators, like dissolved oxygen and turbidity, for example. However, meters may be expensive, difficult to operate, and/or less sensitive than laboratory methods. Moreover, the number of sites you can sample will be limited by the number of meters you have, especially if you want all the measurements collected at approximately the same time.
Some methods use field kits to analyze samples at the collection sites. The kits contain all the reagents and supplies needed to perform analysis in the field. Field kits are often criticized for being crude, inaccurate, and imprecise – and some of them are. However, field kits vary significantly in sophistication, precision and sensitivity. Some are quite capable of producing high quality data.
In the Lab
Bacteria, certain forms of phosphorus and nitrogen, suspended solids, biochemical oxygen demand and benthic macroinvertebrate identification to family level must be done in the lab. This is because they require special equipment or facilities that can’t be brought into the field. For others, like pH, alkalinity, and dissolved oxygen, analysis in the lab is easier but not required.
For laboratory analysis, you have two main options: 1) You can send your sample to a certified professional lab (called an “outside” lab) to
be analyzed (usually for a fee); or 2) you can set up your own project lab, hire a lab coordinator and recruit volunteer
help for some or all of the analyses.
The choice depends on a host of factors such as the difficulty of the analytical methods, equipment required, program resources, availability of labs and experienced personnel, and other program goals such as involving students and volunteers in the lab work.
Sending your samples to an outside lab is generally the easier of the two options, particularly for analyses that are complicated and require expensive equipment. Some groups have found wastewater treatment plants willing to donate the analysis of a
9 Analysis is the testing of a sample to isolate and quantify the water quality indicator being measured.
STEP 6: WHERE WILL YOU MONITOR?
Merrimack River Watershed Study Design Workbook Page 76
certain number of samples. If the lab is certified by the state or EPA, your data may be more easily accepted by decisionmakers. A disadvantage is that the lab may not perform analyses on weekends. Also, some indicators, such as bacteria, require analysis within hours of collection, which may not be possible if no qualified lab is located nearby.
The expense of setting up your own project lab ranges from buying a few hundred dollars' worth of supplies to spending thousands of dollars on equipment and personnel. Many groups have had good luck with high school or university labs, where basic equipment is generally available and usually at least one teacher is interested and willing to help. Disadvantages include having to work around the academic schedule when classes are in session, the need to design and implement a quality assurance program, and the challenge of establishing the credibility of analyses performed in your project lab.
If you decide to set up your own project lab, you'll still need to identify an outside lab to perform quality assurancerelated activity such as making up known and unknown standard solutions, running duplicate analyses, and troubleshooting problems. Many groups have worked successfully with state, private, and university labs for this purpose.

STEP 6: WHERE WILL YOU MONITOR?
Merrimack River Watershed Study Design Workbook Page 77
STEPS TO SELECTING MONITORING LOCATIONS
Step 1: Refer to the ”VEMN Guide to Volunteer Watershed Monitoring” for the site selection considerations for each type of survey you selected.
Step 2: Consult with your technical committee and/or VEMN staff to help you refine these considerations into criteria you will use to select your sites to answer your questions.
Step 3: Use a topographic map to do a preliminary selection of sites that appear to meet your criteria . Categorize each site as to its type from the list in the “Types of Monitoring Sites” section above.
Step 4: Determine how many of these sites you can monitor. Consider safety, accessibility, your human resources, and how many samples you can analyze.
Step 5: Field check each site for accessibility, representativeness, safety, and appropriateness. Use the Site Evaluation Sheet (included) to record information during this field check.
Step 6: Record directions to the site, a brief description of the site, and other relevant information on the Site Evaluation Sheet.
Step 7: Get landowner permission to use sites on private property. Drop the sites for which you can’t get permission.
Step 8: Finalize your list of sampling sites. Categorize each site as to its type (from the list in the “Types of Monitoring Sites”) and why you selected it.
Step 9: Photograph each site at the sample collection point.
Step 10: Place the site description and the photograph in a looseleaf binder for permanent archiving.
Step 11: Locate each final site on your topographic map.
Step 12: Identify the laboratory where the analysis of samples will be performed.
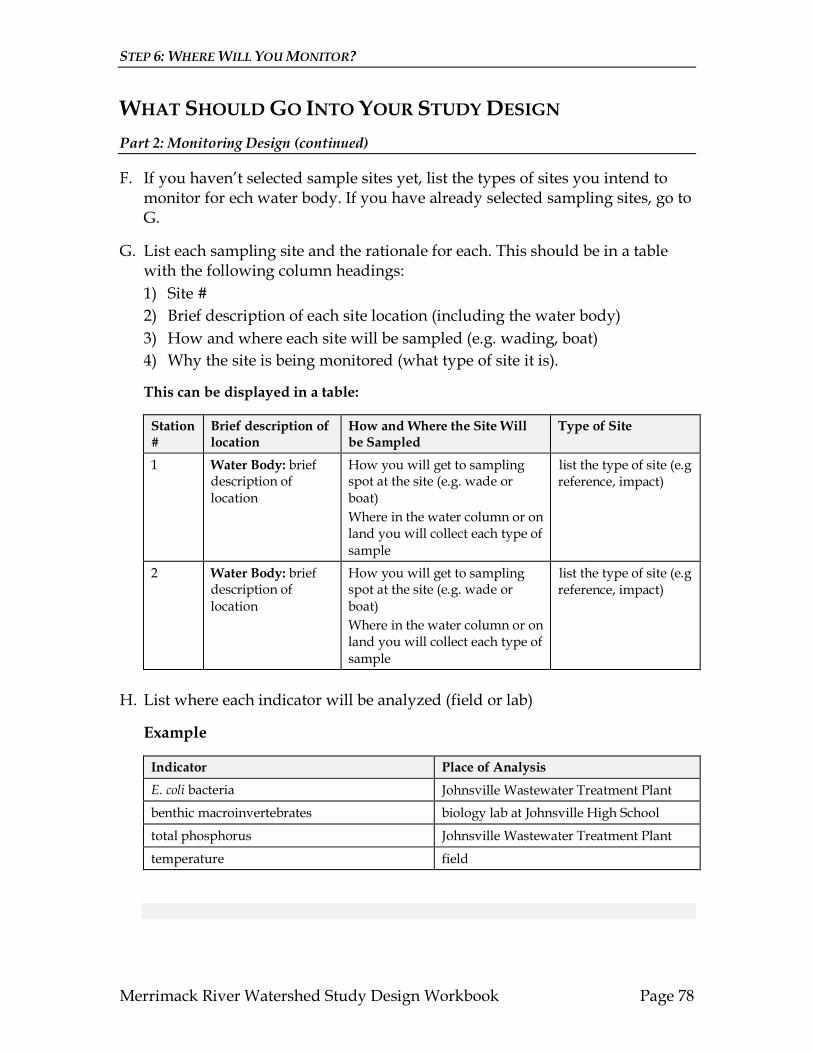
STEP 6: WHERE WILL YOU MONITOR?
Merrimack River Watershed Study Design Workbook Page 78
WHAT SHOULD GO INTO YOUR STUDY DESIGN
Part 2: Monitoring Design (continued)
F. If you haven’t selected sample sites yet, list the types of sites you intend to monitor for ech water body. If you have already selected sampling sites, go to G.
G. List each sampling site and the rationale for each. This should be in a table with the following column headings: 1) Site # 2) Brief description of each site location (including the water body) 3) How and where each site will be sampled (e.g. wading, boat) 4) Why the site is being monitored (what type of site it is).
This can be displayed in a table:
Station #
Brief description of location
How and Where the Site Will be Sampled
Type of Site
1 Water Body: brief description of location
How you will get to sampling spot at the site (e.g. wade or boat) Where in the water column or on land you will collect each type of sample
list the type of site (e.g reference, impact)
2 Water Body: brief description of location
How you will get to sampling spot at the site (e.g. wade or boat) Where in the water column or on land you will collect each type of sample
list the type of site (e.g reference, impact)
H. List where each indicator will be analyzed (field or lab)
Example
Indicator Place of Analysis
E. coli bacteria Johnsville Wastewater Treatment Plant
benthic macroinvertebrates biology lab at Johnsville High School
total phosphorus Johnsville Wastewater Treatment Plant
temperature field
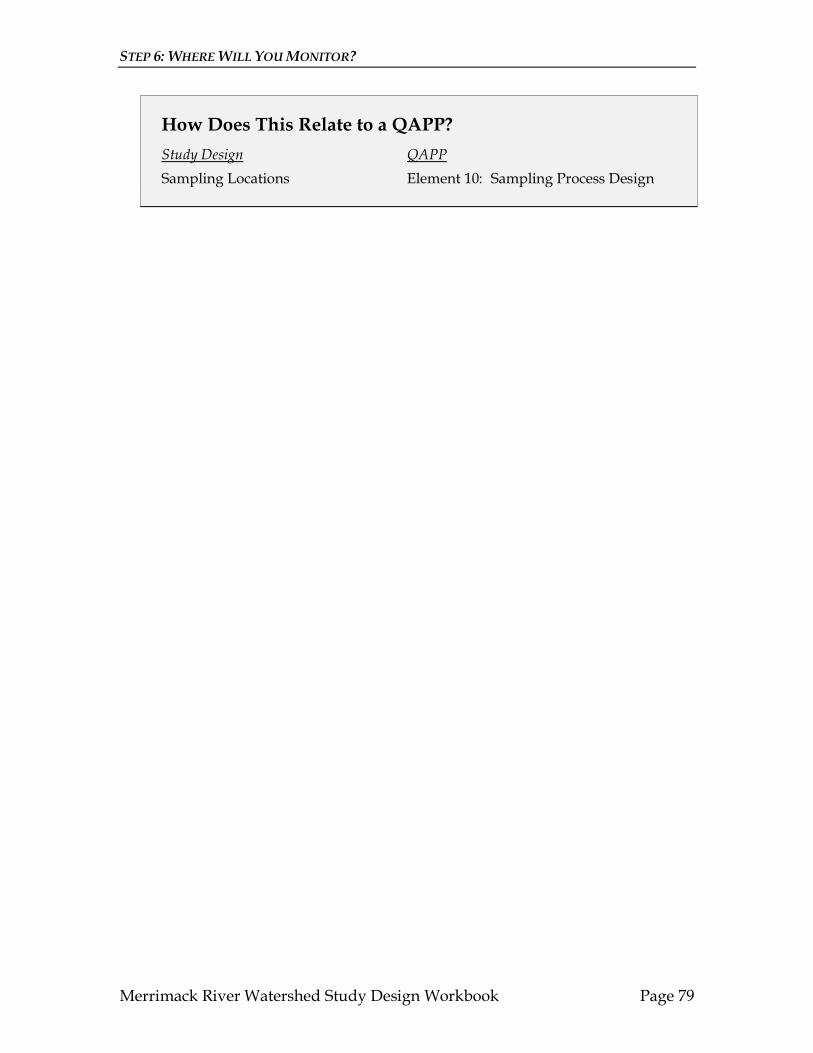
STEP 6: WHERE WILL YOU MONITOR?
Merrimack River Watershed Study Design Workbook Page 79
How Does This Relate to a QAPP? Study Design QAPP Sampling Locations Element 10: Sampling Process Design
Merrimack River Watershed Study Design Workbook Page 80
STEP 7: WHEN WILL YOU MONITOR?
In This Chapter: • Scheduling Your Monitoring: Background Information • Steps to Scheduling Your Monitoring • What Should Go Into Your Study Design • How Does This Relate To a QAPP?
Deciding when to monitor can be as simple as picking one date to do a shoreline survey, or as complicated as trying to get water samples before, during, and after major weather events. The VEMN Guide to Volunteer Watershed Monitoring Options suggests the frequency for each type of survey.
In this chapter, we’ll review the basics of scheduling your monitoring.
SCHEDULING YOUR MONITORING: BACKGROUND INFORMATION
In deciding when to monitor, you should think in several time scales: the time of year you wish to monitor, how many times you will sample during the year (frequency), the time of day you will collect samples, and the weather conditions you want to capture.
Times of Year
Human use and aquatic ecosystems change with the seasons. Water flows, temperatures, chemistry, food sources, and the level of biological activity all vary with seasonal cycles. So, in the ideal study, you would sample during all seasons to determine how your ecosystem varies. However, this is not practical, nor necessary, for most volunteer programs. Consider sampling during critical periods when the ecosystem is under the most stress (such as summer hot dry periods) to capture worstcase conditions. Consider sampling during periods when they are under least stress as a benchmark. Consult with your technical committee to determine critical and benchmark sampling periods for your program. For monitoring that is based on the use of the water body, you need only monitor during the time of year when the use is occurring (for example during the summer for swimming), though you may want to sample immediately before and after the season in order to establish a benchmark..

STEP 7: WHEN WILL YOU MONITOR?
Merrimack River Watershed Study Design Workbook Page 81
Times of Day
Certain indicators, like dissolved oxygen and pH vary according to the time of day. In order to understand this daily variability, you may have to sample these indicators at different times of the day, perhaps even hourly over several 24hour periods. For others, like benthic macroinvertebrates, the time of day is not important.
Frequency
How many times should you sample? As with everything else, it depends on the question(s) you’ve asked as well as the indicator. If you’re trying to establish baseline conditions or monitor impacts, you should collect water samples as often as practical, in as many different conditions, for as many years as possible. For other types of surveys, once per year is enough. For example, you may only need to collect benthic macroinvertebrate samples once per season, or possibly only once per year, since these critters integrate impacts over relatively long periods of time (months). There are statistical methods to help you determine how many samples from a given area you should collect to be able to quantify the relationships among the different indicators you are monitoring. But these are beyond the scope of this guide. For practical purposes, your financial and human resources will probably dictate your sampling frequency as much as anything else.
Weather Conditions
Weather affects aquatic ecosystems in profound ways – some reduce stress and some cause stress. Since weather varies with the season, see the “Time of Year” section above for the general considerations. Within seasons, however, consider sampling a variety of weather conditions: storm events, droughts, “normal” conditions, relatively hot weather, relatively cool weather, etc. Since weather can occur without much warning, sampling to capture different weather events is challenging. However, you can learn a lot about how your river or lake responds to these changes.
If you are monitoring storm events, you might want to sample before, during, and after the event. The idea is to see how the river or lake responds hydrologically and how levels of indicators in the water column change. This might mean getting a set of samples as follows: • before the event begins to establish background conditions • as water levels rise (and polluted surface runoff enters the river or lake), • as water levels fall after the storm • when water levels return to prestorm conditions.
Of course, this requires that you have an accurate prediction of when the storm will begin and end. You would then analyze your results to see if the storm event seemed to cause the levels of the indicators to change.
Scheduling depends on the type of survey you’re doing and your specific monitoring question(s). Specific recommendations for each of the VEMN surveys
STEP 7: WHEN WILL YOU MONITOR?
Merrimack River Watershed Study Design Workbook Page 82
is contained in the VEMN Guide To Volunteer Watershed Monitoring Options. Work with your technical committee to help you devise a sampling schedule that will answer your monitoring questions and match your capabilities.
STEP 7: WHEN WILL YOU MONITOR?
Merrimack River Watershed Study Design Workbook Page 83
STEPS TO SCHEDULING YOUR MONITORING
Step 1: Consult with the “VEMN Guide To Volunteer Watershed Monitoring Options,” your technical committee and/or VEMN staff to help you determine the optimal time of year, frequency, time of day, and weather conditions for each type of sampling.
Step 2: Determine how frequently and what time of year and day you can sample considering your human and financial resources. You’ll need to be sensitive to the schedules and interest level of your samplers, as well as considering the scientific requirements.
Step 3: Pick sampling dates and sampling times for each survey and indicator. If you wish to capture weather conditions, determine when and how frequently during weather events you will sample.
WHAT SHOULD GO INTO YOUR STUDY DESIGN
Part 2: Monitoring Design (continued)
I. List the sampling and analysis dates for each indicator (this will capture time of year and frequency).
J. List the time of day samples for each indicator will be taken.
K. List the specific weather conditions (if any) you will try to capture with your monitoring.
How Does This Relate to a QAPP? Study Design QAPP Sampling Schedule and Frequency Element 10: Sampling Process Design
Merrimack River Watershed Study Design Workbook Page 84
STEP 8: WHAT ARE YOUR QUALITY ASSURANCE
MEASURES?
In This Chapter: • The Basics of Quality Assurance: Background Information • Steps to Scheduling Your Monitoring • A Closer Look At Quality Control and Evaluation • A Closer Look At Quality Assurance for Data Management • Steps to Deciding Quality Assurance • What Should Go Into Your Study Design • How Does This Relate To a QAPP?
Quality assurance is a system you put into place to ensure that your data will meet standards of quality that you define. Essentially, it’s the way you try to ensure and determine if your data meet the data quality goals and objectives we described in study design step 4 (“What Are Your Data Quality Objectives?”).
Quality assurance can be as simple as accurately documenting your field procedures, properly labeling containers, etc. It can be as complex as having an independent quality control lab checking the accuracy and precision of your laboratory methods. The point is, it’s what you decide.
Should you receive funding from the USEPA, you will be required to document your quality assurance system in a Quality Assurance Project Plan (QAPP). This is primarily a technical document written according to guidance from the EPA, which reviews QAPPs from a wide variety of program types across the country. A guidance document for volunteer monitoring programs is available: the Volunteer Monitor’s Guide To Quality Assurance Project Plans. So, you can consider this chapter as a brief introduction to some of the concepts you’ll encounter if you need to prepare a QAPP.
We’ll review some of the basics of quality assurance, and describe a menu of various quality control measures for sampling and analysis that you can select for your needs, and describe basic quality assurance for data management.
STEP 8: WHAT ARE YOUR QUALITY ASSURANCE MEASURES?
Merrimack River Watershed Study Design Workbook Page 85
Specific quality control measures for each survey are recommended in the VEMN Guide to Volunteer Watershed Monitoring Options, which by now should be your constant companion.
STEP 8: WHAT ARE YOUR QUALITY ASSURANCE MEASURES?
Merrimack River Watershed Study Design Workbook Page 86
THE BASICS OF QUALITY ASSURANCE: BACKGROUND INFORMATION
Your quality control management system includes most aspects of your monitoring program:
• organization and planning • sampling and analysis facilities, equipment, and supplies • quality control • data management • documentation • evaluation and response actions • reporting
Each of these aspects, and which parts relate to quality assurance, are briefly described below.
Organization and Planning
This includes much of the basic organizational work described in more detail in the “Getting Organized” and “What Are the Tasks and Who Will Do Them” study design steps. It includes things like your training requirements, written job descriptions, how the paid and volunteer personnel are organized, and the basics of managing your volunteers. For quality assurance, the main relevance is the documentation of these elements, which you will do in your study design. Training requirements for each type of survey can be found in chapter III of the VEMN Guide to Volunteer Watershed Monitoring Options.
Sampling and Analysis Facilities, Equipment, and Supplies
The actual sampling and analysis of your water body will include your needs for laboratory and storage facilities, how you will care for, calibrate (prepare for measurement), and maintain your monitoring equipment, and how you will manage your monitoring supplies. For quality assurance, the main relevance is the documentation of these activities.
Quality Control
These are the specific measures you will take during the collection and analysis of your samples to ensure the accuracy (how close to the real result you are) and precision (how reproducible your results are) of your monitoring. The purpose of quality control procedures is to let you know right away if you have a problem, so that you can correct it. Quality control procedures include both internal samples analyzed by the project field volunteers, staff, and lab and external samples analyzed by nonvolunteer field staff and a lab (also known as a “quality control lab”). Common internal and external quality control measures are described below in the “A Closer Look At Quality Control” section.
STEP 8: WHAT ARE YOUR QUALITY ASSURANCE MEASURES?
Merrimack River Watershed Study Design Workbook Page 87
Data Management
Quality assurance for data management includes the measures you take to ensure that the data are properly recorded on field and lab sheets and accurately transferred to a computer or summary sheet (data entry and validation) for analysis. Procedures for data management are described in more detail in study desigin step 9 (“How Will You Manage, Analyze, and report the Data?”).
Documentation
Putting everything in writing is a very important quality assurance measure. It helps you keep track of your procedures, it provides a written reference for your volunteers, and it provides a resource for people outside your program to discover what’s behind your results. Here are some things that you should put into writing:
• manuals • equipment and supplies records • sampling locations • field and lab sheets • your study design • a QAPP (if required)
Documentation can also include a set of procedures known as chain of custody. Chain of custody refers to identifying and documenting each person that handled the sample. Unless your data is going to be used in some legal or regulatory proceeding, you don’t have to worry about rigorous chain of custody. For most programs, it can be as simple as having places on your field and data sheets for samplers and analysts to sign when they take custody of and complete their work on a sample.
Evaluation and Response Actions
Evaluation (sometimes known as quality assessment) is your assessment of how accurate and precise your data actually are after you’ve collected and analyzed the samples. This involves calculating the accuracy and precision of your quality control samples and comparing them to your data quality objectives (See study design Step 4, “What Are You Data Quality Goals and Objectives” for definitions of these terms). Were the data accurate and precise? Was your data set complete enough to allow reliable analysis? Evaluation of quality control samples is described in the section below (“A Closer Look At Quality Control and Evaluation”).
If you find errors, or don’t meet your objectives, you also need to describe what measures you will take to improve data quality. Examples might include steps to identify the source of the problems or error and take corrective actions:
• validate the data • volunteer performance evaluations • audit field and lab procedures • don’t use some (or all) of your data
STEP 8: WHAT ARE YOUR QUALITY ASSURANCE MEASURES?
Merrimack River Watershed Study Design Workbook Page 88
• change laboratory methods, equipment, or field procedures • require more training • change your field or lab sheets, etc.
Finally, if all else fails, you can change your data quality objectives. Remember, you set them, you can change them. You should consult with your technical committee and data users to be sure this is acceptable.
Reporting
Based on your evaluation, you decide which data you will report. If you didn’t meet your data quality objectives, you may decide not to report certain data or you may decide to report it but note your lack of confidence in its accuracy, precision, or completeness.
You also decide what will go into your reports, how frequently you will produce them, and who gets them.
A CLOSER LOOK AT QUALITY CONTROL AND EVALUATION
QUALITY CONTROL is the part of your quality assurance system that relates to your sampling and analysis procedures. It consists of the specific internal and external measures you take to measure accuracy and precision. General categories of quality control samples are:
Duplicates: two or more samples from the same site, or subsamples from the same sample, are collected and/or analyzed in the field or lab.
Splits: a sample is split into two subsamples at the lab. One subsample is analyzed at the project lab and the other is analyzed at an outside lab and the results compared.
Knowns and Unknowns: outside labprepared samples with predetermined concentrations either known or unknown to the project lab.
Spike Samples: adding a known amount and concentration of the indicator being measured to part of a sample should increase the concentration by a predictable amount.
EVALUATION is that part of your system that involves calculating the accuracy and precision of your quality control samples and comparing them to your data quality objectives. Common statistical tools used to calculate accuracy and precision include:
Standard deviation: used to compare how closely three or more values are clustered around the average value. It is expressed as a ± from the average value. When used with duplicate samples, standard deviation measures precision the lower the value, the more precise the results.
Coefficient of Variation: the standard deviation as a percentage of the average. When used with duplicate samples, the Coefficient of Variation
STEP 8: WHAT ARE YOUR QUALITY ASSURANCE MEASURES?
Merrimack River Watershed Study Design Workbook Page 89
measures precision the lower the percentage, the more precise the results.
Relative Percent Difference: used to compare how close the result from a water sample is to the true result. It is expressed as either a positive difference (the sample result is higher than the true value) or negative difference (the sample result is higher than the true value). When used with duplicate samples, the Relative Percent Difference measures precision the lower the value, the more precise the results. It can also measure accuracy, when one of your results is the true value, such as the quality control lab results for a split sample, or the actual concentration of a known or unknown sample.
% Recovery: the percentage of the substance added to a spiked sample that is detected. It is the difference between the concentration detected in the spiked sample and that detected in the unspiked sample, divided by the concentration of the substance added to the spiked sample. Percent Recovery measures accuracy the higher the percent recovery, the greater the accuracy.
In the following sections, we’ll briefly review some common internal and external quality control measures and how the results are evaluated. For a fuller explanation of quality control and evaluation and for recommendations about which measures are appropriate for the survey(s) you’ve selected, consult the VEMN Guide to Volunteer Watershed Monitoring Options.
Common Internal Quality Control Samples and How They Are Evaluated
These are types of samples that are collected and analyzed by project field volunteers, staff, and lab. Note that some are specific to particular indicators.
Trip (Field) Blanks: A trip blank (also known as a field blank) is deionized water which is poured into a sample container in the field as if it were a river or lake sample. Evaluation of Results: The results should be “0.”
Negative and Positive Plates (for bacteria): Negative plates result when the buffered rinse water (the sterile water used to rinse down the sides of the filter funnel during filtration) has been filtered the same way as a sample.. Positive plates result when water known to contain bacteria (such as wastewater treatment plant influent) is filtered the same way as a sample. Evaluation of Results: The results for negative plates should be “0.” The results for positive plates should be “too numerous to count.”
Field Duplicates: A field duplicate is a duplicate river or lake sample collected by another sampler or team. This is used to evaluate precision. Evaluation of Results: The results for two samples should be compared using the relative percent difference between them. The results for three or more samples
STEP 8: WHAT ARE YOUR QUALITY ASSURANCE MEASURES?
Merrimack River Watershed Study Design Workbook Page 90
should be compared using the standard deviation among them. In either case, results are compared with your data quality objectives.
Lab Duplicates: A lab duplicate is a sample that is split into two or more subsamples at the lab. Each subsample is then analyzed and the results compared. This is used to evaluate precision. Evaluation of Results: The results for two samples should be compared using the relative percent difference between them. The results for three or more samples should be compared using the standard deviation among them. In either case, results are compared with your data quality objectives.
Calibration Blank: A calibration blank is deionized water processed like any of the samples and used to “zero” the instrument. Evaluation of Results: The results of periodic checks should be “0.”

STEP 8: WHAT ARE YOUR QUALITY ASSURANCE MEASURES?
Merrimack River Watershed Study Design Workbook Page 91
Calibration Standards: Calibration standards are used to calibrate a meter. They consist of one or more “standard concentrations” (made up in the lab to specified concentrations) of the indicator being measured, one of which is the calibration blank). Evaluation of Results: The meter should read the expected concentration.
Spike Samples: A sample is split into two subsamples in the lab. One is analyzed according to the specified procedure. The other is treated by adding a known amount and concentration of the indicator being measured, then running the specified procedure. This should increase the concentration in the spiked sample relative to the unspiked sample by a predictable amount. This is used to evaluate accuracy. Evaluation of Results: The percent of the indicator “recovered” by comparing the spiked to the unspiked sample is determined. Results are compared with your data quality objectives.
Common External Quality Control Samples and How They Are Evaluated
These are types of samples collected and analyzed by nonvolunteer field staff and a lab (also known as a “quality control lab”). The results are compared with those obtained by your project lab. Note that some are specific to particular indicators.
External Field Duplicates: An external field duplicate is a duplicate river or lake sample collected and processed by an independent (e.g. professional) sampler or team. It is used to estimate total (sampling and laboratory) analysis accuracy. Evaluation of Results: The results for two samples should be compared using the relative percent difference between them. Results are compared with your data quality objectives.
Split Samples: A split sample is a sample that is split into two subsamples at the lab. One subsample is analyzed at the project lab and the other is analyzed at the independent lab and the results compared. It is used to estimate laboratory analysis accuracy. Evaluation of Results: The results for the two samples should be compared using the relative percent difference between them. Results are compared with your data quality objectives.
Taxonomic Verification (for Benthic Macroinvertebrates): Benthic macroinvertebrate samples identified by volunteers should be preserved and archived for verification by an experienced taxonomist. Evaluation of Results: The identifications are compared.
Knowns: The quality control lab sends samples for selected indicators, labeled with the concentrations, to the project lab for analysis. Knowns are used to evaluate accuracy.
STEP 8: WHAT ARE YOUR QUALITY ASSURANCE MEASURES?
Merrimack River Watershed Study Design Workbook Page 92
Evaluation of Results: The results for the two samples should be compared using the relative percent difference between them. Results are compared with your data quality objectives.
Unknowns: The quality control lab sends samples to the project lab for analysis for selected indicators. The concentrations of these samples are unknown to the project lab until after it analyzes them. Unknowns are used to evaluate accuracy Evaluation of Results: The results for the two samples should be compared using the relative percent difference between them. Results are compared with your data quality objectives.

STEP 8: WHAT ARE YOUR QUALITY ASSURANCE MEASURES?
Merrimack River Watershed Study Design Workbook Page 93
Recommended Quality Controls To Meet VEMN Data Quality Goals
In this section, we recommend various quality control measures to meet data quality goals for specified indicators. The usual rule of thumb is that 10% of your samples should be subject to some sort of quality control measures.
Table 1 lists the controls recommended to meet the state and federal agency water quality assessment data quality goal. Table 2 lists the controls recommended to meet two goals:
• education and awareness and the • community and watershed assessment data quality goals.
These tables are a starting point only. You will need to work with your technical committee to select the appropriate measures.
RECOMMENDED QUALITY CONTROL MEASURES FOR STATE AND FEDERAL WATER QUALITY ASSESSMENT
Table 1:
FC/EC DO Turb Secchi T pH Alk Internal Checks
Field Blanks √ √ Field Duplicates √ √ √ √ √ √ √
Lab Replicates √♣ √ √ √ √
Positive Plates √ Negative Plates √
Spike Samples (Std. Add.) √ Calibration Blank √ √
Calibration to Reference Device √ Calibration Standard √* √ √ External Checks
External Field Duplicates √ √ √ √ √
Split Samples √ √ √ √ Outside Lab Analysis• √
Verification
Knowns √ √ √ √
Unknowns √ √ √ √
FC/EC=Fecal coliform/E. coli * using an oxygensaturated sample
T = temperature
♣ using subsamples of different sizes
STEP 8: WHAT ARE YOUR QUALITY ASSURANCE MEASURES?
Merrimack River Watershed Study Design Workbook Page 94
• analysis expensive or difficult consider analysis by a certified lab instead of the project lab
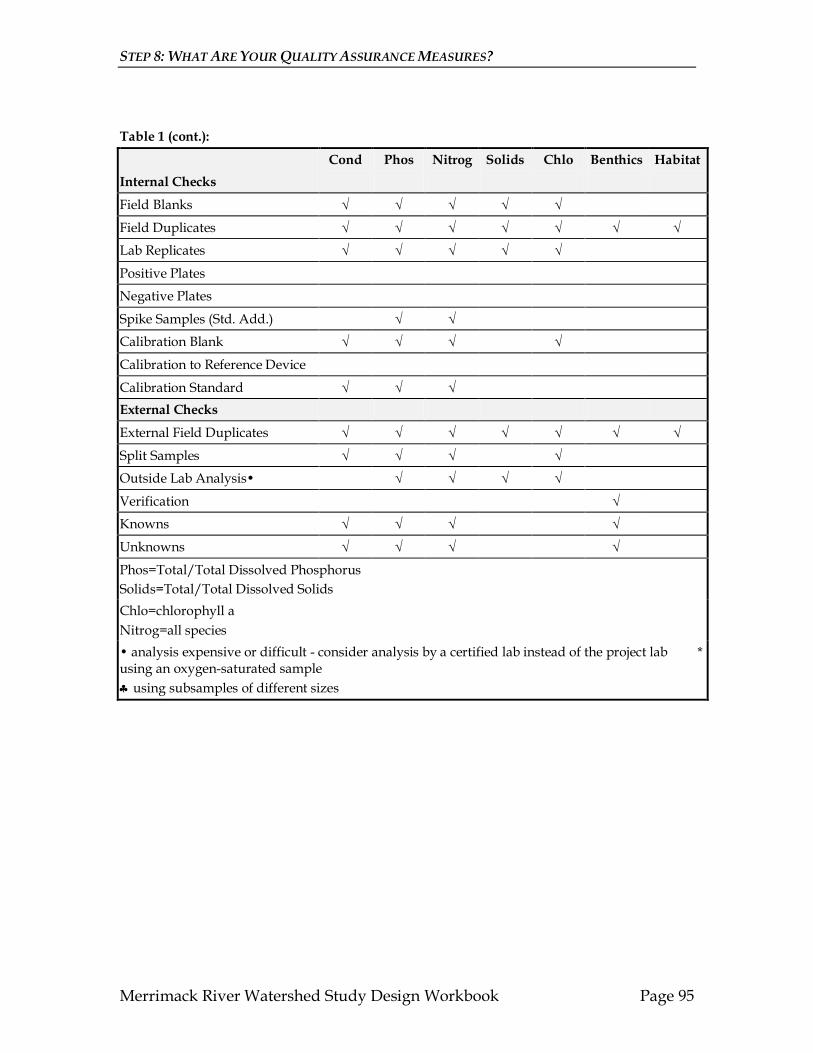
STEP 8: WHAT ARE YOUR QUALITY ASSURANCE MEASURES?
Merrimack River Watershed Study Design Workbook Page 95
Table 1 (cont.):
Cond Phos Nitrog Solids Chlo Benthics Habitat Internal Checks
Field Blanks √ √ √ √ √
Field Duplicates √ √ √ √ √ √ √ Lab Replicates √ √ √ √ √
Positive Plates
Negative Plates
Spike Samples (Std. Add.) √ √ Calibration Blank √ √ √ √
Calibration to Reference Device
Calibration Standard √ √ √ External Checks
External Field Duplicates √ √ √ √ √ √ √
Split Samples √ √ √ √ Outside Lab Analysis• √ √ √ √
Verification √ Knowns √ √ √ √
Unknowns √ √ √ √
Phos=Total/Total Dissolved Phosphorus Solids=Total/Total Dissolved Solids Chlo=chlorophyll a Nitrog=all species • analysis expensive or difficult consider analysis by a certified lab instead of the project lab * using an oxygensaturated sample ♣ using subsamples of different sizes
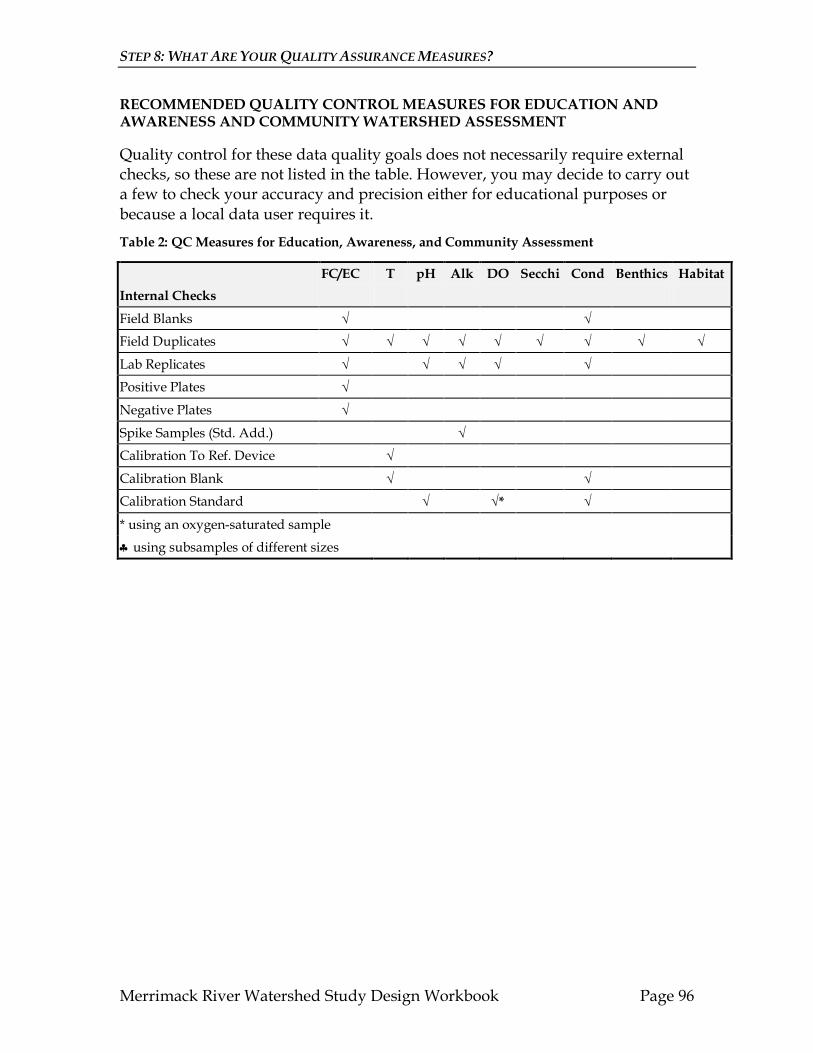
STEP 8: WHAT ARE YOUR QUALITY ASSURANCE MEASURES?
Merrimack River Watershed Study Design Workbook Page 96
RECOMMENDED QUALITY CONTROL MEASURES FOR EDUCATION AND AWARENESS AND COMMUNITY WATERSHED ASSESSMENT
Quality control for these data quality goals does not necessarily require external checks, so these are not listed in the table. However, you may decide to carry out a few to check your accuracy and precision either for educational purposes or because a local data user requires it.
Table 2: QC Measures for Education, Awareness, and Community Assessment
FC/EC T pH Alk DO Secchi Cond Benthics Habitat Internal Checks
Field Blanks √ √ Field Duplicates √ √ √ √ √ √ √ √ √
Lab Replicates √ √ √ √ √ Positive Plates √
Negative Plates √
Spike Samples (Std. Add.) √ Calibration To Ref. Device √
Calibration Blank √ √ Calibration Standard √ √* √
* using an oxygensaturated sample
♣ using subsamples of different sizes
STEP 8: WHAT ARE YOUR QUALITY ASSURANCE MEASURES?
Merrimack River Watershed Study Design Workbook Page 97
A CLOSER LOOK AT QUALITY ASSURANCE FOR DATA MANAGEMENT
This includes measures to assure that sample containers (if used) are labeled and that the data are properly recorded on field and lab sheets and accurately transferred to a computer or summary sheet. Data management proceures are described in more detail in study design Step 9 (“How Will You Manage, Analyze, and report the Data?”).
Sample Containers: Sample containers should be clearly labeled with some of the same information that goes on you field and lab sheets: • Site # • Unique container ID # (if used) • Date and time sample was collected • Sampler name(s)
Field and Lab Sheets: These should be laid out clearly with the information suggested on pages 83 and 84 of this workbook (Step 9: “How Will You Manage, Analyze, and report the Data?”)
Data Entry and Validation: If a computer is used, data should be entered by one person, if possible. The data entered into the computer must be checked against the raw data from the field and lab sheets to assure that it has been entered correctly. Ideally, this should be done by someone other that the person who entered the data. Other validation steps can include: • looking for data gaps • analyzing chain of custody information • checking calculations (have the right formulas been entered in the computer
spreadsheet or database?) • looking for conflicting, outlying, or nonsensical data
STEP 8: WHAT ARE YOUR QUALITY ASSURANCE MEASURES?
Merrimack River Watershed Study Design Workbook Page 98
STEPS TO DECIDING QUALITY ASSURANCE
Step 1: Consult with your technical committee and/or VEMN staff to help you determine the general quality assurance measures you will use.
Step 2: Consult the “VEMN Guide to Volunteer Watershed Monitoring Options” for recommendations on internal and external quality control measures for the survey(s) you selected in study design Step 5 (“How Will You Monitor?”). General quality assurance/quality control requirements are listed with each survey in Chapter III of the Guide. Tables 1 and 2 in the above section (“Recommended Quality Controls To Meet VEMN Data Quality Goals”) list specific quality control measures for each indicator for two different data quality goals.
Step 3: Determine which quality control measures you have the resources and capabilities to carry out and select these for your program. Your human and financial resources and expertise may limit your ability to do quality control measures. Your resources may also limit the water quality indicators for which you can do adequate quality control. How many (or what percentage) of your samples will be analyzed using quality control measures? (the usual rule of thumb is 10%)
Step 4: If you will be carrying out external quality control measures, locate a quality control lab – an independent lab that can run external quality control measures for you. Private labs, state environmental labs, federal labs, and wastewater treatment plant labs are some common examples of quality control labs.
Step 5: Decide which statistical tools you will use to evaluate your quality control results. See the list of tools near the beginning of the section, “A Closer Look At Quality Control and Evaluation.”
Step 6: Decide which investigative and corrective actions you will take if you discover problems or if you don’t meet your data quality objectives.
If your monitoring program uses federal funds, you will be required to prepare a separate Quality Assurance Project Plan (QAPP). 10 Otherwise, you can simply document your quality assurance measures in your study design.
10 An excellent guide for preparing quality assurance project plans is available from EPA: The Volunteer Monitor’s Guide to Quality Assurance Project Plans.
STEP 8: WHAT ARE YOUR QUALITY ASSURANCE MEASURES?
Merrimack River Watershed Study Design Workbook Page 99
WHAT SHOULD GO INTO YOUR STUDY DESIGN
Note that your study design may not include all of this information. For example, a Preliminary Watershed Assessment will not require much of this information. This is meant as a check list of what to include if it is available:
Part 3: Quality Assurance/Quality Control
A. List the internal and external quality control measures you will use 1) Internal Measures 2) External Measures 3) What percent of your samples will be each type of quality control sample?
B. Briefly describe how you will evaluate your quality control results 1) How will you compare your quality control results with your data quality
objectives? Which statistical tools will you use?
C. Describe the actions will you take if you don’t meet your data quality objectives or if you find errors or problems in your monitoring: 1) Investigations you will carry out to identify the source of problems 2) Actions you will take to correct problems
How Does This Relate to a QAPP? Study Design QAPP Part 4: A. General Quality Assurance Elements 8, 9, 15, 19, 21
B. Quality Control Measures Element 14 C. Evaluation Element 20 D. Response Element 19

Merrimack River Watershed Study Design Workbook Page 100
STEP 9: HOW WILL YOU MANAGE, ANALYZE, AND
REPORT THE DATA?
In This Chapter: • The Data To Information Process: Background Information • Data Analysis: Background Information • Steps to Determining Data Management and Analysis
Techniques • What Should Go Into Your Study Design • How Does This Relate To a QAPP?
The data your program collects starts with the results your monitors record in the field and lab and ends up as some sort of story that you tell after figuring out what it all means. In a nutshell, you convert raw data into useful information that sheds light on the answers to your monitoring questions.
It may seem odd to be thinking about how to handle your results when you haven’t even begun your monitoring. But, thinking through how you are going to deal with your data may cause you to reevaluate some of your earlier decisions, for example, who should be on your technical committee or who your data users are. Clearly though, some of the decisions you make about how you are going to deal with your data will likely need to be revisited after you’ve got your first season’s worth.
In this chapter, we’ll review the data to information process and describe the decisions you need to make in your study design.
Data analysis approaches for each type of watershed monitoring survey are recommended in Chapter III of the VEMN Guide to Volunteer Watershed Monitoring Options.
THE DATA TO INFORMATION PROCESS: BACKGROUND INFORMATION
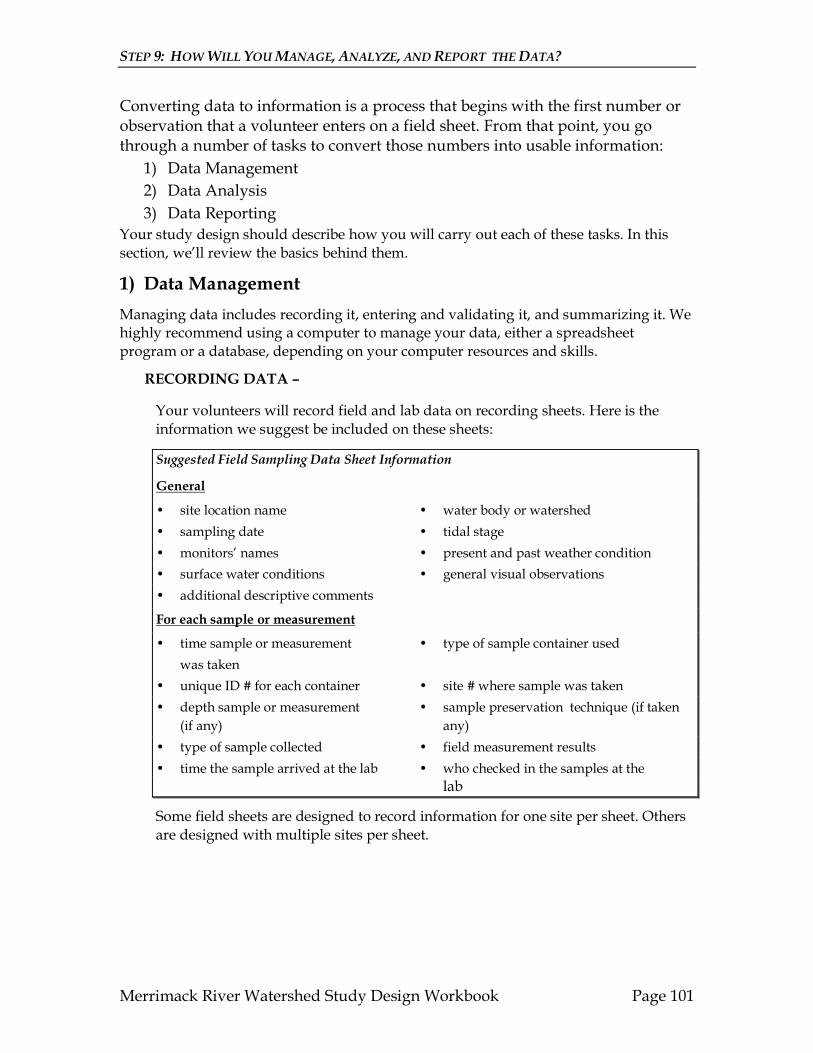
STEP 9: HOW WILL YOU MANAGE, ANALYZE, AND REPORT THE DATA?
Merrimack River Watershed Study Design Workbook Page 101
Converting data to information is a process that begins with the first number or observation that a volunteer enters on a field sheet. From that point, you go through a number of tasks to convert those numbers into usable information:
1) Data Management 2) Data Analysis 3) Data Reporting
Your study design should describe how you will carry out each of these tasks. In this section, we’ll review the basics behind them.
1) Data Management Managing data includes recording it, entering and validating it, and summarizing it. We highly recommend using a computer to manage your data, either a spreadsheet program or a database, depending on your computer resources and skills.
RECORDING DATA –
Your volunteers will record field and lab data on recording sheets. Here is the information we suggest be included on these sheets:
Suggested Field Sampling Data Sheet Information
General
• site location name • water body or watershed • sampling date • tidal stage • monitors’ names • present and past weather condition • surface water conditions • general visual observations • additional descriptive comments
For each sample or measurement
• time sample or measurement • type of sample container used was taken
• unique ID # for each container • site # where sample was taken • depth sample or measurement • sample preservation technique (if taken
(if any) any) • type of sample collected • field measurement results • time the sample arrived at the lab • who checked in the samples at the
lab
Some field sheets are designed to record information for one site per sheet. Others are designed with multiple sites per sheet.
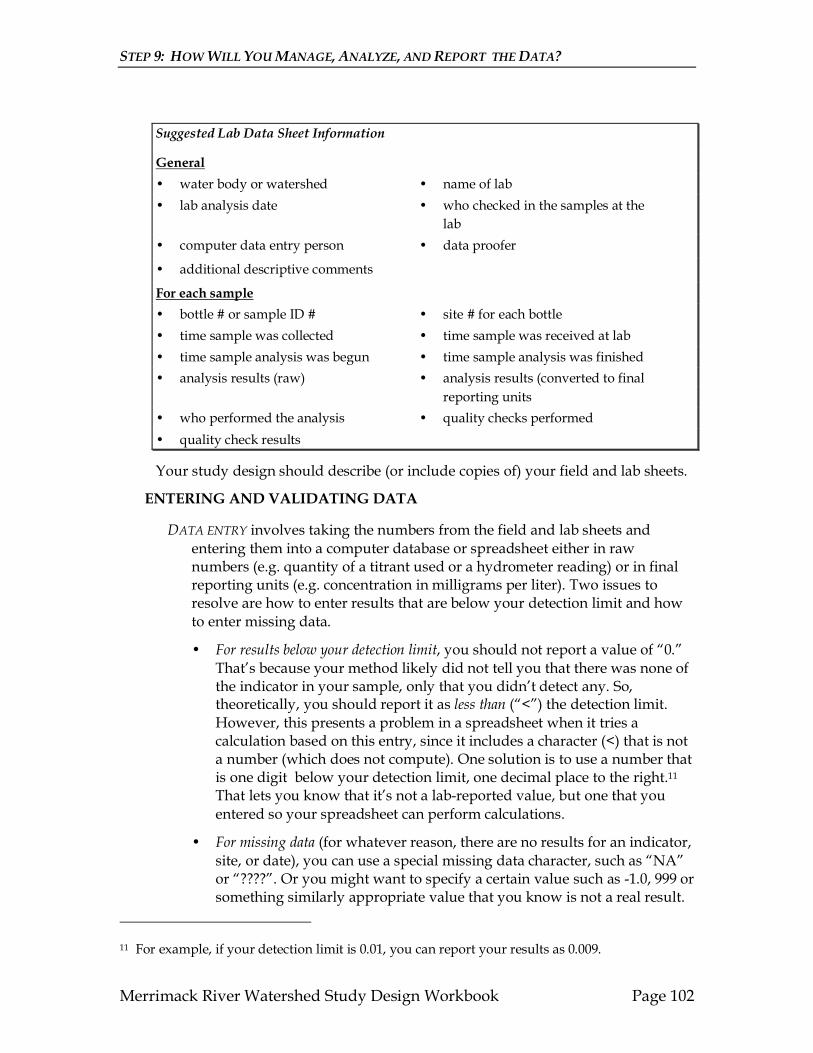
STEP 9: HOW WILL YOU MANAGE, ANALYZE, AND REPORT THE DATA?
Merrimack River Watershed Study Design Workbook Page 102
Suggested Lab Data Sheet Information
General • water body or watershed • name of lab • lab analysis date • who checked in the samples at the
lab • computer data entry person • data proofer
• additional descriptive comments
For each sample • bottle # or sample ID # • site # for each bottle • time sample was collected • time sample was received at lab • time sample analysis was begun • time sample analysis was finished • analysis results (raw) • analysis results (converted to final
reporting units • who performed the analysis • quality checks performed • quality check results
Your study design should describe (or include copies of) your field and lab sheets.
ENTERING AND VALIDATING DATA
DATA ENTRY involves taking the numbers from the field and lab sheets and entering them into a computer database or spreadsheet either in raw numbers (e.g. quantity of a titrant used or a hydrometer reading) or in final reporting units (e.g. concentration in milligrams per liter). Two issues to resolve are how to enter results that are below your detection limit and how to enter missing data.
• For results below your detection limit, you should not report a value of “0.” That’s because your method likely did not tell you that there was none of the indicator in your sample, only that you didn’t detect any. So, theoretically, you should report it as less than (“<”) the detection limit. However, this presents a problem in a spreadsheet when it tries a calculation based on this entry, since it includes a character (<) that is not a number (which does not compute). One solution is to use a number that is one digit below your detection limit, one decimal place to the right. 11
That lets you know that it’s not a labreported value, but one that you entered so your spreadsheet can perform calculations.
• For missing data (for whatever reason, there are no results for an indicator, site, or date), you can use a special missing data character, such as “NA” or “????”. Or you might want to specify a certain value such as 1.0, 999 or something similarly appropriate value that you know is not a real result.
11 For example, if your detection limit is 0.01, you can report your results as 0.009.
STEP 9: HOW WILL YOU MANAGE, ANALYZE, AND REPORT THE DATA?
Merrimack River Watershed Study Design Workbook Page 103
However, be sure that your computer does not use these numbers in calculations.
Your study design should explain your data entry approach – how field and lab sheets will be handled, how data will be entered, and what computer application you will use.
DATA VALIDATION involves checking the data entered into the computer against the data on the field and lab sheets to assure that it has been entered correctly. Ideally, this should be done by someone other that the person who entered the data. Entries should be checked to assure correct entry and that the results are possible (e.g. a pH of 31 is not possible) or within an acceptable range. It is good practice to indicate on each data sheet that it has been validated.
Another good practice is to enter and keep your data set in a separate database or spreadsheet until it has been validated. This protects the rest of your data from subsequent changes you might make if you discover errors in your new data set.
SUMMARIZING DATA
In order to analyze your data, they need to be in a form that allows you to view the entire data set, or the relevant parts, in a way that patterns and trends are revealed. A table, if it's not too large, is a good place to start. However, for large data sets, you will need to reduce this mass of numbers to something more manageable. Statistical summaries can help.
Statistics are simply descriptions of a set of data. If you have a large data set or data from several years, presenting all of it will be cumbersome and your story will be buried amidst the numbers. Using some simple statistics, you can reduce the volume of data to relatively few numbers that summarize the data set. Commonly used statistics include averages (known as arithmetic means), geometric means, medians, ranges, and quartiles. Be aware, however, that these summaries become highly un representative of your data with just a few data points. A minimum of 5 data points is recommended to calculate any of the statistical summaries.
Your study design should describe which statistical summaries you will use to reduce your data set to manageable size.
2) Data Analysis You posed one or more monitoring questions in study design Step 2 (“Why Are You Monitoring”). The data analysis step is where you use your monitoring results to answer your question(s) and where you use your quality control data to evaluate whether you met your data quality goal and objectives. Evaluating your quality control data is
STEP 9: HOW WILL YOU MANAGE, ANALYZE, AND REPORT THE DATA?
Merrimack River Watershed Study Design Workbook Page 104
described in study design Step 8 (“What Are Your Quality Assurance Measures?”). Here, we’ll focus on your monitoring results.
Almost all of the questions we suggest for monitoring involve comparing your monitoring results with reference conditions. Reference conditions can be actual conditions at a designated reference site, or general theoretical statements about what the condition of the water body should be like in a region.
CONDITIONS AT REFERENCE SITES are used as benchmarks, against which conditions at the other sites are assessed. For baseline monitoring, these sites represent the least impaired conditions in a watershed. For river impact assessments, these sites are upstream controls, representing conditions before the impacts are integrated into the river. See study design Step 6 (“Where Will You Monitor?”) for a fuller description of the various types of reference sites. In either case, your task is to determine whether there is a difference in results between the rest of your monitoring sites and your reference sites. The trick is to separate differences in conditions due to human sources from natural variability and/or variability caused by errors in your sampling and analysis techniques. There are various statistical (quantitative) ways to do this, but most are complex and beyond the scope of this workbook (and beyond the scope of most volunteer monitoring programs that don’t have a statistician involved). An alternative is a nonquantitative approach that involves asking questions of your data to develop findings and conclusions. Consult with your technical committee to determine the best approach.
THEORETICAL REFERENCE CONDITIONS describe expected conditions based on historical data or commonly accepted requirements of human health or aquatic life, as opposed to actual conditions at a reference site. In this case, you are comparing your results for each indicator with the expected value for that indicator. You determine whether it is above or below that value (for some indicators, above is good, for others, below is good) or within an acceptable range.
The state water quality standards would be a common example or theoretical reference conditions. The water quality criteria within the standards describe the conditions which need to be achieved in order to support human and aquatic life uses designated for a particular water body. These conditions are described for various water quality indicators such as bacteria, temperature, dissolved oxygen, pH, etc:
Numerical Criteria specify a level or a range of levels for each indicator. Narrative Criteria are general statements about the conditions for each indicator needed to support the designated uses.
Obviously, it’s easier to compare your results with a numerical criterion (as to whether it’s above or below a value or within a range of values) than with a general statement. Water quality standards and criteria are described in detail in Appendix II of the VEMN Guide to Volunteer Watershed Monitoring Options including the actual criteria for NH and MA.
STEP 9: HOW WILL YOU MANAGE, ANALYZE, AND REPORT THE DATA?
Merrimack River Watershed Study Design Workbook Page 105
For some indicators, such as habitat, the water quality standards do not address them. In this case, you may need to consult with experts to establish reference conditions for your indicator and water body of interest.
Your study design should describe what you will use as reference conditions to analyze your data. It should also describe your data analysis process. We suggest the following data analysis process:
1) Review and interpret the data “inhouse” to develop preliminary findings, conclusions, and recommendations. Findings: Findings are observations about your data, based on your statistical and visual summaries and comparison of your data with reference conditions. Conclusions: Conclusions are your explanation of why the data look the way they do (e.g. why they don’t look like reference conditions) and how they relate to your study questions(s). Recommendations: Recommendations are based on your findings and conclusions. They can take two forms: actions that should be taken and further information that should be gathered
2) Review the data and your interpretation of it with your technical committee. They can verify, add to, or correct your interpretation of the results.
3) Review the data and your interpretation of it with the people who will use your data – for example, the public, waterbody users, and government officials.
3) Data Reporting Once you've analyzed your monitoring data, decide who you will report it to, how you will report it, and what formats you will use. By “reporting,” we mean presenting your results to your intended audiences.
Who Is It For? The audiences for your data are your intended users. Remember them? You identified them back in study design Step 2 (“Why Are You Monitoring?”). They can range from the general public to resource managers and regulators in federal and state agencies.
What Type of Report? There are many ways to report you results: through video, written reports, the internet, oral and slide presentations, and others. You should tailor your reports to your audience. If you try to present the same report to the general public in the same way that you presented it to resource managers and regulators, you’re not going to reach them very effectively. We recommend that you at least produce a written report that summarizes your work and the results for your most rigorous audience. This is the basic foundation for all your other presentations. When you’ve completed your most comprehensive written report, you can prepare different types of presentations for different audiences.
What Type of Format for Your Written Report? We suggest that your written report should summarize your monitoring activities and results, state your

STEP 9: HOW WILL YOU MANAGE, ANALYZE, AND REPORT THE DATA?
Merrimack River Watershed Study Design Workbook Page 106
findings and conclusions and make recommendations for actions to address problems or for changes to your sampling program, if needed. Some programs produce an annual “state of the watershed” report that summarizes and analyzes the results of the year, and all previous years, highlighting trends, cleanup progress, new trouble spots, etc.
Remember that the style, length, and content of your report should be geared to the audience you are addressing. We recommend the following generic report format that can be adapted to different audiences
I. Introduction: brief description of the area and your program (including map[s)
II. Project Description: briefly summarize your study design III. Results:
A. How Were the Data Analyzed? B. Findings C. Conclusions D. Recommendations
Acknowledgments: Who made your program possible?
References: What information sources did you use to prepare your report? Appendices: Include your summarized data and any other information that you wish to include, but would detract from your narrative report.
STEPS TO A DATA MANAGEMENT, ANALYSIS, AND REPORTING SYSTEM
Step 1: Determine the field and lab sheets you will use. Consult with your technical committee and/or VEMN staff to help you design sheets or locate existing sheets you can use or customize for your program.
Step 2: Decide the path that field and lab sheets will follow from your volunteers to project staff. If your samples will be analyzed in a lab, field sheets can be delivered to the lab with samples. If no field samples are involved, field can be mailed or handdelivered to the Program Coordinator or Data Management Coordinator.
Step 3: Identify the computer hardware and software you will need to manage your data. Generally either a computer database program or a spreadsheet program are used to enter, store, and retrieve data for analysis. Sometimes both are used. If your data management skills are limited, or if your anticipated data set is small, you should probably start with a spreadsheet.
Step 4: Decide who will enter and check the data. Lots of errors can occur when entering computer data. Identify the person(s) who will enter the data. A

STEP 9: HOW WILL YOU MANAGE, ANALYZE, AND REPORT THE DATA?
Merrimack River Watershed Study Design Workbook Page 107
different person should check the accuracy of the entered data by checking it against field and lab sheets.
Step 5: Decide how the data will be entered. 1) The Computer Data Entry Screen: Someone will need to decide on the
data entry screen. In a spreadsheet, the data are entered into a table. In a database, s separate data entry screen will need to be used (and possibly created).
2) How will results below detection limit or missing data be entered? The data entry person needs to be clear how to enter this data. Decide on a convention and be sure that anyone entering data uses it.
Step 6: Identify your data summary statistics. Consult with your technical committee to determine which ones are most appropriate. Note that these are preliminary – you may decide to use different summaries once you’ve looked at your actual data.
Step 7: Determine the reference conditions you will use to analyze your data. As described above, these can either be actual reference sites that you choose, or theoretical reference conditions such as the water quality standards.
Step 8: Decide the process you will use to analyze your data. We suggest the process described in the “Data Analysis” section above: developing findings, conclusions and recommendations inhouse, followed by a review your technical committee, and then review by your data users.
Step 9: Decide how you will report the data. 1) Identify your audience: review your data users. Who will receive a
report? 2) Identify the types of reports you will produce. We suggest a written
report at a minimum. Identify the type of report you will produce for each audience.
3) Decide on a format for your written report: We suggest the format described in the “Data Reporting” section above.
STEP 9: HOW WILL YOU MANAGE, ANALYZE, AND REPORT THE DATA?
Merrimack River Watershed Study Design Workbook Page 108
WHAT SHOULD GO INTO YOUR STUDY DESIGN
Part 4: Data Analysis
A. What information will be recorded on your field and lab sheets (include examples, if available) and sample containers? Remember to include your quality control samples.
B. How will field and lab sheets be handled? C. How will data be entered –
1) What computer application will be used? 2) Who will enter the data? 3) How will results below detection limit and missing values be
entered? 4) Who will check the data entry for accuracy?
D. How will data be summarized? Which statistical summaries will you use to reduce your data set?
E. How will your data be analyzed? 1) What reference conditions will you compare your data with? 2) What process will you use to come up with a story based on your
data? F. How will you report the data?
1) Who will you report it to? Who are your audiences? 2) What types of reports will your produce for each audience? 3) What report format will you use for your written report?
How Does This Relate to a QAPP? Study Design QAPP
Part 4: Data Management, Analysis, and Element 19: Data Management Reporting
Element 21: Reports
Element 22: Data review, Validation, and Verification Requirements
Merrimack River Watershed Study Design Workbook Page 109
STEP 10: WHAT ARE THE TASKS AND WHO WILL DO
THEM?
In This Chapter: • Project Tasks and Organization: Background Information • Steps to Identifying and Assigning Project Tasks • What Should Go Into Your Study Design • How Does This Relate To a QAPP?
At this point, you’ve decided what your monitoring program is going to look like. Your last study design step is to identify the major tasks to carry it out and who will do them.
This chapter briefly describes the major tasks and key program personnel that might be associated with a monitoring program. Not all will apply to yours. For example, you may be carrying out a Preliminary Watershed Assessment. For that, you don’t need a lab or equipment or quality control samples, so those tasks do not apply. Consider the tasks and personnel and listed below as a menu from which to select those which apply to your program.
PROJECT TASKS AND ORGANIZATION: BACKGROUND INFORMATION
In this section, we’ll briefly review the major monitoring tasks and suggest key personnel to carry them out.
Major Monitoring Tasks Organizing your monitoring activities involves a set of tasks that produces and builds on the technical decisions you’ve made in your study design
FIND A LAB
This task involves finding one or more laboratories to analyze samples, as described in study design Step 6 (“Where Will You Monitor?”). You may need to locate a project lab, which you will set up and use to analyze your samples. You may need an outside analytical lab to run samples for you and/or run quality control samples.
STEP 10: WHAT ARE THE TASKS AND WHO WILL DO THEM?
Merrimack River Watershed Study Design Workbook Page 110
PURCHASE EQUIPMENT
If you analyze your own samples, you will need to identify and borrow or purchase the equipment you will need.
RECRUIT AND ORGANIZE VOLUNTEERS
This task involves designing the jobs you want volunteers to help with, and finding people to do those jobs. It also includes thanking and rewarding volunteers to keep them motivated and involved. A key task is to sign people up to collect and analyze samples at each field and lab site on the sampling dates.
TRAIN FIELD AND LAB VOLUNTEERS
Your volunteers must be trained to do the jobs they sign up for. This involves several tasks: 1) Consulting with the VEMN coordinator to find out what types of training
are available through the VEMN, 2) designing training sessions for people collecting and analyzing samples, 3) running field training sessions for field monitors, 4) running lab training sessions for the lab coordinator and volunteers, 5) providing all volunteer monitors with manuals that describe the stepby
step procedures they will use to collect and analyze observations, samples, and field measurements,
6) running additional training sessions as needed for new monitors.
The VEMN Guide to Volunteer Watershed Monitoring Options suggests the level of training required for each survey listed in Chapter III of the Guide.
MONITORING
Actual monitoring includes the following tasks: 1) preparing equipment and supplies for field and lab sampling, 2) getting necessary equipment and supplies to the volunteer monitors, 3) collecting and analyzing samples, measurements, or observations in the field
and recording the results, 4) transporting the samples to the lab (if needed), 5) checking the samples in at the lab, 6) analyzing samples at the lab and recording the results, 7) cleaning up the lab and equipment and checking supplies.
In large watersheds, some groups designate central points for field monitors to drop off their samples. Sample are then picked up and transported to the lab. In a small watershed, this is probably unnecessary.

STEP 10: WHAT ARE THE TASKS AND WHO WILL DO THEM?
Merrimack River Watershed Study Design Workbook Page 111
QUALITY ASSURANCE
There is a set of tasks around quality assurance that come out of the work you did in study design Step 8 (“What Are Your Quality Assurance Measures?”): 1) scheduling and overseeing quality control samples, both internal and
external – this may include contacting and scheduling an outside quality control lab,
2) providing field and lab volunteers with quality control samples (e.g. blanks and knowns) or instructions on how to collect them (e.g. duplicates and splits),
3) managing and analyzing quality control data, 4) evaluating quality control data and determining response actions (if
needed).
ANALYZE YOUR RESULTS
This involves several tasks to computerize the data: 1) entering the data into a computer, 2) validating it to assure that it has been entered correctly, 3) summarizing the data set to reduce it to a manageable form, 4) interpreting the data to tell a story.
REPORT YOUR RESULTS
This task includes turning your story into a written or visual presentation, such as a report, video, slide presentation, internet site, etc.
PRESENT YOUR RESULTS
This task involves getting your story out to your audience in various ways, from distributing reports, to attending meetings of agencies or private groups, to sponsoring public meetings to present your results.
EVALUATE YOUR STUDY DESIGN
At the end of every monitoring season, you should evaluate your study design in light of your actual experience. What changes will you need to make to improve your monitoring?
STEP 10: WHAT ARE THE TASKS AND WHO WILL DO THEM?
Merrimack River Watershed Study Design Workbook Page 112
Key Program Personnel The scope of your monitoring program will determine how many and what kind of people you will need to carry it out. Following are some possible positions that you might recruit volunteers to do. Note that some may become paid positions, if the work load is such that it’s unreasonable to expect a volunteer to do it. The major responsibility of each position is described briefly.
PROGRAM COORDINATION
These positions carry much of the responsibility for making sure that there are people in place to carry out the monitoring. They may become paid positions.
Program Coordinator: Oversees all the monitoring program tasks listed in the previous section to see that they are carried out.
Volunteer Trainer: Trains the volunteers how to carry out their jobs. Note that this might be the program coordinator, lab coordinator, volunteer coordinator, data management coordinator, or a consulting person or organization.
Lab Coordinator: Overseas and coordinates the lab analysis of samples and does the training of any laboratory volunteers. If you have recruited an outside lab to run your analyses or quality control samples for you, be sure to identify the person in that lab who will be responsible for reporting to you and answering any questions you may have.
QA Officer: Responsible for seeing that your quality assurance measures are carried out. If you have produced a Quality Assurance Project Plan, this person would be responsible for seeing that it gets carried out. Note that this could be either the program coordinator, the lab coordinator, or a person outside of your program.
Volunteer Coordinator: Assures that volunteers are in place to carry out the tasks, including recruiting and scheduling volunteers, communicating with them on a regular basis to be sure that they are having a good experience, and thanking or rewarding them for the work they are doing.
Data Management Coordinator: Assures that all the field and lab data are computerized for summary and analysis. This may include setting up the software for data entry and overseeing volunteers that enter the data, validating the data, and producing the data summary.
Technical Advisory Committee: Provides advice and assistance to the program coordinator in preparing the study design, troubleshooting problems, and interpreting your results (see study design Step 1, “Getting Started” for more information on organizing a technical committee).
POSSIBLE MONITORING TASKS
Field Monitor: Collects and records samples, observations, and measurements in the field and drops them off at a sample dropoff point or a lab.
STEP 10: WHAT ARE THE TASKS AND WHO WILL DO THEM?
Merrimack River Watershed Study Design Workbook Page 113
Sample Runner: Transports samples from a sample dropoff point (if you have one) to the lab. Note that this may be unnecessary in a small watershed where samplers drop their samples off at the lab.
Laboratory Analyst: Analyzes and records the results for field samples. Lab analysts work under the supervision of the lab coordinator.
Data Entry Volunteer: Enters the field and lab data into a computer. Works under the supervision of the data management coordinator. May also validate data entered by another volunteer.
Speaker: Makes public presentations about the program and the monitoring results
You should develop job descriptions for each of these positions before you recruit people to fill them.
STEP 10: WHAT ARE THE TASKS AND WHO WILL DO THEM?
Merrimack River Watershed Study Design Workbook Page 114
Steps to Identifying and Assigning Project Tasks Step 1: Determine the tasks that will need to be done in order to carry out the sampling
and analysis. Step 2: Develop specific positions to carry out the tasks. Write simple job
descriptions for each task. Determine whether each position will be paid or volunteer.
Step 3: Determine how and by whom your volunteers (and trainers) will be trained. The VEMN Guide to Volunteer Watershed Monitoring Options suggests the level of training required for each survey listed in Chapter III of the Guide. It also suggests who might do the training, Contact the VEMN Coordinator for advice.
Step 4: Determine what manuals your field and lab volunteers will use. The manuals describe the stepbystep procedures they will use to collect and analyze observations, samples, and field measurements. The VEMN Coordinator has a VEMN Training Manual as well as access to training manuals used by VEMN partners. S/he can advise you.
What Should Go Into Your Study Design: Part 5: Project Tasks and Personnel
A. List the major tasks to carry out your study design. B. List the paid and volunteer positions.
1) Title 2) Responsibilities 3) Name, address, and phone number of the person: note that you
need these only for program coordination personnel Be sure to include any personnel in an outside lab.
C. List the members of your technical committee and their areas of expertise. results. See study design Step 1, “Getting Started” for more information on organizing a technical committee
D. Describe how your field and lab volunteer will be trained 1) Type of training sessions to be run for initial field monitors and lab
volunteers and who will do the training. 2) How will new field and lab monitors be trained (after the initial
group has been trained) and who will do the training.
E. What manuals will volunteer monitors use?
HOW DOES THIS RELATE TO A QAPP?
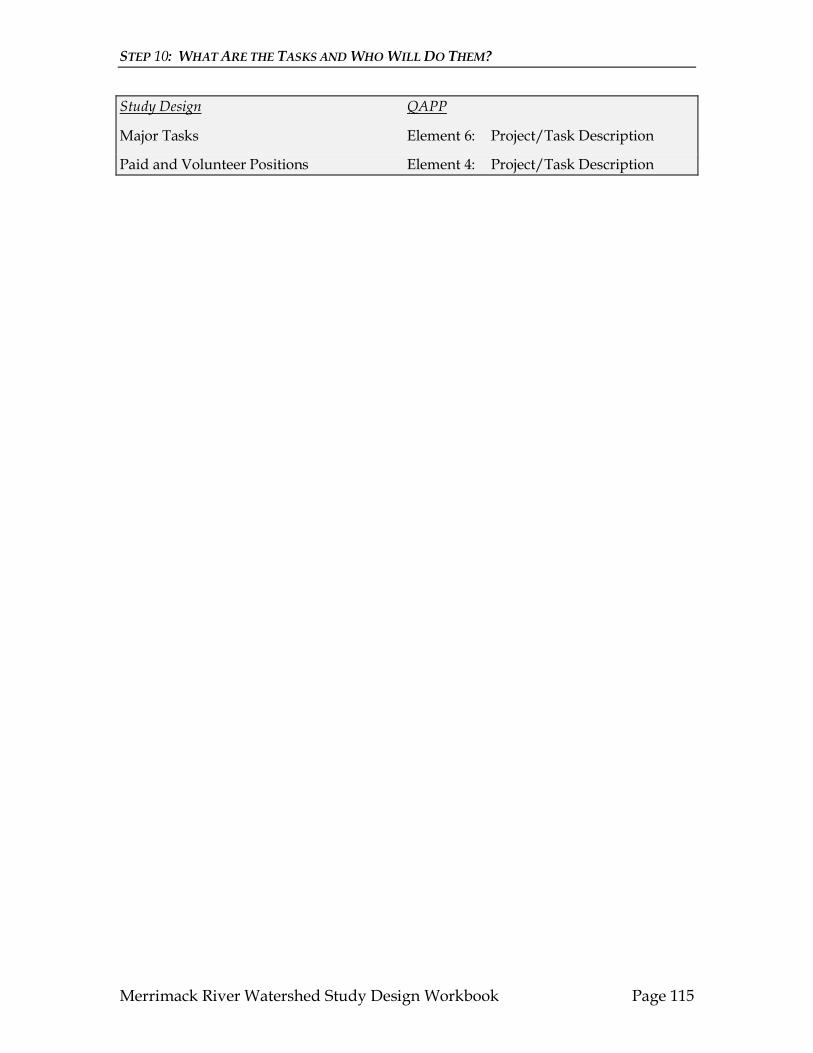
STEP 10: WHAT ARE THE TASKS AND WHO WILL DO THEM?
Merrimack River Watershed Study Design Workbook Page 115
Study Design QAPP
Major Tasks Element 6: Project/Task Description
Paid and Volunteer Positions Element 4: Project/Task Description
Merrimack River Watershed Study Design Workbook Page 116
REFERENCES
American Public Health Association. 1992. Standard Methods for the Examination of Water and Wastewater. 18th ed. American Public Health Association. Washington, DC.
Behar, Sharon, 1995. Testing the Waters, River Watch Network, Montpelier VT.
Behar, Sharon, and Dates, Geoff, 1995. Program Organizing Guide. River Watch Network, Montpelier VT.
Dates, Geoff; Lehrer, Alicia; and Schoen, Jerry, 1996. Training Manual for Core VEMN Monitoring Parameters and Methods, Merrimack River Watershed Council, Lawrence MA.
Dates, Geoff; Lehrer, Alicia; and Schoen, Jerry, 1996. VEMN Guide to Volunteer Watershed Monitoring Options. Merrimack River Watershed Council, Lawrence, MA.
Dates, Geoff, and Byrne, Jack, 1997. Living Waters: Using Benthic Macroinvertebrates and Habitat To Assess River Health. River Watch Network, Montpelier, Vt.
Dates, Geoff, 1997. Turning Monitoring Data Into Useful Information, A Guide Book for Coastal Volunteer Water Quality Monitoring Groups (Workshop Draft) University of ME Cooperative Extension, Waldoboro ME.
Harrelson, Cheryl C., 1994. Stream Channel Reference Sites: An Illustrated Guide To Field Technique, US Forest Service General Technical Report RM245, Fort Collins CO.
Intergovernmental Task Force On Monitoring Water Quality, 1994, Water Quality Monitoring in the United States, 1993 Report and Technical Appendixes, Washington D.C.
Kimball, Joan. 1995. Adopt a Stream Shoreline Survey, Massachusetts Riverways Program, Boston MA.
Massachusetts Department of Environmental Protection, Massachusetts Surface Water Quality Standards, 1990.
Massachusetts Water Watch Partnership, 1990. Manual for Volunteer Water Quality Monitors, University of Massachusetts, Amherst MA.
Massachusetts Water Watch Partnership, 1997. Data Management for Volunteer Monitors, Amherst MA.
Mitchell, Mark K., and Stapp, William B. 1996. Field Manual for Water Quality Monitoring, KendallHunt Publishers, 11th Edition.
New Hampshire Department of Environmental Services, Surface Water Quality Regulations, EnvWs430, 9/30/96.
REFERENCES
Merrimack River Watershed Study Design Workbook Page 117
Plafkin, James L, et al Rapid Bioassessment Protocols for Use in Streams and Rivers: Benthic Macroinvertebrates and Fish. Report # EPA/444/489001. U.S. EPA, Washington DC, May 1989.
State of Massachusetts, 1995. Surface Water Quality Standards. Massachusetts Department of Environmental Protection.
Tennessee Valley Authority, 1995. Clean Water Initiative Volunteer Stream Monitoring Methods Manual. TVA, Chattanooga TN.
U.S. Department of Agriculture, 1996. National Handbook of Water Quality Monitoring. , Document 450viNHWQM, Natural Resources Conservation Service, Washington DC.
U.S. E.P.A. 1986. Bacteriological ambient water quality criteria for marine and fresh recreational waters. EPA 440/584002. U. S. Environmental Protection Agency, Office of Research and Development, Cincinnati, OH.
U.S. E.P.A. 1985. Test methods for Escherichia coli and enterococci in water by the membrane filter procedure (Method #1103.1). EPA 600/485076. U. S. Environmental Protection Agency, Environmental Monitoring and Support Laboratory, Cincinnati, OH.
U.S. E.P.A. 1995. Volunteer Stream Monitoring: A Methods Manual (Field Test Draft) EPA 841 D 95001. U. S. Environmental Protection Agency, Office of Water, Washington DC.
U.S. E.P.A. Guidance for Preparation of Combined Work/Quality Assurance Project Plans for Environmental Monitoring. ORWS QA1, Office of Water Regulations and Standards, Washington DC, May 1984.
U.S. E.P.A. (Region 1) Guidance for Quality Assurance Project Plans for Environmental Monitoring Projects. abridged form January 21, 1992.
U.S. E.P.A. 1993. Methods for Chemical Analysis of Water and Wastes. EPA600/479 020, Environmental Monitoring and Support Laboratory, Cincinnati OH.
U.S. Environmental Protection Agency, 1996. The Volunteer Monitor’s Guide to Quality Assurance Project Plans. Document #EPA 841B96003. Office of Wetlands, Oceans, and Watersheds, Washington DC.

REFERENCES