Velocity With Baseball-Botengineering.nyu.edu/gk12/amps-cbri/pdf/classroom activities/carole... ·...
13
Velocity With Baseball-Bot Subject Area(s) measurement, number & operations, reasoning & proof, and science & technology Associated Unit None Associated Lesson None Activity Title How Fast Is the Ball Going? Header Insert Image 1 here, right justified to wrap Grade Level 5 (4-6) Activity Dependency None Time Required Two 45-minute lessons Group Size: 4 Expendable Cost /Group US$4 (excluding price of Lego Mindstorm kit) Summary Working as a team, students learn the important concept of velocity using the Lego Mindstorm kit. Velocity consists within it a two-part information; speed and direction of travel. This is a hands-on activity where two light sensors are employed as the time keeper. The distance between the two light sensors is a known value; i.e. measured with a measuring tape. From measuring the elapsed time for an object to travel a known distance, one can calculate the estimated speed of the moving object. With a defined direction, the speed can be translated to velocity. Engineering Connection Velocity is ubiquitous in engineering fields. It allows us to measure how fast objects (solid, liquid, or gaseous) travel and the direction of its path at any given point. Without this important concept, it would be very difficult for engineers to design manufacturing facilities which are essentially used as blueprints to build or produce all the necessary items that we depend on. For example: engineers would not be able to properly track the amount of materials needed or the valuable product produced because they do not know how fast the Image 1 ADA Description: TEMP image Caption: TEMP pic - need to insert students working on project Image file name: Baseball-Bot2.jpg Source/Rights: Copyright © Carole Chen 2010
Transcript of Velocity With Baseball-Botengineering.nyu.edu/gk12/amps-cbri/pdf/classroom activities/carole... ·...
Velocity With Baseball-Bot Subject Area(s) measurement, number & operations, reasoning & proof, and science
& technology
Associated Unit None Associated Lesson None
Activity Title How Fast Is the Ball Going?
Header Insert Image 1 here, right justified to wrap
Grade Level 5 (4-6) Activity Dependency None Time Required Two 45-minute lessons Group Size: 4
Expendable Cost /Group US$4 (excluding price of Lego Mindstorm kit) Summary Working as a team, students learn the important concept of velocity
using the Lego Mindstorm kit. Velocity consists within it a two-part information; speed and direction of travel. This is a hands-on activity where two light sensors are employed as the time keeper. The distance between the two light sensors is a known value; i.e. measured with a measuring tape. From measuring the elapsed time for an object to travel a known distance, one can calculate the estimated speed of the moving object. With a defined direction, the speed can be translated to velocity.
Engineering Connection Velocity is ubiquitous in engineering fields. It allows us to measure
how fast objects (solid, liquid, or gaseous) travel and the direction of its path at any given point. Without this important concept, it would be very difficult for engineers to design manufacturing facilities which are essentially used as blueprints to build or produce all the necessary items that we depend on. For example: engineers would not be able to properly track the amount of materials needed or the valuable product produced because they do not know how fast the
Image 1 ADA Description: TEMP image
Caption: TEMP pic - need to insert students working on project Image file name: Baseball-Bot2.jpg
Source/Rights: Copyright © Carole Chen 2010
Version: June 2010
materials is flowing in or out, or what dosage of drug is needed to treat a certain illness and approximately how long it takes for the drug to take effect, etc.
Engineering Category (1) relates science concept to engineering/the use of technology
Keywords direction, distance, measure, speed, velocity,
Educational Standards NYS Science: 5.PS.3, 5.RP.1, 5.CM.9, 5.R.2, and 5.A.1 [1] Pre-Requisite Knowledge Familiarity with measurement using a measuring tape, use of calculator or basic arithmetic skills (subtraction & division), experience with Lego Mindstorm kit, and the use of Mindstorms software
Learning Objectives After this activity, students should be able to: Build and program a basic Lego NXT brick (Baseball-Bot) Calculate velocity based on measured time and distance
Materials List Each group needs: Lego Mindstorm kit (2 NXT bricks & 2 light sensors) Computer with NXT 2.0 programming, NXT 2.0 data logging, Microsoft Word and Excel Measuring tape Compass Scissors Two strips of equal length wood (~2 meters long) Double sided tape Marking tape Notepad and pen Timer (stopwatch)
Introduction / Motivation Have you ever wondered how fast an airplane is travelling when it is 35,000 feet up in the air? Or what is the fastest baseball pitch ever thrown? Or what does it mean when scientists say that a meteorite is entering our atmosphere at 70 kilometers per second? All these questions relate to one
Version: June 2010
important concept; velocity. It tells us the speed (how fast) an object is travelling and the direction at which the object is travelling. For example, for airplanes we can describe its velocity as 650 miles per hour due northeast. Velocity is used on a daily basis by all engineering fields. But why exactly is it so important? How does it differ from the plain old “speed”?
Insert Image 2 here, centered
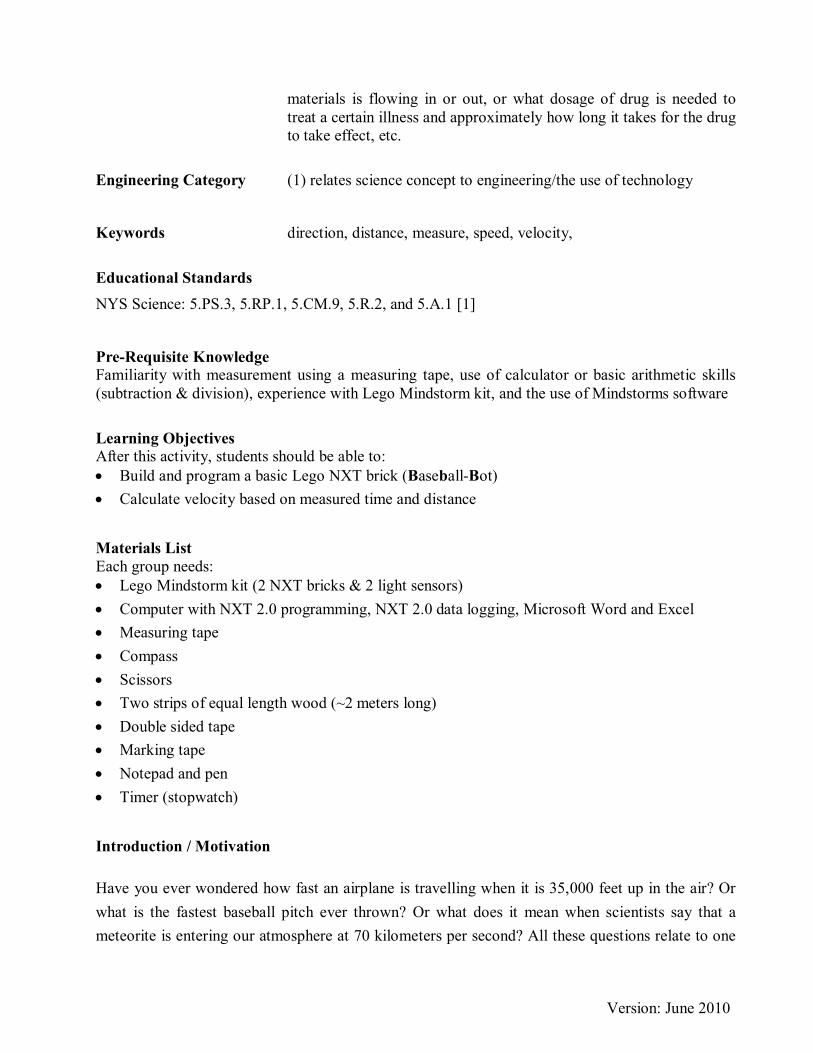
Let’s say, we are on hired by NASA to remotely direct a robotic moon mission. Our mission is to guide a “moon-bot” to a specific crater within 30 minutes. We know the robot’s current position relative to the crater and the shortest path spans 0.5 kilometers. What is the minimum velocity the robot needs to travel in order to get to the crater within the allowed 30 minutes? The equation for velocity is:
풗풆풍풐풄풊풕풚 = 풅풊풔풕풂풏풄풆풕풊풎풆 [풖풏풊풕풔 & 푑푖푟푒푐푡푖표푛]
Image 2 ADA Description: Moonbot mission Caption: Image 2: Moonbot needs to travel from its current position to the crater in less than 30 minutes Image file name: Moonbot.jpg Source/Rights: Copyright © Carole Chen 2010
Version: June 2010
Knowing this useful equation, we can calculate the minimum required velocity the robot needs to be travelling in order to get to the crater in time -- 30 minutes, which equals to 1800 seconds and 0.5 kilometers, which equals to 500 meters.
푚표표푛푏표푡 푠 푣푒푙표푐푖푡푦 = 500 푚푒푡푒푟푠
1800 푠푒푐표푛푑푠 = 0.278 푚푠 푛표푟푡ℎ푒푎푠푡
With this value, we can now successfully guide our robot to the crater. Isn’t it amazing that such a simple equation can help scientists and engineers perform outer space missions? This is only an example of one application. How about baseball? Is the direction of throw as important as the speed? Of course, our main expectation is for the baseball to go towards the batter’s direction and not towards the audience. Then depending on the pitcher’s skill, he can guide the ball’s path (direction of travel) depending on what type of ball is being thrown. This involves velocity, not just speed.
Vocabulary / Definitions Word Definition
Distance Physical length that determines how far apart objects are, can be measured in units of meters, miles, feet, inches, etc.
Direction Line on which an object is travelling along Speed Distance travelled by an object in a specific time, magnitude of velocity.
Measured in units of length per time Velocity rate of change in position with respect to time and direction of path; distance
divided by time
Procedure Before the Activity Gather all required materials Make sure all the Lego kits are complete with the parts properly divided Create large working space (may need to move desks to allow empty floor space if working in a
classroom) Divide the class into groups of 4, (optional: assign roles to each person of the team – otherwise
let the students choose) With the Students 1. Discuss and go over the definitions of direction, distance, speed, and velocity. 2. Write on the board (in a sentence form) of the relationship of velocity with distance and timer;
diameter; that is velocity = distance ÷ time.
Version: June 2010
3. Directly underneath the sentence relationship, write the relationship in a mathematical format: v = D ÷ t where D the distance traveled and t is the time elapsed.
4. Rearrange the relationship to show that D = v x t. That is, if we know the velocity (or speed) and the time we need to travel, we can calculate the distance traveled instead.
5. Perform an example together as a class. Ask students if they have seen their parents’ car speedometer? Ask them for a value. Let’s say 50 miles per hour. It takes 15 minutes to get from home to school. Can you calculate approximately what the distance between school and home? [Answer: yes, we can calculate the distance between school and home, it is D = 50 miles/hr x 0.25 hour = 12.5 miles]
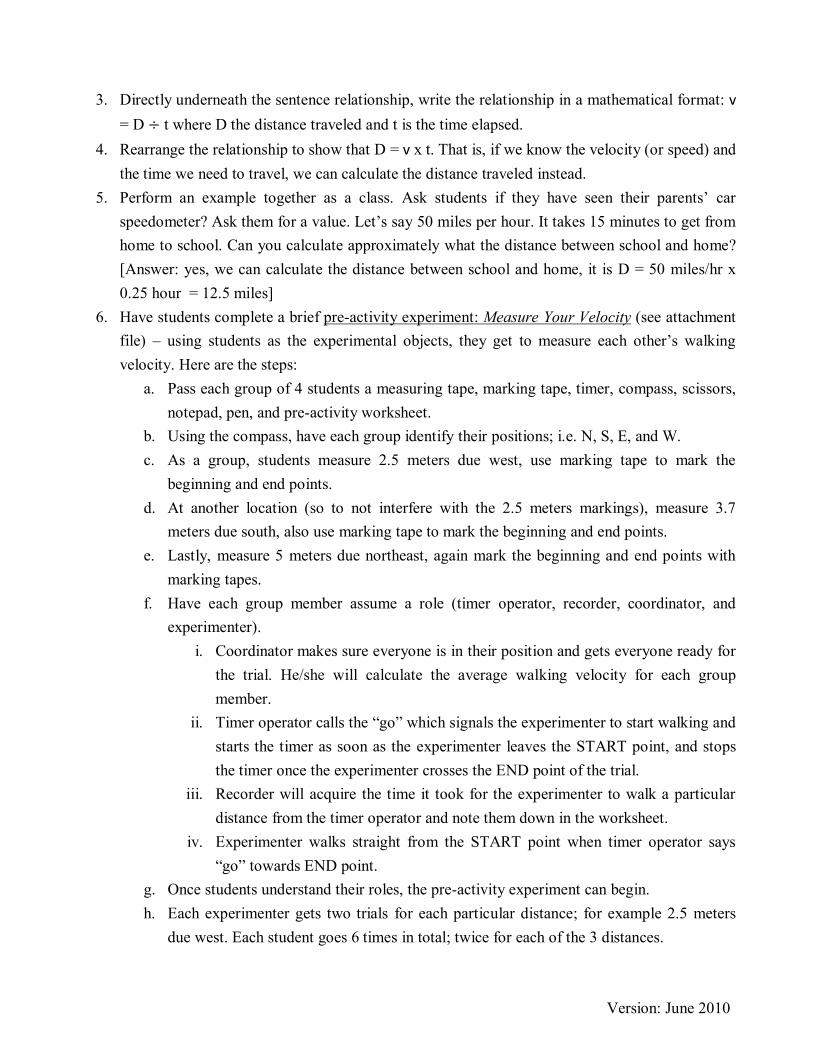
6. Have students complete a brief pre-activity experiment: Measure Your Velocity (see attachment file) – using students as the experimental objects, they get to measure each other’s walking velocity. Here are the steps:
a. Pass each group of 4 students a measuring tape, marking tape, timer, compass, scissors, notepad, pen, and pre-activity worksheet.
b. Using the compass, have each group identify their positions; i.e. N, S, E, and W. c. As a group, students measure 2.5 meters due west, use marking tape to mark the
beginning and end points. d. At another location (so to not interfere with the 2.5 meters markings), measure 3.7
meters due south, also use marking tape to mark the beginning and end points. e. Lastly, measure 5 meters due northeast, again mark the beginning and end points with
marking tapes. f. Have each group member assume a role (timer operator, recorder, coordinator, and
experimenter). i. Coordinator makes sure everyone is in their position and gets everyone ready for
the trial. He/she will calculate the average walking velocity for each group member.
ii. Timer operator calls the “go” which signals the experimenter to start walking and starts the timer as soon as the experimenter leaves the START point, and stops the timer once the experimenter crosses the END point of the trial.
iii. Recorder will acquire the time it took for the experimenter to walk a particular distance from the timer operator and note them down in the worksheet.
iv. Experimenter walks straight from the START point when timer operator says “go” towards END point.
g. Once students understand their roles, the pre-activity experiment can begin. h. Each experimenter gets two trials for each particular distance; for example 2.5 meters
due west. Each student goes 6 times in total; twice for each of the 3 distances.
Version: June 2010
i. Once they are finished with the experiment and answered all the questions on the bottom of the worksheet, discuss the results as a class.
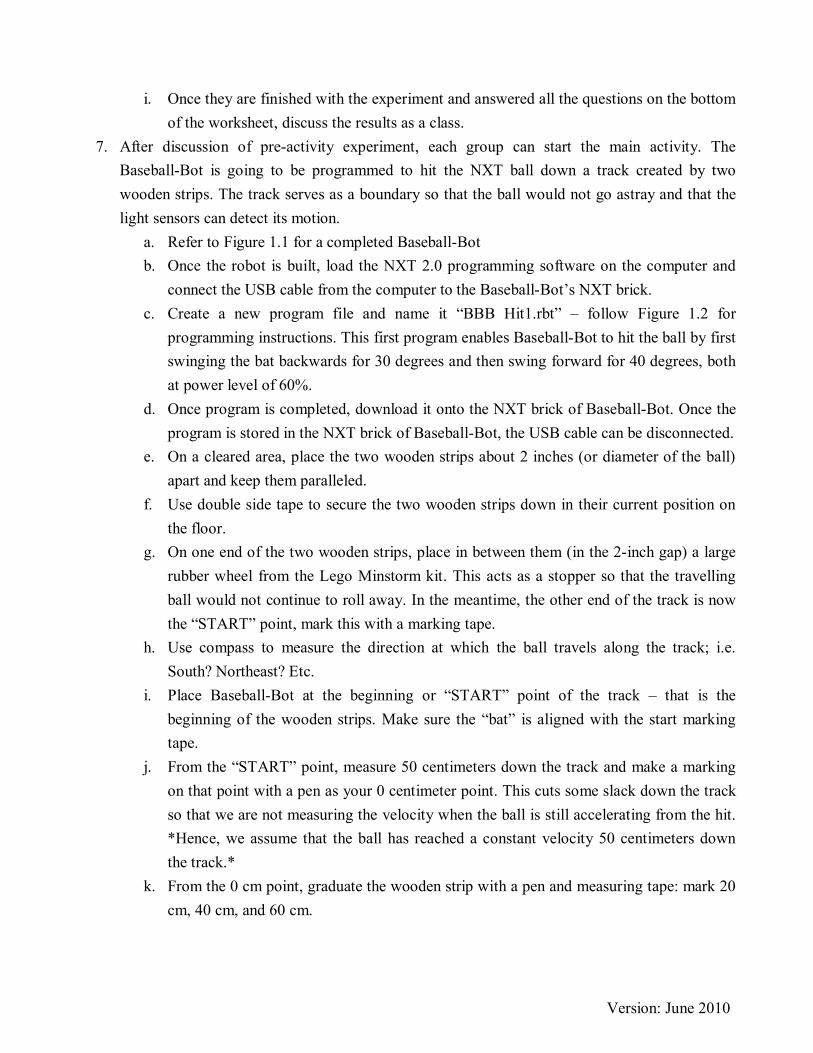
7. After discussion of pre-activity experiment, each group can start the main activity. The Baseball-Bot is going to be programmed to hit the NXT ball down a track created by two wooden strips. The track serves as a boundary so that the ball would not go astray and that the light sensors can detect its motion.
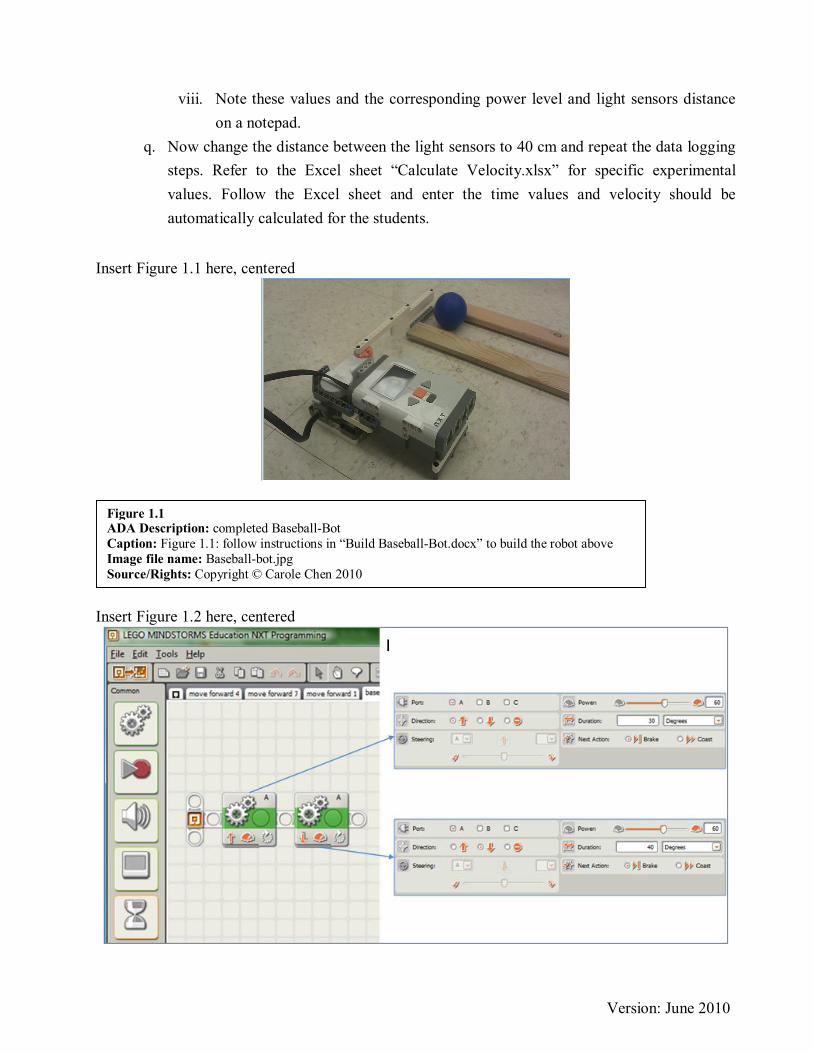
a. Refer to Figure 1.1 for a completed Baseball-Bot b. Once the robot is built, load the NXT 2.0 programming software on the computer and
connect the USB cable from the computer to the Baseball-Bot’s NXT brick. c. Create a new program file and name it “BBB Hit1.rbt” – follow Figure 1.2 for
programming instructions. This first program enables Baseball-Bot to hit the ball by first swinging the bat backwards for 30 degrees and then swing forward for 40 degrees, both at power level of 60%.
d. Once program is completed, download it onto the NXT brick of Baseball-Bot. Once the program is stored in the NXT brick of Baseball-Bot, the USB cable can be disconnected.
e. On a cleared area, place the two wooden strips about 2 inches (or diameter of the ball) apart and keep them paralleled.
f. Use double side tape to secure the two wooden strips down in their current position on the floor.
g. On one end of the two wooden strips, place in between them (in the 2-inch gap) a large rubber wheel from the Lego Minstorm kit. This acts as a stopper so that the travelling ball would not continue to roll away. In the meantime, the other end of the track is now the “START” point, mark this with a marking tape.
h. Use compass to measure the direction at which the ball travels along the track; i.e. South? Northeast? Etc.
i. Place Baseball-Bot at the beginning or “START” point of the track – that is the beginning of the wooden strips. Make sure the “bat” is aligned with the start marking tape.
j. From the “START” point, measure 50 centimeters down the track and make a marking on that point with a pen as your 0 centimeter point. This cuts some slack down the track so that we are not measuring the velocity when the ball is still accelerating from the hit. *Hence, we assume that the ball has reached a constant velocity 50 centimeters down the track.*
k. From the 0 cm point, graduate the wooden strip with a pen and measuring tape: mark 20 cm, 40 cm, and 60 cm.
Version: June 2010
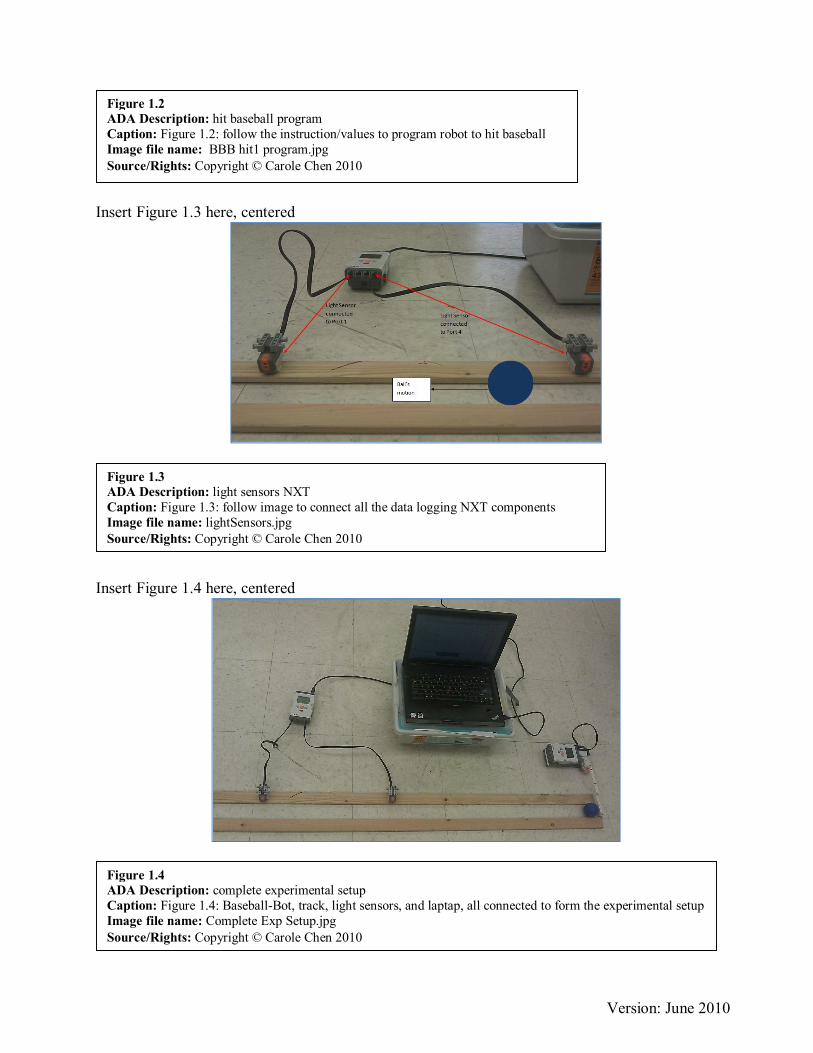
l. Refer to Figure 1.3 for instructions on how to connect the two light sensors to a second NXT brick.
m. Once the light sensors are connected, place the light sensor that is connected to Port 4 (LS4) to point 0 cm and the light sensor that is connected to Port 1 to point 60 cm.
n. Use the USB cable and connect the light sensors NXT brick to the computer. Load NXT 2.0 data logging software.
o. Refer to Figure 1.4 as an example of how the whole experimental setup should look like. p. Now the whole experimental setup is ready for data acquisition.
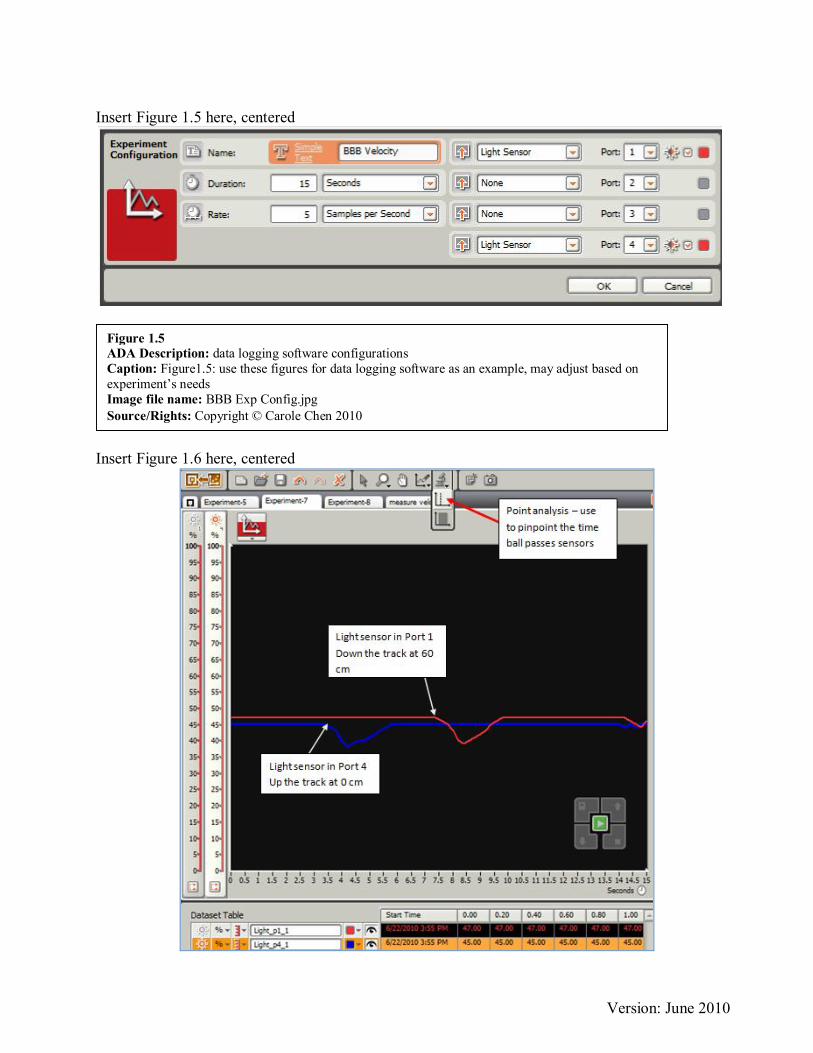
i. Once NXT 2.0 data logging software is loaded and connected to light sensors NXT brick, click on “File” “New”. Refer to Figure 1.5 for experimental configuration.
ii. When all required values are entered, click “OK”. On the bottom right hand corner, there should be a control panel with a green arrow. Click this button when you are ready to start the experiment.
iii. Once the program/experiment is loaded onto the light sensor NXT brick, you should hear a “beep” which signals that the experiment is running.
iv. Let the experiment take a few seconds of data (this way you see two clear straight lines because the light sensors are detecting constant light values). *Make sure that no movement is made by anyone or anything which can be picked up by the light sensors (this would create confusion when you are determining peaks for which the ball crosses the two light sensors – you do not want to confuse surrounding movement with the ball’s movement).
v. Once a few seconds passed, immediately run the “BBB Hit1.rbt” program on the Baseball-Bot NXT brick. The robot should swing backward 30 degrees and then swing forward 40 degrees with a power level of 60% and hits the ball. *Make sure the Baseball-Bot is aligned at the “START” point and that the robot is turned on prior to the start of the data logging so that it is ready to go immediately after few seconds of data logging acquisition.*
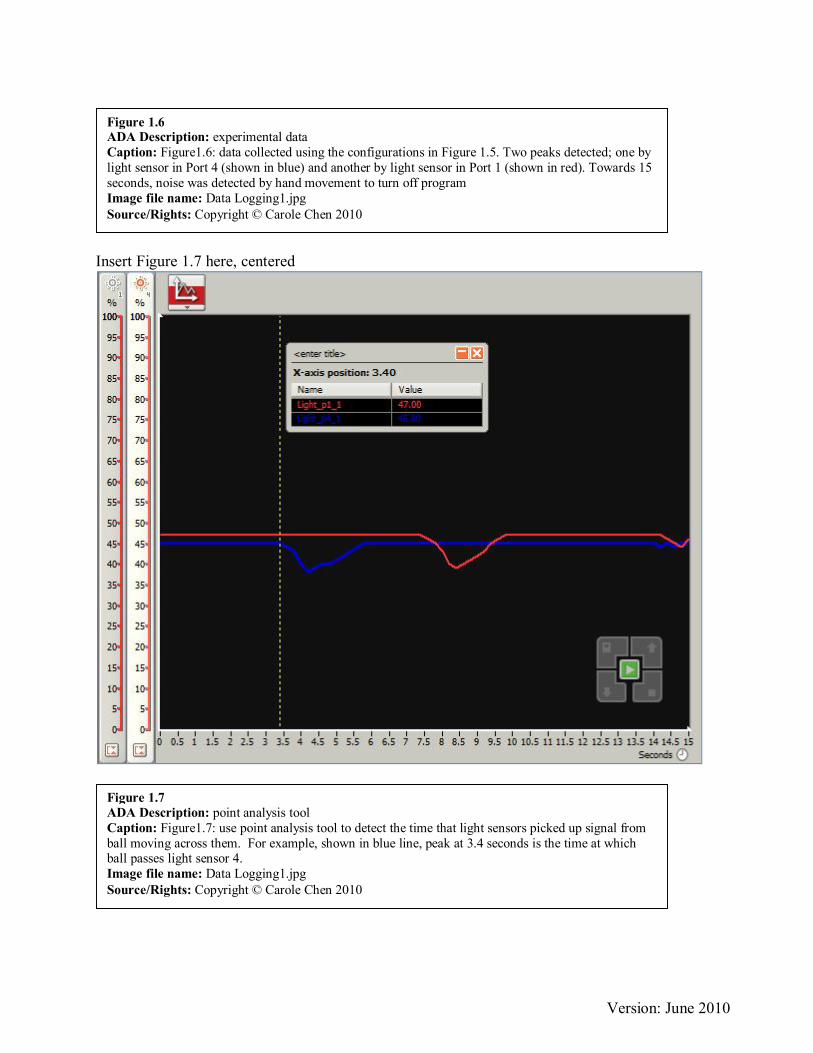
vi. Refer to Figure 1.6 as example of how the experiment should look like on data logging.
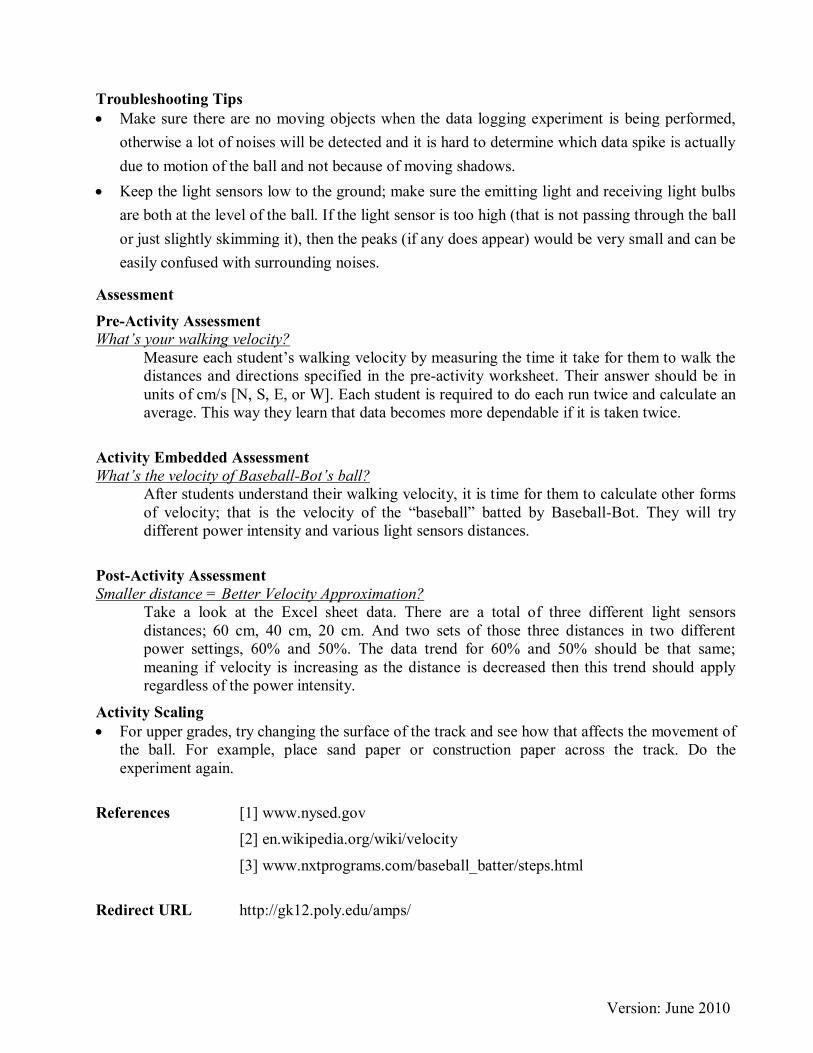
vii. Once the peaks are detected, use the point analysis tool to pinpoint the exact time the ball passes each sensor. Click on the tool and drag the yellow dotted vertical line to the beginning of the peaks. Refer to Figure 1.7 for the yellow dotted line. Also refer to Figure 1.6 for the two points where the white arrows are pointing, these are the points you want to read off the x-axis time values.
Version: June 2010
viii. Note these values and the corresponding power level and light sensors distance on a notepad.
q. Now change the distance between the light sensors to 40 cm and repeat the data logging steps. Refer to the Excel sheet “Calculate Velocity.xlsx” for specific experimental values. Follow the Excel sheet and enter the time values and velocity should be automatically calculated for the students.
Insert Figure 1.1 here, centered
Insert Figure 1.2 here, centered
Figure 1.1 ADA Description: completed Baseball-Bot Caption: Figure 1.1: follow instructions in “Build Baseball-Bot.docx” to build the robot above Image file name: Baseball-bot.jpg Source/Rights: Copyright © Carole Chen 2010
Version: June 2010
Insert Figure 1.3 here, centered
Insert Figure 1.4 here, centered
Figure 1.4 ADA Description: complete experimental setup Caption: Figure 1.4: Baseball-Bot, track, light sensors, and laptap, all connected to form the experimental setup Image file name: Complete Exp Setup.jpg Source/Rights: Copyright © Carole Chen 2010
Figure 1.3 ADA Description: light sensors NXT Caption: Figure 1.3: follow image to connect all the data logging NXT components Image file name: lightSensors.jpg Source/Rights: Copyright © Carole Chen 2010
Figure 1.2 ADA Description: hit baseball program Caption: Figure 1.2: follow the instruction/values to program robot to hit baseball Image file name: BBB hit1 program.jpg Source/Rights: Copyright © Carole Chen 2010
Version: June 2010
Insert Figure 1.5 here, centered
Insert Figure 1.6 here, centered
Figure 1.5 ADA Description: data logging software configurations Caption: Figure1.5: use these figures for data logging software as an example, may adjust based on experiment’s needs Image file name: BBB Exp Config.jpg Source/Rights: Copyright © Carole Chen 2010
Version: June 2010
Insert Figure 1.7 here, centered
Figure 1.7 ADA Description: point analysis tool Caption: Figure1.7: use point analysis tool to detect the time that light sensors picked up signal from ball moving across them. For example, shown in blue line, peak at 3.4 seconds is the time at which ball passes light sensor 4. Image file name: Data Logging1.jpg Source/Rights: Copyright © Carole Chen 2010
Figure 1.6 ADA Description: experimental data Caption: Figure1.6: data collected using the configurations in Figure 1.5. Two peaks detected; one by light sensor in Port 4 (shown in blue) and another by light sensor in Port 1 (shown in red). Towards 15 seconds, noise was detected by hand movement to turn off program Image file name: Data Logging1.jpg Source/Rights: Copyright © Carole Chen 2010
Version: June 2010
Troubleshooting Tips Make sure there are no moving objects when the data logging experiment is being performed,
otherwise a lot of noises will be detected and it is hard to determine which data spike is actually due to motion of the ball and not because of moving shadows.
Keep the light sensors low to the ground; make sure the emitting light and receiving light bulbs are both at the level of the ball. If the light sensor is too high (that is not passing through the ball or just slightly skimming it), then the peaks (if any does appear) would be very small and can be easily confused with surrounding noises.
Assessment Pre-Activity Assessment What’s your walking velocity?
Measure each student’s walking velocity by measuring the time it take for them to walk the distances and directions specified in the pre-activity worksheet. Their answer should be in units of cm/s [N, S, E, or W]. Each student is required to do each run twice and calculate an average. This way they learn that data becomes more dependable if it is taken twice.
Activity Embedded Assessment What’s the velocity of Baseball-Bot’s ball?
After students understand their walking velocity, it is time for them to calculate other forms of velocity; that is the velocity of the “baseball” batted by Baseball-Bot. They will try different power intensity and various light sensors distances.
Post-Activity Assessment Smaller distance = Better Velocity Approximation?
Take a look at the Excel sheet data. There are a total of three different light sensors distances; 60 cm, 40 cm, 20 cm. And two sets of those three distances in two different power settings, 60% and 50%. The data trend for 60% and 50% should be that same; meaning if velocity is increasing as the distance is decreased then this trend should apply regardless of the power intensity.
Activity Scaling For upper grades, try changing the surface of the track and see how that affects the movement of
the ball. For example, place sand paper or construction paper across the track. Do the experiment again.
References [1] www.nysed.gov [2] en.wikipedia.org/wiki/velocity
[3] www.nxtprograms.com/baseball_batter/steps.html Redirect URL http://gk12.poly.edu/amps/

Version: June 2010
Owner Carole Chen Contributors Carole Chen Copyright © 2010 by NYU:Poly: this activity was made possible through the support of
Project AMPS under GK-12 fellowship grant 0807286 from the NSF