Velocity Suite Investment grade data and analytics · SEC 10K & 10Q financials Gas O&M expenses:...
14
Velocity Suite Investment grade data and analytics
-
Upload
nguyendung -
Category
Documents
-
view
213 -
download
0
Transcript of Velocity Suite Investment grade data and analytics · SEC 10K & 10Q financials Gas O&M expenses:...

Velocity SuiteInvestment grade data and analytics

Virtual AnalystsToday’s energy professionals need more than accurate data; they need powerful analytical tools to quickly find answers.
Virtual Analysts™ (VAs) bring analytical firepower to the desk-top. They allow anyone, regardless of their level of product training, to quickly break down and assess complexand data intensive industry problems.
Each product in the Velocity Suite contains a set of VAs that convert common, time-consuming tasks into a few “quick clicks”.
VAs let you dynamically interact with data to conduct specific analyses quickly. Questions that previously required a string of complex, tedious tasks can now be answered by simply select-ing a few items within pre-built applications.
Virtual Analysts reduce your learning curve so more people in your organization can use the Velocity Suite.
Our dynamic development approach allows us to design and deploy new VAs quickly and is part of our ongoing commitment to the continuous development and improvement of the Velocity Suite.
Single application and integrated data means faster, better results Energy markets have converged. Analysts need the ability to quickly evaluate the activities of market participants and indus-try dynamics across commodities without having their thought process derailed by jumping between applications.
This is why the Velocity Suite has been delivered as one inte-grated application since its inception. Each of our products run inside the same product window, allowing you to look at coal production, daily gas prices, plant capacity factors, weather normalized loads, transmission and more all at the same time.
If your analysis of a company’s activities in power markets quickly leads to the need to measure their competitiveness in fuels markets, the Velocity Suite allows you to seamlessly con-tinue your analysis.
2 | Velocity Suite
DataMinerOne of the most powerful features available to Velocity Suite clients is the DataMiner.™ You can quickly retrieve all data and geographic details available for a company in each sector of the energy industry. The DataMiner has proven to be one of the most valuable aspects of the Velocity Suite delivering faster and more consistent results.
Better technology and a new standard for data updates What data delivery method is right for you? Do you prefer hav-ing the products installed locally or is an online solution best for you? By taking advantage of the most powerful technology available, ABB offers their clients the choice to determine which delivery method best meets their needs.
The Velocity Suite can be used online and our clients receive data updates every day, even if the application is installed locally.
Is your position in the market affected by pipeline markets or the spot price of power? By taking advantage of our daily online updates, you won’t be left without the critical data you need.
More than just powerful analytical tools, the Velocity Suite is the industry’s most trusted source for data.
Holding Company Report Virtual Analyst − Just one example of how the Velocity Suite streamlines the analytical process

Sophisticated analytical tools in a single application − The Velocity Suite includes an easy-to-use query tool with interactive output grids, charting and mapping capabilities.
Client training and supportVelocity Suite clients get unlimited hands-on training (in person or through the web) at no additional charge. Request additional training as often as you like!
Support, ranging from using tools, understanding the content, or assistance from our experts on how data can be applied to your specific analyses, is unlimited and there’s never an additional charge.
Independent analysis hours: Let us be a part of your analytical staffWe have the industry’s most experienced support staff. As part of your service, you receive an allocation of independent analysis hours so we can help you when you need it.
These hours can be used to perform work within the Velocity Suite, research the industry for data that you need or to create presentation quality maps.
Velocity Suite| 3

4 | Velocity Suite
− What does it cost to transport coal? − Who produces high BTU, low sulfur coal? Who buys it? − How do you track mine accidents, injuries, violations and
citations? − What is the level of gas in storage at a specific facility and
what is the average net change day by day? − Who owns firm capacity on a pipeline? − Who purchased that capacity in the release markets at what
% of tariff? − What is the daily production volume in a given shale place? − How might a proposed project or critical issue impact flows?
We believe that you can’t separate the fuel supply market into pieces. Energy markets have evolved dramatically in the past several years. In many markets, revenue for coal plants is dictat-ed by the cost of gas. In the future, emissions costs may move coal plants to the margin and increase demand for natural gas. EV Fuels’ extensive coal and natural gas information is updated daily and works in unison to provide you the entire fuels picture.
EV FuelsIntegrated content for both gas and coal markets
Data coverage
Industry view Gas regulatory financials
Industry view Comparative balance sheet
Gas company overview Statement of income
Gas deliveries to customers Statement of cash flow
Transaction details Statement of retained earnings
Pipeline capacity release by flow
path
Distribution of salaries & wages
Natural gas pipelines index of
customers
Gas operating revenues
Current effective gas tariff rates Gas plant in service
Gas imports & exports Accum provision for depreciation,
amortization & depletion
Gas operations statistics Accum provision for depreciation
gas utility plant
Pipeline operationally available
capacity
SEC 10K & 10Q financials
Gas O&M expenses Comparative balance sheet
Gas account Statement of income & cash flow
Transmission & distribution line
statistics
Daily stock prices
Storage injections & withdrawls Financial ratios & statistics
Compressor stations Market drivers
Proposed pipelines & expansions Daily gas prices
Monthly pipeline revenue & volume Weekly natural gas storage
Gas storage operations Natural gas supply & disposition
Daily storage capacity by facility Monthly natural gas sotrage
Underground storage facilties State natural gas production
LNG storage facilities Baker Hughes rig counts
Auxiliary peaking storage facilities NYMEX futures
Power Plant operations UPI coal price forwards
Monthly plant generation &
consumption
Cantor Fitzgerald allowance prices
Unit emission controls Weekly crude oil stocks
Monthly plant fuel transactions
Coal statistics
Monthly plant coal transportation
costs
Coal mine production
Estimated coal stockpile
Coal import & exports
EV Fuels includes: Monthly fossil fuel purchases, generation and consump-tion by fuel type, coal production, coal transportation, regulated financial data for gas utilities and pipeline companies, SEC financials, gas retail sales volume and revenue, gas storage, transportation rates, daily delivered vol-ume, and market price data.

− How can I visualize LMP market data? − How does geographic location impact my delivered fuel
cost? − How can I be sure I’ve selected the best location for my
project?
Data visualization is only part of spatial analysis. From simply showing a picture of a company’s assets, to a complex analy-sis that examines how industry infrastructure is interrelated, EV Energy Map helps you understand today’s complex markets.
EV Energy Map is the industry’s most advanced mapping application. It seamlessly integrates market data that is updated daily with aerial imagery and the most accurate geospatial data, making it an extremely powerful mapping application in the industry.
Mapping layers included with EV Energy Map are the most detailed and most complete energy mapping layers available.
EV Energy Map makes extensive use of aerial imagery in our development of the electric infrastructure layers to provide you with optimum accuracy.
−
Data coverage
Natural gas industry layers Envionrmental layers
Natural gas pipelines Renewable portfolio standards by
state
Receipt / delivery points Non-attainment regions
Natural gas storage facilities Land use topo image
LNG facilities both existing &
proposed
Reference layers
Gas import / export points & market
centers
Countries, major cities, states, zip
codes
Local distribution company
territories
Urbanized areas
Natural gas holding companies Cities
Coal industry layers Major roads
Mines Rivers, lakes and aquifiers
Railroads Lakes
Coal basins Aquifiers
Navigable waterways Stream gauging stations
Coal docks / tipples Census tracts
Electric industry layers Background images
Electric generating units High resolution color topography
Power plants High resolution bathymetry
Transmission lines US wind resources
Substations US solar resources
Electric service territories Western US geothermal resources
Electric holding company territories US land use
Balancing authorities US average annual percipitation
NYMEX and ICE price points Raster Graphics (DRG)
NERC regions / sub regions Digital Ortho Photographs (DOQ)
ISO / RTO regions High resolution urban imagery
ISO zones
LMP points
EV Energy mapBeyond presentations − Investment quality spatial analysis
Velocity Suite | 5
EV Energy Map includes: Transmission lines, power plants, substations, gas pipelines, receipt and delivery points, storage facilities, electric and gas util-ity territories, coal mines, coal basins, railroads, holding companies, control and planning areas, and geopolitical, physical and demographic reference layers.
6 | Velocity Suite
− Who owns a unit and how much does it cost to operate? − What will the hourly price of power be at Entergy next year? − How will an announced merger impact regional generation
markets? − How many energy service providers are active in Pennsylva-
nia? − Who’s building new coal plants? − How will companies meet renewable energy requirements? − What new capacity is covered by power contracts? − What power plants are my competitors building? − How can I stay on top of the development and planning his-
tory or specific projects?
EV Power combines all the data on the electric industry with complete coverage on IOUs, generation and transmission coop-eratives, distribution cooperatives, municipal utilities, non-regu-lated market participants, and generating assets, and updates it daily with the latest available information.
EV Power also tracks development of new generation projects. ABB’s unique approach to researching new power station addi-tions, retirements and rerates, marries detailed news searches and telephone research with web scouring technology that noti-fies our analysts of changes in identified reference sources.
By combining market capacity changes with plant attributes, monthly generation, costs, and consumption values you are able to see the most complete picture of today’s generating fleet.
EV PowerA comprehensive view of North America power markets with coverage of future plants for power stations
Data coverage
Retail transaction detailsIndustry view
Retail sales by rate scheduleElectric company overview
Monthly electric company salesElectric company energy account
Top retail purchasersElectric company retail
Utility regulatory financialsPlant operations statistics
Comparative balance sheetExisting generating unit capacity
Statement of incomeFuture generating unit capacity
Statement of cash flowMonthly plant production costs
Statement of retained earningsMonthly plant fuel costs
Distribution of salaries & wagesGenerating plant O&M statistics
Electric operating revenuesMonthly plant generation & con-
sumption
Electric plant in serviceExisting & planned emissions
controls
Accumulated provision for
depreciation amortization & depletion
Document library including air
permits
Accumulated provision for
depreciation electric utility plant
Utility operations statistics
SEC 10k & 10Q financialsElectric energy account
Statement of income & cash flowMonthly peaks & outputs
Daily stock pricesTransmission & distribution line
statistics
Financial ratios & statisticsMarket drivers
Control area operations statisticsDaily power prices
Monthly capabilities at peak demandForward power prices
Net energy for load & peak demandShort term price forecasts
Scheduled & actual interchangeWholesale transaction details
Wholesale power sales
Wholesale power purchases
Transmission for others
Transmission by others
Canadian imports & exports
Power marketer transactions
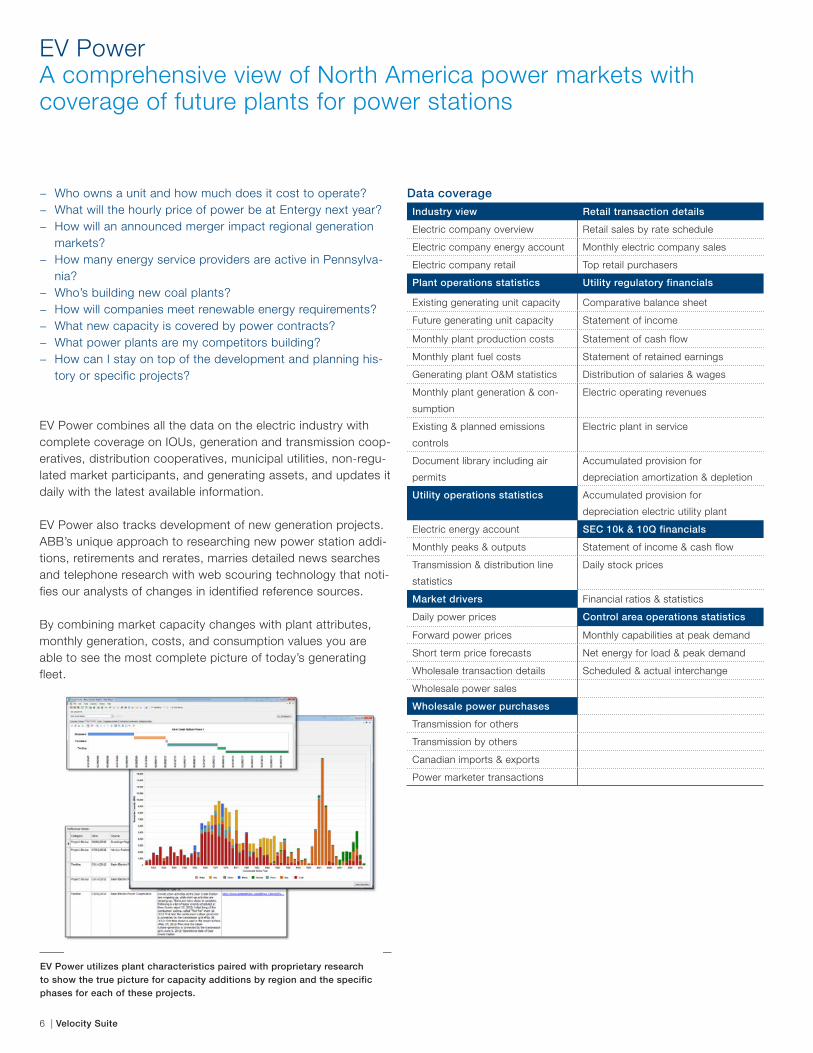
EV Power utilizes plant characteristics paired with proprietary research to show the true picture for capacity additions by region and the specific phases for each of these projects.

− How is a company choosing to operate their units? − How many hours in a given week was a baseload unit out of
service? − What’s the best strategy to buy, sell or generate power in an
LMP Market? − Do you need “model-ready” data for your market models? − How do emissions rates change when a unit switches fuels − How do LMP prices respond to system load that differs from
the ISO’s forecast?
EV Market-Ops digs down into the details. Its primary compo-nents are hourly data for generation (US and parts of Canada), heat rates, emissions (EPA CEMS), loads and prices (FERC and ISO). We have pulled together these extremely useful and cumbersome collections of data and put them in an easy-to-use, extremely flexible application.
Unit costs are linked to generation and Locational Marginal Price data to enable EV Market-Ops users to review hourly operating revenue and profit streams for nearly 2,600 of the nation’s largest generating units. EV Market-Ops also compiles and formats extensive supply and demand data for use as inputs to most market models. The data is updated daily.
EV Market-Ops differs from competing products in quality and quantity. First, all raw data are reviewed for accuracy and corrected or estimated where wrong/incomplete. Second, we add value to all raw operations data by making sure that when presented, they have an appropriate market context. Third, we create analytical tools to make your analyses faster and easier.
EV Market-Ops presents all the detail possible, “no holds barred.” For example, LMP pricing data is available for all price nodes in North America via cloud servers, the majority of which are also viewable in EV Energy Map.
Velocity Suite | 7
Data coverage
Market drivers
ISO Realtime & day ahead LMP pricing
ISO ancillary pricing
ISO zonal load data
ISO total load data
Control area actual peak load data
Historical demand by zone (ABB loads based on FERC)
Market marginal costs - Lambda
ISO hub and zone definitions
Forecasts
ISO zonal load forecasts
Control area forecast peak load data
Forecast demand by zone (ABB loads based on FERC)
Generator operations statistics
Annual & monthly unit operations summary (US, Ontario, Alberta)
Hourly unit generation (US, Ontario, Alberta)
Unit capacity blocks
Unit ramp rates
GADS availability report
GADS outage cause report
Emissions operations statistics
Unit emission control installations
Unit level NOx, S02 and C02 total emissions for the US and Canada
Unit level emission allowance holdings
EV Market-opsDetailed operational data that’s easy to use and understand
EV Market-Ops includes: Hourly, unit-level generation and emissions, unit operations and revenue, market pricing, demand, generation and ISO forecasts.

8 | Velocity Suite
EV WeatherBuilt from the most reliable and complete source data available
U.S. drought conditions
Did you know... − temperature is the biggest effector of demand in the ISO
markets? − drought is one of the biggest threats to nuclear power gen-
eration? − hurricanes have the largest effect on oil and natural gas pro-
duction in the Gulf of Mexico? − snowpack is a central factor affecting hydro power in the
northwest?
EV Weather keeps you connected with precise and reliable data that captures all of these events.
The number one factor impacting the day to day operations of energy markets is weather; it’s unpredictable and ever-chang-ing. EV Weather tames this for you, and provides you with a reliable, easy way to integrate weather data into your project.
EV Weather datasets have been upgraded to utilize the most complete and accurate historical and forecast data available from the National Climatic Data Center and the National Weather Service.
Grab the raw data that is relevant to your analysis, or use our “Weather Enhanced” datasets to view energy-specific data like hourly generation, load or price side-by-side with the local weather conditions.
Weather enhanced data sets in the Velocity Suite:
EV power
Monthly generation and consumption
ICE 10x power and gas indices
Enerfax power and gas prices
EV fuels
Monthly fuel consumption
Enerfax power and gas prices
Enerfax petroleum prices
ICE 10x power gas indices
EV market ops
Unit generation and emissions
Historical zonal hourly load
ISO day ahead and real time hourly-pricing
Historical ISO zonal hourly load
Forecast ISO zonal load
EV Weather includes: − Hourly and daily weather observations − Temperature forecasts − Zonal heating and cooling degree day calculations − Hydro stream-flow and generation − Weather-normalized power demand − Up-to-date snow-pack measurements − Hurricane storm tracks − All geographically described using EV Energy Map
Velocity Suite | 9
FTR TraderDesktop analytical tools for FTR traders and risk managers
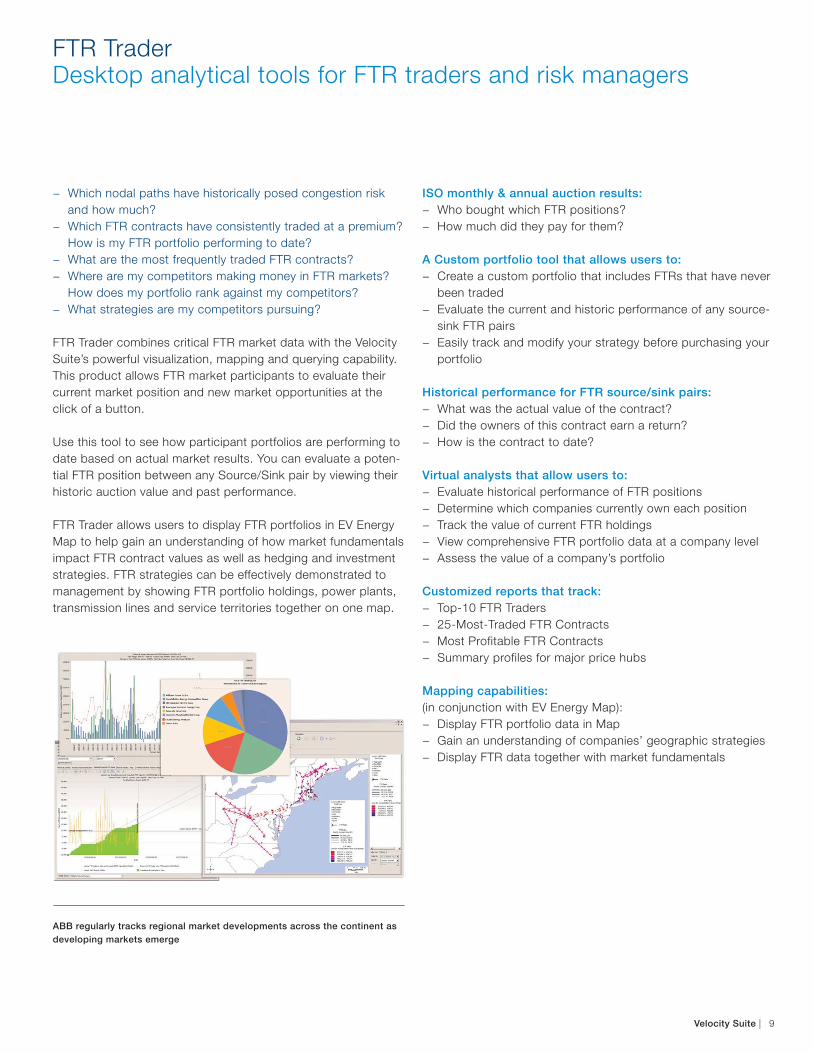
ABB regularly tracks regional market developments across the continent as developing markets emerge
− Which nodal paths have historically posed congestion risk and how much?
− Which FTR contracts have consistently traded at a premium? How is my FTR portfolio performing to date?
− What are the most frequently traded FTR contracts? − Where are my competitors making money in FTR markets?
How does my portfolio rank against my competitors? − What strategies are my competitors pursuing?
FTR Trader combines critical FTR market data with the Velocity Suite’s powerful visualization, mapping and querying capability. This product allows FTR market participants to evaluate their current market position and new market opportunities at the click of a button.
Use this tool to see how participant portfolios are performing to date based on actual market results. You can evaluate a poten-tial FTR position between any Source/Sink pair by viewing their historic auction value and past performance.
FTR Trader allows users to display FTR portfolios in EV Energy Map to help gain an understanding of how market fundamentals impact FTR contract values as well as hedging and investment strategies. FTR strategies can be effectively demonstrated to management by showing FTR portfolio holdings, power plants, transmission lines and service territories together on one map.
ISO monthly & annual auction results: − Who bought which FTR positions? − How much did they pay for them?
A Custom portfolio tool that allows users to: − Create a custom portfolio that includes FTRs that have never
been traded − Evaluate the current and historic performance of any source-
sink FTR pairs − Easily track and modify your strategy before purchasing your
portfolio
Historical performance for FTR source/sink pairs: − What was the actual value of the contract? − Did the owners of this contract earn a return? − How is the contract to date?
Virtual analysts that allow users to: − Evaluate historical performance of FTR positions − Determine which companies currently own each position − Track the value of current FTR holdings − View comprehensive FTR portfolio data at a company level − Assess the value of a company’s portfolio
Customized reports that track: − Top-10 FTR Traders − 25-Most-Traded FTR Contracts − Most Profitable FTR Contracts − Summary profiles for major price hubs
Mapping capabilities:(in conjunction with EV Energy Map):
− Display FTR portfolio data in Map − Gain an understanding of companies’ geographic strategies − Display FTR data together with market fundamentals

10 | Velocity Suite
Power TransactionsFERC EQR
− Who does a power marketer sell power to, what are terms?− What was the price for power delivered to a control area? − How much electricity did a wind company sell?− What power contracts does a utility hold?
Over 1,900 public electric utilities and power marketers are required to electronically file Electric Quarterly Reports (EQR) summarizing the contractual terms and conditions in their agreements for all jurisdictional services (including market based power sales, cost-based power sales, and transmission service) and transaction information for short-term and longterm market-based power sales and cost-based power sales during the most recent calendar quarter. This data is released quarterly and many data items are available with hourly granularity.
ContentThis dataset includes more than 200 million rows, consisting of approximately 8 million records per quarter. It is very difficult for end users to manipulate, understand and mine this data for useful information.
Currently, there is no other single source for this information. These include interconnection requests, regulation & frequency response, energy and bookouts data. This data is often requested by clients and prospects.
Virtual AnalystThe Virtual Analyst easily allows quick answers to questions about whom a company is doing business with and where. It also details out the products that the company sells.
Power Transactions can also give transpar-ency into areas of the United States that aren’t managed by an Independent System Operator as well as the granular operations of renewable plants like wind farms.
Data available
Hourly transmission flows
Flow type for imports, exports, positive, negative or net
Scheduled and actual transmission cutages for the ISO markets
Broader facility attributes
Zones affected
Duration and begin/end time analysis
Transmission Loading Relief (TLR) events by flowgate and branch
Curtailment details
Number of flows and TLR identifiers

Velocity Suite | 11
EV Grid MapVisualize nodal model output in the Velocity Suite
− How can I visualize nodal model forecasts? − How is transmission congestion affecting forecast prices? − What power prices can I expect near a potential power plant
project?
EV Grid Map enables users to easily import model output at the bus level, locate buses at their exact geospatial location in the power grid (rather than a schematic representation), and create contour maps and other analysis to pinpoint high and low prices in model runs.
Used in combination with the Velocity Suite’s analysis tools, geospatial content, and historical operational and market data, EV Grid Map empowers users to examine forecast model results alongside historical LMP prices, flowgates, FTR/TCC/TCR/CRR portfolios, proposed generation and transmission projects, and much more.
12 | Velocity Suite
EV TransmissionAn in-depth analysis of the electrical infrastructure and how it operates
− How does hourly flow compare to operational limits?− What is the capacity utilization of Hydro Quebec Exports?− What outages are scheduled and will they affect the markets?− What flowgates are binding and what is their associated
shadow price?− What are different facility ratings on the grid?− Where are the contingent and monitored elements located?
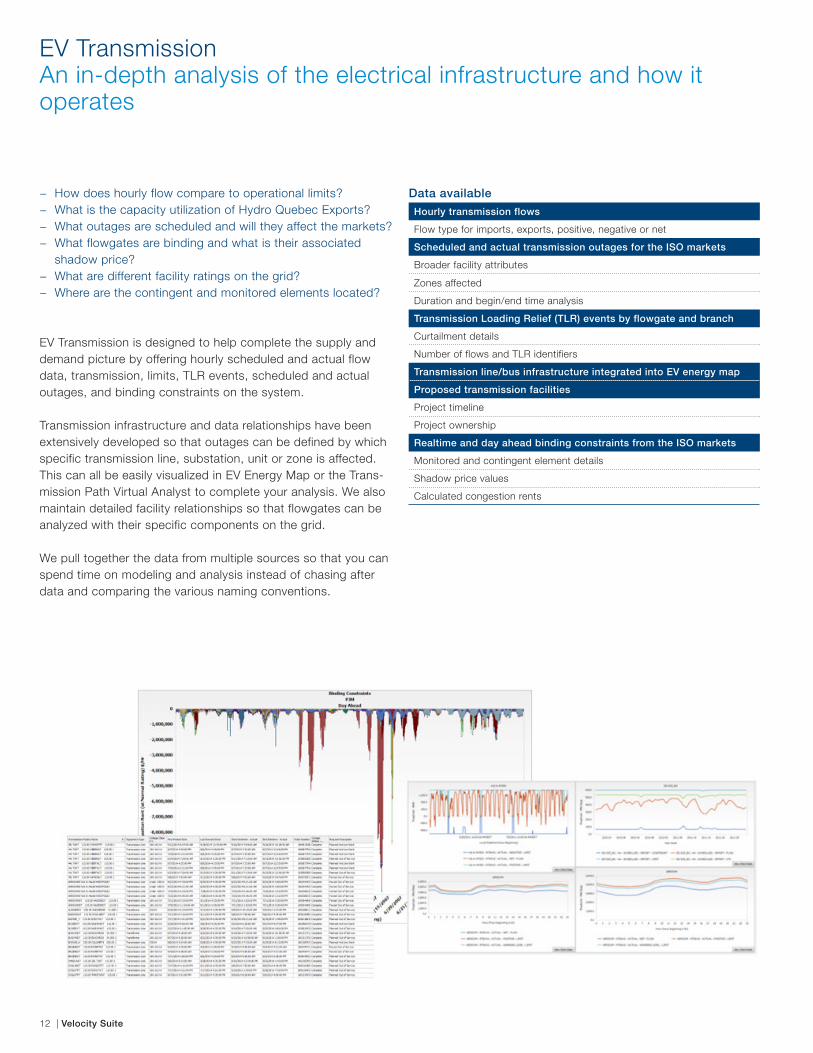
EV Transmission is designed to help complete the supply and demand picture by offering hourly scheduled and actual flow data, transmission, limits, TLR events, scheduled and actual outages, and binding constraints on the system.
Transmission infrastructure and data relationships have been extensively developed so that outages can be defined by which specific transmission line, substation, unit or zone is affected. This can all be easily visualized in EV Energy Map or the Trans-mission Path Virtual Analyst to complete your analysis. We also maintain detailed facility relationships so that flowgates can be analyzed with their specific components on the grid.
We pull together the data from multiple sources so that you can spend time on modeling and analysis instead of chasing after data and comparing the various naming conventions.
Data available
Hourly transmission flows
Flow type for imports, exports, positive, negative or net
Scheduled and actual transmission outages for the ISO markets
Broader facility attributes
Zones affected
Duration and begin/end time analysis
Transmission Loading Relief (TLR) events by flowgate and branch
Curtailment details
Number of flows and TLR identifiers
Transmission line/bus infrastructure integrated into EV energy map
Proposed transmission facilities
Project timeline
Project ownership
Realtime and day ahead binding constraints from the ISO markets
Monitored and contingent element details
Shadow price values
Calculated congestion rents

Velocity Suite | 13
About ABB
ABB provides industry-leading software and deep domain ex-pertise to help the world’s most asset intensive industries such as energy, utilities and mining solve their biggest challenges, from plant level, to regional network scale, to global fleet-wide operations.
Our enterprise software portfolio offers an unparalleled range of solutions for asset performance management, operations and workforce management, network control and energy portfolio management to help customers reach new levels of efficiency, reliability, safety and sustainability. We are constantly research-ing and incorporating the latest technology innovations in areas such as mobility, analytics and cloud computing.
We provide unmatched capabilities to integrate information technologies (IT) and operational technologies (OT) to provide complete solutions to our customers’ business problems.

Contact us
ABB’s Enterprise Software product group
The information contained in this document is for general information purposes only. While ABB strives to keep the information up to date and correct, it makes no representations or warranties of any kind, express or implied, about the completeness, accuracy, reliability, suitability or availability with respect to the information, products, services, or related graphics contained in the document for any purpose. Any reliance placed on such information is therefore strictly at your own risk. ABB reserves the right to discontinue any product or service at any time.
© Copyright 2016 ABB. All rights reserved.9AKK106930A8237