Velocity of Pledged Collateral: Analysis and Implications · 3 I. INTRODUCTION This paper attempts...
25
WP/11/256 Velocity of Pledged Collateral: Analysis and Implications Manmohan Singh
Transcript of Velocity of Pledged Collateral: Analysis and Implications · 3 I. INTRODUCTION This paper attempts...

WP/11/256
Velocity of Pledged Collateral:
Analysis and Implications
Manmohan Singh

© 2011 International Monetary Fund WP/11/256
IMF Working Paper
Research Department
Velocity of Pledged Collateral
Prepared by Manmohan Singh1
Authorized for distribution by Stijn Claessens
November 2011
Abstract
Large banks and dealers use and reuse collateral pledged by nonbanks, which helps lubricate the global financial system. The supply of collateral arises from specific investment strategies in the asset management complex, with the primary providers being hedge funds, pension funds, insurers, official sector accounts, money markets and others. Post-Lehman, there has been a significant decline in the source collateral for the large dealers that specialize in intermediating pledgeable collateral. Since collateral can be reused, the overall effect (i.e., reduced ‘source’ of collateral times the velocity of collateral) may have been a $4-5 trillion reduction in collateral. This decline in financial lubrication likely has impact on the conduct of global monetary policy. And recent regulations aimed at financial stability, focusing on building equity and reducing leverage at large banks/dealers, may also reduce financial lubrication in the nonbank/bank nexus.
JEL Classification Numbers: G21; G28; F33; K22; G18; G15
Keywords: pledged collateral, velocity of collateral, churning, rehypothecation, monetary policy
Author’s E-Mail Address: [email protected]
1 This paper has benefited from comments by Aston Marnoch, Peter Stella, Hyun Shin, Greg Van Inwegen, Phil Prince, David Biccaregui, Vijay Sundaram, Darrel Duffie, Andre Fernandez, William Alexander, Richard Brazenor, Tanya Azarchs, Ben Miller, Zoltan Pozsar, James Aitken, Sean Kerr, Simon Gleason and Amitabh Arora. The author is especially thankful to Stijn Claessens, Prakash Loungani, Karl Habermeier and David Marston at the IMF who have encouraged research on financial sector linkages.
This Working Paper should not be reported as representing the views of the IMF. The views expressed in this Working Paper are those of the author(s) and do not necessarily represent those of the IMF or IMF policy. Working Papers describe research in progress by the author(s) and are published to elicit comments and to further debate.

2
Contents Page
I. Introduction. ..........................................................................................................................3
II. Centralization of Collateral ...................................................................................................4 A. The Suppliers of Collateral to the "Street" (or Dealers) .............................................4 B. Methodology for Calculating a Velocity Factor for Pledged Collateral ...................13
III. How have the Sources of Collateral Changed Recently (End-2010 Data) .......................13 IV. Collateral Velocity Factor and Monetary Policy ...............................................................16 V. Policy Issues.......................................................................................................................18 Tables 1. Hedge Fund Strategies .........................................................................................................6 2. Securities Lending, 2007-2010………………………………. .........................................11 Figure 1. Pledged Collateral, 2007—Typical Sources and Uses ........................................................5 2. Representative Leverage Levels in some HF Strategies ......................................................7 3. Pledged Collateral that can be Re-used with Large European and U.S. Banks .................14 4. Pledged Collateral, 2010—Typical Sources and Uses ......................................................15 5. Pledge Collateral and M2...................................................................................................17 Box 1. Rehypothecation vs. Pledged Collateral that can be Re-used vs. Rehypothecation ............9 2. Accounting for Pledged Collateral in U.S. and non-U.S. Jurisdictions .............................10 3. Are There any Other Buckets that are Sources of Pledged Collaeral? ..............................12 Annex 1. Deleveraging Components-Collateral Squeeze and Margins Spiral ..................................19 2. Hedge Fund Borrowing from Prime Brokers in the U.S ...........................................................21 3. Collateral Rehypothecation and Collateral Custody ............................................................... 22 References ................................................................................................................................23

3
I. INTRODUCTION
This paper attempts to do two things: to bring together several strands in the theoretical literature regarding the use of collateral in the financial system; and to confront theoretical models postulated so far on collateral with actual data. The motivation for investigating the use of collateral is its increasing importance for the functioning of the global financial system. The nonbank/bank nexus has become considerably more complex over the past two decades, in part because the separation between hedge funds, mutual funds, insurance companies, banks, and broker/dealers has become blurred as a result of financial innovation and deregulation (Lo et al, 2011). Part of that evolution has been the greater use (and re-use) of collateral by the financial sector. In volume terms, this collateral use has become over the past decade on par with monetary aggregates like M2. However, post Lehman, the (ongoing) deleveraging in the global financial system along with regulatory measures has constrained the availability of collateral (and its re-use). This greater importance of collateral has been investigated in three strands in the theoretical literature, which relate to each other. One is the literature on collateral and default which has primarily focused on the role of margin and “haircuts” (Geanakoplos, 2003; Brunnermeier and Pedersen, 2009; Gorton and Metrick, 2009; Krishnamurthy, Nagel, Orlov, 2010; Shleifer and Vishny, 2011). A second, more recent strand has focused on the concept of rehypothecation and has clarified that collateral can be re-used and has a velocity. Analytical work here includes Adrian and Shin (2010), while Singh (2010) has examined the extent of rehypothecation using market data from hedge fund and prime brokerage industry. And a third and very recent strand focuses on liquidity mismatches and the role of collateral in intermediation chains. Specifically, Brunnermeier, Gorton and Krishnamurthy (2011) have introduced the liquidity mismatch index (LMI) where weights can be assigned to capture the lengths of intermediation chains, thus focusing on the velocity of collateral. Empirically, this paper provides evidence on the importance of the reuse of collateral for financial intermediation using the analytical framework developed by Shin (2009). He identifies two elements in a decline in overall debt capacity due to an adverse shock: the collateral squeeze and the margin spiral. The collateral squeeze is the decline in debt capacity due to ‘price decline’ (i.e., haircuts) and has been studied extensively. The margin spiral, which represents de-leveraging in the financial system triggered by a shock, incorporates the effect of the shortening of ‘re-pledging chains’. Using hand collected data, this paper shows that, post-Lehman, two effects have occurred: overall collateral availability has declined, and the intermediation chains have become much shorter. While the first effect has been recognized, the second effect, which is quantitatively larger than the first, has not been given as much attention. This decline in leverage and re-use of collateral may be viewed positively from a financial stability perspective. From a monetary policy perspective, however, the lubrication in the global financial markets is now lower as the velocity of money-type instruments has declined. The amount is large, an estimated $4-5 trillion. Given the macro-financial importance of this decline, the paper suggests the need for further analytical work on deleveraging. Specific questions include (i) how the shortening chains impact the real economy, and (ii) how monetary aggregates (e.g., M2) can interact or substitute for financial collateral that is reused.

4
The paper is laid out as follows. Section II discusses how ‘collateral that can be repledged’ is centralized at large banks that are the primary users of such collateral. It also describes the methodology for calculating a velocity factor for such pledged collateral before the Lehman crisis (i.e., end-2007). Section III focuses on the deleveraging that has taken place since end-2007 and the extent to which the primary sources of collateral have declined as of end-2010. It also calculates the velocity for pledged collateral as of end-2010 and compares it with end-2007. Section IV discusses the possible links between the velocity of collateral and the velocity of money (M2) from a monetary policy angle. Section V concludes with some policy suggestions and open questions.
II. CENTRALIZATION OF COLLATERAL
Typically, non-banks allow re-use of their collateral in lieu of other considerations (e.g., hedge funds via their prime-brokers allow for collateral reuse as a quid pro quo for the leverage/funding they receive from dealers). This allows collateral to have ‘velocity.’ Such securities that can be repledged (or reused) are typically received by large banks (henceforth, dealers) as collateral against margin loans, securities borrowing, reverse repo transactions and OTC derivatives. This collateral is secured funding for the dealers and is received in lieu of borrowing and/or other securities given to a client. The typical description in a financial statement for pledged collateral that can be rehypothecated is as follows:
As of December 2009 and November 2008, the fair value of financial instruments received as collateral by the firm that it was permitted to deliver or re-pledge was $561 billion and $578 billion, respectively, of which the firm delivered or re-pledged $392 billion and $445 billion, respectively.
Source Goldman Sachs, 2009 10K report
This description is remarkably similar in the financial statements of both U.S. and European dealers; thus data on pledged collateral are at least to some extent comparable across these institutions. Dynamic intermediation chains arise via the pledged collateral received by large banks/dealers as securities since the collateral can be used in their own name—Box 1. These chains are dynamic in that, unlike static chains that involve the processing of pools of collateral into safe, short-term, liquid instruments, the specific use of the repledged collateral—which remains unchanged—varies over time (see further Pozsar and Singh, 2011).
A. The Suppliers of Collateral to the ‘Street’ (or Dealers)
The key providers of (primary) collateral to the ‘street’ (or dealers) are: (a) hedge funds; (b) securities lending via custodians on behalf of pension, insurers, official sector accounts etc.; and (c) commercial banks that liaise with dealers (Figure 1). Typically, hedge funds are suppliers of collateral while money market funds are users, in that they supply funds to the market in exchange for collateral (often via commercial banks as they swap commercial paper with commercial banks for other types of collateral). The other providers of collateral generally loan collateral for various tenors to optimize their asset management mandates.

5
The ‘supply’ of pledged collateral is typically received by the central collateral desk of dealers that re-use the collateral to meet the ‘demand’ from the financial system. Major dealers active in the collateral industry include Goldman Sachs, Morgan Stanley, JP Morgan, BoA/Merrill and Citibank in the U.S. In Europe and elsewhere, important collateral dealers are Deutsche Bank, UBS, Barclays, Credit Suisse, Societe General, BNP Paribas, HSBC, Royal Bank of Scotland and Nomura. Dealers obtain collateral through various means. From the levered (or hedge fund) accounts, they obtain collateral through (i) repurchase agreements (repos) and (ii) loans made under prime broker agreements. From the unlevered (or real money) accounts, dealers liaise with custodians of pension and insurance funds, official sector accounts etc., and secure collateral via securities lending or repos.
Figure 1: Pledged Collateral, 2007—Typical Sources and Uses
Red curve lines = “users” Black straight lines = “suppliers”
$ 1.6 trillion
$ 1.7 trillion
de minimis
Central Collateral Desk
U.S. $10 trillion
(iii) Commercial Banks
(ii) Securities Lending (via Custodians representing sovereigns/official accounts, pension, insurers, asset managers, ETF funds etc.)
(i) Hedge Funds
Money Market Funds (prime/ government, etc)
6
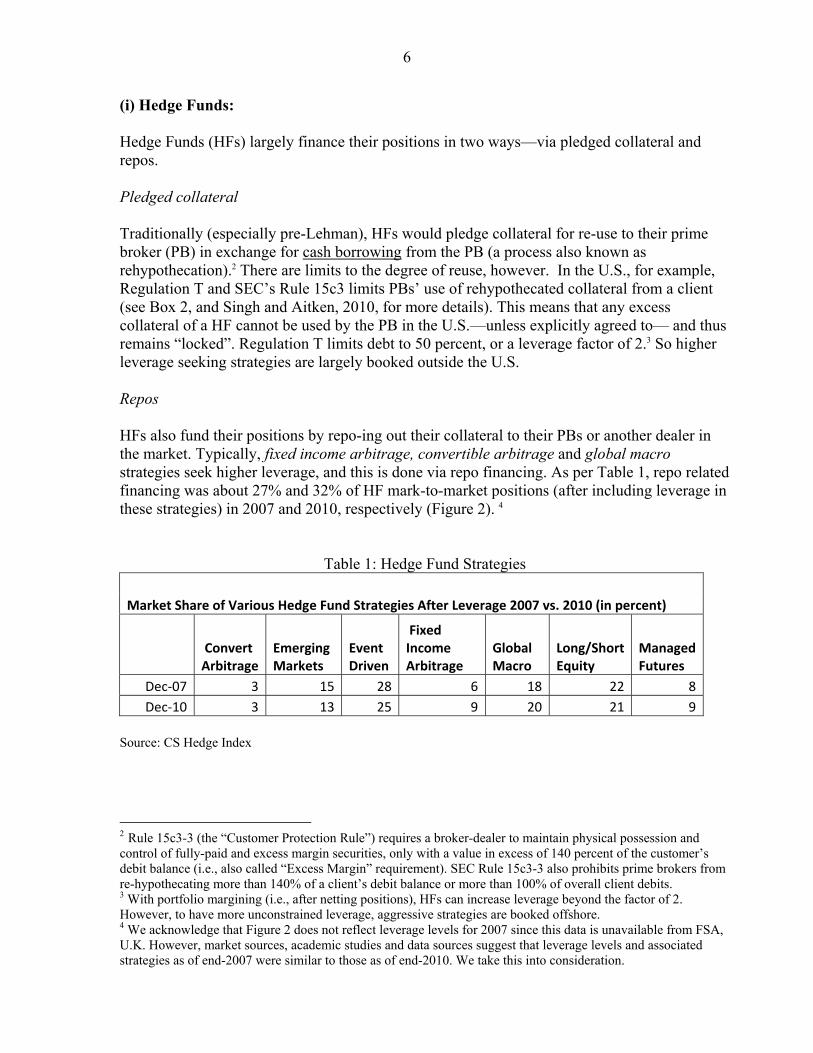
(i) Hedge Funds: Hedge Funds (HFs) largely finance their positions in two ways—via pledged collateral and repos. Pledged collateral Traditionally (especially pre-Lehman), HFs would pledge collateral for re-use to their prime broker (PB) in exchange for cash borrowing from the PB (a process also known as rehypothecation).2 There are limits to the degree of reuse, however. In the U.S., for example, Regulation T and SEC’s Rule 15c3 limits PBs’ use of rehypothecated collateral from a client (see Box 2, and Singh and Aitken, 2010, for more details). This means that any excess collateral of a HF cannot be used by the PB in the U.S.—unless explicitly agreed to— and thus remains “locked”. Regulation T limits debt to 50 percent, or a leverage factor of 2.3 So higher leverage seeking strategies are largely booked outside the U.S. Repos HFs also fund their positions by repo-ing out their collateral to their PBs or another dealer in the market. Typically, fixed income arbitrage, convertible arbitrage and global macro strategies seek higher leverage, and this is done via repo financing. As per Table 1, repo related financing was about 27% and 32% of HF mark-to-market positions (after including leverage in these strategies) in 2007 and 2010, respectively (Figure 2). 4
Table 1: Hedge Fund Strategies
Market Share of Various Hedge Fund Strategies After Leverage 2007 vs. 2010 (in percent)
Convert Arbitrage
Emerging Markets
Event Driven
Fixed Income Arbitrage
Global Macro
Long/Short Equity
Managed Futures
Dec-07 3 15 28 6 18 22 8
Dec-10 3 13 25 9 20 21 9
Source: CS Hedge Index
2 Rule 15c3-3 (the “Customer Protection Rule”) requires a broker-dealer to maintain physical possession and control of fully-paid and excess margin securities, only with a value in excess of 140 percent of the customer’s debit balance (i.e., also called “Excess Margin” requirement). SEC Rule 15c3-3 also prohibits prime brokers from re-hypothecating more than 140% of a client’s debit balance or more than 100% of overall client debits. 3 With portfolio margining (i.e., after netting positions), HFs can increase leverage beyond the factor of 2. However, to have more unconstrained leverage, aggressive strategies are booked offshore. 4 We acknowledge that Figure 2 does not reflect leverage levels for 2007 since this data is unavailable from FSA, U.K. However, market sources, academic studies and data sources suggest that leverage levels and associated strategies as of end-2007 were similar to those as of end-2010. We take this into consideration.

7
Figure 2. Representative Leverage Levels in some HF strategies
How much collateral was sourced from HFs (end-2007)?
First, we calculate the mark-to-market value of collateral with the HF industry (source HFR or CS Hedge Index, or Ang, Gorovvy, and van Inwegen, 2011), or an average when all sources are available). Based on available data, the HF industry’s estimates assets under management (AUM) to be at $2.0 trillion for end-2007, and $1.7 trillion for end-2010.5 The consensus estimates for global HF leverage is about 2.0 as of end-2007 and about 1.75 as of end-2010.6 Thus mark-to-market collateral (i.e., AUM times gross leverage) was about $4.0 trillion as of end-2007 and $3.0 trillion as of end-2010. Using the end-2007 mark-to-market collateral estimate of $4.0 trillion and using Table 1, the extent of repo-financing from the dealers would be 27% of $ 4 trillion. After adjusting for the portion of AUM imbedded within the 27%, repo-funding for end-2007 is estimated to have been about $750 billion.7 In addition, borrowing from PBs would largely be in other strategies, especially quantitative long/short equities or other event driven strategy etc. Using data from U.K.’s FSA’s HF surveys and estimating of PB borrowing in the U.S. we calculate about $850 billion was
5 The bigger hedge funds are macro oriented, while the smaller funds are stock-pickers. Larger hedge funds characteristically employ a higher level of leverage: 23 percent of funds with greater than $1 billion in AUM utilize leverage of between 2 and 5 times investment capital. The smaller funds utilize much lower levels of leverage (between 1 and 2). 6 We use gross leverage since we want to estimate the total amount of mark-to-market collateral with HFs (i.e., AUM times gross leverage). See “Hedge Fund Leverage”, (Ang, Gorovvy and van Inwegan, 2010). We also acknowledge the limitations of calculating global leverage for this industry as reflected in the BIS working paper. 260, “Estimating the Leverage for Hedge Funds”. Also see OECD (2007), Financial Markets Trends, vol. 92. 7 We assume fixed income arbitrage, convertible arbitrage and global macro to be the most aggressive and have a weighted average leverage of 4:1 (see Figure 2 from FSA, U.K. for reference).

8
borrowed from PBs—see Annex 2 for details.8 Note, managed futures strategy is via cash that goes to an exchange like CME (Chicago Mercantile Exchange), and thus not a collateral/leverage based strategy; also Emerging Markets strategies do not generally require leverage. Thus, the total collateral from HFs that came to the large dealers is estimated to have been about $1.6 trillion as of end-2007, with $750 billion to have come via repo-financing and $850 billion from direct borrowing/leverage in lieu of collateral posted to the PB. (ii) Securities Lending—another primary source of collateral: Securities lending provides collateralized short term funding, just like repo.9 Furthermore, with respect to legal rights, securities lending is effectively identical to repo; for example both transactions include full transfer of title. The asset management complex is a rich “source” for collateral deposits. The securities they hold are continuously re-invested to maximize returns over their maturity tenor. We distinguish between primary sources of securities lending rather than the total securities currently on loan.
8 We are cognizant of the fact that prior to Lehman (i.e. for end-2007), HFs were more relaxed about their PB agreements and may have even allowed unlimited use of their collateral in the U.K. However, rehypothecation is limited in the U.S. due to Reg T and SEC’s 15c3. The basic arithmetic for our estimate is as follows: for U.K., via FSA HF surveys, $250 billion base margin + $250 billion excess margin. (see Charts 13 and 14 of FSA survey www.fsa.gov.u.k./pubs/other/hedge_fund_report_july2011.pdf). We calculate $350 billion from U.S. equity long/short and similar funds (especially quantitative/statistical arbitrage HFs like AQR) to give a total of $850 billion from PB borrowing—see Annex 2 for details on this calculation. 9 The reason a party borrows a security in a securities lending transaction is to cover a short position. This differs from a repo transaction where the motivation is generally to borrow or lend cash. In a repo there is an outright sale of the securities accompanied by a specific price and date at which the securities will be bought back. On the other hand, securities lending transactions generally have no set end date and no set price. The beneficial owner can recall the shares on loan at any time and the borrower can return the shares at any time. Thus, securities lending transactions are much more flexible than repos and thus are better conducive in covering shorts where the position's profitability relies on exact timing/tenor matching.

9
Box 1. Pledged Collateral that can be Re-used vs. Rehypothecation
This box spells out the distinction (albeit legal) since previous work by Shin (2009, unpublished technical note) refers ‘loosely’ to rehypothecation as chains stemming from repo agreements due to repledging collateral. Singh and Aitken (2010) allude to rehypothecation more generally, and not in the strict narrow definition that is legally precise. Under a pledged collateral agreement, the collateral recipient, or the “pledgee”, does not have explicit rights of re-use or rehypothecation in the pledge agreement. The pledgee will not be able to seize or use that pledged collateral for his own purposes unless the “pledgor” defaults on his obligation to the pledgee, triggering enforcement. In cases where a pledgor, or collateral provider, grants a pledgee rights of rehypothecation over pledged collateral and if the pledgee has exercised this right prior to insolvency, the pledgor’s legal rights are as if he had transferred title in the property to the pledgee. The pledgor’s legal remedies against an insolvent pledge are, in practice, extremely limited.
Although the terms “rehypothecation” and “pledged collateral that can be re-used” are often used interchangeably, each has a specific meaning and connotes something slightly different. “Rehypothecation” means the use of financial collateral by a collateral taker as security for his own obligations to some third party (i.e. onward pledging). Re-use is broader in scope, encompassing not only re-pledging but also any use of the collateral compatible with ownership of the property (such as selling or lending it to a third party). Rights of re-use are thus inherent in title transfer financial collateral arrangements (because ownership of the property actually changes) whereas under a pledge, the collateral taker will only enjoy rights of rehypothecation if the parties have expressly agreed to this in their written pledge agreement.
Under a title transfer arrangement the collateral provider transfers ownership of collateral to the collateral taker. The latter acquires full title to the collateral received and, as the new owner of this property, is completely free to deal with it as he sees fit. In return the parties agree that once the collateral provider has discharged his financial obligation to the collateral taker, the collateral taker will return equivalent collateral to the collateral provider. Note that the obligation is to return equivalent collateral (i.e. securities of the same type in fair market value terms, but not the original security). After rehypothecation has occurred it would be impossible for a collateral taker to return exactly the same property initially received as collateral. It is standard practice to use title transfer in repo and securities lending activities. The OTC derivatives contracts under English Law form of ISDA also uses title transfer in collateral support agreements (CSA).
The prevalence of rehypothecation outside the U.S. allows for a market clearing price for financial collateral in Europe (i.e., U.K. and continental Europe), in which rights of re-use have a strong legal underpinning. Indeed, the E.U. legal framework for financial collateral is flexible enough to accommodate the preferences of the most prudent and risk-averse clients and counterparties. Whether or not sophisticated market participants strike bargains that offer them appropriate protection is a matter for them alone to decide. In many cases, the U.K. entities provide the same restrictions as in the U.S. especially if these are specifically set out in the prime-brokerage (PB) agreement.

10
Box 2: Accounting for pledged collateral in U.S. and non-U.S. jurisdictions Non-U.S. example: Prime Broker (PB) makes a margin loan to HF of £100. Takes as pledge equities worth £140 from HF. PB pledges those equities to a custodial securities lender against a borrowing of U.S. Treasuries worth £133 (5% haircut). PB repos the £133 U.S.Treasuries to a money market fund to raise £129 (3% margin). Consolidated balance sheet looks like this:
Non-U.S. Balance Sheet Assets Liabilities
Cash 29Securities Sold under Repo Agreement 129
Receivables 100
Footnotes: Fair value of collateral received that can be pledged and re-used is £273 U.S. example The example above cannot be fully replicated due to the Reg T and 15c(3) lock-up rules in the U.S. Thus, even if there is a debit balance as per this example, the credit balance of the PB needs to be offset first, before collateral can be re-used. So the other legs of above example (i.e., pledging equities to securities lender and then repo-ing to a money market fund, cannot take place in the U.S.). Thus, due to this ‘net’ lock up between debit and credit balances, rehypothecation and collateral re-use is dampened in the US. Rehypothecation is mostly a non-US phenomenon where collateral re-use is not subject to regulatory constraints
U.S. Balance Sheet Assets Liabilities
Receivables Cash 100 Customer Payable 100
Footnotes: Fair value of collateral received that can be pledged and reused will depend on the credit balance of the PB. Debt balance of ($100) needs to be offset with the overall credit balance of the PB before any pledged collateral can be re-used.

11
We use Risk Management Association (RMA) as the main data source (see Table 2), which includes only primary sources of securities lending from clients such as pension funds, insurers, official sector accounts and some corporate/money funds. RMA’s data includes the largest custodians such as BoNY, State Street, JPMorgan etc. A recent paper by Bank of England’s Quarterly (September, 2011) states that about $ 2 trillion of securities were on loan but includes secondary holdings also (i.e., also counts the bank to bank holdings of primary sources).10 Due to the flexible nature of securities lending, general practice in the U.S. requires the lender to reinvest the cash collateral in very liquid money-market instruments, thereby earning something close to Fed funds. The driver for this practice is that securities lenders mark to market, change rates, and lend/return shares daily. European markets differ from U.S. markets in that they usually hold bonds or equities as securities for collateral (instead of cash).
Table 2: Securities Lending, 2007-2010 ______________________________________________________________________
Collateral Received from Pension Funds, Insurers, Official Accounts etc. (US dollar, billions)
2007 2008 2009 2010
Securities Lending vs. Cash Collateral
1,209 935
875
818 Securities Lending vs. Non-Cash Collateral
486 251
270
301
Total Securities Lending
1,695 1,187
1,146
1,119 source: RMA
(iii) Bank-Dealer Collateral: Dealers occasionally receive requests from commercial banks, like Rabobank, for collateral swaps. In such a transaction, typically the collateral posted by the commercial bank may need an ‘upgrade’. Discussions with dealers suggest that such requests are generally minimal and thus insignificant relative to the collateral flows from the key clients (hedge funds, pension funds, insurers, official accounts etc.). We acknowledge such flows in Figures 1 and 4 with a de minimis, but do not consider these flows to impact the arithmetic of the results of our paper (i.e., the velocity of pledged collateral). We also considered other sources of collateral. Box 3 explains why there are not material since we only considered collateral that has no legal constraints on re-use.
10 Data Explorers shows larger numbers as they include a significant part of the secondary market activity also.

12
Box 3. Are There Any Other Buckets That Are Sources Of Pledged Collateral?
Dealer to Dealer Collateral
Dealers would generally prefer not to use their balance sheet when moving collateral for their clients. Typically, collateral coming in via reverse repos (i.e., lending to clients) exceeds the collateral leaving the dealers via repos (i.e., borrowing from clients). Discussions with the funding/collateral desk of the large dealers suggest that there may be times when such dealers may want to use their own balance sheet and diversify their sources of funding (i.e., the cost of repo may be less than another type of funding). 1/ The repo business straddles two aspects: (i) a matched book (i.e., via reverse repo) to provide funding to clients, and (ii) financing of the bank. We focus on the client aspect and the associated churning of this primary source of collateral. Although the collateral desk is supposed to be ‘self funding’, dealers may have to ‘dip’ into their balance sheet when collateral going out exceeds collateral coming in; but such requests are scrutinized by the dealer’s Treasury and generally do not exceed $5-10 billion per large dealer. Thus, if there are 10 dealers active in the collateral space, they may have $50-$100 billion of balance sheet funding that does not really leave the rectangle in Figures 1 and 4, but this provides the lubrication to iron out any asymmetries between clients’ collateral flows to the dealers (in a theoretical sense, one can assume the dealers’ own collateral funded by their balance sheet to have an infinite churning factor, as it does not leave the rectangle). However, to put this in perspective, the figure of $50-100 billion is only ½-1% of the total collateral that churns between the dealers (about $10 trillion). Tri-party Repo Collateral Market and Rehypothecation
The tri-party repo market is a primary source of funding for banks in the U.S., standing at $1.6 trillion (July, 2011), according to statistics New York Fed. 2/ It provides banks with cash on a secured basis, with the collateral being posted to lenders – like money-market funds – through one of two clearing banks, BNY Mellon and JP Morgan. The collateral pledged by dealers towards the repo is discounted by the lender, and protects the lender against a change in its value. However, such pledged collateral sits with custodians and is not rehypothecable to the street. The collateral is segregated and identifiable in case of default of the collateral provider. This reduces the risk of the cash investor (Copeland, Martin and Walker, 2009). This also explains that haircuts during the 2008 crisis were minimal when dealing within the tri-party system, relative to the ‘street’ where clients were re-negotiating collateral terms with their dealers. Dealers in collateral management generally differentiate between the tri-party type of collateral and client collateral which has unlimited re-pledging rights. Aside from tri-party repo, there are open market operations trades involving collateral between dealers and NY Fed; we do not consider these ‘restricted’ collateral trades. Also, the European triparty repo market has recently seen sizable growth and stands at € 1.1 trillion between the four tri-party agents Euroclear, Clearstream, BNY Mellon and JP Morgan, largely due to recent credit concerns and U.S. multinationals keeping money oversees. Securitization Vehicles
ABCP-funded vehicles (such as SIVs and conduits) did not rely on dealers for funding. Since these structures were securitization-based and against specific pieces of collateral, it was difficult to raise funds by pledging collateral from such vehicles. Unlike hedge funds, the above vehicles sourced their funding directly, by issuing liabilities to institutional cash pools such as corporate treasurers, securities lenders or money funds. Some SIVs for example had dedicated treasury functions that were responsible to raise funds from cash investors. Also those that relied on intermediaries for treasury functions did not get their funding from intermediaries, but from cash investors. Thus, we do not consider collateral related to such flows to be ‘source’ collateral that is churned by the dealers. _____________ 1/ Recent signs in European banks show that proprietary collateral is being used to lend to clients (UBS Investment Research, “A deep dive into the funding mix,” Sept 6, 2011). 2/ Lenders and dealers agree bilaterally on what baskets of securities they will trade. This collateral cannot be re-pledged to the ‘street’. However, it is not frozen in place, in that substitutions of collateral are possible during the repo. For example, a dealer can pull some agencies out of a "live" repo, pledge or sell them, after substituting in some treasuries. So, churning due to re-pledging is restricted to the rectangle shown in Figure 1.

13
B. Methodology for Calculating the Velocity of Pledged Collateral (end-2007)
Our understanding is that there are 10-14 large banks active in collateral management globally. We may have missed a couple of banks but believe we have picked up over 90% plus of the pledged collateral that is received from primary sources such as hedge funds, pension funds and insurers, and official accounts. We illustrate the amounts received in Figure 3 below. We then take the total collateral received as of end-2007 (almost $10 trillion) and compare it to the primary sources of collateral (the two primary source buckets identified in Figure 1, namely HFs and Security lenders on behalf of pension, insurers, official accounts etc.). The ratio of the total collateral received/primary sources of collateral, is the velocity of collateral due to the intermediation by the dealers. $ 10 trillion Velocity of collateral = ____________ or about 3 $ 3.3 trillion
III. HOW HAVE THE SOURCES OF COLLATERAL CHANGED RECENTLY (END-2010 DATA)
Hedge Fund AUM as of end-2010 stood at $1.7 trillion, lower than in 2007 but higher than the nadir they reached in early 2009 ($1.4 trillion).11 With a consensus estimate of global HF leverage of 1.75, as explained above, the mark-to-market collateral with HFs was about $3 trillion ($1.7 trillion x 1.75). Using Table 1, repo funding by HFs was 32% of $3 trillion or about $750 billion (after adjusting for the initial AUM in that 32%). Funding via PB borrowing has dropped because ‘excess’ collateral is now either segregated or in custody accounts (see Annex 3 for the changes being adopted between HFs and their PBs, especially in the U.K.). We calculate PB-related funding to be $600 billion that is derived from two sources: based on the FSA’s HF survey, we estimate $400 billion, and another $200 billion from the U.S., as calculated in Annex 2.12 Thus, total HF-related collateral to dealers is $750 billion from repo funding and $600 billion from PB borrowing, or a total of $1.35 trillion as shown in Figure 4. 11 Source: HFR, Barclays Hedge and CS HedgeIndex (consensus when all available). 12 FSA HF survey shows average margin at 37% of LMV, and using Charts 13 and 14, and Chart 3 from www.fsa.gov.U.K./pubs/other/hedge_fund_report_july2011.pdf, we estimate the base margin to be $300 billion. We assume excess collateral that be can be repledged to be lower than in 2007 as large hedge funds that take leverage negotiate their PB agreements towards 140% of the base margin (in line with U.S. standards); thus the estimate for excess collateral is about $100 billion. We estimate $200 billion of PB borrowing in the U.S. due to a substantial decline in the quantitative long/short positions and leverage in general (and of course the usual Reg T and Sec 15c3 constraints) --see Annex 2 for calculations. Thus, total PB borrowings would be $600 billion.

14
Figure 3: Pledged Collateral that can be Re-used with Large European and U.S. Banks
Source: 10K reports and equivalent financial statements of the banks listed, (and discussions with the corporate treasury, if needed). Also see Singh and Aitken (2010).
0
200
400
600
800
1000
1200
1400
Soc Generale
BNP Paribas
Deutsche Bank
Credit Suisse
UBS Barclays RBS HSBC Nomura
2007 2008 2009 2010
Pledged Collateral--European Banks (plus Nomura)
0
200
400
600
800
1000
1200
Bear Stearns Lehman Morgan Stanley
Goldman Sachs
Merrill/BoA JP Morgan Citgroup
Pledged Collateral--US Banksin USD billion
Nov-07 Nov-08 Sep-09 Dec-09 Dec-10
0
1000
2000
3000
4000
5000
6000
European Banks US Banks
2007 2008 2009 2010
Pledged Collateral - - Total, European Banks + Nomura and American Banks,in USD billion

15
For the securities lending bucket, we again defer to RMA data (as shown in Table 2) for end-2010 securities lending at $1.1 trillion. So total collateral from primary sources that could be re-pledged by the large dealers was $1.35 trillion (with hedge funds) plus $1.1 trillion via security lending operations of custodians on behalf of pension funds, insurers, and official sector accounts, for a total of $2.45 trillion. The total collateral received by the 14 large dealers was $5.8 trillion as of end-2010 (still sharply lower than the $10 trillion peak as of end-2007, but bouncing back from the trough of $5.0 trillion as of end-2009).
Figure 4: Pledged Collateral, 2010—Typical Sources and Uses
Red curve lines = “users” Black straight lines = “suppliers”
Following the methodology shown in Section II, we have Velocity of collateral = $5.8 trillion ____________ or approx 2.4 $2.45 trillion As shown in Annex 1, the decline in the debt capacity of the financial system, due to an adverse shock that takes us say from state to stems from two factors: (1) haircuts on collateral assets due to a fall in asset/collateral prices and (2) deleveraging due to lower leverage multiplier of the financial system that stems from the length of ‘pledged collateral chains’. An intuitive explanation of Annex 1 is that the first term is the change in prices of
'
$ 1.3 trillion
$ 1.1 trillion
de minimis
Central Collateral Desk
US $ 5.8 trillion
(iii) Commercial Banks
(ii) Securities Lending (via Custodians representing sovereigns/official accounts, pension, insurers asset managers, ETF funds etc.)
(i) Hedge Funds
Money Market Funds (prime, government etc)

16
collateral (or change in y) times leverage from chains, (M), and the second term is the decreased length of the chains (i.e., change in M) times the collateral prices, y.
( ( ) ( ')) ( ) ( ') ( ( ) ( '))
collateral squeeze margin spiral
y y M y M M
The decline in debt capacity of the financial system due to the ‘price decline’ via haircuts has been studied extensively (as referred to in the Introduction of this paper). The ‘margin spiral’ term above incorporates the effect from the shortening in ‘re-pledging chain’ that accompanies the deleveraging in the financial system. The margin spiral term could be significantly larger than the collateral squeeze term. There could be further deleveraging since there is likely to be a feedback effect from shortening chains (change in M) to larger haircuts (change in y). This paper shows that post-Lehman such chains are now shorter. The empirical evidence suggests that the chains were longer pre-Lehman around 3 as of end-2007, and have now decreased to about 2.4 as of end-2010. Intuitively, this means that collateral from a primary source takes ‘fewer steps’ to reach the ultimate client. This results from reduced supply of collateral from the primary source clients due to counterparty risk of the dealers, and the demand for higher quality collateral by the ultimate clients.
IV. COLLATERAL VELOCITY AND MONETARY POLICY
Large dealers are incredibly adept at moving collateral they receive that is pledged for re-use. The “velocity of collateral”—analogous to the concept of the “velocity of money”—indicates the liquidity impact of collateral. A security that is owned by an economic agent and can be pledged as re-usable collateral leads to chains. Thus, a shortage of acceptable collateral would have a negative cascading impact on lending similar to the impact on the money supply of a reduction in the monetary base. Thus the first round impact on the real economy would be from the reduction in the “primary source” collateral pools in the asset management complex (hedge funds, pension and insurers etc), due to averseness from counterparty risk etc. The second round impact is from shorter “chains”—from constraining the collateral moves, and higher cost of capital resulting from decrease in global financial lubrication. In the U.S. and Europe, both the Fed and ECB consider many information variables when determining monetary policy. The monetary base or M2 is an integral part of the “orthodox” monetary tool-kit where the velocity of money is considered as either constant or stable.13 The ECB still uses this metric and both the U.K. and ECB also publish the M3 measure.14 After
13 Ricks (2011) makes a legal distinction between fiat money and money-like other instruments that function like money. He also argues that financial markets may be better off establishing money creation as a public-private partnership (in line with what we observe in financial markets). 14 Others such as Gorton and Metrick (2010) have said that “repos are considered part of the money supply.” When M3 was published (prior to March 2006), only repos transactions between the primary dealers and the Fed were included in this metric.14 Thus the extent of repo involved in M3 would have been on the lines of the above discussion on tri-party repo where collateral cannot be re-pledged beyond the privileged club of members.
17
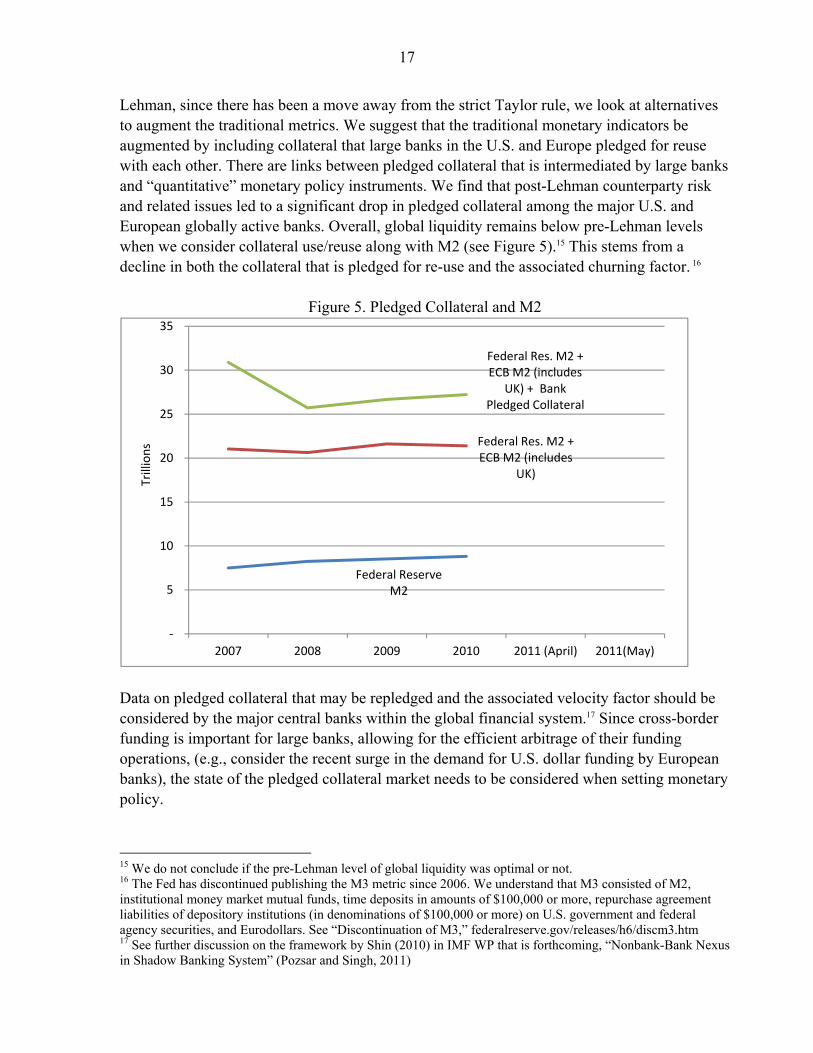
Lehman, since there has been a move away from the strict Taylor rule, we look at alternatives to augment the traditional metrics. We suggest that the traditional monetary indicators be augmented by including collateral that large banks in the U.S. and Europe pledged for reuse with each other. There are links between pledged collateral that is intermediated by large banks and “quantitative” monetary policy instruments. We find that post-Lehman counterparty risk and related issues led to a significant drop in pledged collateral among the major U.S. and European globally active banks. Overall, global liquidity remains below pre-Lehman levels when we consider collateral use/reuse along with M2 (see Figure 5).15 This stems from a decline in both the collateral that is pledged for re-use and the associated churning factor. 16
Figure 5. Pledged Collateral and M2
Data on pledged collateral that may be repledged and the associated velocity factor should be considered by the major central banks within the global financial system.17 Since cross-border funding is important for large banks, allowing for the efficient arbitrage of their funding operations, (e.g., consider the recent surge in the demand for U.S. dollar funding by European banks), the state of the pledged collateral market needs to be considered when setting monetary policy.
15 We do not conclude if the pre-Lehman level of global liquidity was optimal or not. 16 The Fed has discontinued publishing the M3 metric since 2006. We understand that M3 consisted of M2, institutional money market mutual funds, time deposits in amounts of $100,000 or more, repurchase agreement liabilities of depository institutions (in denominations of $100,000 or more) on U.S. government and federal agency securities, and Eurodollars. See “Discontinuation of M3,” federalreserve.gov/releases/h6/discm3.htm 17 See further discussion on the framework by Shin (2010) in IMF WP that is forthcoming, “Nonbank-Bank Nexus in Shadow Banking System” (Pozsar and Singh, 2011)
Federal Reserve M2
Federal Res. M2 + ECB M2 (includes
UK)
Federal Res. M2 + ECB M2 (includes
UK) + Bank Pledged Collateral
-
5
10
15
20
25
30
35
2007 2008 2009 2010 2011 (April) 2011(May)
Trill
ion
s

18
V. POLICY ISSUES
The findings above suggest the following policy issues in assessing systemic risks, which may not be captured fully since financial stability assessments typically, do not include pledged collateral, or the associated reuse of such assets. Many of the recent regulations have focused on building equity and reducing leverage
at large banks. The elasticity of the “nonbank/bank funding” is also an important component that should be considered (Shin 2010; Borio and Disyatat, 2011).
The decline in the overall availability of collateral is sizable and roughly $4-5 trillion since pre-Lehman days (i.e., reduced ‘source’ collateral times velocity of collateral). Increase in M2 due to quantitative easing (QE) may not substitute for loss in financial collateral.18
The size (including the length of chains) of the nonbank funding relative to the size of securities lending, repo, and related markets provides a gauge to the potential dislocation that may result from the unwinding of such funding.
Recent regulatory efforts will require significant collateral on many fronts—Basel’s liquidity ratios, EU Solvency II and CRD IV, and moving OTC derivatives to CCPs. Unless there is a rebound in the pledgeable collateral market, the likely asymmetry in the demand and supply in this market may entail some difficult choices for the markets and the regulators.19
Looking forward, some areas of growth that may revive the collateral churning include the demand from clients to upgrade their collateral for posting to CCPs (in the context of the regulatory thrust of moving OTC derivatives to CCPs). The demand for collateral swaps has also been on the rise recently due to insurers, pension funds and the ETF industry.20
18 The increased monetary stimulus from January-Aug, 2011 (not captured in Figure 5) has been above $1.6 trillion (i.e., change in Fed and ECB M2 figures) 19 Markets may create cottage industries for upgrade collateral to meet regulatory needs, which may not all be transparent. Also regulators may, due to collateral constraints, see some facets of financial industry shrink. Alternately, it is also possible that regulatory efforts may have to prioritize proposals to bridge the collateral shortfall. 20 Bank of England Quarterly, June 2011. Also Singh (2010, 2011) suggests sizable collateral needs in the OTC derivatives market may require $2 trillion in collateral to be posted to the CCPs provided the regulatory efforts succeed in moving a significant share of OTC derivatives to CCPs.

19
Annex 1. Deleveraging Components—Collateral Squeeze and Margin Spiral The purpose of this annex is to provide a mathematical framework to discuss the buildup of leverage on the balance sheet of financial institutions. The mathematical model described below was developed by Shin (unpublished technical note, 2009) and shows how the unwinding of systemic leverage can be separated into two components, i.e. collateral squeeze and margin spiral. This paper use the model to empirically show that post-Lehman the second term encompasses shorter re-pledging chains.
ix market value of bank i’s total liabilities
iy market value of bank i’s assets that can be pledged as collateral
ie market value of bank i’s equity
ia market value of bank i’s assets
ji proportion of j’s liabilities held by i
i
ii a
ed 1 is the ratio of debt to total assets
Noting that the total assets of bank i are given by
jjijii xya and from a simple
accounting identity, it follows that the total debt can be computed by multiplying the totals assets with the leverage ratio:
jjijiii xydx
Let nxxx 1 , nyyy 1 , and ndddiag ,1 and rewriting the previous equation
in vector form: xyx
Solving for x and using Taylor series expansion,
1
2 3
x y I
y I
21
The matrix is given by
21 Note that the sum of the elements of the rows of is always strictly less than 1. This means that the infinite Taylor series converges and hence, I has a well-defined inverse.
20
0
0
0
2211
2211
1122
nn
nn
nn
dd
dd
dd
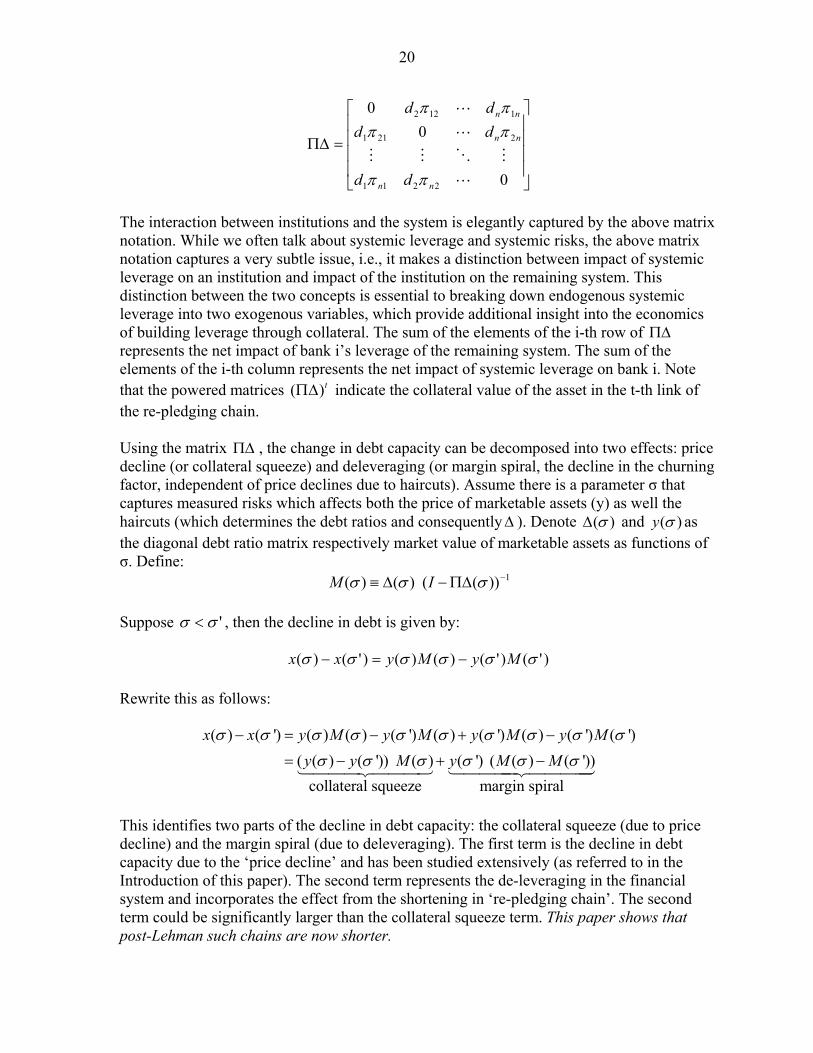
The interaction between institutions and the system is elegantly captured by the above matrix notation. While we often talk about systemic leverage and systemic risks, the above matrix notation captures a very subtle issue, i.e., it makes a distinction between impact of systemic leverage on an institution and impact of the institution on the remaining system. This distinction between the two concepts is essential to breaking down endogenous systemic leverage into two exogenous variables, which provide additional insight into the economics of building leverage through collateral. The sum of the elements of the i-th row of represents the net impact of bank i’s leverage of the remaining system. The sum of the elements of the i-th column represents the net impact of systemic leverage on bank i. Note that the powered matrices ( )t indicate the collateral value of the asset in the t-th link of the re-pledging chain. Using the matrix , the change in debt capacity can be decomposed into two effects: price decline (or collateral squeeze) and deleveraging (or margin spiral, the decline in the churning factor, independent of price declines due to haircuts). Assume there is a parameter σ that captures measured risks which affects both the price of marketable assets (y) as well the haircuts (which determines the debt ratios and consequently ). Denote )( and )(y as the diagonal debt ratio matrix respectively market value of marketable assets as functions of σ. Define:
1))(()()( IM
Suppose ' , then the decline in debt is given by:
)'()'()()()'()( MyMyxx
Rewrite this as follows:
( ) ( ') ( ) ( ) ( ') ( ) ( ') ( ) ( ') ( ')
( ( ) ( ')) ( ) ( ') ( ( ) ( '))
collateral squeeze margin spiral
x x y M y M y M y M
y y M y M M
This identifies two parts of the decline in debt capacity: the collateral squeeze (due to price decline) and the margin spiral (due to deleveraging). The first term is the decline in debt capacity due to the ‘price decline’ and has been studied extensively (as referred to in the Introduction of this paper). The second term represents the de-leveraging in the financial system and incorporates the effect from the shortening in ‘re-pledging chain’. The second term could be significantly larger than the collateral squeeze term. This paper shows that post-Lehman such chains are now shorter.

21
Annex 2. Hedge Fund Borrowing from Prime Brokers in the U.S. Hedge Funds (HF) largely finance their positions by either (i) pledging collateral to the prime brokers (PB) to borrow money, and/or (ii) repurchase agreements with either their PB or another dealer where the repo their collateral for funding. This Annex looks at the first type of financing and estimates the HF borrowings from PBs in the U.S. as of end-2007 and end-2010. As shown in Table 1 of the paper, HFs generally borrows from PBs for equity long/short and event driven strategies. The share of these 2 strategies in the mark-to-market value of collateral was 50% as of end-2007 (of which event driven was 28%) and 46% as of end-2010 (of which event driven was 25%). Event driven strategies are usually of two types: credit/distressed and merger arbitrage that are equally split; only merger arbitrage uses PB funding since credit/distressed strategies do not employ leverage. So for PB borrowing, we reduce the share of equity long/short and event driven strategies to 22%+14% or 36% for end-2007 and 21%+12% or 33% for end-2010. Mark-to-mark value of collateral has been defined in the paper to equate AUM times gross leverage (approximates NAV or net asset value of a HF). This is the sum of LMV (long market value) positions and the absolute value of SMV (short market value) positions. The figure below gives the delta bias on the left axis. Delta bias captures the ratio of LMV/SMV. Arithmetically, delta bias equals (total LMV/total SMV) minus 1. This ratio is a very useful indicator to gauge PB borrowing for HF’s equity long/short strategies. For end-2010, the delta bias was about 50% which means LMV/SMV ratio of 150/100 or 3:2. Delta bias figures were not produced as of end-2007 but market conditions were similar to end-2010 (e.g., AUM and gross leverage levels). We thus use similar delta bias figure for end-2007. With mark-to-market value of HF collateral at $4 trillion and a 36% share of relevant strategies, and adjusting for long/short ratio, the borrowing from PB was about 4 trillion x 0.36 x 3/5 or about $850 billion. We deduct the PB borrowing estimate via FSA (U.K.) hedge fund survey of $500 billion as explained in the paper to get PB borrowing in the U.S. of $350 billion for end-2007. Similar calculation for end-2010, gives PB borrowing in the U.S. at $200 billion (3 trillion x 0.33 x 3/5 or about $600 billion, minus FSA HF margin survey figure of $ 400 billion). Note, that Regulation T in the U.S. caps leverage; so strategies with high leverage are preferred to be booked off-shore.
Source: Credit Suisse

22
Annex 3: Collateral Rehypothecation and Collateral Custody
The annex highlights recent moves by hedge funds to segregate collateral from their prime brokers. We show that custody via a third party is akin to silo-ing of the excess collateral and thus reduces the churning/velocity. However, keeping the collateral with a prime-broker’s holding company in a separate legal entity allows hedge funds to bargain a more attractive PB fee in lieu of the re-use of the collateral by the holding company (and not the PB unit). The difference in the PB fees between secured funding (where the PB retains the HF collateral) and unsecured funding can be sizable. PB fee could be zero or as low as Libor + 50 basis points if excess collateral is allowed to stay within the dealer’s umbrella organization such as Goldman Sachs (but in a segregated entity under the Goldman Sachs Group Holding Company). This compares favorably to Libor + 250 basis points if the HF opts to keep the excess collateral with a third party custodian like BoNY—see figure for an illustration.22 A dealer can re-use/churn the collateral that stays in its segregated account for securities lending or repo activities that provide an attractive yield; if the collateral moves to a third party custodian such as BoNY (where it is in a silo) it will not churn. Many small and medium sized HFs would rather show returns, net of fee, to be 2 percentage points higher (i.e., LIBOR +250 bps vs. LIBOR + 50 bps) rather than take the extra step of placing excess collateral with a third party custodian which will cost them the higher PB fee.23
Large Bank’s use of Hedge Fund’s Collateral
22 Note that the 'segregated' structure (i.e., excess collateral that stays with the GS Group) has not been legally tested. 23 To illustrate, assume two hedge funds both showing annual returns on asset they manage for their clients of 8 percent (before PB fee). One of the HF, that allow full rehypothecation of its collateral will pay PB fee of say 0.75 percent, and give its clients annual returns (after PB fee) of 7.25 percent. The second HF that keeps all excess collateral with a third party (i.e. does not give any rehypothecation rights on excess collateral to its PB), and so will give its clients annual returns of 8 percent minus 2.75 percent PB fee, or only 5.25 percent.
Hedge Funds Goldman Sachs
Prime Brokerage Business
The GoldmanSachs Group,
Holding
Margin (or required) collateral
Excess collateral
Hedge Funds
Goldman SachsPrime Brokerage
Business
BONY,Custodian
Margin (or required) collateral
Excess collateral
Goldman Sachs Central Collateral Desk
Excess collateral
Churns
Does not churn

23
References Adrian Tobias, and Hyun S. Shin, 2010, “Liquidity and Leverage,” Journal of Financial
Intermediation, Vol. 19 (July). Ang, Andrew, Sergiy Gorovyy, and Gregory van Inwegan, 2011, “ Hedge Fund Leverage”,
Journal of Financial Economics, Vol. 102, No. 1, pp. 102-26 (October). Bank of England, Quarterly, June, 2011, Developments in the Global Securities Lending
Market. Borio, Claudio, and Piti Disyatat, 2011, “Global Imbalances and the Financial Crisis,” BIS Working Papers No 346 http://www.bis.org/publ/work346.pdf. Brunnermeier, Markus., and Lasse Pedersen, 2009, “Market Liquidity and Funding
Liquidity,” Review of Financial Studies, Vol. 22, pp. 2201–38. Markus K. Brunnermeier & Gary Gorton & Arvind Krishnamurthy, 2011. "Risk
Topography," NBER Chapters, in: NBER Macroeconomics Annual 2011, Vol. 26 National Bureau of Economic Research, Inc.
Copeland, A., A. Martin, and M. Walker, 2010, “The Tri-party Repo Market Before the 2010
Reforms,” Federal Reserve Bank of New York Staff Report No. 477. Financial Services Authority, U.K., “Assessing Possible Sources of Systemic Risk from
Hedge Funds” (various issues). Geanakopolos, John, 2003, “Liquidity, Default and Crashes,” Cowles Foundation Paper
No. 1074. Gorton, Gary, and Andrew Metrick, 2009, “Securitized Banking and the Run on Repo,”
NBER Working Paper No. 15223, August.
–––––, 2010, “Haircuts,” Federal Reserve Bank of St. Louis Review. Krishnamurthy, Arvind, Stefan Nagel, and Dmitry Orlov, 2010, “Sizing up Repo,” Working
Paper, Northwestern and Stanford Universities. Lo, Andrew, Monica Billo, Mila Getmansky, and Loriana Pelizzzon, 2010, “Measuring
Systemic Risk in the Finance and Insurance Sectors,” MIT Sloan School Working Paper No. 4774-10.
McGuire, Patrick, and Kostas Tsatsaronis, 2008, “Estimating Hedge Fund Leverage,” BIS
Working Paper No. 260.

24
Pozsar, Zoltan, and Manmohan Singh, 2011, “Non-Bank-Bank Nexus in the Shadow Banking System,” IMF Working Paper, forthcoming.
Ricks, Morgan 2011, “Regulating Money Creation After The Crisis,” Harvard Law School. Shin, Hyun S., 2009, “Collateral Shortage and Debt Capacity,” Princeton University
(unpublished note). –––––, 2010, “Financial Intermediation and the Post-Crisis Financial System,” BIS Working
Paper No. 304, March. www.bis.org/publ/work304.pdf. Shliefer, Andrei, and Robert Vishny, “Fire Sales in Finance and Macroeconomics,” Journal
of Economic Perspectives, Winter 2011. Singh, Manmohan, 2010, “Collateral, Netting and Systemic Risk in OTC Derivatives
Market,” IMF Working Paper No. 10/99. –––––, 2011, “Making OTC Derivatives Safer—A Fresh Look,” IMF Working Paper
No.11/66. Singh, Manmohan, and James Aitken, 2010, “The Sizable Role of Rehypothecation in the
Shadow Banking System,” IMF Working Paper No. 10/172. UBS Investment Research, 2011, “A Deep Dive into the Funding Mix,” September 6.