Veiling glare in car windshields - DiVA portal
78
MASTER’S THESIS 2009:009 CIV Erik Bertilsson & Erik Svensson Veiling glare in car windshields MASTER OF SCIENCE PROGRAMME Ergonomic Design & Production Engineering Luleå University of Technology Department of Human Work Sciences Division of Industrial Industriell design 2009:009 CIV • ISSN: 1402 - 1617 • ISRN: LTU - EX - - 09/009 - - SE E rik Bertilsso on
Transcript of Veiling glare in car windshields - DiVA portal
MASTER’S THESIS2009:009 CIV
Universitetstryckeriet, Luleå
Erik Bertilsson & Erik Svensson
Veiling glare in car windshields
MASTER OF SCIENCE PROGRAMME Ergonomic Design & Production Engineering
Luleå University of Technology Department of Human Work Sciences Division of Industrial Industriell design
2009:009 CIV • ISSN: 1402 - 1617 • ISRN: LTU - EX - - 09/009 - - SE
VEILING GAFFECT
De
MA
GLARETING FAC
EE
MErgonomic
Luleå Uniepartment o
Lu
ASTE
IN CARCTORS AN
rik Bertilssorik Svensso
Master Thesc Design &
iversity of Tof Human Wuleå2009-02
ER T
R WINDD THEIR
on on
sis Production
TechnologyWork Scien2-04
THES
DSHIELEFFECT
n
nces
SIS
LDS

Preface 1
PREFACE This report is the result of a master thesis project conducted from September 2008 to January
2009 as collaboration between the Department of Human Factors Engineering & Ergonomics
at Volvo Cars Corporation, Gothenburg, Sweden and the Department of Human Work
Sciences at Luleå University of Technology. It comprises 30 university points and is a research
and development project.
Without the invaluable help and patience from Magnus Jerksjö and Pernilla Nurbo, our
mentors at VCC, this would have been a far more difficult task to carry out and we would like
to thank them for their commitment. We also extend our gratitude to Malte Isacsson for all his
help and enthusiasm for our project. Other people at VCC that deserves special thanks are
Tobias Andersson at TDS, Mats Olofsson at surface materials and Sven-Olof Svensson at Pilot
Plant/Advanced Engineering. From the university we have always felt the support from our
mentor Anders Håkansson and we thank him for his much appreciated help.
We would also like to show our gratitude towards all employees at the Department of Human
Factors Engineering & Ergonomics for being supportive and making us feel welcome.
Göteborg, 4 February 2009
Erik Bertilsson Erik Svensson

Preface 2
Abstract 3
ABSTRACT Veiling glare is the phenomenon when the dashboard or parts of the dashboard reflects into the
windshield and creates veiling images. These images are both disturbing and impair the driver’s
vision of the road scene. Cars are today more and more designed to have a "dynamic" expression
with further raked windshields and the designers also wants to have the possibility to use lighter
colors in the interior. This can lead to unwanted consequences in the form of an increased
amount of reflections from the dashboard into the windshield.
The goal with this thesis was to describe a measurable requirement that correlates with
customer expectations together with different positions and angles of the light source,
windshield and dashboard, material attributes of the dashboard and windshield characteristics
like anti-reflective coating. The thesis work was carried out at the department of Human
Factors Engineering and Ergonomics at Volvo Car Corporation, Gothenburg.
There is an existing requirement that restrict the gloss and lightness of the instrument panel top
surface. This requirement is valid at the specular sun angle (geometric relationship which creates
a direct reflection from the light source into the driver’s eyes), which gives the gloss a much
larger effect in the requirement compared to lightness. Volvo Cars has realized through own
observations, that instrument top panel lightness plays an important role in the experience of
veiling glare, particularly at high sun angles. Therefore Volvo Cars has created a complementing
requirement that express a maximum lightness value based on a linear relationship tied to the
windscreen angle. The problem is that it doesn't exist any linear relationships when the
phenomenon veiling glare is examined further.
In a laboratory environment a measuring method was developed to research the affecting factors
of veiling glare at high sun angles. This work has been done through the use of several quality
tools as Design of Experiment and Binary Logistic Regression. A subjective survey was
performed to determine the customer acceptance for veiling glare at for different road scenes.
The result from these studies was then combined to express maximum lightness value tied to
geometrical properties between the windshield and the dashboard.
The result was presented in a Microsoft Excel document in where it is possible to insert values
for windscreen angle, instrument panel angle, lightness value of instrument top panel and if an
anti-reflective coated windscreen is used. The computer model then calculates the resulting
reflecting luminance, maximum allowable lightness and acceptance levels in the four different
road scenes. This document is supposed to replace the previously mentioned complementing
requirement.

Abstract 4
Sammanfattning 5
SAMMANFATTNING Veiling glare är fenomenet när delar av eller hela instrumentpanelen reflekterar upp i vindrutan
och skapar beslöjande speglingar. Dessa reflektioner är både irriterande och försämrar förarens
sikt. Dagens bilar är designade för att ha ett mer "dynamiskt" uttryck med mer lutande
vindrutor och designers vill också ha möjligheten att använda ljusare färger på interiören. Detta
kan leda till oönskade konsekvenser i form av en ökning av spegelreflexer i vindrutan.
Målsättningen med detta examensarbete var att ta fram en acceptansgräns för veiling glare som
korrelerar med kundförväntningar vid olika positioner och vinklar på ljuskälla, vindruta och
instrumentpanel, materialegenskaper hos instrumentpanelen och egenskaper hos vindrutan.
Examensarbetet utfördes på ergonomiavdelningen på Volvo Personvagnar i Göteborg.
Det finns en befintlig kravsättning som begränsar bland annat glansen och ljusheten på
instrumentpanelens toppyta. På grund av att denna kravsättning togs fram vid den så kallade
spekulära solvinkeln (geometriskt samband som skapar direktreflexer från ljuskällan in i förarens
ögon) fick glansen en mycket större påverkan i kravsättningen än vad ljusheten fick. Volvo PV
har senare, genom egna observationer, insett att ljusheten spelar en minst lika stor roll, speciellt
vid höga solvinklar. Därför har Volvo PV själva tagit fram en komplimenterande kravsättning
som begränsar ljusheten genom ett linjärt samband knutit till vindrutevinkeln. Problemet är att
det i verkligheten inte finns några linjära samband hos fenomenet veiling glare.
I laboratoriemiljö har en mätmetod utvecklats och undersökningar har genomförts över vilka
faktorer som påverkar, och i vilken grad dessa faktorer påverkar, mängden veiling glare i
vindrutan vid höga solvinklar. Detta arbete har gjorts genom användande av ett flertal
kvalitetsverktygs såsom försöksplanering och binär logistisk regressionsanalys. Det genomfördes
även en subjektiv utvärdering för att definiera kundernas acceptansnivåer för veiling glare vid
fyra olika vägsituationer. Resultatet från dessa undersökningar kunde kombineras för att
uttrycka krav för ljusheten på instrumentpanelen toppyta knutet till geometriska egenskaper hos
vindrutan och instrumentpanelen.
Resultatet presenteras genom ett "Microsoft Excel"-dokument där det går att fylla i värden för
vindrutevinkel, instrumentpanelvinkel, ljushet på instrumentpanelen och om det används en
antireflexbenhandlad ruta eller inte. Information man får ut är resulterande luminansvärde på
reflexerna, maximalt tillåten ljushet och kunders acceptansnivåer vid de olika vägsituationerna.
Tanken är att detta dokument skall ersätta den tidigare nämnda komplimenterande
Kravsättningen.

Sammanfattning 6

Index 7
INDEX 1 Introduction ........................................................................................................ 9
1.1 Background ................................................................................................. 9
1.2 Purpose ...................................................................................................... 9
1.3 Aim .......................................................................................................... 10
1.4 Delimitations ............................................................................................. 10
1.5 Volvo Car Corporation ............................................................................... 10
1.5.1 The Department of Human Factors Engineering and Ergonomics ............... 11
2 Theory ............................................................................................................. 12
2.1 Light ......................................................................................................... 13
2.1.1 Units and conceptions .......................................................................... 15
2.1.2 Measuring .......................................................................................... 18
2.1.3 Contrast ............................................................................................. 19
2.1.4 Reflection ........................................................................................... 20
2.1.5 Refraction ........................................................................................... 21
2.1.6 Anti-reflective coating........................................................................... 21
2.2 Human Eye ............................................................................................... 23
2.2.1 Visual acuity ....................................................................................... 24
2.2.2 Adaption ............................................................................................ 24
2.2.3 Glare ................................................................................................. 25
2.3 Visual reduction while driving ...................................................................... 25
2.3.1 Veiling glare ....................................................................................... 26
2.3.2 Veiling glare at Ford Motor Company ................................................... 30
3 Method ........................................................................................................... 31
3.1 Project plan ............................................................................................... 31
3.2 Gathering of information ............................................................................ 31
3.2.1 Literature ............................................................................................ 31
3.2.2 Questionnaire ..................................................................................... 31
3.3 Simulator survey ........................................................................................ 31
3.4 Design of Experiment ................................................................................. 32
3.4.1 Factorial design .................................................................................. 32
3.4.2 Response surface design ...................................................................... 34
3.5 MINITAB ................................................................................................... 35
3.6 Metod of limits ........................................................................................... 35
3.7 Measuring devices ..................................................................................... 36
3.7.1 Photometers ........................................................................................ 36

Index 8
3.7.2 Glossmeter ......................................................................................... 38
3.8 Laboratory fixture ....................................................................................... 38
3.8.1 Sun Lamp – Dedolight 400D ................................................................. 39
3.8.2 Light trap ............................................................................................ 40
4 Realization ...................................................................................................... 41
4.1 Project plan ............................................................................................... 41
4.2 Information gathering ................................................................................. 41
4.3 Present situation analysis ............................................................................. 41
4.3.1 Car design of today ............................................................................ 41
4.3.2 Existing delimitations ........................................................................... 42
4.4 Objective testing ........................................................................................ 43
4.4.1 Finding Affecting Factors ...................................................................... 44
4.4.2 Design of Experiment ........................................................................... 47
4.5 Subjective testing ....................................................................................... 49
4.5.1 Binear logistic regression ..................................................................... 51
5 Results ............................................................................................................. 53
5.1 Objective testing ........................................................................................ 53
5.1.1 Design of Experiment ........................................................................... 53
5.1.2 Effect of AR-coating ............................................................................. 55
5.2 Subjective testing ....................................................................................... 56
5.2.1 Binary logistic regression analysis ......................................................... 58
5.3 Setting new requirements ............................................................................ 59
5.3.1 Comparing new and old requirements ................................................... 60
5.4 Veiling glare calculator ............................................................................... 60
5.5 Test method ............................................................................................... 61
6 Discussion........................................................................................................ 62
6.1 Method and workflow ................................................................................ 63
6.2 Objective measurements ............................................................................. 63
6.3 Subjective survey ....................................................................................... 64
6.3.1 Source of errors .................................................................................. 65
6.4 Setting new limitations ................................................................................ 65
6.5 Veiling glare calculator ............................................................................... 66
7 Recommendations ............................................................................................. 67
References .......................................................................................................... 69
Appendix ........................................................................................................... 71

1 Introduction 9
1 INTRODUCTION 1.1 BACKGROUND The problem of veiling glare is getting more and more attention in the car industry. Veiling
glare is the phenomenon when the dashboard or parts of the dashboard reflects into the
windshield and creates veiling images. These images are both disturbing and impair the driver’s
vision of the road scene.
Cars of today are designed to have a more "dynamic" expression with further raked windshields
and the designers also wants to have the opportunity to use lighter colors in the interior. This
can lead to unwanted consequences in the form of an increased amount of reflections from the
dashboard into the windshield.
Most people haven’t reflected about the problem of veiling glare, but as soon as they have heard
about it, they tend to get more aware of the problem.
It's important to know what level of windshield rake, lightness, gloss and shape of the
dashboard is acceptable to secure that the reflections doesn't interfere with the driver. Volvo is
also interested to know what improvements can be made by using windshields with an anti-
reflective coating.
A number of demands to control some of these parameters exist to a certain degree but there are
no considerations of the big picture.
In this report we are handling the problem with veiling glare at high sun angels, investigating
what factors that affects it and how an anti-reflective coating helps to reduce the amount of
glare.
1.2 PURPOSE Describe a measurable requirement that correlates with customer expectations and makes
allowances for different positions and angles of the light source, windshield and dashboard and
the windshields characteristics like anti-reflective (AR) coating. The requirements should also
be expressed with the possibility to define limitations to the dashboard material attributes like
lightness and gloss.

1 Introduction 10
1.3 AIM The aim with this thesis is presented in the following paragraphs:
• Develop a measuring method in laboratory environment and study what factors (and
how these factors) affect the amount of veiling glare in the windscreen at high sun
angles.
• Validate the method with known cases
• Use the developed method together with subjective survey to determine the customer
acceptance for veiling glare
• Develop a new requirement expressed in maximum lightness tied to geometrical
properties between the windshield and the dashboard.
• Compare the newly developed requirement the current one existing. Are there any
differences, if so, why?
1.4 DELIMITATIONS This work has been limited to only investigate veiling glare at high sun angles that appears in
the windshield of the car. The work will not consider different material structures, curvature and
details on the dashboard like split lines and defroster grills.
1.5 VOLVO CAR CORPORATION Volvo Car Corporation (henceforth mentioned as only Volvo) was born on April 14, 1927,
when the first car ÖV 4 "Jacob" rolled of the production line at the factory in Hisingen,
Gothenburg. The name Volvo derives from the Latin "I roll" (www.volvocars.se).
Founded by Assar Gabrielsson and Gustaf Larsson, the company was formed on a background
of quality and safety, which were both of paramount importance. They said; "Cars are driven by
people, thus, the guiding principle of our design work are – and must always be – safety. This
concept lives on in what have become Volvo’s three core values; safety, environment and quality
(ibid).
Today Volvo is an internationally established company with about 18500 employees worldwide
of which about 14500 work in Sweden. They sell almost 400 000 cars every year in over 100
different countries. In the year of 2008, Volvo passed the production mark of 15 million
produced cars (ibid).Volvo Cars' largest market are the USA, followed by Sweden, Germany
and Great Britain (ibid).
Since 1999, Volvo Car Corporation has been 100% owned by Ford Motor Company (ibid).
1 Introduction 11
1.5.1 THE DEPARTMENT OF HUMAN FACTORS ENGINEERING AND ERGONOMICS The department of Human Factors Engineering & Ergonomics is a subdivision of the
department of Concept Development & Geometry at Volvo Car Corporation. Setting
ergonomic requirements and improving the overall ergonomics of the car interior and exterior
are the main tasks of the department.

1 Introduction 12
2 Theory 13
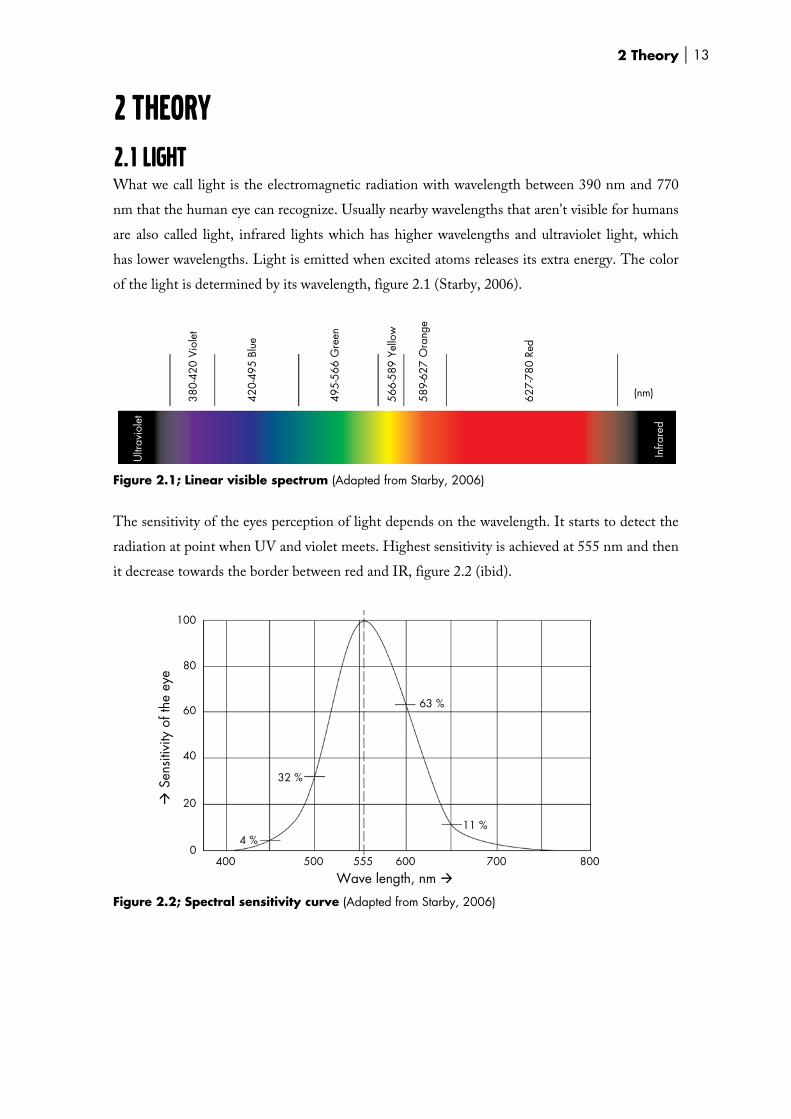
2 THEORY 2.1 LIGHT What we call light is the electromagnetic radiation with wavelength between 390 nm and 770
nm that the human eye can recognize. Usually nearby wavelengths that aren't visible for humans
are also called light, infrared lights which has higher wavelengths and ultraviolet light, which
has lower wavelengths. Light is emitted when excited atoms releases its extra energy. The color
of the light is determined by its wavelength, figure 2.1 (Starby, 2006).
Figure 2.1; Linear visible spectrum (Adapted from Starby, 2006)
The sensitivity of the eyes perception of light depends on the wavelength. It starts to detect the
radiation at point when UV and violet meets. Highest sensitivity is achieved at 555 nm and then
it decrease towards the border between red and IR, figure 2.2 (ibid).
Figure 2.2; Spectral sensitivity curve (Adapted from Starby, 2006)
380-
420
Viol
et
420-
495
Blue
495-
566
Gre
en
566-
589
Yello
w
589-
627
Ora
nge
627-
780
Red
Infra
red
Ultr
avio
let
4 %
32 %
63 %
11 %
0
20
40
60
80
100
400 500 555 600 700 800
Sen
sitiv
ity o
f the
eye
Wave length, nm
(nm)

2 Theory 14
This standardized model is accurate during daylight but at night another model is used, figure
2.3. The highest sensitivity is now changed to 507 nm; many colors are moved towards blue
where red becomes deep red and hard to see (ibid).
Figure 2.3; Spectral sensitivity curves for day and night vision (Adapted from Starby, 2006)
It is important to be aware of that figure 2.3 only shows the eye relative sensitivity between day
and night. The real values shows that the eye is much more sensitive to light during night
vision, figure 2.4(ibid).
Figure 2.4; Actual sensitivity for day and night vision (Adapted from Starby, 2006)
Sen
sitiv
ity o
f the
eye
Wave length, nm
0
20
40
60
80
100
400 500 600 700
507 nm
555 nm
Night vision
Dayvision
lm/W
Wave length, nm
0
500
1000
1500
400 500 600 700
Night vision
Day vision

2 Theory 15
2.1.1 UNITS AND CONCEPTIONS Light and its radiation can be described and measured in two different ways or categories;
radiometric units and photometric units, table 2.1. The first measures the radiation a light
source emits. Photometric units are used to measure the radiation after it has been visually
processed and "transformed" into light. The photometric units depend on which wave length or
color the radiation is emitted by as can be seen in figure 2.2 (Starby, 2006).
Quantity Symbol Unit Quantity Symbol Unit
Radiant flux Φ Watt=joule per second Luminous flux F Lumen=lm
Radiant intensity Ie Watt per steradian Luminous intensity I Candela=cd
Irradiance Ee Watt per m2 Intensity of illumination E
Lux=lumen per m2
Radiance Le Watt per steradian per m2 Luminance L Candela per m2
Table 2.1; Radiometric versus photometric units (Adapted from Starby, 2006)
Luminous flux, F
The flux that is received after the radiation has been visually processed according to the
sensitivity of the eyes is called Luminous flux. It can also be described as the flux that is emitted
by a light source every second. Luminous flux is described as Luminous intensity divided by the
Solid angle (F = I/ω), the unit is lumen, lm (ibid).
Solid angle, ω
A usual plane angle is most often described in amounts of degree. It can also be described as the
ratio between the circular arc an angle cut out from a circle and the circle's radius, figure 2.5.
The unit is then radian.
Figure 2.5; Plain and solid angle (Adapted from Starby, 2006)
b
r
α
r
A ω

2 Theory 16
A solid angle is instead a "three dimensional" angle that can be used to describe the size of a
beam of light. The curve has become a surface area on a sphere and instead of the radius of the
circle we use the sphere's radius squared, figure 2.5. The unit is steradian and solid angle is
defined as ω = A/r2 steradian (ibid).
Luminous intensity, I
The light flow measured for each solid angle unit is called the luminous intensity. One candela
is the luminous intensity in a certain direction from a light source that emits monochromatic
radiation of the frequency 540 x 1012 hertz and the radiant intensity of 1/683 watt per steradian.
With other words the intensity of light source in a certain direction, figure 2.6. Mathematically
it is expressed as I = Ф/ω candela. The frequency 540 x 1012 hertz can answer to the radiation
the eye is most sensitive and therefore corresponds to the wavelength 555 nm (ibid).
Figure 2.6; Luminous intensity, I, the luminous flux in a certain direction (Adapted from Starby, 2006)
Intensity of illumination, E
The light flow that hits a surface per square meter is called intensity of illumination or
illuminance. It is defined as E = Ф/A and the unit is lux but can also be described as lx or lumen
per m2, lm/m2 (ibid).
Luminance, L
Luminance is often called light density and is defined as the light density in a certain direction
and in a point at a light source or illuminated area. Luminance is a measure of how bright a
surface is, expressed in candela per square meter, cd/m2. Still the luminance is a measure that a
photometer registries, how we see it with our eyes depends on many different factors. Therefore
there is a difference between the measurable objective luminance and the experienced subjective
lightness. Mathematically the luminance is described as:
AIL = or
εε
cos×=
AIL cd/m2. (2.1)
ω I
2 Theory 17
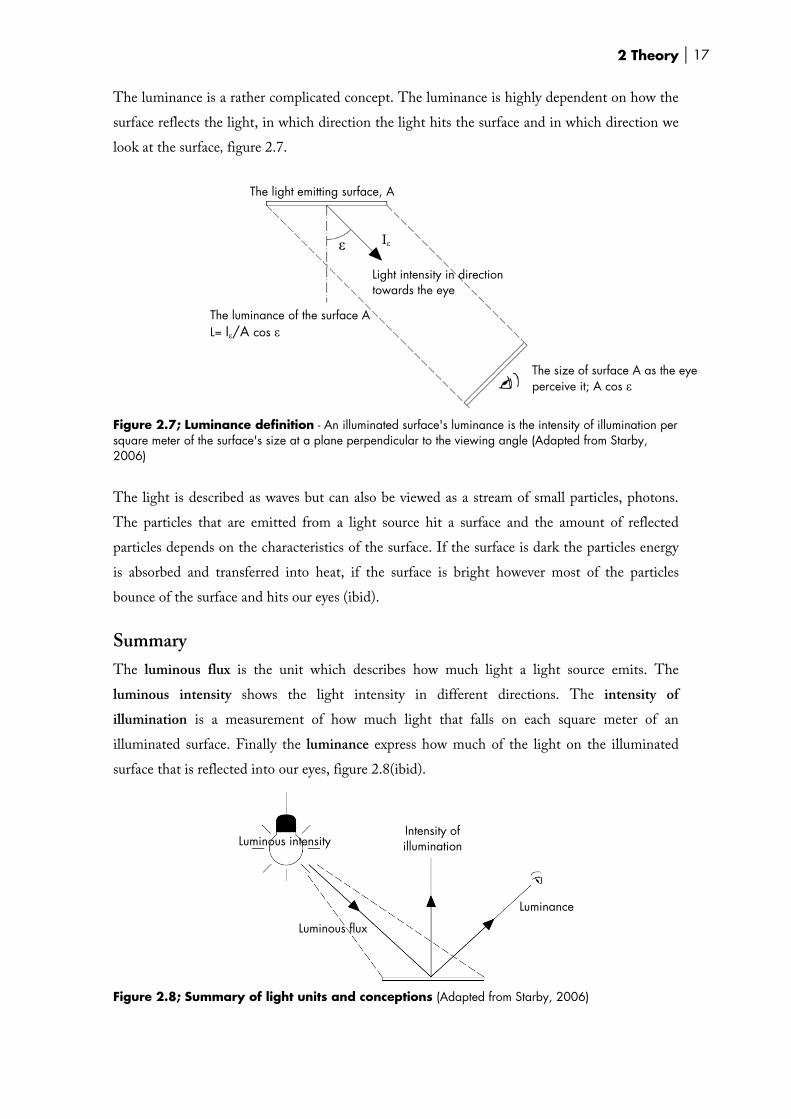
The luminance is a rather complicated concept. The luminance is highly dependent on how the
surface reflects the light, in which direction the light hits the surface and in which direction we
look at the surface, figure 2.7.
Figure 2.7; Luminance definition - An illuminated surface's luminance is the intensity of illumination per square meter of the surface's size at a plane perpendicular to the viewing angle (Adapted from Starby, 2006)
The light is described as waves but can also be viewed as a stream of small particles, photons.
The particles that are emitted from a light source hit a surface and the amount of reflected
particles depends on the characteristics of the surface. If the surface is dark the particles energy
is absorbed and transferred into heat, if the surface is bright however most of the particles
bounce of the surface and hits our eyes (ibid).
Summary
The luminous flux is the unit which describes how much light a light source emits. The
luminous intensity shows the light intensity in different directions. The intensity of
illumination is a measurement of how much light that falls on each square meter of an
illuminated surface. Finally the luminance express how much of the light on the illuminated
surface that is reflected into our eyes, figure 2.8(ibid).
Figure 2.8; Summary of light units and conceptions (Adapted from Starby, 2006)
The light emitting surface, A
Light intensity in direction towards the eye
The size of surface A as the eye perceive it; A cos ε
ε Iε
The luminance of the surface AL= Iε/A cos ε
Luminous flux
Luminous intensityIntensity of illumination
Luminance

2 Theory 18
Lightness
Lightness is defined as the perceived lightness of an object compared to the lightness of a
perfect white object. Lightness refers specifically to object colors and ranges from black to white
through the various shades of grey.
Lightness is denoted as L* and is normally measured on scale ranging from 0 to 100, where 0 is
pitch black and 100 is perfect white. It is defined by the International Commission on
Illumination, CIE, as a modified cube root of luminance:
; (2.2)
where is the luminance of the surface and is the luminance of perfect white.
Lightness of a light-reflecting surface depends on the percentage of light energy reflected from
the surface, but lightness is not directly proportional to reflected light energy (radiance). For
example, a grey surface that the human eye perceive as halfway between black and white only
reflects about 18% of what a perfect white surface reflects. Thus, lightness is a non-linear scale
that is proportional to the human eye perception instead of light energy
(www.huevaluechroma.com).
2.1.2 MEASURING
Intensity of illumination
There is a range of different instruments which with you easily can measure the intensity of
illumination in the horizontal and vertical plane. It is important to know that the intensity of
illumination decreases with the square of the distance, figure 2.9. The reason for this is simple;
at the distance of two meter from the light source the same light flow have to illuminate an area
that is four times bigger than at the distance of one meter (Starby, 2006).
Figure 2.9; The lights decreases with the square root of the distance (Adapted from Starby, 2006)
16116*31
−⎟⎟⎠
⎞⎜⎜⎝
⎛=
nYYL
nYY
<008856,0
Y nY
1m 2m
100 lux 25 lux
100 cd I

2 Theory 19
Luminance
To measure the luminance a photometer is used, there is also instruments that can measure both
intensity of illumination and luminance. It is also possible to calculate the luminance but we
have to take in consideration the surface's characteristics. The difference between incoming
light (intensity of illumination) and the reflected light (luminance) is determined by the surface
reflection factor. L = ρ*E/π cd/m2. Different materials have different reflection factor, ρ, table
2.2 (ibid).
Material ρ
White paper 0.80
Bright tree 0.45
White enamel paint 0.85
Light grey enamel paint 0.60
Dark grey enamel paint 0.15
Regular aluminum 0.75
Concrete 0.25
Table 2.2; Reflection factors for different materials (Adapted from Starby, 2006)
2.1.3 CONTRAST A condition that makes it possibly to apprehend objects is that there exist contrast or luminance
differences. To get a sharp image of an object on the retinal it's important that it stands out
from the background with sharp edges. This demands that the object have considerably
differing luminance compared to the background, figure 2.10. When looking at larger object the
importance of the contrast between the edges diminish. The luminance contrast can be
expressed as: Lc = (L2-L1)/L1, where L1 is the luminance of the background and L2 is the
luminance of the object. Note that black letters on a bright background gives negative contrast
(Nyman, Spångberg, 1996).
Figure 2.10; Contrast between objects and backgrounds (Adapted from Nyman, Spångberg, 1996)

2 Theory 20
Usually you want to control the relationship between different parts of the field of vision. A rule
of thumb is 5:2:1 in luminance contrast between the working object, the area close to this and
the more peripheral area or the background, figure 2.11 (Starby, 2006).
Figure 2.11; Suggested contrast ratio for working space (Adapted from Starby, 2006)
2.1.4 REFLECTION The definition of reflection is when radiation is reflected without any loss of the
monochromatic (one color) component frequency. No reflection can in practice happen without
any of the radiation being absorbed, but with smaller incoming angle towards the perpendicular
plane more reflection is obtained. The most basic rule when it comes to predicting reflections is
that the incoming and outgoing angle is equal, relative to the normal of the reflecting surface.
This relation is called the law of reflection, figure 2.12. Reflection can occur in different ways
depending on the surface's reflection characteristics and the main three types are specular,
lambertian and haze (Nyman, Spångberg, 1996).
Figure 2.12; Law of reflection (Adapted from Nyman, Spångberg, 1996)
Specular or direct reflection is a property in very shiny and polished surfaces. Incoming and
reflected light beams has the same angle compared to the perpendicular plane, figure 2.13. The
reflected light creates an image of the light source.
Lambertian reflection occurs on a surface that contains small reflective elements in a distorted
pattern. Each element reflects light in different directions, figure 2.13. Materials with
lambertian reflection are matt paper, matt painted surfaces and textiles.
5
2 1
α α

2 Theory 21
Haze reflection means that some part of the light reflects in every direction but the reflection is
concentrated in one direction, figure 2.13 (Starby, 2006).
Figure 2.13; Direct, Lambertian and Haze reflection (Adapted from Starby, 2006)
2.1.5 REFRACTION Light that passes through one material and into another change direction, this phenomenon is
called refraction. The reason for this is that the speed of the light changes, it slows down when
entering a thicker material and increases in a thinner material, figure 2.14.
Figure 2.14; Refraction (Adapted from Starby, 2006)
When light passes through glass for example, the incoming and outgoing light has the same
direction. Different materials have different refraction index, air has the refraction index of one,
nair=1. To calculate refraction index or angles for a certain situation you can use Snell’s law:
n1*sin α = n2*sin α´
Where n1 is refraction index for the first material and n2 refraction index for the second
material, α is incoming angle and α´ is the refraction angle (Starby, 2006).
2.1.6 ANTI-REFLECTIVE COATING When a light wave strikes a glass surface, most of it will be transmitted through the glass, but a
small portion will bounce off as a reflection. In many occasions it is desirable to minimize these
reflections since they might disturb the observer. The most common way of doing this is by
adding an anti-reflective or anti-reflection (AR) coating to the surface. This improves the light
α
α
α´ α´
n1
n1
n2

2 Theory 22
transmission, since less light is lost. It also improves the contrast of the image by decreasing the
amount of stray light. (www.essilor.com)
AR-coatings are made of a very hard and thin film, normally a metal oxide, which is layered on
the glass. This causes the light waves to be reflected in two interfaces that interfere with each
other. If the coating has a thickness of exactly one fourth of the incident wavelength ( ),
the two reflections from each side of the coating will cancel each other out and minimize the
glare you see. This phenomenon is called destructive interference, figure 2.15
(www.howstuffworks.com, www.xerocoat.com).
Figure 2.15; Destructive interference with quarter wave coating (Adapted from xerocoat.com, 2008)
The optimum performance of the coating is achieved when the refractive index of the coating is
equal to the square root of the glass refraction index. The refraction index is a measure for how
much the speed of electromagnetic waves is reduced inside a medium. For regular light it is
defined as follows:
(2.3)
where is the refraction index of the medium, is the speed of light in vacuum and is the
speed of light within the medium (www.ne.se).
An interesting note is that no energy is lost. If a glass with an AR coating has a reduced
intensity of reflected light compared to an untreated glass, then the intensity of the transmitted
light will be increased with the same amount (www.essilor.com).
4/λ
vcn =1
1n c v
λ/4
I
T
λ
R2
R1
n0 n1 n2
2 Theory 23
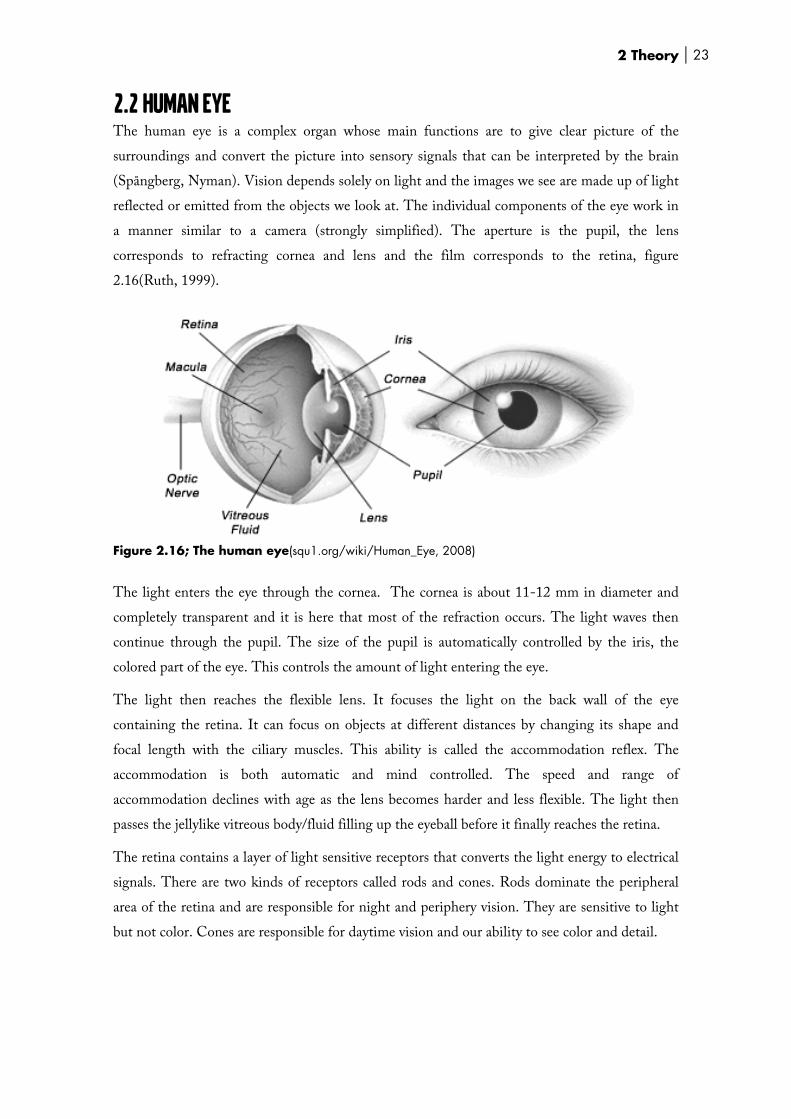
2.2 HUMAN EYE The human eye is a complex organ whose main functions are to give clear picture of the
surroundings and convert the picture into sensory signals that can be interpreted by the brain
(Spångberg, Nyman). Vision depends solely on light and the images we see are made up of light
reflected or emitted from the objects we look at. The individual components of the eye work in
a manner similar to a camera (strongly simplified). The aperture is the pupil, the lens
corresponds to refracting cornea and lens and the film corresponds to the retina, figure
2.16(Ruth, 1999).
Figure 2.16; The human eye(squ1.org/wiki/Human_Eye, 2008)
The light enters the eye through the cornea. The cornea is about 11-12 mm in diameter and
completely transparent and it is here that most of the refraction occurs. The light waves then
continue through the pupil. The size of the pupil is automatically controlled by the iris, the
colored part of the eye. This controls the amount of light entering the eye.
The light then reaches the flexible lens. It focuses the light on the back wall of the eye
containing the retina. It can focus on objects at different distances by changing its shape and
focal length with the ciliary muscles. This ability is called the accommodation reflex. The
accommodation is both automatic and mind controlled. The speed and range of
accommodation declines with age as the lens becomes harder and less flexible. The light then
passes the jellylike vitreous body/fluid filling up the eyeball before it finally reaches the retina.
The retina contains a layer of light sensitive receptors that converts the light energy to electrical
signals. There are two kinds of receptors called rods and cones. Rods dominate the peripheral
area of the retina and are responsible for night and periphery vision. They are sensitive to light
but not color. Cones are responsible for daytime vision and our ability to see color and detail.

2 Theory 24
There are three different kinds of cones –each responding to a different wavelength: red, green
and blue. The cones are concentrated to an area called the macula, which contains the fovea.
The fovea only consists of cones and gives the highest visual acuity.
After the conversion of the light, the electrical signals are transmitted to the brain through the
optic nerve. (Nyman, Spångberg 1996)
2.2.1 VISUAL ACUITY Visual acuity is defined as the ability to distinguish objects sitting very close together, thus the
optical resolution of the eye. A major factor for visual acuity is the size of objects, which affects
the size of the image on the retina. It is not the physical size of an object that is important but
the visual angle to the object, figure 2.17. This explains why you need to look close at small
objects to see them clearly (Nyman, Spångberg, 1996).
Figure 2.17: Small objects need to be closer to the eye to achieve a large enough image on the retina (Adapted from Nyman, Spångberg, 1996)
Another important factor for visual acuity is the lighting conditions. The eyes have a harder
time focusing clearly and distinguish details if the luminance and/or contrast levels are low. It
will then take longer time to adjust for good visual acuity. Just as the camera requires longer
exposure time in dim light than bright light, so does the human eye (Ruth, 1999, Nyman,
Spångberg, 1996).
2.2.2 ADAPTION The human eye has an amazing ability to adapt to different intensity of light. This is controlled
by the pupil and the light sensitivity of the retina. To adapt from a dark to light environment is
usually no problem, it is done in a matter of seconds. It is the other way around that creates
problems. For example, if you go from a very well lit room into a much darker room, you will
almost perceive it as pitch black. Soon you start to make out the most prominent items in the
dark room, but it can take up to a half hour before you achieve total dark adaptation, figure 2.18
(Ruth Walter). A common problem related to driving is when entering a tunnel, where the eye
has to adapt from a light environment to a dark environment really fast (Starby, 2006).

2 Theory 25
Figure 2.18; Adoption curves (Adapted from Starby, 2006)
2.2.3 GLARE The luminance distribution in the field of vision is a very important factor. The risk of glare
arises in environments where the range of luminance is too large. Glare is usually divided into
discomfort glare and disability glare.
Discomfort glare occurs when the eyes has adjusted to a dark environment and then get exposed
to a much brighter environment. The eyes will adjust rapidly to the brighter environment
without impairing the vision, but it will cause some discomfort.
The disability glare effect is connected with the fact that the retina adjusts its light sensitivity to
the average luminance in the field of view. A surface that is much brighter than the rest, will
give a glaring effect that will impair the vision. This will lead to reduction of contrast lightness
in the rest of the view (Starby, 2006).
2.3 VISUAL REDUCTION WHILE DRIVING There is no doubt about the great importance of good visual quality while driving a car. There
are many factors that contribute to a reduction of the visual quality. Common for all these
factors is that they decrease the contrast of the road scene and therefore makes it harder for the
driver to see important objects while driving.
Almost all visual reduction factors have its origin from the windshield and its characteristics.
Even a new and perfectly clean windshield makes the road scene look different compared to the
way it looks outside the vehicle. The ultimate solution would be to not have a windshield at all,
but that is not very practical.
105
104
102
103
10
1 0 5 10 15 20 25 30
Time in darkness, minutes
Lum
inan
ce
2 Theory 26
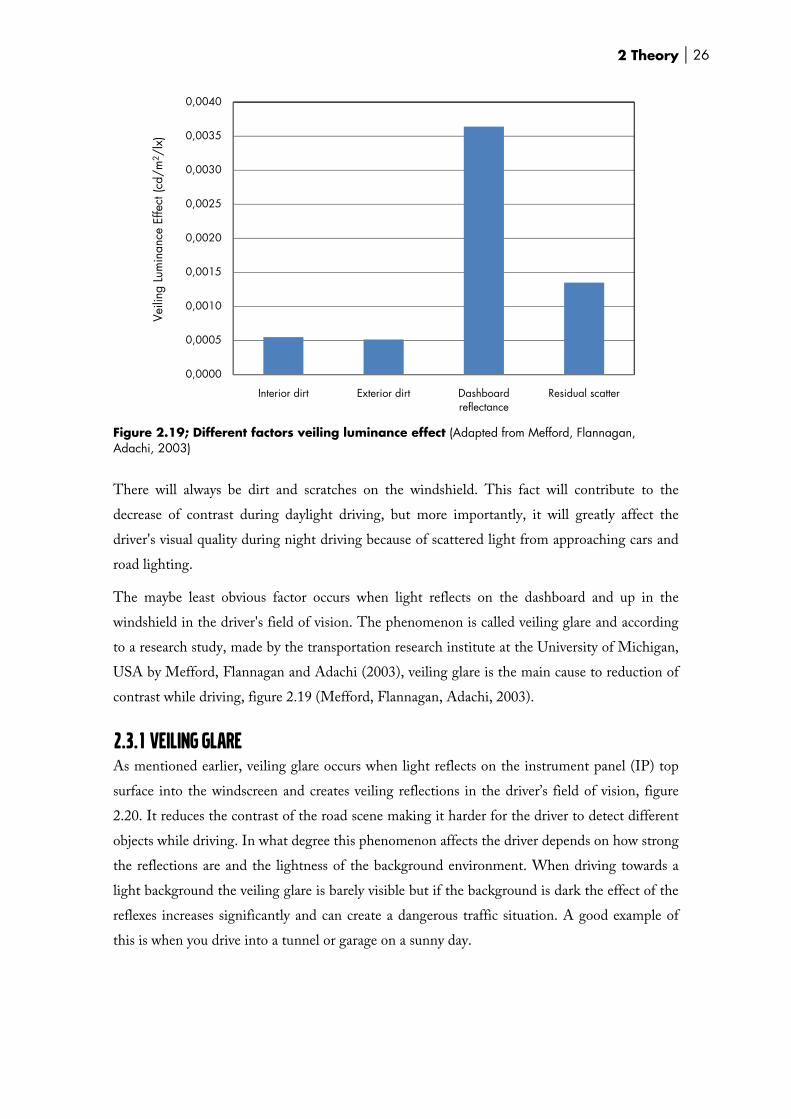
Figure 2.19; Different factors veiling luminance effect (Adapted from Mefford, Flannagan, Adachi, 2003)
There will always be dirt and scratches on the windshield. This fact will contribute to the
decrease of contrast during daylight driving, but more importantly, it will greatly affect the
driver's visual quality during night driving because of scattered light from approaching cars and
road lighting.
The maybe least obvious factor occurs when light reflects on the dashboard and up in the
windshield in the driver's field of vision. The phenomenon is called veiling glare and according
to a research study, made by the transportation research institute at the University of Michigan,
USA by Mefford, Flannagan and Adachi (2003), veiling glare is the main cause to reduction of
contrast while driving, figure 2.19 (Mefford, Flannagan, Adachi, 2003).
2.3.1 VEILING GLARE As mentioned earlier, veiling glare occurs when light reflects on the instrument panel (IP) top
surface into the windscreen and creates veiling reflections in the driver’s field of vision, figure
2.20. It reduces the contrast of the road scene making it harder for the driver to detect different
objects while driving. In what degree this phenomenon affects the driver depends on how strong
the reflections are and the lightness of the background environment. When driving towards a
light background the veiling glare is barely visible but if the background is dark the effect of the
reflexes increases significantly and can create a dangerous traffic situation. A good example of
this is when you drive into a tunnel or garage on a sunny day.
0,0000
0,0005
0,0010
0,0015
0,0020
0,0025
0,0030
0,0035
0,0040
Interior dirt Exterior dirt Dashboard reflectance
Residual scatter
Veili
ng L
umin
ance
Effe
ct (c
d/m
2 /lx
)

2 Theory 27
Figure 2.20 Example of veiling glare.
It's possible to divide veiling glare into two types. One type is when the entire dashboard reflects
into the driver’s eyes and creates a veil of reflecting light which decreases the contrast in the
entire field of vision and make it hard to see the road. This type of veiling glare is highly
dependent on the lightness of the IP material as shown in figure 2.21.
Figure 2.21; Effect of instrument top panel lightness

2 Theory 28
The other type is when veiling glare creates disturbing reflection effects in the windshield, so
called ghost images. The reason for this disturbing reflection is contrast differences on the
dashboard caused by split lines, different shapes and features like defroster grills and labels. The
stronger the contrasts are, the greater is the risk for annoyance for the driver. Usually, the
reflections from a dashboard reflecting up into the windscreen consists of a mix of both types of
veiling glare.
You can trough a number of factors predict and therefore influence the amount of veiling glare.
A study was carried out by Larry Edson at General Motors to investigate which factors affected
the intensity of veiling glare. The result showed that windshield angle, gloss/texture of the IP,
lightness of IP material and IP angle had the greatest effect on the amount of veiling glare. So
to minimize the amount of veiling glare, you have to work with the designs of the instrument
panel and the windshield. The sun angle has of course also a great effect on veiling glare, but it's
a factor you can't control (Edson, 1992).
The specular glare angle is the particular angle of the sun, dependant on the vehicle geometry,
that produces specular reflections first of the IP into the windshield and then off the windshield
and into the driver’s eyes. A specular reflection occurs when the sunlight angle of incidence and
the angle of reflection are equal relative to the surface normal at the point of reflection, figure
2.22. This produces the strongest veiling luminance, figure 2.23, (Internal technical rapport for
veiling glare).
Figure 2.22; Vehicle side view, showing the specular glare phenomenon
The specular glare angle is unique for a given windshield and IP angle combination and is
calculated with the following formula (Internal technical rapport for veiling glare):
Specular Glare Angle = 2 x (90 – (Windshield angle + IP-angle)) (2.4)
Sun elevation angle
Windscreenangle
Instrument panel angle >0
Sunlight
Drivers eyes

2 Theory 29
Figure 2.23; Comparing specular glare with non specular glare Many studies have been made to determine the windshield angle's importance to the amount of
veiling glare. Windshield angles larger than 60 degrees, measured from the vertical plane, have a
rapidly increasing effect on the proportion of reflected light, figure 2.24. It's clearly preferred to
try to use a windshield angle below 60 degrees but there's also the possibility to work with anti-
reflective coatings to decrease veiling glare. (Schumann, Flannagan, Sivak, Traube, 1997)
Figure 2.24; Chart of Fresnell’s reflection curve (Adapted from Schumann, Flannagan, Sivak, Traube, 1997))
100
80
40
20
0 50 60 70 80 90
Windscreen angle
Perc
ent o
f lig
ht e
nerg
y re
flect
ed
20 30 40 10 0
60

2 Theory 30
2.3.2 VEILING GLARE AT FORD MOTOR COMPANY Ford quantify veiling glare with an index, which is a measure of the amount of light that is
reflected into windshield relative to a set of standard conditions. The index is a calculation that
depends on physical measures using a luminance and illuminance meter. The measurements
take place at the specular sun angle. (Internal technical rapport for veiling glare)
3 Method 31
3 METHOD 3.1 PROJECT PLAN A project plan is created to make sure all stakeholders in a project agree on the distribution of
responsibility, purpose, objective, milestones, delimitations and work plan. A Project plan also
includes schedule and contact information, which helps the communication between the
workgroup and the client (Hamrin, Nyberg, 1993).
3.2 GATHERING OF INFORMATION
3.2.1 LITERATURE The most common source of information is literature, which includes books, research papers,
master thesis etc. It is very important to be critical of sources when you gather information,
especially on the Internet, and make sure everything is correct and validated (Preece, 2002).
3.2.2 QUESTIONNAIRE According to Trost (2001), it's important to define the purpose of the questionnaire. Why is the
questionnaire being carried out and what do you want to find out? The population for the
survey also needs to be defined, who will the questionnaire be aimed at? The selection of the
questionnaire will then be the number of the population that responds to the questionnaire. The
selection should be representative for the whole population. When conducting questionnaires, it
is important to think of standardization and structuring. Standardization refers to the degree to
which the questions and the situation of the questionnaire, is equal for all test subjects.
Structuring refers to the form the questions are structured by, that they are in a logical sequence
and issues affecting the same area are combined. Important to keep in mind is to formulate the
questions without negations and avoid having two questions in one. E.g. "What do you think of
coffee and tea?" (Trost, 2001)
3.3 SIMULATOR SURVEY When implementing a simulator test, it is important to plan the execution carefully to avoid
mistakes. A participant profile should be created, from which people then can be recruited. This
profile should considerate all possible effects that may influence the result, such as age, sex and
previous experience. There are several ways to eliminate these effects. One way is to match the
group so that it is, for example, as many women as men or a wide distribution of age. You can
also isolate the test to a particular group (ex. male dentist students in the age of 25 years, with a
drivers license, which only drive Volvo cars) and eliminate any differences that may affect the

3 Method 32
outcome of the survey. It is also important to plan the experiment in such way that start order,
timing of tasks and given instructions doesn't affect the outcome (Preece, 2002).
3.4 DESIGN OF EXPERIMENT To reveal what factors and how these factors influences a product or process the method Design
of Experiment (DOE) is a good way to go. DOE is often used as one of the methodologies in
quality management and improvement work (Bergman, Klefsjö, 2007).
3.4.1 FACTORIAL DESIGN An experiment with only one factor at a time often gives incorrect result and leads to
unnecessary costs. It's better to use a full factorial design, which can reveal the factors that has
effect on the process and also possible interaction effects between factors. First it's important to
find which factors could be interesting to investigate. Then the levels on which these factors
should be investigated are determined, one low, negative level and one high, positive level. A
number of test run is performed in where the two levels of each factor are mixed so all possible
combinations are tested. An example of a full factorial design with three factors can be seen in
table 2.2. The results from the test are shown in column Y, another way to show the results
could be in a 3D form, figure 2.24 (Bergman, Klefsjö, 2007).
Run no. Factors and interactions
S O C SxO SxC OxC SxOxC y
1 - - - + + + - 67
2 + - - - - + + 79
3 - + - - + - + 59
4 + + - + - - - 90
5 - - + + - - + 61
6 + - + - + - - 75
7 - + + - - + - 52
8 + + + + + + + 87
Estimated effects 23 1,5 -5,0 10 1,5 0,0 0,5
Table 3.1; Design matrix for factorial design together with results from the testing and estimated effects (Adapted from Bergman, Klefsjö, 2007)

3 Method 33
Figure 3.1; Illustration of the received result presented in a 3D cube form (Adapted from Bergman, Klefsjö, 2007)
The next step is to estimate the effect of increasing a factor. This effect could be either positive
or negative. If you want to maximize the outcome and the effect of a factor is negative then the
factor should be set to the low, negative level, cause negative times negative is positive (-*-=+). If
the effect is positive, then the factor should be set to the high positive level. It's also necessary to
estimate the interaction between two factors, which means that the effect of changing one factor
depends on the level of the other one. The definition is;
(The effect of raising A on a high B level) – (The effect of raising A on a low B level) (3.1)
Next question to answer is if any main factor effect or interaction factor effect is big enough to
have any influence on the process? In other words, are any of the resulting effect values "strange"
to get if we assume that no factor has any influence on the process? It is important to know that
there is an uncertainty in every Y-value and the values range within a normal distribution. To
handle this uncertainty it's required to determine the reference distribution and the significance
level. The reference distribution is the normal distribution for the calculated effects. The
significance level, or the "risk value", is always chosen with a chance of being incorrect which
leads to the possibility of two types of incorrect conclusions. One is that we draw the conclusion
that a factor has influence when the factor does not. This happens because the significance level
is set too narrow, figure 2.25. The other type of wrong conclusion is when we don't discover the
influence of a factor. This happens when the significance level is set too wide, figure 2.25 (ibid).

3 Method 34
Figure 3.2; Significance level set, from the top, too narrow, too wide and correct (Adapted from Bergman, Klefsjö, 2007) A possibility of modifying the full fractional design is to choose to do a fractional factorial
design, figure table 3.2. You can then study more factors on fewer test runs, which saves time
and money. The disadvantages are the risk of mixing the effects of influencing factors when
interpreting the results and increased uncertainty (ibid).
Run no. Factors D
A B C AxB AxC BxC AxBxC
1 - - - + + + -
2 + - - - - + +
3 - + - - + - +
4 + + - + - - -
5 - - + + - - +
6 + - + - + - -
7 - + + - - + -
8 + + + + + + +
Table 3.2; Design matrix for fractional factorial design. The interaction effect between A, B and C is the same as the effect of D because an interaction effect between the first three is most unlikely to exist(Adapted from Bergman, Klefsjö, 2007)
3.4.2 RESPONSE SURFACE DESIGN When it's necessary to find the factor settings that optimize the outcome the factorial design
method can be inadequate. Instead it's better to use the response surface method, which also
shows possible curvature of the response surface when factorial design only shows linear effects.
To be able to find the possible curvature effect more levels is chosen for every factor and a
quadratic regression equation is used instead of the linear form of the regression equation used
in factorial designs.
Note that when the response surface is approximated by a linear equation the maximum and
minimum values always occur at a corner point. This leads to that the regression equation is not
ideal to optimize the process if the true maximum or minimum lies within the range of analyzed

3 Method 35
levels. At which levels the factors are set depends on which design is chosen, there are various
types including the Central Composite Design (CCD) and Box Behnken designs. If an
inscribed CCD, figure 2.26, is chosen it's still possible to do the test with the max and min
within the analyzed range. But this may lead to that the accuracy of the acquired model isn't
great at the end levels of each factor. (www.micquality.com)
Figure 3.3; Example of inscribed Central Composite Design with four factors (Adapted from www.mathworks.com)
3.5 MINITAB Minitab 14 is statistical software developed at the Pennsylvania State University. It was
originally intended for teaching statistics but has over time developed into a powerful but easy to
use and learn package. It contains statistical tools and guidance to analyze data in quality
improvement projects and allows the user to treat data in a moderately simplistic way, i.e., as
columns much like in a spreadsheet.
Today, Minitab is the leading software used to implement Six Sigma worldwide and Ford
Motor Company uses Minitab to improve their business and achieve world-class quality.
(www.minitab.com)
3.6METOD OF LIMITS Method of limits is one of the three classical methods of psychophysics introduced in 1860 by
Gustav Theodor Fechner (1801–1887). In the methods of limits the experiments begins with a
stimulus that is so weak that the subject can't detect it. The stimulus is then increased in small,
equal steps until the subject reports to detect it. The descending series is then begun where the
stimulus intensity begins at an above-threshold value and is then decreased in equal steps until
the subject signals the disappearance of the stimulus.
1,5
1
0,5
-0,5
0 1
1 0
-1
-1,5
-1
0
-1

3 Method 36
This method is simple, but there are two kinds of errors to look out for: Habituation and
expectation. With habituation, the subject may continue provide the same response, even
though the he or she can perceive a change. Conversely, a subject may change his or hers
response because they expect a change, even though they haven’t really perceived it. (McGraw-
Hill, 2008)
A solution to this problem can be to use the staircase method which is analogues with the
method of limits, with the exception that an ascending (descending) sequence does not
terminate after the first reversal from NO to YES (YES to NO) response. Instead, the
experiment continues until many reversals are obtained around the value to be estimated.
To reduce the risk of anticipation the double staircase method can be used. This means that two
curves are used simultaneously where one of them starts above and one below the threshold
value. By using these two curves randomly, it will be very hard for the subject to understand the
system and anticipate changes of stimulus.
There are a number of things to keep in mind when using these methods:
• The series should start at an intensity level close to the expected threshold value
• The step size between stimulus shouldn't be to small (takes long time) or to large (low
precision)
(Macmillan, Creelman, 2005).
3.7 MEASURING DEVICES
3.7.1 PHOTOMETERS
Minolta CS-100A Chroma meter
There are many different tools to use for measuring light intensity. In this project a Minolta
CS-100A have been used to measure the luminance, figure 3.4.
Figure 3.4; Minolta CS-100A Chromameter (www.konica-minolta.com)

Whe
viewf
lumin
viewf
expre
Min
A Mi
illum
equip
senso
is dis
impo
light
the en
Ligh
A spe
lightn
displa
lightn
reflec
Figur
n measuring
finder that r
nance within
finder windo
essed in cd/m
nolta T-10
inolta T-10,
mance from
pped with a
or is placed o
splayed in l
ortant to aim
source to ob
nvironment.
htness me
ectrophotom
ness value of
ay and a han
ness by send
cting back. T
re 3.6; Data
g luminance
epresents th
n this circle.
ow and at an
m2 or fL.
0 Illumina
figure 3.5, h
the sun lam
receptor hea
n the windsc
ux. When u
m the recepto
btain the cor
eter
meter from D
f different m
ndheld measu
ding out a fla
The resulting
color Intern
with a Min
e measuring
The obtaine
n external di
ance meter
has been use
mp at a give
ad connected
creen and the
using this d
or head dire
rrect value o
Datacolor In
materials ma
uring device
ash of light
value is expr
ational Ligh
nolta CS-100
g area of 1 d
ed value is p
splay. The u
r
d to measure
en distance.
d on a cord.
e measured v
device, it is
ectly towards
of illuminanc
ternational,
aterial sample
connected w
and then me
ressed in L*.
htness meter
0A there is
degree. The
resented wit
user can cho
e the
It's
The
value
very
s the
ce in
figure 3.6, h
es. It contai
with a cord. T
easures the a
r
Figillu
a circle in t
measured va
th digital num
ose between
has been use
ns a main b
The spectrom
amount and
gure 3.5; Miuminance m
3 Me
the middle o
alue is the av
mbers both
n getting the
ed to measur
body with a
meter measur
spectrum of
nolta T-10 eter
ethod 37
of the
verage
in the
value
re the
LCD
res the
f light

3 Method 38
3.7.2 GLOSSMETER It's known that the gloss has a great influence on veiling glare and therefore it's important to
know the gloss of the materials you're working with. In this study we used a micro-TRI-gloss
meter from BYK Gardner, figure 3.7, to measure the gloss of the materials used to simulate the
instrument top panel. The micro-TRI-gloss has two buttons, Mode and Operate. The gloss
meter measures the gloss at three different angles, 20°, 60° and 85°. If possibly the most accurate
angle to measure at is 85° but is often difficult to get correct values. Instead the 60° was chosen
as the default setting.
Figure 3.7; BYK Gardner micro-TRI-gloss meter
3.8 LABORATORY FIXTURE An existing laboratory fixture was modified and
improved to simulate the elements and
relationships between the affecting factors of
veiling glare, figure 3.8. The fixture utilizes a
sunlamp that is angularly movable, simulating
different sun angels. A windshield stand has
been created and modified to accommodate the
usage of regular windscreens. The construction
allows the windshield to be angled from 45 to 80
degrees. The instrument top panel is simulated
by a horizontal plane underneath the windscreen.
Custom made surface material can placed here
and adjusted to a desired angle. During the
objective measurements a photometer takes the
place of the drivers’ eyes and measures through
the windscreen into a light trap, figure 3.9
Figure 3.8; Photo of the laboratory fixture

3 Method 39
Figure 3.9; Schematic image of the laboratory fixture with light trap
3.8.1 SUN LAMP – DEDOLIGHT 400D To have the possibility to control the sun angle, a portable light source with high luminous flux
is necessary. In this study the Dedolight 400D was used because of its great possibilities to
mimic the sun light and also varying the intensity of the light. The Dedolight 400D uses single
ended 400 W daylight metal halide lamps which imitates daylight in a very good way, figure
3.10(www.dedolight.com).
Figure 3.10; Photo of Dedolight 400D and its electrical transformer (www.dedolight.com)
Sun angle
Windscreenangle
Instrument panel angle Luminance meter
Light trap
Sun lamp
3 Method 40
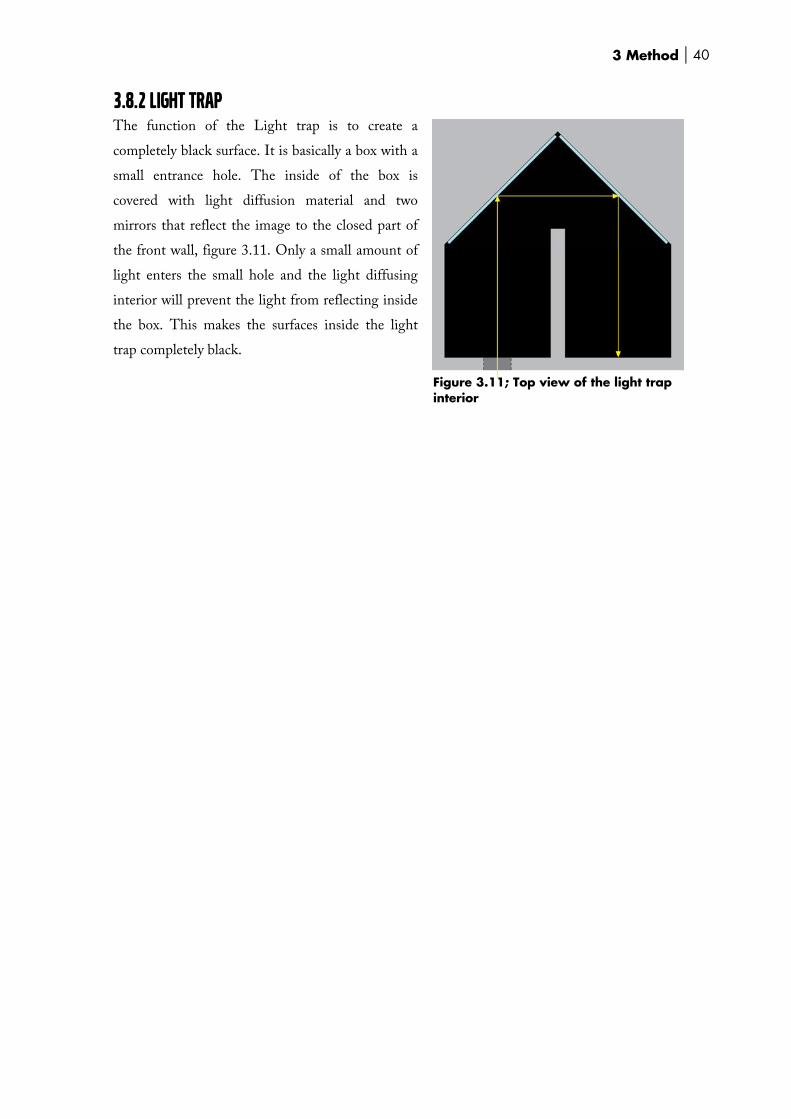
3.8.2 LIGHT TRAP The function of the Light trap is to create a
completely black surface. It is basically a box with a
small entrance hole. The inside of the box is
covered with light diffusion material and two
mirrors that reflect the image to the closed part of
the front wall, figure 3.11. Only a small amount of
light enters the small hole and the light diffusing
interior will prevent the light from reflecting inside
the box. This makes the surfaces inside the light
trap completely black.
Figure 3.11; Top view of the light trap interior
4 Realization 41
4 REALIZATION 4.1 PROJECT PLAN When this thesis work started in September, 2008 it was not exactly clear what had to be done
in what order. It was necessary to get some structure and overview of the project. To do this a
Gantt chart was created, appendix 1. All smaller partial projects were defined with a start time
and a date when it should be finished. The Gantt chart was used as a checklist and a reminder
so that no part of the project was forgotten. Some parts of the Gantt chart was changed during
the thesis work because some parts needed more time to be finished and other lesser time.
4.2 INFORMATION GATHERING In order to obtain an appropriate theory in the subject, information was retrieved from the
Internet, textbooks, internal resources at Volvo and articles in academic libraries. The
information gathering was conducted to obtain an idea of what knowledge existed about veiling
glare and what kind of research that had been carried out.
4.3 PRESENT SITUATION ANALYSIS
4.3.1 CAR DESIGN OF TODAY The problem with veiling glare is complex matter that depends on a number of different factors
(which in turn depends a number of other factors). Many of these factors are affected by the
car's design but also by different technical features. Currently, it is very popular to use chrome
plastic and metal surfaces in the car around the controls and air vents. Other shiny and
contrasting surfaces on the instrument top panel are the defrosting grills and projector for
Head-Up-Display (HUD). These are often located far down the instrument panel, close to the
windshield.
It is popular among today's automakers to use bright decor materials because it gives a more
open and airy feeling in the car. However this has a negative effect on veiling glare. Still there is
a desire from the designers to have more freedom to choose different colors and materials on the
dashboard.
The windshield angle is affected both by the car design but also by the attempt to minimize air
resistance to increase fuel efficiency. One of Volvo's core values is safety and a field that has
gotten a lot of focus in recent years is pedestrian safety. One way to create high pedestrian safety
is to move the windshield further down the bonnet so that in the event of a collision, a
pedestrian head hits the softer windshield, instead of the bonnet. This means that the

4 Realization 42
windshield angle will be steeper as it needs to extend over a longer area. Today, Volvo cars have
a windshield angle around 62 degrees.
Volvo has never produced cars with AR-coated windshields, but they have conducted several
studies to identify the effect of using AR-coatings. The studies ended with the conclusion that
the price, at the time, was too high to justify the use of AR-coatings.
4.3.2 EXISTING DELIMITATIONS Veiling glare has, in recent years, become more of an issue than in years past due mainly to the
increase in windshield rake angles and the use of brighter and glossy materials in modern cars.
This has resulted in more customer complaints and car manufactures around the world have
conducted several studies to understand and minimize the problem.
Current requirements at Volvo
It is important to be aware of that the requirement verification methods to quantitatively
establish veiling glare values exclusively measures at specular sun angles where the measured
reflection intensity is the greatest, figure 4.1. However, as mentioned earlier, the customer
complaints come from countries/regions with high sun angles, outside the specular glare angle.

4 Realization 43
Figure 4.1; Example of specular glare at a sun angle of 50°(Windshield angle is 60° and IP-angle is 5°, according to formula 2.4)
Volvo has realized through own observations, that instrument panel lightness plays an
important role in how veiling glare is experienced, particularly at high sun angles. Observations
indicate that material gloss is the main contributing factor for veiling glare close to specular sun
angles, while material lightness seem to be the major factor contributing at higher sun angles.
Therefore Volvo Cars has created a complementing requirement that express a maximum
lightness value based on a linear relationship tied to the windscreen angle. Volvo is not certain
that it captures the whole picture of the problem. They believe it’s necessary to look further into
this problem to truly identify all the factors and their effect on veiling glare. It is also required
that there is a feedback to the reality and subjective testing so that new requirements can be
developed based on customer acceptance.
4.4 OBJECTIVE TESTING After a couple of modifications of an existing laboratory fixture had been made, the objective
testing could be initiated. This laboratory fixture made it possible to easily change the sun angle
and the windshield angle. Two windshields from the P1 series (Volvo S40/V50) were used. One
was a regular windshield taken from the production line and the other had a single anti-
reflective coating applied.
The incoming light intensity was measured in
lux on the windshield when the windshield
angle was 55°. This can be translated to a point
15 cm from the pivot point of the sun lamp
fixture.
To simulate the instrument panel a number of
paper boards were used. These paper boards
60 70 80 90
Refle
cted
ligh
t int
ensi
ty
40 50 30 20 Sun angle, degrees
Specular glare
Outside specular glare
Outside specular glare
Figure 4.2; Fixture to angle the cardboard material samples

4 Realization 44
had different colors printed on them so it was possible to easily change the characteristics of the
instrument panel. To simulate different IP-angles, small cardboard fixtures were created to
achieve the desired IP angle, figure 4.2.
A light trap was used as the background during the objective measurements. The light trap was
positioned 2.1 meter right in front of the fixture. The luminance was then measured with the
Photometer through the windshield towards the small hole on the light trap, figure 3.9.
4.4.1 FINDING AFFECTING FACTORS When the objective testing started there were nine factors that were to be examined and their
effect on the amount of veiling glare. The possible effect of different shapes, surface structure
and design details were not considered in this thesis work. The nine factors and their effect that
was to be studied were:
• Sun angle
• Windshield angle
• Instrument panel angle
• Gloss on the IP material
• Lightness of the IP material
• Color of the IP material
• Height of the IP
• Anti-reflective coating
• Light intensity of incoming light
One possibility was to use all the factors in a Design of Experiment but this would be
unpractical and lead to an enormous amount of tests. The desire was to reduce the numbers of
factors before the DOE was carried out.
Gloss
Volvo's previous experiments have suggested that the impact of gloss on veiling glare is greatest
at specular sun angles and minimal at high sun angles. To investigate whether this hypothesis is
true or not, an experiment was conducted in which two different shades of gray was printed on
matte and glossy paper. The lightness of each sample was measured and verified with the light
meter, so that the grays had exactly the same lightness on both the glossy and matte paper. The
samples were then examined in the laboratory fixture.
The windshield angle was set to 60o, the IP angle was horizontal and the sun angle was varied
between 40 and 80 degrees. The experiment was conducted both on the regular and AR coated
windshield.

4 Realization 45
The results of the experiment, figure 4.3 showed that Volvo's hypothesis conform well to
measured values. The impact of gloss on veiling glare is greatest at specular angles and minimal
at sun angles above and below the specular glare angle (± 10 degrees). The result also shows that
specular sun angles have little effect on matte materials.
Figure 4.3; Results when comparing matte and glossy material at different sun angles Outside the specular glare angle the lines of the two materials are almost collinear but at the
specular glare angle the glossy material peaks exceptionally. These results were considered to be
enough to exclude gloss as an affecting factor on veiling glare at high sun angles. In addition,
there is already a requirement that limit the gloss level at the specular sun angle, which will be
more than sufficient for high sun angles.
0
5000
10000
15000
20000
25000
30000
40 45 50 55 57 60 65 70 75 80
Ref
lect
ed lum
inance
(cd
/m2)
Sun angle
Light, matte
Light, glossy
Dark, matte
Dark, glossy
0
100
200
300
400
500
600
700
800
900
1000
40 45 50 55 57 60 65 70 75 80
Ref
lect
ed lum
inance
(cd
/m2)
Sun angle
Light, matte
Light, glossy
Dark, matte
Dark, glossy
4 Realization 46
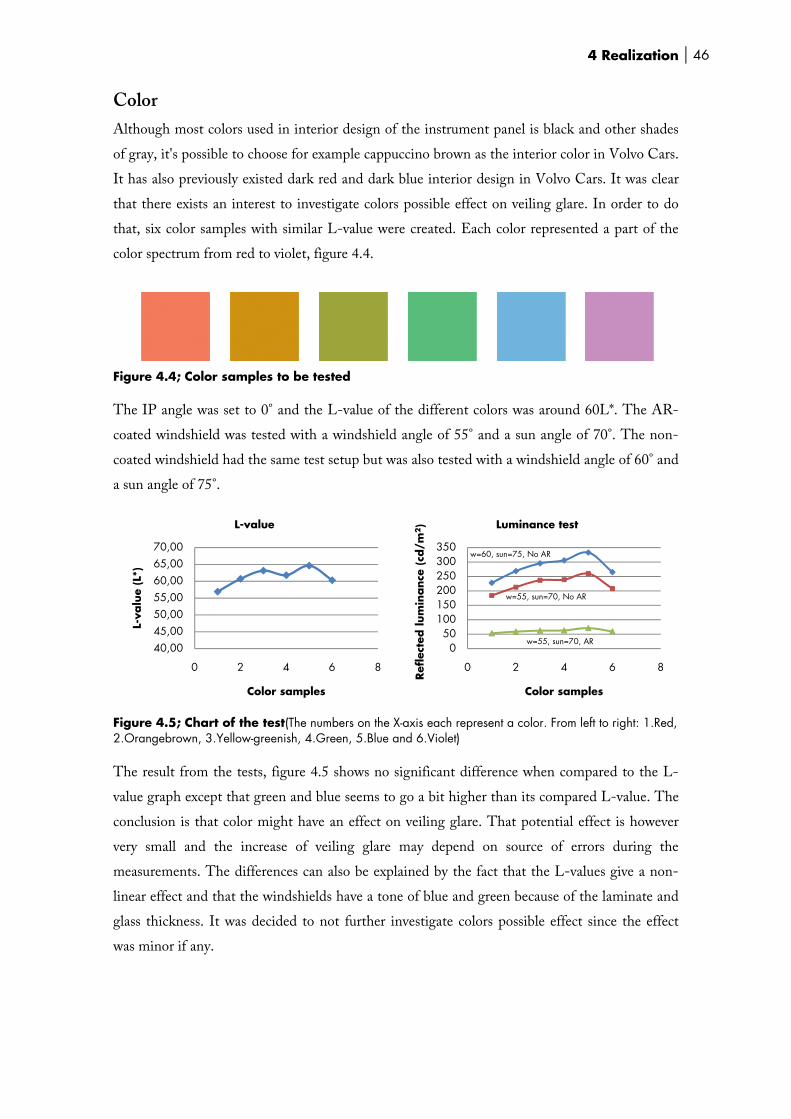
Color
Although most colors used in interior design of the instrument panel is black and other shades
of gray, it's possible to choose for example cappuccino brown as the interior color in Volvo Cars.
It has also previously existed dark red and dark blue interior design in Volvo Cars. It was clear
that there exists an interest to investigate colors possible effect on veiling glare. In order to do
that, six color samples with similar L-value were created. Each color represented a part of the
color spectrum from red to violet, figure 4.4.
Figure 4.4; Color samples to be tested The IP angle was set to 0° and the L-value of the different colors was around 60L*. The AR-
coated windshield was tested with a windshield angle of 55° and a sun angle of 70°. The non-
coated windshield had the same test setup but was also tested with a windshield angle of 60° and
a sun angle of 75°.
Figure 4.5; Chart of the test(The numbers on the X-axis each represent a color. From left to right: 1.Red, 2.Orangebrown, 3.Yellow-greenish, 4.Green, 5.Blue and 6.Violet) The result from the tests, figure 4.5 shows no significant difference when compared to the L-
value graph except that green and blue seems to go a bit higher than its compared L-value. The
conclusion is that color might have an effect on veiling glare. That potential effect is however
very small and the increase of veiling glare may depend on source of errors during the
measurements. The differences can also be explained by the fact that the L-values give a non-
linear effect and that the windshields have a tone of blue and green because of the laminate and
glass thickness. It was decided to not further investigate colors possible effect since the effect
was minor if any.
40,0045,0050,0055,0060,0065,0070,00
0 2 4 6 8
L-va
lue
(L*)
Color samples
L-value
050
100150200250300350
0 2 4 6 8
Ref
lect
ed lum
inance
(cd
/m2)
Color samples
Luminance test
w=60, sun=75, No AR
w=55, sun=70, No AR
w=55, sun=70, AR

4 Realization 47
Height of the instrument panel
The height of the instrument panel was suspected to be an affecting factor of the veiling glare.
The hypothesis was that a higher instrument top panel would decrease the distance that the
reflected light has to travel, thus give stronger reflections in the windshield, figure 4.6.
Figure 4.6; Illustration of increasing IP-height An experiment was conducted where six different IP heights were examined. A fixed 75° sun
angle was used during the measurements. The pivot point of the lamp fixture were adjusted
carefully so that the light source was at the exact same distance from the point on the
instrument panel, which reflected light up to the windshield and into the luminance meter.
The experiment was repeated on both dark and light colored material samples and at two
different windshield angles. They all gave the same result; the height of the instrument panel
did not affect the amount of veiling glare at high sun angles.
4.4.2 DESIGN OF EXPERIMENT
Factorial design
To see which factors affect veiling glare the most, a full factorial design was performed. This
D.O.E. also showed potential effects of interactions between the different input factors. Each
factor was given a high and low level, table 4.1
Factor: Low level High level
AR-coating No Yes
Windshield angle 55° 70°
Sun angle 60° 80°
IP angle -10° +10°
L-value 18,5L* 70,5L*
Table 4.1; Factors to be tested in the factorial design
Incr
easi
ng IP
-hei
ght
Windshield

4 Realization 48
The design for the factorial test was created using the software MINITAB. The entire test was
repeated five times to get the standard deviation for each measurement. This enabled us to see
that certain factors and interactions had an effect which would otherwise have been seen as
noise. The test result was later analyzed using MINITAB.
Response surface design
With the results from the factorial design we could determine that three factors had the greatest
effect and those three were, windshield angle, lightness of the IP and AR-coating. The sun
angle and IP angle also showed small effects which could be explained by the movement
towards or away from the specular glare angle. During pre studies it was noted that the effect of
the windshield angle and the lightness of the IP showed a curvature surface. Because of the
combined results from the pre studies and the factorial design it was decided that response
surface design had to be conducted.
Two response surface designs were created in MINITAB, one for each type of windshield. The
intensity of lumination was added as a fifth factor. When adding this factor we got a global
model that would work with a broad range of light sources. The intensity of illumination was
set to a low and high level of 15000 lux and 45000 lux. The other factors were set to the same
low and high levels as in the factorial design, table 4.2.
Factor: Low level High level
Windshield angle 55 70
Sun angle 60 80
IP angle -10 +10
L-value 18,5 L* 70,5 L*
Intensity of illumination 15000 lux 45000 lux
Table 4.2; Factors to be tested in the response surface design With the results from the response surface design it was easy to create a model with Microsoft
Excel. In this model you could insert any values within the test range to each factor and then get
a resulting value of the reflecting luminance in cd/m2.

4 Realization 49
4.5SUBJECTIVE TESTING To find the acceptance level of veiling glare, a
survey was conducted. The study asked 50 people
to evaluate 20 material samples functioning as
instrument top panels with different shades of
grey. All participants were Volvo Cars employees,
evenly split between genders and divided into two
age groups to observe possible differences related
to age.
The test was conducted in the ergonomic lab,
where the subjects sat in a buck looking through
the windshield at a 65 inch projector screen
depicting four different road scenes. The
instrument panel angle was held constant at 8°.
The colors of the printed card boards which
represented the instrument top panel, ranged from very dark (L*=18) to fairly light (L*=70) with
matte gloss levels. The windshield angle was set to 62° which corresponds well with Volvo´s
present car fleet. A sunlamp mounted on a movable arm in front of the buck provided glare
producing light. The power of the sunlamp was set to 20000 lux (measured on the windshield
when the windshield angle was 55°) and it was positioned at an angle of 80° from the horizontal
plane, figure 4.7.
Prior to the actual study begun, a small pilot-study was conducted with four participants. This
was to ensure that the set-up work as planned and to have time to make small changes before
the actual study begun.
All participants were given a short introduction where the test leader read a short text (appendix
2) about the background and goal of the survey. The subjects were then instructed to adjust
their seat height to a level where they could see a line in the bottom of the projected image.
This ensured that all the participants’ eyes were positioned at the same height (around 120cm
above the floor level).
The subjects were asked to rate the acceptability of the level of glare produced by the different
material samples on a two-point scale: acceptable or unacceptable with road safety in mind.
They were instructed not to focus on what they thought were good or bad, but instead try to
locate the highest level of glare that still felt safe to drive with, in that particular road scene. The
test leader changed the different samples using the method of limits. Depending on if the
subject thought the glare was acceptable or not, the intensity level was either lowered or raised
until a maximum intensity level of glare could be determined.
Figure 4.7; The laboratory fixture with seat used in the survey.
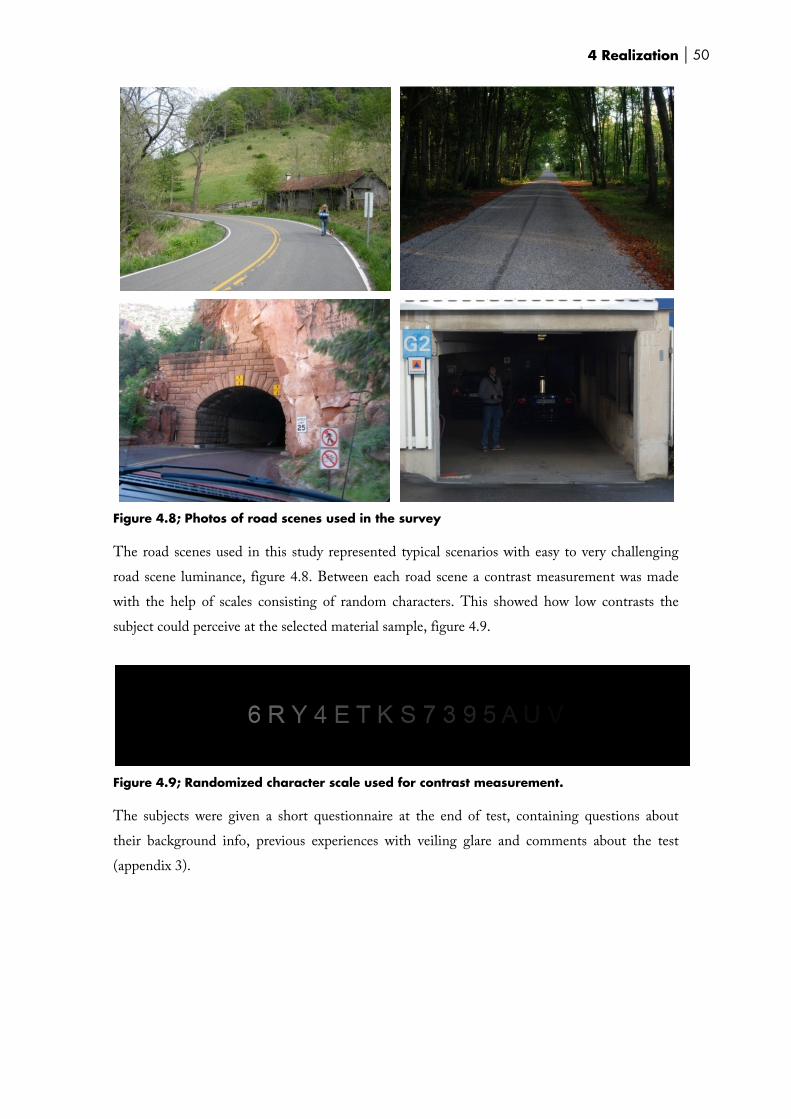
4 Realization 50
Figure 4.8; Photos of road scenes used in the survey The road scenes used in this study represented typical scenarios with easy to very challenging
road scene luminance, figure 4.8. Between each road scene a contrast measurement was made
with the help of scales consisting of random characters. This showed how low contrasts the
subject could perceive at the selected material sample, figure 4.9.
Figure 4.9; Randomized character scale used for contrast measurement. The subjects were given a short questionnaire at the end of test, containing questions about
their background info, previous experiences with veiling glare and comments about the test
(appendix 3).

4 Realization 51
4.5.1 BINEAR LOGISTIC REGRESSION From the subjective survey several things were analyzed such as differences between gender and
age groups. The most important information received from the subjective study was however
the acceptance levels for each road situation. Using this data, we could make a binary logistic
regression analysis where we got the curves and data that describes the acceptance level for each
road scene. The regression analysis was made with MINITAB trough the probability formula
4.1. The formulas could later be combined with the formula from the objective measurements
into a complete data model for predicting veiling glare luminance at high sun angles and
customer acceptance.
(4.1)
x
x
ee
•+
•+
+=
10
10
1 ββ
ββ
ρ

4 Realization 52

5 Results 53
5 RESULTS 5.1 OBJECTIVE TESTING During the first objective testing we could reduce the numbers of factors before the DOE was
carried out. The factors we excluded were:
• Gloss on the IP material
• Color of the IP material
• Height of the IP
5.1.1 DESIGN OF EXPERIMENT
Factorial design
The results from the factorial design, figure 5.1, showed that lightness had the greatest effect,
which could be explained by the big difference of the chosen low and high level of the lightness.
We could also see some interaction effects between lightness and both windshield angle and
AR-coating. Because the factorial test was done with five replicates it was possible to produce a
normal distribution for each setup. This led to the fact that every main factor effect and all the
interaction effects were significant and could not be ignored.
Term
Standardized Effect
BCDBDEACE
ADADEACD
DBCEABC
BCDEBCACDE
CCE
ABDCD
ABECDE
BDABAEBE
ABE
350300250200150100500
2,0
A AR-coatingB Windshield angleC Sun angleD IP angleE Brightness
Factor Name
Pareto Chart of the Standardized Effects(response is cd/m2, Alpha = ,05)
Figure 5.1; Pareto chart of the standardized effects received in the factorial design test. (The chart shows main factor and interaction effects. It also shows that all the factors have some effect because the staples are all greater than the line at 2.0 that can be seen in the top left corner.)
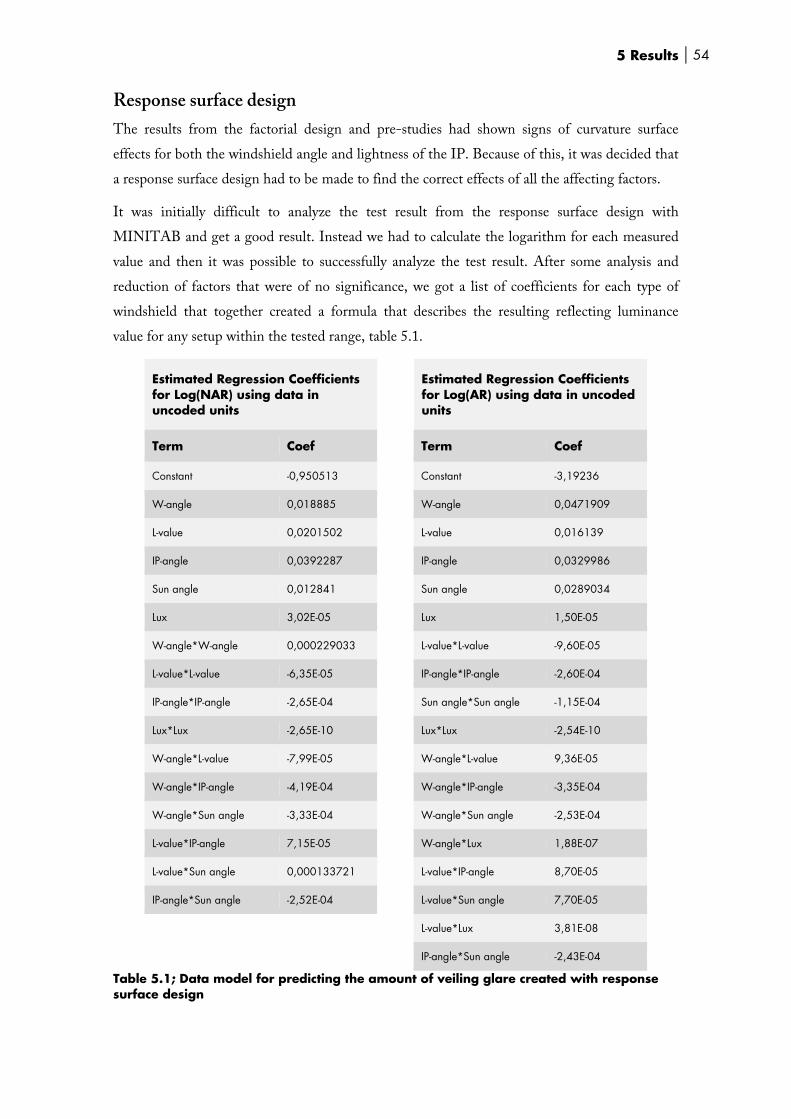
5 Results 54
Response surface design
The results from the factorial design and pre-studies had shown signs of curvature surface
effects for both the windshield angle and lightness of the IP. Because of this, it was decided that
a response surface design had to be made to find the correct effects of all the affecting factors.
It was initially difficult to analyze the test result from the response surface design with
MINITAB and get a good result. Instead we had to calculate the logarithm for each measured
value and then it was possible to successfully analyze the test result. After some analysis and
reduction of factors that were of no significance, we got a list of coefficients for each type of
windshield that together created a formula that describes the resulting reflecting luminance
value for any setup within the tested range, table 5.1.
Estimated Regression Coefficients for Log(NAR) using data in uncoded units
Estimated Regression Coefficients for Log(AR) using data in uncoded units
Term Coef
Term Coef
Constant -0,950513 Constant -3,19236
W-angle 0,018885 W-angle 0,0471909
L-value 0,0201502 L-value 0,016139
IP-angle 0,0392287 IP-angle 0,0329986
Sun angle 0,012841 Sun angle 0,0289034
Lux 3,02E-05 Lux 1,50E-05
W-angle*W-angle 0,000229033 L-value*L-value -9,60E-05
L-value*L-value -6,35E-05 IP-angle*IP-angle -2,60E-04
IP-angle*IP-angle -2,65E-04 Sun angle*Sun angle -1,15E-04
Lux*Lux -2,65E-10 Lux*Lux -2,54E-10
W-angle*L-value -7,99E-05 W-angle*L-value 9,36E-05
W-angle*IP-angle -4,19E-04 W-angle*IP-angle -3,35E-04
W-angle*Sun angle -3,33E-04 W-angle*Sun angle -2,53E-04
L-value*IP-angle 7,15E-05 W-angle*Lux 1,88E-07
L-value*Sun angle 0,000133721 L-value*IP-angle 8,70E-05
IP-angle*Sun angle -2,52E-04 L-value*Sun angle 7,70E-05
L-value*Lux 3,81E-08
IP-angle*Sun angle -2,43E-04
Table 5.1; Data model for predicting the amount of veiling glare created with response surface design

5 Results 55
This data model was verified within all the measured values for each factor. As suspected, the
data model proved to give accurate results outside the measured range for some of the factors
and new limits, describing within what range the data model is valid, were created, table 5.2.
Factor: Low level High level
Windshield angle 55 70
Sun angle 60 80
IP angle -12 +12
L-value 15 L* 75 L*
Intesity of illumination 15000 Lux 50000 Lux
Table 5.2; New limits for the data model
5.1.2 EFFECT OF AR-COATING One part of the project was to examine the effect of using an anti-reflective coated windshield.
This was done during the objective testing and the coated windshields’ ability to reduce the
reflections was found to be very good. A windshield treated with a single side AR-coating
decreased the reflecting luminance value with approximately 64%, compared to a regular
windshield. The reducing effect varies with different setups; Maximum effect is achieved when
the reflection angle is collinear with the normal of the windscreen. This never occurs but it's
important to note that the effect decreases with steeper windshield angles, figure 5.2.
Figure 5.2; Differences in reflecting luminance for windscreen with and without AR-coating at different windscreen angle and L-value
0
50
100
150
200
250
55 58,75 62,5 66,25 70
Ref
lect
ed lum
inance
(c
d/m
2)
Windscreen angle, degrees
050
100150200250300350400450
20,19 32,81 45,31 58,29 70,42
L-value, L*
Non AR
AR-coating

5 Results 56
5.2 SUBJECTIVE TESTING The questionnaire showed that 90% of the 50 participants drive a car each day and the
remaining 10% are driving at least 3-4 times a week. When the participants ranked their own
driving experience, the majority (52%) ranked themselves as very experienced drivers, 38% felt
they were experienced and the remaining 10% considered themselves to have an average driving
experience.
On the question about their previous experience of veiling glare, 90% answered, "Yes" and 93%
among these people had experienced it as irritating. The remaining 10% said that they never
had reflected on the problem of veiling glare with the dashboard reflecting up into the
windshield.
The chart below, figure 5.3, shows the resulting acceptance curves from the four different road
scenes in the survey. The first road scene, with the best road scene luminance, had clearly the
highest acceptance rate towards lighter IP-material samples. The second and third road scene
had quite similar acceptance levels and the fourth road scene, representing an extreme situation,
showed by far the lowest acceptance towards light IP-material, where several subjects desired a
darker material than the darkest material available in this survey.
Figure 5.3; The acceptance levels vs. lightness and luminance When you compare the results from the two age groups, no significant differences were
observed. The subjects in the age group above 50 years showed a minor reduced ability to
perceive low luminance contrast levels, but the difference was very small and it didn't have any
effect on the acceptance level for material lightness.
24 out of the 50 participants were wearing glasses during the test, but the result showed no
indication of glasses affecting the acceptance level or the ability to perceive low contrast levels.
When making comparisons between men's and women's acceptance levels, you see a tendency
for women consistently accepting a slightly lighter dashboard, figure 5.4. What this difference
depends on is difficult to answer, but observations during the tests showed that women had a
0,0%
20,0%
40,0%
60,0%
80,0%
100,0%
0,00 20,00 40,00 60,00 80,00
Acc
epta
nce
Lightness, L*
Acceptance vs. Lightness
0,0%
20,0%
40,0%
60,0%
80,0%
100,0%
0 100 200 300
Luminance, cd/m2
Acceptance vs. Luminance
Image 1
Image 2
Image 3
Image 4
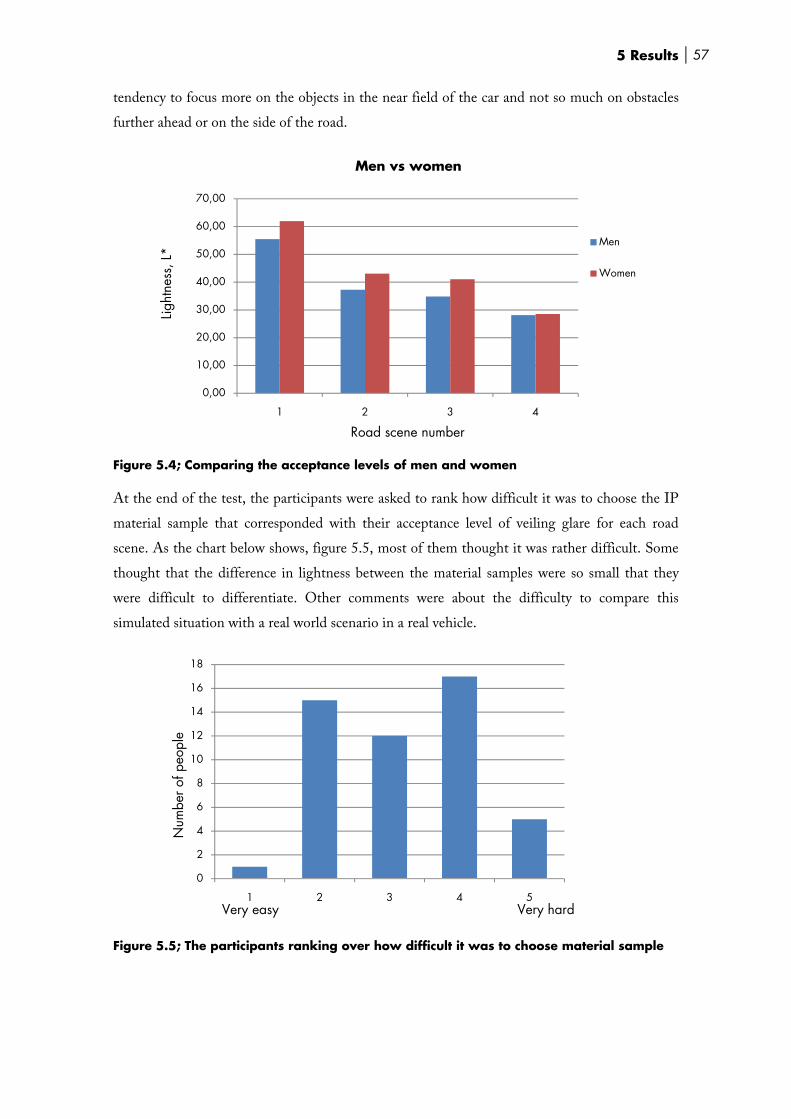
5 Results 57
tendency to focus more on the objects in the near field of the car and not so much on obstacles
further ahead or on the side of the road.
Figure 5.4; Comparing the acceptance levels of men and women At the end of the test, the participants were asked to rank how difficult it was to choose the IP
material sample that corresponded with their acceptance level of veiling glare for each road
scene. As the chart below shows, figure 5.5, most of them thought it was rather difficult. Some
thought that the difference in lightness between the material samples were so small that they
were difficult to differentiate. Other comments were about the difficulty to compare this
simulated situation with a real world scenario in a real vehicle.
Figure 5.5; The participants ranking over how difficult it was to choose material sample
0,00
10,00
20,00
30,00
40,00
50,00
60,00
70,00
1 2 3 4
Light
ness
, L*
Road scene number
Men vs women
Men
Women
0
2
4
6
8
10
12
14
16
18
1 2 3 4 5
Num
ber o
f peo
ple
Very easy Very hard
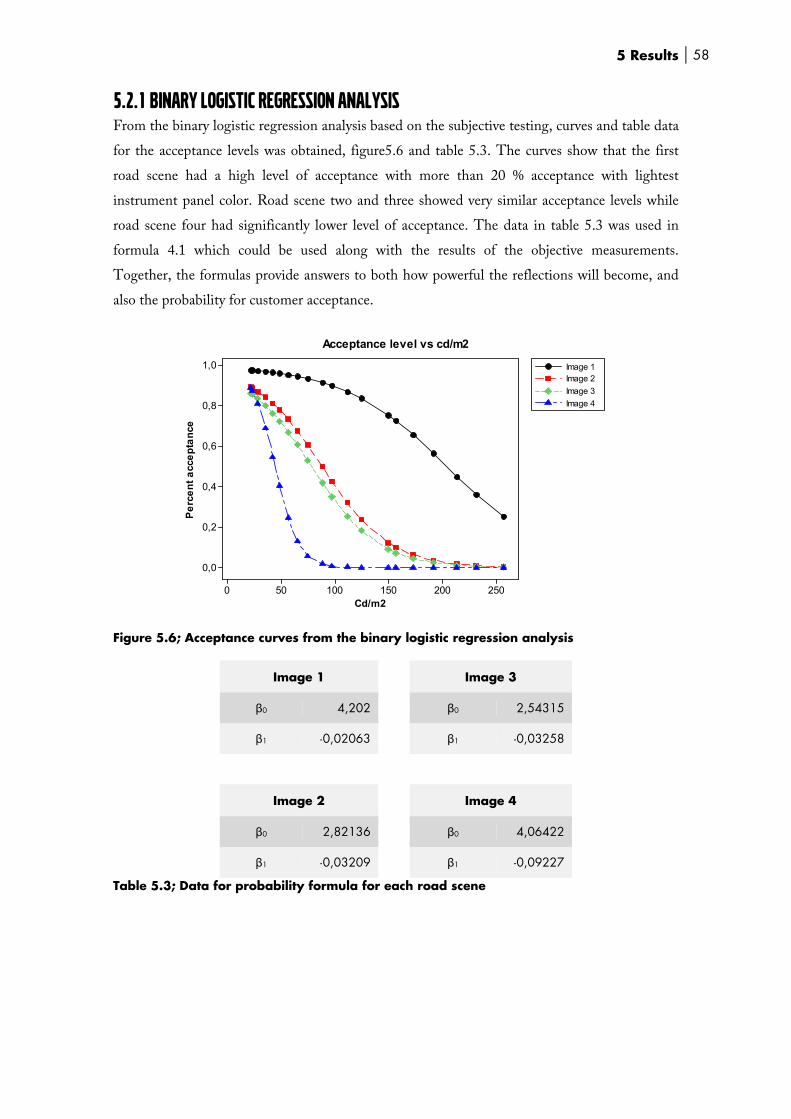
5 Results 58
5.2.1 BINARY LOGISTIC REGRESSION ANALYSIS From the binary logistic regression analysis based on the subjective testing, curves and table data
for the acceptance levels was obtained, figure5.6 and table 5.3. The curves show that the first
road scene had a high level of acceptance with more than 20 % acceptance with lightest
instrument panel color. Road scene two and three showed very similar acceptance levels while
road scene four had significantly lower level of acceptance. The data in table 5.3 was used in
formula 4.1 which could be used along with the results of the objective measurements.
Together, the formulas provide answers to both how powerful the reflections will become, and
also the probability for customer acceptance.
Cd/m2
Per
cent
acc
epta
nce
250200150100500
1,0
0,8
0,6
0,4
0,2
0,0
Image 1Image 2Image 3Image 4
Acceptance level vs cd/m2
Figure 5.6; Acceptance curves from the binary logistic regression analysis
Image 1 Image 3
β0 4,202 β0 2,54315
β1 -0,02063 β1 -0,03258
Image 2 Image 4
β0 2,82136 β0 4,06422
β1 -0,03209 β1 -0,09227
Table 5.3; Data for probability formula for each road scene

5 Results 59
5.3 SETTING NEW REQUIREMENTS The next step was to set an appropriate threshold for how strong the reflections are allowed to
be in the windscreen. This decision was going to be based on the acceptance levels attained from
the subjective survey, but how do you choose on an appropriate and balanced value?
To get some feedback and help with this matter, a meeting was held together with our
supervisor and other members from the department of Human factors engineering
&Ergonomics. The initial thought was to set a 60 cd/m2limit. This would result in a stricter
requirement than the current requirement. However, after some more debating about how to set
a good threshold value, a closer examination of the current requirements was initiated. Since the
idea is to use the new requirement as a compliment to the indexed veiling glare requirement, it
was decided that it should be set with the same presumptions (How this was performed in more
detail is classified information).

5 Results 60
5.3.1 COMPARING NEW AND OLD REQUIREMENTS When comparing the new limitations to the old maximum L-value requirement, you can see
that the new requirement is stricter. The difference is small at lower windshield angles but
increases more and more with steeper windshield angles, figure 5.7.
The difference depends mostly on the simplified linear formula used in the maximum L-value
requirement. Since the veiling glare phenomenon isn’t linear, but consists of several different
nonlinear factors, the current Requirement isn't very accurate.
Figure 5.7; Chart showing an example of the new requirements for max L-value, L*(Comparisons with the old max L-value formula is classified information) Another big difference is that the new requirement takes the IP-angle into account which
makes it a much more realistic model.
5.4 VEILING GLARE CALCULATOR To combine the results from the objective and subjective studies, a document was created in
Microsoft Office Excel, figure 5.8. This document contains a data model with all the data
formulas combined in to a complete model where you easily can calculate the amount of veiling
glare for any setup and also predict the level of acceptance for that setup. The document has a
user friendly interface and an easy to use navigation which contains four different tabs to choose
from depending on what type of calculation you want to do. The first green tab contains an
introduction of the document and information about the possibilities of the data model. The
second blue tab, named "L-value”, can be used to predict the highest allowable L-value to be
used on the instrument top panel. A yellow tab named "Acceptance" allows you to predict the
reflecting luminance value for specific setup. It also calculates the acceptance probability for four
different road scenes. The last pink tab named "Obj. measure" is used to analyze an objectively
measured reflecting luminance value and predict the customer acceptance levels.
25
30
35
40
45
50 55 60 65 70 75
Max
L-v
alu
e, L
*
Windshield angle, degrees

Figur
5.5 For o
measu
meth
physi
were
meth
predi
re 5.8; Imag
TEST METother people
urements an
hod was crea
ically measur
limited to t
hod can be u
ict customer
ges of the ve
THOD to later be a
nd analyze c
ated, append
re veiling gl
the same su
used together
acceptance.
eiling glare c
able to repea
competing c
dix 4. The
lare occurrin
un angles in
r with the ve
calculator in
at the experi
car models,
purpose of
ng in the win
which the
eiling glare c
n Microsoft O
iments that w
an instructio
this docum
ndshield. Th
objective me
calculator to
Office Excel
were carried
on, describin
ment was to
hese upcomi
easurements
o analyze me
5 Re
d out, making
ng our meas
describe ho
ing measure
were made
easured value
esults 61
g new
suring
ow to
ments
e. The
es and

5 Results 62
6 Discussion 63
6 DISCUSSION 6.1 METHOD AND WORKFLOW The work has been going well during the whole duration of the project, thanks largely to a
thorough project plan created at the beginning of the project. We also had weekly meetings
with our supervisors at Volvo, to follow up our progress and make plans for the coming weeks,
which helped us to stay on track.
Volvo gave us free hands on how we should approach the problem, which made us spend some
extra time to figure out what methods we should work with and exactly what we were going to
do. Once that was decided, we have managed to keep our time-plan very well throughout the
project and we were able to avoid an extra busy period at the end of the project.
As veiling glare is a very complex problem, we had to define the work and delimitate some
affecting factors such as material structure, curvature and details like split lines on the
instrument top panel. It would have been very interesting to investigate these factors impact on
veiling glare, but it would have been very difficult and take far too long to be achieved within
the time frame of this thesis work.
The methods we used to address the problem have worked very well. The use of quality tools,
such as design of experiments and binary logistic regression analysis have been a very effective to
investigate veiling glare and its influencing factors. It has also been very educational to learn
some of the theories behind these tools. The disadvantages of using new tools and methods have
been the dependence on assistance in various phases of the project. However, this has not been a
major problem, since all people involved in this project have been very enthusiastic and
interested in helping us.
6.2 OBJECTIVE MEASUREMENTS The objective measurements were carried out over a longer period of time than planned from
the start. The reason for this were the need to examine and learn the best way to measure veiling
glare in laboratory environment, before the actual measurements could be initiated. We had a
big advantage in that there already existed a laboratory fixture in the ergonomic lab, which after
some small adjustments and improvements could simulate the elements and relationships
between the affecting factors of veiling glare.
When adjusting the fixture, it was very important to set all the angles and geometric
relationships as accurately as possible to get accurate results. Sometimes, this proved to be rather
difficult and very time consuming. One of the toughest was the windshield angle adjustment,
who had to be set with an accuracy of one tenth of a degree in order to get precise results.

6 Discussion 64
We struggled a lot when we tried to examine the effect of color on veiling glare. It proved to be
very difficult to get printed color samples with the exact same lightness value. What looked
good in an image processing program didn't look very good when printed on a high grade inkjet
color printer. We tried to compensate the differences on the computer, but it was very difficult
to get a perfect result. To solve the problem we examined the possibility of obtaining
professionally painted material samples with accurate color and gloss values, but it turned out to
be far too expensive to justify a purchase. We were simply forced to compromise and use the
best samples we had managed to produce by using the inkjet color printer.
During the objective measurements, we had great use of the computer program Minitab, which
facilitated the work to plan, implement and analyze our design of experiments. We are very
pleased with the results of these measurements, which gave small standard deviations and an
explicit result. It gave us a reassurance that our lab set-up measuring method worked very well
and gave consistent and repeatable results. If you look at what could have been done better,
performing the measurements more randomized and cover a wider span for each affecting
factor, especially for IP-angles, are two examples. Doing this would have improved the resulting
data model.
We were very impressed by the AR-coated windshield. The fact that the coated windshield
reduced the strength of the reflexes by 60-75 percent creates all new pre-requisites for the
designers when choosing windshield rake angles and the lightness of the car interior. The big
drawback is the relatively high cost to add an anti-reflective coating to the windshield and the
possibility that it may reduce the functionality of a head-up display since these reflections would
also be reduced. We do believe that Volvo Cars should introduce AR-coated windshield as an
option, so that the customer bears the cost.
6.3 SUBJECTIVESURVEY The subjective survey gave us a great deal of valuable information to develop a new requirement
for how strong the reflections are allowed to be. Test subjects thought it was fun to participate
in the study and many stayed afterward to discuss experiences and solutions to the problem.
The implementation of the subjective survey worked as planned. The pilot studies gave us the
chance to detect small problems and the chance to adjust them before the real study began. We
see this as evidence that careful planning and preparation gives good results.
It was difficult to figure out how strong the light intensity from the sun lamp should be to
simulate a sunny day near the equator. We understood early on that it was a big difference
between making luminance measurements indoors in the lab environment, compared to
outdoors. We couldn't find any information on how strong a lamp in the laboratory
environment should be to resemble real sun light. Instead, we had to make a reasonable

6 Discussion 65
approximation with the help of the staff of the ergonomic department. It resulted in a light
intensity of 20,000 lux. We knew that our computer model from the objective measurements
could compensate the light intensity if it would turn out that our approximation was dead
wrong, but still, we wanted to create the best possible set-up.
Another problem was the printed paperboards that represented the instrument top panel. The
darkest samples showed a hint of horizontal stripes all over the print which could have been
irritating and disturbing for test subjects when choosing the shade of grey that corresponded to
their acceptance level. The problem was minimized by simulating an 8-degree instrument top
panel angle, but result was not perfect.
6.3.1 SOURCE OF ERRORS As always with simulator tests, the result may be questioned when the feedback from the
simulator differs noticeably from a real world situation. Something that many of the participants
commented on was the lack of speed sensation, which made it harder to interpret the road
scene.
When you look at the result, it’s relatively univocal on the easiest and most difficult road scene.
However, the result from road scene two and three was rather differential. Some subjects
demanded a very dark dashboard to rank it as acceptable, while others thought it was all right
with a relatively light panel.
We thought our four road scenes were self-explaining, but perhaps these large differences could
depend on the difficulty of to interpret the road scenes. It might have been a good idea to use
more detailed scenario explanations like: You’re driving on a narrow forest road at a speed of
70km/h, is the vision good enough for you to feel safe?
Another factor that may affect the outcome is the type of roads the test person usually drives on.
The majority of the test group was likely to live in Gothenburg city, where you mostly drive on
highways and city streets. Perhaps this type of driving doesn’t need as much attention and
caution as countryside driving where animals suddenly can come up on the road.
6.4 SETTING NEW LIMITATIONS It was really hard to figure out the best way to set a new limit for how strong the reflections are
allowed to be in the windshield. We had to take a long discussion with our mentors and the
other employees in the ergonomics group and debate the matter. We think the end result of this
discussion, to use the same presumptions as they used during the development of the indexed
veiling glare requirement, was the best possible solution since they are supposed to compliment
each other.

6 Discussion 66
6.5 VEILING GLARE CALCULATOR We have tried to make the veiling glare calculator as easy to use as possible. Based on the
feedback from our mentors and other personnel at Volvo, we think that we have succeeded. It
could have been possible to do the veiling glare calculator even more easy to use and intuitive by
using Adobe Flash or other software with abilities to use animations and other advanced
features. The reason why we decided to use Microsoft Excel is that it is very well known and
familiar to most of the future users.
The calculator is constructed in a way that makes it very flexible for future changes. For
example, if Volvo realizes that stricter requirements are needed, they can implement these
changes to the computer model with very little effort.

7 Recommendations 67
7 RECOMMENDATIONS In order to refine and validate the data model developed in this thesis, Volvo should examine
and compare the light intensity between the lab and outdoor environment, using the same
veiling glare rig in both environments. This should be done in an environment located close to
the equator where the sun angle is about 80 degrees during the summer. The data model created
in Microsoft Office Excel is created in a way that makes it easy to adjust and fine-tune as more
data is collected. The result from doing this will give a more accurate and validated data model.
We think Volvo should try to add more factors to the model to make it more complete. There
could also be a need to enlarge the span for where the model is valid. This thesis was
delimitated from factors such as material structure, different shapes &details etc. These factors
would be interesting to investigate through objective measurements but also with subjective
evaluations to explore how customers perceive them.
Color is another factor that should be subjectively investigated. Our objective measurements
didn’t show any significant change in the amount of veiling glare depending on colors, but
maybe the customers perceive different colors as more or less irritating?
Today, several requirements and models are in use to control the amount of veiling glare. We
think that Volvo should try to incorporate all of them into one final requirement/model, which
takes all factors into account at all sun angels. We believe this is achievable through the use of
design of experiments, provided that you have good samples of material to perform
measurements on. It will not be easy and uncomplicated, but the outcome would be well worth
the effort.
The single sided AR-coated windscreen used during the objective measurements were produced
sometime around 2004-2005. As our measurements shows, it proved to be very effective on
reducing the amount of veiling glare and it would be interesting to investigate the development
in the field of anti-reflective coatings. Are there even more effective AR-coatings available
today? How much better is a double layered/sided coating? The predicament of using an anti-
reflective windshield in earlier years has been high cost, but how expensive is the technique
today? These are subjects that we think should be investigated.
During our information gathering we came over several online message boards discussing the
problem of veiling glare and possible solutions. Apparently polarized glass lenses are very
effective at removing veiling glare. This gave us the idea of using polarized windshields. Is it
technically feasible? How expensive is the technique? There is much to investigate.
When we conducted our subjective survey, we discussed possible solutions to the veiling glare
problem with some of the participants. One idea that came up was to create an instrument top
panel that changed color depending on angle of view. The idea is that from the drivers’ point of

view,
and/o
the co
Figurdepen
By ad
effect
desire
be cre
Figur
the panel c
or in front o
oncept to ch
re 7.1; Examnding on the a
dding small
t could be cr
ed interior c
eated to see i
re 7.2; Sketc
can appear to
f the instrum
ameleon car
mple of MLI angle of view
triangle shap
reated, figure
olor. We thi
if it’s feasible
ch of triangl
o be white (
ment panel,
paint or mu
print used o
ped strips, c
e 7.2. One si
ink it was an
e.
le shaped st
Black
or any other
it looks blac
ltiple laser im
on Swedish
covering the
de is painted
n interesting
trips on the
Interior col
r color of ch
ck, to reduce
mages, MLI,
drivers licen
entire instru
d black and t
idea and th
instrument
lor
7 Rec
hoice), but fr
reflections.
, figure 7.1.
nses. Differen
ument top p
the other sid
ink a simple
panel
commenda
rom a point
You can com
nt pictures are
panel, perhap
de is painted
e prototype s
ations 68
above
mpare
shown
ps this
in the
should

References 69
REFERENCES Books
Bergman, B., Klefsjö, B. (2007). Kvalitet, frånbehov till användning. Studentlitteratur AB.
Macmillan, N.A. Creelman, C.D.(2004). Detection Theory: A User's Guide. Routledge.
McGraw-Hill (2008). Concise Encyclopedia of Bioscience. McGraw-Hill Education.
Nyman. KG., Spångberg, O. (1996). Synen, ögat, arbetet. Futura, Statshälsans FoU verksamhet
Rodgers, S. (1983). Ergonomic design for people at work. John Wiley & Sons.
Ruth, W. (1999). Synergonomi. Ergonomisk design & produktion, Arbetsvetenskap. LTU
Starby, L. (2006). En bok om belysning. Ljuskultur
Trost, J. (2001). Enkätboken. Studentlitteratur AB.
Internet sources
Essilor, www.essilor.com/OurBusiness/ResearchAndDevelopment.htm, (2008-09-02)
How Stuff Works, http://science.howstuffworks.com/question615.htm (2008-09-02)
MiC Quality Six Sigma Glossary,
http://www.micquality.com/six_sigma_glossary/response_surface_designs.htm, (2008-10-16)
Minitab, www.minitab.com, (2008-11-13)
Nationalencyklopedin, http://www.ne.se.proxy.lib.ltu.se/artikel/115895, (2008-09-02)
The Dimensions of Color, http://www.huevaluechroma.com/081.php, (2008-09-10)
Volvo Cars Corporation, www.volvocars.com, (2008-09-05)
Xerocoat, http://www.xerocoat.com/Anti-Reflective-Coatings.aspx, (2008-09-03)
Articles
Mefford, M.L., Flannagan, M.J., Adachi, G. (2003). Daytime veiling luminance from
windshields: Effects of scattering and reflection, Transportation Research Institute, University of
Michigan.
Sauter, J.L., Bow, N., LaDriere, L., Parman, S.C. (1992). The effects of Instrument Panel Top
Color and Windshield Angle on Veiling Glare.SAE Technical paper series, 920105.
Schumann, J., Flannagan, M.J., Sivak, M., Traube, E.C. (1997). Daytime veiling glare and
driver visual performance: Influence of windshield rake angle and dashboard reflectance. Journal of
Safety Research, Volume 28, No. 3.

References 70
Unpublished material
Core Vehicle Package and Ergonomics Department. (2005). Technical rapport for the Veiling
Glare ,Ford Motor Company, USA
Hallén, A. (2007). Relation between windscreen angle and instrument top panel L-value. Volvo
Cars Corp.
The Department of Human Factors Engineering & Ergonomics. (2003). Veiling Glare at High
Sun Angle: Results from Arizona Survey.

Appendix 71
APPENDIX Appendix 1 – Project plan and Gantt chart (2 pages)
Appendix 2 – Subjective survey introduction (1 page)
Appendix 3 – Subjective survey questionnaire (2 pages)
Appendix 4 – Test method instruction (1 page)

Appendix 72
APPENDIX 1 – PROJECT PLAN AND GANTT CHART, PAGE 1/2
PROJECT PLAN, VEILING GLARE
Background
Cars are today more and more designed to have a "dynamic" expression with further raked windshields
and the designers also wants to have the opportunity to use brighter colors in the interior. This can lead
to unwanted consequences in the form of reflections of the dashboard in the windshield, a phenomenon
called Veiling Glare. It's important to know what level of windshield rake, lightness, shine and shape of
the dashboard is acceptable to secure that the reflections doesn't interfere with the driver. To know what
improvements can be made by using windshields with an anti-reflective coating. A number of demands to
control some of these parameters exist to a certain degree but there are no considerations of the big
picture.
Purpose
Describe a measurable requirement that correlates with customer expectations and makes allowances for
different positions and angles of the light source, windshield and dashboard and the windshields
characteristics like anti-reflective coating. The requirements should also be expressed with the possibility
to define limitations to the dashboard material attributes like lightness and shine.
Aim
The aim with this thesis is presented in the following paragraphs:
• Develop a measuring method in laboratory environment and study what factors (and how these
factors) affect the amount of veiling glare in the windscreen at high sun angles.
• Validate the method with known cases
• Use the developed method together with subjective evaluation to determine the lowest level of
acceptance for veiling glare
• Develop demands expressed in maximum lightness tied to geometrical properties between the
windshield and the dashboard.
• Compare the newly developed demands the current ones existing. Are there any differences, if
so, why?
Delimitations
This work has been limited to only investigate veiling glare at high sun angles that appears in the
windshield of the car. The work will not consider different material structures, curvature and details on
the dashboard like split lines and defroster grills.

Appendix 73
APPENDIX 1 – PROJECT PLAN AND GANTT CHART, PAGE 2/2
Final P
resenta
tion
Thesis w
riting
Com
pare n
ew a
nd
old
requirem
ents
Analy
ze data
and
defin
e requirem
ents
Subjective
mea
surem
ent
Objective
mea
surem
ent
Presen
tatio
n
Valid
ate m
ethods
Develo
p m
ethods o
f m
easu
ring
Gath
er info
rmatio
n &
m
ateria
ls
Pro
ject pla
nnin
g
36
37
38
39
40
41
42
43
44
45
46
47
48
49
50
51
52
1
2
3
4

Appendix 74
APPENDIX 2 – SUBJECTIVE SURVEY INTRODUCTION, PAGE 1/1
Välkommen!
Tack så mycket för att Ni ställer upp och deltar i denna klinik. Kliniken ingår i vårt
examensarbete på ergonomiavdelningen där vi tittar på veiling glare vid höga solvinklar.
Målet med kliniken är att lokalisera vart acceptanströskeln ligger för veiling glare genom att
testa olika ljusheter på instrumentpanelen.
Veiling glare är fenomenet när instrumentpanelens ovansida reflekteras upp i vindrutan och stör
sikten ut. Detta problem blir som störst en solig dag, då man kör i riktning direkt mot solen och
bakgrunden är mörk. Veiling glare vid höga solvinklar påverkas i huvudsak av
vindrutelutningen, ljusheten på instrumentpanelen och glasets egenskaper.
Ni kommer att få se fyra olika vägscener med olika svåra ljusförhållanden. Tanken är att ni skall
välja ut en ljushet på instrumentpanelen för varje vägscen som motsvarar din gräns för
acceptabel nivå av spegelreflexer i vindrutan. Vi vill alltså inte fokusera på vad som är bra och
dåligt, utan vi vill få reda på hur pass ljus instrumentpanelen kan vara för att du fortfarande skall
kunna framföra fordonet på ett säkert sätt.
Efter varje vägscen kommer en kontrastmätning göras med hjälp av två skalor med bokstäver.
Detta gör vi för att få reda på hur pass låga kontraster du kan uppfatta vid den valda ljusheten av
instrumentpanel.
Tänk på att det är gott om tid, så Ni behöver inte stressa. Observera också att användartestet
INTE mäter Er prestation på något vis, utan detta är en helt subjektiv bedömning.

Appendix 75
APPENDIX 3 – SUBJECTIVE SURVEY QUESTIONNAIRE, PAGE 1/2
Frågeformulär
1. Kön Man
Kvinna
2. Ålder 20-29 år 40-49 år
30-39 år 50-59 år
60 år eller äldre
3. Har du någon syndefekt? Ja:
Använder: Linser Glasögon
Nej
4. Hur länge har du haft körkort?
5. Hur ofta kör du bil? Varje dag
4-6 ggr/vecka
1-3 ggr/vecka
Mindre än 1 gång per vecka
6. Körvana (5 betyder mycket god körvana) 1 2 3 4 5

Appendix 76
APPENDIX 3 – SUBJECTIVE SURVEY QUESTIONNAIRE, PAGE 2/2
7. Har du tidigare erfarenhet av reflektioner i vindrutan under bilkörning?
8. Om ja, upplevde du detta som irriterande? På vilket sätt?
9. Hur svårt var det att bedöma vilken ljushet som motsvarade er gräns för acceptabel nivå av veiling glare? (1 är mycket lätt och 5 är mycket svårt)
1 2 3 4 5
Kommentar:
10. Övriga kommentarer

Appendix 77
APPENDIX 4 – TEST METHOD INSTRUCTION, PAGE 1/1