Vehicle to Vehicle Communication -...
63
I Vehicle to Vehicle Communication Desart Bregasi Supervisor: Dr. Andrzej Ordys MSc Adv. Product Design Engineering Jan 2012
Transcript of Vehicle to Vehicle Communication -...

I
Vehicle to Vehicle Communication
Desart Bregasi
Supervisor: Dr. Andrzej Ordys
MSc Adv. Product Design Engineering
Jan 2012

II
Faculty of Engineering, Kingston University
Synopsis
This dissertation presents the research that has been done on Vehicle to Vehicle (V2V)
Communication – Negotiating the order of crossing in a crossroad. This research shows
what the situation nowadays in the streets is and explains briefly the meaning of V2V-V2I-
V2X Communication. It explains the achievements of different scientists and companies
around the world and the tools they used for it. Also, in the literature review can be found
more information’s about what technologies is V2V Communication using and what is
expected to be used in the future. This research investigates, test and simulate the way that
vehicles arrive in a crossroad and achieve to communicate with each other by using WiFi
technology. WiFi technology gives them the ability to send the information’s required so
that the order of passing the crossroad can be sorted very quickly. The order of passing has
been sorted out by calculating the time that the vehicles need to reach the crossroad. The
vehicle that has the smallest time to reach the intersection gets the order to pass first and so
on. The vehicle control system of the V2V Communication does not allow the driver to
control the wheel. The algorithm for security reason takes control of the vehicle and allows
the driver to turn the wheel only in the direction that he (or gps) has given to the system.
To develop this research V-Model for software development has been used. This
dissertation was completed mostly by following the steps that were described on V-Model.
Some of the difficulties that were found with the software limits changed the initial limits
but improved the experience that was gained by trying to make this two software’s
(LabView and SolidWorks) to work with each other. The simulation is done by using
LabView with the all the data required and controlling SolidWorks to show us the model
reactions. From the test-simulation the result was that this technology is going to reduce or
even eliminate the accidents in intersections or even in all the streets.

III
Acknowledgements
Since when the vehicles became came out in the streets, the accidents started to happen.
Most of the times the accidents happens because of the fact that humans make many
mistakes in their decisions, and this mistakes sometime are paid very expensive even with
human life. Many companies and researchers around the world are trying to come up with
the first prototype, but still there is a lot to do.
In this dissertation you are going to see the implementation of the simulation when
vehicles reach a crossroad and start negotiating the order of passing with each other.
This thesis gave me the ability to learn what is LabView, how does it works, how to solve
problems, what is V2V communication and what are the abilities of it and where has the
technology reached until now.
I would like to thank my supervisor Prof. Andrzej Ordys for his support from the
beginning of this project and my family that has always been there for me when I needed
them.
Desart Bregasi
January 2012

IV
Notations
V2V: Vehicle to Vehicle Communication
V2I: Vehicle to Infrastructure Communication
V2X: Vehicle to pedestrians + V2I + V2V Communication
DSRC: Dedicated Short range Communication
CAS: Collision Avoidance System
OBU On Board Unit
WAVE: Wireless Access in Vehicular Network
DSRC: Dedicated Short Range Communication
RFID: Radio frequency Identification
HALL: High Availability and Low Latency
GNSS: Global Navigation Satellite System
GPS: Global Positioning System]
CWSS: Collision Warning Support System
VI: Virtual Instruments
1
Kingston University – V2V Communication
Contents Synopsis ................................................................................................................................ II
Acknowledgements ............................................................................................................. III
Notations .............................................................................................................................. IV
Abstract .................................................................................................................................. 5
1. Introduction ................................................................................................................... 6
1.1 Accidents in the streets ........................................................................................... 6
2. Aims and objectives ...................................................................................................... 7
2.1 Aims ........................................................................................................................ 7
2.2 Objectives ............................................................................................................... 7
3. Literature review ........................................................................................................... 8
3.1 Introduction ............................................................................................................. 8
3.2 V2V Communication .............................................................................................. 8
3.3 Collision Avoidance (CA) ...................................................................................... 9
3.3.1 Collision Avoidance using Agilent VEE ....................................................... 10
3.4 What is CompactRIO? .......................................................................................... 10
3.5 Waiting time and retransmission delay ................................................................. 11
3.6 Proposed National ITS Architecture (Subir, et al., 2006) ..................................... 12
3.7 Algorithm .............................................................................................................. 12
3.7.1 IEEE 802.11p ................................................................................................ 13
3.7.2 WiMAX ......................................................................................................... 14
3.7.3 VANET (Vehicular ad hoc Networks) .......................................................... 15
3.8 Software ................................................................................................................ 16
3.8.1 NI Labview .................................................................................................... 16
3.8.2 SolidWorks .................................................................................................... 17
3.8.3 Union of LabVIEW and SolidWorks ............................................................ 17
3.8.4 Software used ................................................................................................ 18

2
Kingston University – V2V Communication
3.8.5 Why SoftMotion? .......................................................................................... 20
3.9 Architecture and evaluation of a unified V2V and V2I Communication system
based on cellular networks .............................................................................................. 21
3.10 Results ............................................................................................................... 22
3.11 Business Benefits .............................................................................................. 22
4. Research Methods and Scenario .................................................................................. 22
4.1 Scenario ................................................................................................................ 23
4.2 V-Model in Software Development ...................................................................... 24
4.3 Research strategy .................................................................................................. 24
4.4 Limitations and Potential Problems ...................................................................... 33
4.4.1 Labview limitations ....................................................................................... 33
4.4.2 SolidWorks limitations .................................................................................. 34
4.5 Test and verifications ............................................................................................ 35
5. Simulation .................................................................................................................... 37
5.1 Software Setup ...................................................................................................... 37
5.1.1 SolidWorks .................................................................................................... 37
5.1.2 LabView ........................................................................................................ 40
5.2 Scenario ................................................................................................................ 45
5.3 Simulation ............................................................................................................. 46
6. Discussion and conclusion .......................................................................................... 50
6.1 Recommendations: ................................................................................................ 51
7. Future work ................................................................................................................. 51
Bibliography ........................................................................................................................ 53
Appendix-A ......................................................................................................................... 58
3
Kingston University – V2V Communication
Table of Figures
Figure 1: V2V and V2X Communication. (Strang & Rockl, 2009) ...................................... 9
Figure 2: Schematic diagram for hardware loop . (Joseph, 2010) ....................................... 10
Figure 3: Schematic diagram for the final test. (Joseph, 2010) ........................................... 10
Figure 4: Vehicle dynamics for developing controllers for vehicle safety. (Margolis &
Taehyun, 2000) .................................................................................................................... 11
Figure 5: Quarter car model (Creed, et al., 2010) ................................................................ 11
Figure 6: Waiting time and retransmission delay. (Xue, et al., 2004) ................................. 11
Figure 7: Proposed national ITS architecture. (Subir, et al., 2006) ..................................... 12
Figure 8: Example of insertion sort algorithm. Right: algorithm written on C Language,
Left: The output results of the algorithm. (Skiena, 2008) ................................................... 12
Figure 9: Denso DSRC platform. ........................................................................................ 13
Figure 10: Performance comparison when transmitting over Suburban Street. (T.M., et al.,
2011) .................................................................................................................................... 14
Figure 11: Details and information’s of how a VANET works. (Ho Ting, et al., 2010) ..... 15
Figure 12: Axis Configuration dialog window. ................................................................... 18
Figure 13: Flow chart of the developing procedure. ........................................................... 20
Figure 14: V-Model with the description of the stages. (Chou, 2010) ................................ 24
Figure 15: Main unit connected with Gps and WiFi. .......................................................... 25
Figure 16: Architect of data flow algorithm. ....................................................................... 26
Figure 17: Acceleration and deceleration control of the vehicle. ........................................ 28
Figure 18: Gear control algorithm of the vehicle. (Values from (Fischer, 2006) ................ 29
Figure 19: Flow chart of controlling the steering angle and the velocity of the vehicle. .... 30
Figure 20: Priority flow chart. ............................................................................................. 32
Figure 21: Figure explanation of the 2sec rule. (RSA, 2007).............................................. 33
Figure 22: 3D ContentCentral toolbox for online available 3D models.............................. 35
Figure 23: The first revision. From the whole 3D vehicle model ended up to one 3D tire.
Vehicle (Miller, 2010) and tire (Allenbaugh, 2008) ............................................................ 36
Figure 24: The simple 3D wheel model designed for the need of the simulation. .............. 36
Figure 25: 3D model of the tire. The hole informs us if the tire is turning or not. .............. 37
Figure 26: Motor window with the surface selected. .......................................................... 38
Figure 27: steps on how to enable SolidWorks Motion Add-in. ......................................... 38
Figure 28: Motor for turning left-right is selected. .............................................................. 39

4
Kingston University – V2V Communication
Figure 29: Checking if the tire moves by selecting the "Move Component" tool. .............. 39
Figure 30: My Computer Properties. Enable the "Start Scan Engine on Deploy". ............ 40
Figure 31: Axis configuration window. ............................................................................... 41
Figure 32: Project Explorer window after configuration ..................................................... 41
Figure 33: Explaining the LabView front panel .................................................................. 46
Figure 34: Adding the values of the scenario and running the simulation by pressing the
"Run" button. ....................................................................................................................... 47
Figure 35: Simulation after reaching the destination........................................................... 48
Figure 36: Trying to turn the steering wheel while the vehicle is still far from the target. . 48
Figure 37: Simulation of the vehicle in the crossroad commanding the tire. ...................... 49

5
Kingston University – V2V Communication
Abstract
Vehicle to Vehicle (V2V) Communication is of growing concern the last years because of
the safety and the abilities it can provide to the drivers in the future. Despite of the fact that
there have been many spare researches around the world, there is a joint effort from the
universities (researchers) and the car companies to come up with a final conclusion the
next years. This dissertation focuses on ways that the vehicles in a crossroad establish
communication and negotiate the order of crossing by giving commands to control the
vehicle to change speed (if needed) or accelerate. This dissertation met this research aims
through an extensive study of relevant literature and the implementation of visualization
and simulation. The findings from the research provided us with evidence that there have
been a lot of results on V2V Communication but very little things done on communication
and negotiation of the order of passing in a crossroad but also the ability to control the
vehicle control system so that the car can accelerate or change speed if it is necessary.
Most of the papers were based on V2X (Vehicle to Infrastructure) Communication to
establish communication between the different vehicles in the range area. The main
conclusions drawn from this research were that by using LabView software and
SolidWorks it was possible to do the simulation and visualization of our model-scenario.
Of course, there were some limitations that have to do with SolidWorks and LabView that
made us simplify the code entered in the algorithm, as it was not possible to run it using
C++ but only C. This dissertation recommends for the future more values and variables
should be taken into consideration so that they combine the communication, negotiation
and vehicle control system and have realistic results.

6
Kingston University – V2V Communication
1. Introduction
If the wheel hadn’t been discovered thousands of years ago (invented in Asia 8000 years
ago) the transportation and our life would had been very different nowadays. If you could
just imagine what a revolution it was for the humans to replace the rollers that they used
beneath heavy objects into wheels. The first wheeled vehicles were inspired from the
plough and were evolved probably in Sumer (Uruk period, 3000BCE). By 1500BCE the
Egyptians created lighter chariots but stronger and faster. (Publishing, 2009)
After the gap of all this thousands of years, it was the time for a catholic priest (Father
Ferdinand Verbiest-1687) to invent the first car in the world. Because of the fact that the
first car was very heavy and powered by steam it could not be used widely. (Firstcarnow,
2009). Since then, many things have changed including their shape, weight and technology
used. Our lifestyle and the transportation would have been totally different today if these
technologies hadn’t been evolved by time. But at the same time with the development,
problems were caused as well. One of the most important problems is the accidents caused
in the streets and taking many people’s lives and leaving behind many seriously injured.
1.1 Accidents in the streets
When the cars started to be used widely, the first problems and accidents started to appear.
The world’s first ever death by car happened in Croydon (August 17th 1896-UK) with a
pedestrian woman. She was hit from a car travelling at 4mph when she stepped off the
kerb. (Shadyoldlady, 2012). Since then, the volume of the vehicles in the streets has been
increased dramatically but the security of the vehicles is still causing lots of pain to the
people around the world. Thousands of people lose their lives every year in every corner of
the planet. Nowadays the technology is there and many scientists around the world are
cooperating on finding ways on how to improve the safety of vehicles and minimize the
crash possibilities. The different technological aspects that are necessary to achieve it
already are there, the only thing left is to gather these technologies and make them interact
with each other. The main technologies mentioned above are WiFi, Gps and vehicle
control system. Hopefully, the next two years this technology comes out in the market for
every vehicle, so that the next generations will not know what “road traffic accident”
means.

7
Kingston University – V2V Communication
2. Aims and objectives
2.1 Aims
In this project, the aim is to manage to prevent the collisions that occur at intersections
between vehicles so that the accidents can be reduced as much as possible. The vehicles
will communicate with each other by using wireless communication technology before
they reach the intersection (in the range the wireless can reach). The order of crossing of
the vehicles will be sorted out as soon as the scanned vehicles in the area have sent their
signal and necessary information’s and it will be updated all the time so that in case that
another vehicle get in the cross-road the values and the order of crossing can be calculated
again.
2.2 Objectives
To achieve all the above, the following objectives have to be satisfied:
Understanding the need of V2V Communication technology
Extensive literature research in all the aspects
What are the sensor networks
Understanding and learning LabView and SolidWorks and how they both can be
linked to work together (by using SoftMotion tool)
Development of scenarios
Developing and testing the algorithms that are going to be used
Developing simulation of the scenario

8
Kingston University – V2V Communication
3. Literature review
3.1 Introduction
Almost all of the people drive a car or motorbike nowadays. Safety in the streets is
something that affects all of us, because many people have been witnesses of a tragic
accident with fatal consequences for the persons who were driving the vehicles. V2V
Communication is an upcoming technology that is going to change our experience as
drivers; it is going to improve in a large scale the safety of the drivers (or pedestrians). The
vehicles will become “smarter” and will be able to make decisions for the drivers before
they even think of it. V2V Communication is a very large area to study, so many scientists
around the world have worked on the last years in different topics and a lot of progress has
been done. Although the literature review of V2V Communication covers a wide range,
this review will be focused on moment when the vehicles arrive at the cross-road, how they
will establish communication and negotiate the order of crossing without the need of the
traffic lights and in the technologies that will make this possible (Wireless connection,
Algorithm, On Board Units etc). One of the first things we need to explain and start with is
the question “What is V2V Communication”?
3.2 V2V Communication
Vehicle to Vehicle (V2V) communication is a new technology that refers to the ability of
the different vehicles to communicate with each other in purpose of avoiding collisions
(Yamao & Minato, 2009). In V2V Communication the safety of the driver and passenger’s
is improved because of the fact that the vehicles exchange real-time information’s about
the vehicle reactions and the road condition (Soheila & Pravin , 2001). By saying “vehicle”
it includes trucks, buses, cars, motorbikes and bicycles. The dynamic wireless data that the
vehicles exchange between each other enables them to avoid threat’s, calculate risk of
collision with every vehicle around and even take control of the vehicle if it is necessary.
The minimum data that the vehicles exchange is the speed (potentiometer), position and
the location. This technology will reduce the collisions at least 76% but also the fatalities
and injuries that occur after the vehicle crashing. (Schagrin, 2012)
Apart from V2V Communication, there is Vehicle to Infrastructure (V2I) and Vehicle to X
(V2X) Communication. V2I Communication means that the vehicles have the ability to

9
Kingston University – V2V Communication
contact with an infrastructure device to get information’s required each time (allowed
speed, warnings about the street etc). V2X Communication includes V2V and V2I plus
V2P (Vehicle to Pedestrian) Communication (through mobile phone network). But in this
review V2I and V2X are not going to be further analyzed.
3.3 Collision Avoidance (CA)
The Collision Avoidance is one of the most important parts in V2V Communication. It is
the protocol that provides early warnings in case of possible collision by doing all the
calculations that are required and providing messages to warn the drivers about possible
collision. (Lie, et al., 2004)
Motivation (Lie, et al., 2004):
There were nearly 6,420,000 auto accidents in the United States in 2005
The financial cost of these crashes was more than 230 billion dollars
6858 people were injured in road accidents in 2006
60% of collisions could be avoided given at least 0.5 sec warning
The development of CA can bring improvements in all sectors of the vehicle movements
and control to ensure the safety for the vehicles. It was found that 75% of all crashes that
Figure 1: V2V and V2X Communication. (Strang & Rockl, 2009)

10
Kingston University – V2V Communication
take place in UK had lower speed than 20mph. In USA it has been found that about 43% of
the accidents were rear end collisions. (Joseph, 2010)
3.3.1 Collision Avoidance using Agilent VEE
Agilent Technologies is
a world’s premier
measurement company.
They developed a
Collision avoidance
test for a scaled model
car 1:10. The test was
accomplished by using Agilents U2353A Data Acquisition Unit (DAQ), Agilent’s
Visual Engineering Environment pro (VEE pro-by using MatLab Script and
MathWorks Signal Processing Toolbox), sensors to detect linear distance and rotational
speed. (Joseph, 2010)
3.4 What is CompactRIO?
CompactRIO is a reconfigurable embedded control
and acquisition system. The CompactRIO system’s
rugged hardware architecture includes I/O modules,
a reconfigurable field-programmable gate array
(FPGA) chassis, and an embedded controller.
Additionally, CompactRIO is programmed with NI
Figure 2: Schematic diagram for hardware loop . (Joseph, 2010)
Figure 3: Schematic diagram for the final test. (Joseph,
2010)

11
Kingston University – V2V Communication
LabVIEW graphical programming tools and can be used in a variety of embedded control
and monitoring applications. (Instrument, 2011)
This develops a four-wheel, nonlinear vehicle dynamic model with electrically controlled
brakes and steering, as well as control a teach suspension corner. Controllers are not
developed here but are demonstrated through simulation. (Margolis & Taehyun, 2000)
3.5 Waiting time and retransmission delay
Figure 4: Vehicle dynamics for developing controllers for vehicle safety.
(Margolis & Taehyun, 2000)
Figure 5: Quarter car model (Creed, et al., 2010)
Figure 6: Waiting time and retransmission delay. (Xue, et al., 2004)

12
Kingston University – V2V Communication
3.6 Proposed National ITS Architecture (Subir, et al., 2006)
3.7 Algorithm
Most of the people have heard the word “Algorithm”, but very few of them know what it
is. An algorithm is a strategy or method that you need to follow in addition to accomplish a
specific task. An algorithm should have the ability to solve a general problem that is
defined with all the instances that it has to work with. It is a procedure that converts all the
available input instances to the desired output. The algorithms have to be correct and
systematic but also easy to implement. An Algorithm can be written as a code on C
Language (or other) or even visualized as a flowchart. (Skiena, 2008)
Figure 8: Example of insertion sort algorithm. Right: algorithm written on C Language, Left: The output
results of the algorithm. (Skiena, 2008)
Figure 7: Proposed national ITS architecture. (Subir, et al., 2006)
13
Kingston University – V2V Communication
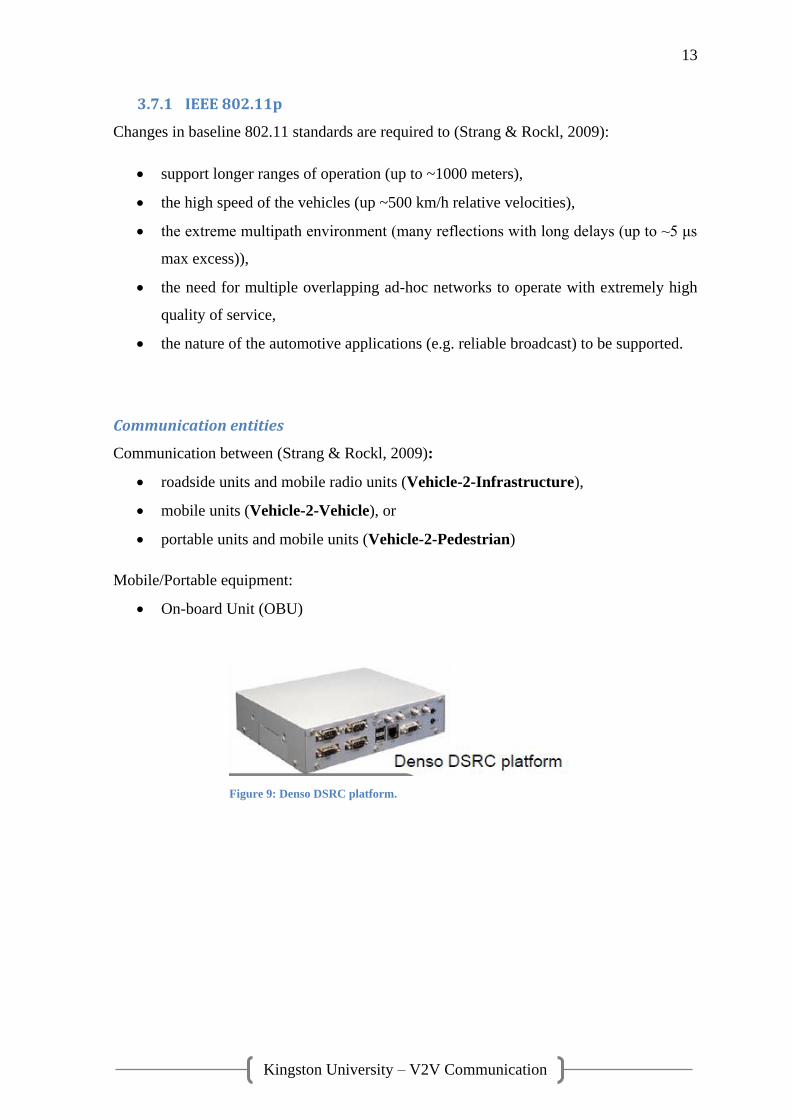
3.7.1 IEEE 802.11p
Changes in baseline 802.11 standards are required to (Strang & Rockl, 2009):
support longer ranges of operation (up to ~1000 meters),
the high speed of the vehicles (up ~500 km/h relative velocities),
the extreme multipath environment (many reflections with long delays (up to ~5 μs
max excess)),
the need for multiple overlapping ad-hoc networks to operate with extremely high
quality of service,
the nature of the automotive applications (e.g. reliable broadcast) to be supported.
Communication entities
Communication between (Strang & Rockl, 2009):
roadside units and mobile radio units (Vehicle-2-Infrastructure),
mobile units (Vehicle-2-Vehicle), or
portable units and mobile units (Vehicle-2-Pedestrian)
Mobile/Portable equipment:
On-board Unit (OBU)
Figure 9: Denso DSRC platform.

14
Kingston University – V2V Communication
3.7.2 WiMAX
Vehicular communications have received a lot of attention in recent years due to the
demand for applications to improve safety and travel comfort. Nowadays, IEEE 802.11p
seems to be the best positioned standard for providing safety services. However, for non-
safety services, which usually do not present tight time restrictions but require high data
transfer rates, other wireless communication standards such as IEEE 802.16e (Mobile
WiMAX) may exhibit better performance. A physical (PHY) layer of a Mobile WiMAX
software transceiver and measured its performance using a channel emulator implemented
on an FPGA (Field-Programmable Gate Array) that recreates six different vehicular
scenarios, including a highway, urban canyons and a suburban area. From the performance
comparison with IEEE 802.11p and IEEE 802.11a standards, the PHY-layer of Mobile
WiMAX shows better performance. The performance results presented herein can also be
used as the input for network simulators to carry out more accurate system-level
simulations that should help in making a final decision on which standard should be used
in each specific vehicular network. (T.M., et al., 2011)
Figure 10: Performance comparison when transmitting over Suburban Street. (T.M., et al., 2011)

15
Kingston University – V2V Communication
3.7.3 VANET (Vehicular ad hoc Networks)
Vehicular ad hoc networks (VANETs) are mobile ad hoc communication networks with
fast-moving nodes. A VANET is consists of (1) on-board units (OBUs) and (2) roadside
units (RSUs). VANET makes easier the communication between V2V and RSUs. Via
wireless communication links, each vehicle communicates with nearby vehicles in a highly
dynamic ad hoc networking environment. Information can be exchanged via V2V
communications so that the drivers can have a general idea of what is the situation
(vehicles, traffic) around them. In case of emergency, warning messages will inform the
drivers by flashing lights or emergency zone. Peer-to-peer applications such as information
sharing and gaming can also be supported through V2V communications. (Ho Ting, et al.,
2010)
Characteristic of VANETs (Ho Ting, et al., 2010):
Predictable network topology
Availability of location information
No strict energy consumption constraints
Figure 11: Details and information’s of how a VANET works. (Ho Ting, et al., 2010)

16
Kingston University – V2V Communication
3.8 Software
3.8.1 NI Labview
NI LabVIEW software and the LabVIEW NI SoftMotion Module deliver graphical
development for custom motion control applications. With LabVIEW NI SoftMotion, you
can use a LabVIEW project to configure all of your motion axis settings, test your
configuration, tune your motors, and quickly develop a custom motion application.
Design custom motion control applications using graphical development tools
Benefit from functions for trajectory generation, spline interpolation, position, or
velocity control
Take advantage of a high-level function block API to simplify motion profile
development
Use the new property and invoke node API for low-level access to LabVIEW NI
SoftMotion functions
Easily connect to drives and motors using NI C Series drive interface hardware or
new NI EtherCAT drives
Define custom axes that include standard I/O, custom control algorithms, or
communication interfaces
Create virtual prototypes using NI SoftMotion for SolidWorks
LabVIEW NI SoftMotion enables virtual prototyping for motion-based systems and
machines by connecting to the Solidworks 3D CAD design tool. This pioneering feature
connects Solidworks 3D CAD models to LabVIEW. Using these high-level motion
functions, custom motion control applications is developed and deployed to the 3D CAD
model to experience the dynamic behavior of their mechanical design, validate their
motion profiles, and optimize the final machine. ( http://ni.adobeconnect.com/p83583931/)
In the project this technology is used to simulate the industrial crane used for pick and
place operations of heavy objects such as containers up to 5 tons.
(http://ni.adobeconnect.com/p83583931/)

17
Kingston University – V2V Communication
3.8.2 SolidWorks
SolidWorks uses ADAMS software to solve the motion equations defined by motion
profile in LabVIEW to control the movement of the SolidWorks model. Main reasons for
using ADAMS to solve motion equations are tabulated below:
Facilitates tuning of PID control loop
Close loop dynamics containing
o Motor equations
o Current loop tuning
o Advanced control algorithm can be simulated using ADAMS.
It allows indirect dynamics that allows calculations of forces and torques required
to traverse the trajectories in motion profile.
3.8.3 Union of LabVIEW and SolidWorks
In 2009 NI LabVIEW launched SoftMotion module. It allows seamless integration of
LabVIEW with 3D CAD models in DS SolidWorks. This software allows design engineers
of different disciplines to simulate and analyse the dynamic behaviour of a mechatronics
system simultaneously. The SoftMotion module is developed for control and embedded
software engineers to be able to create motion simulation applications for 3D CAD models.
This helps engineers to visualize the actual machine operation in real word and accurately
predict the cycle time throughput is simulated, the product’s performance and important
information about the dynamic behavior of the design are demonstrated. This information
helps engineers to optimize their design

18
Kingston University – V2V Communication
3.8.4 Software used
NI LabVIEW 2010 version 10.0.1 (NI LabVIEW 2009 or above may be used as
SoftMotion module is supported by 2009 or higher versions of LabVIEW) and DS
SolidWorks 2010 has been used in this project. As stated earlier, SoftMotion module of NI
LabVIEW enables communication between 3D CAD models developed in SolidWorks
with the motion profile developed in LabVIEW. By importing CAD model in LabVIEW
project motors, sensors, actuators, gears etc. defined within the CAD model (Motion study
of a CAD model) are automatically imported in a LabVIEW project. For every motor
imported from the CAD model, NI SoftMotion axis has to be defined in the LabVIEW
which is used as electronic motor resource during the coding phase. For the simulation
purpose all the actuators are required to be defined in terms of motors in Motion Study of a
CAD model. By using dedicated functional blocks in the SoftMotion module of LabVIEW,
motion application for simple straight line move to multiple axes co-ordinate space move
and if properly programmed a very complex contour move can also 11
be achieved. The SoftMotion Module is demonstrated in Figure 4 showing this process is
presented in a very easy to understand, graphical way.
These tools allow the designer to manipulate the profiles as a means to optimize the design.
If the CAD model is properly connected to the LabVIEW project and if properly
programmed the 3D CAD model can be brought to life for simulation and analysis. It
should be noted that the simulations developed cannot run with real time speed. This is
because Solidworks performs intense calculations to simulate CAD model through motion
Figure 12: Axis Configuration dialog window.

19
Kingston University – V2V Communication
profile defined in LabVIEW and it takes finite amount of time to for it to perform these
calculations and hence simulations cannot run with real time speed, although it is
comparable with the programmed timing. (McHugh, Zhang, 2009)
Simulation results can be used to extract following information:
Visualizing machine operation
Cycle time estimation of the operation
Analysing force and torque requirement of the system
Collision detection
Validating motion control profile programming
Identifying issues
Visualization
In general process of virtual prototyping of mechatronics systems using NI LabVIEW’s
SoftMotion module is interpreted in the form of flow chart as shown in the figure below:

20
Kingston University – V2V Communication
Figure 13: Flow chart of the developing procedure.
3.8.5 Why SoftMotion?
This was the first project of Square one is a robotics and Automation Company that used
virtual prototyping in their design phase. Control engineers developed set of logical motion
equation in MATLAB which could be used for coordinate moves along any given axis.
This could increase the functionality of tri-sphere manipulator. But it was important to test
these equations before actually implementing them in the project. After attending the NI
week worldwide graphical design system conferences held in 2009, control designers
decided to use LabVIEW NI SoftMotion module as their test platform for testing the
motion equation. Main reasons are tabulated below:
Create a Part
Material
Property
Create
Assembly
Define Correct
Mates Define Motors
Add
Solidworks
Assembly to
Labview
project
Establish
Connection
Between
Solidwork
and
Labview
Link
Motors
Check if all
the motors
were found
Create
Motion Axes
and
Coordinate
Space
No
Create New
Project
Create
Front
Panel
Create
Block
Diagram
Define
Control
Application
Create Motion
profile
Simulate
Analyze

21
Kingston University – V2V Communication
The most important reason was, motion equations were developed in MATLAB
and it was possible to read this code in LabVIEW and run a motion profile coded in
MATLAB.
Using the combination of functional blocks in NI SoftMotion module it was
possible to create a motion profile in LabVIEW itself. So there was no need to
include MATLAB to do high level math calculations for motion equations. It could
be done in LabVIEW.
LabVIEW can be seamlessly integrated with Solidworks CAD models and allows
control of motors and position sensors.
Creating motion profile in parallel with mechanical design in SolidWorks was
possible. And any motors identified incorrectly while creating a motion profile
could be very easily corrected afterwards.
LabVIEW is very programmer friendly language. Not just because it is graphical
programming language but also because any programming errors can be identified
and corrected comparatively easily as compare to other programming languages.
3.9 Architecture and evaluation of a unified V2V and V2I
Communication system based on cellular networks
The inclusion of telematics in the vehicle domain has generated some collateral
technological developments. Communications among vehicles and between vehicle and
road side infrastructure are becoming a key issue in the provision of on-board services.
Safety applications and tracking systems have been during years the main proposals in
intelligent transportation systems (ITS). However, the amount of services oriented to the
vehicle field is currently growing, and not only in terms of on-board solutions, but also
applications which imply a communication channel with the infrastructure have to be taken
into account.

22
Kingston University – V2V Communication
3.10 Results
Using simulation results engineers could tell the limitations to the movement for
mechanism, which helped in deciding the dimensions of the critical parts.
Testing of LabVIEW VIs made it easier for control designers to develop controls
for actual CARMA assembly.
As LabVIEW can be integrated with other simulation software like simulink in
MATLAB, adapting from previous software platforms was easy.
Actual manipulator could be operated with same simulation code in LabVIEW
This technology allowed mechanical team to work synergistically with the software
team for the first time. (ni.com, 2009)
3.11 Business Benefits
The main goal of any business is to get as much profit as possible from their manufactured
products. To achieve this goal it has to manufacture a product in least production cost and
production time and maximum efficiency to survive the competition. Advantages of V2V
are shown below:
V2V Communication saves millions to the health system of every country.
All the vehicles will implement it in their vehicles.
Many people will be saved around the world.
Less injured people from the collisions
Improved traffic in traffic signals
Benefits for the insurance companies
Mass production for millions of vehicles
4. Research Methods and Scenario
In order to further proceed with the information’s gathered from literature review, it is
important to focus and collect data for learning how the software’s are going to implement

23
Kingston University – V2V Communication
and work with each other, how are the scenarios going to be developed (depending on
what), how to develop and test the algorithms that are going to take part and finally the
development of the simulation scenario. This data are being collected so that the specific
objectives can be accomplished without having to collect useless data and remain focused.
The scenario will present the steps that are going to be followed for the research but also
will be the base for implementing the simulation. In the research strategy below, case
studies experimental results and different research will be used to have a more detailed
description. Data collection is going to analyse the way that the data are going to be
collected, but in limitations topic you are going to find what were the problems that
occurred and the limitations that were faced during the use of the softwares (LabView and
SolidWorks).
4.1 Scenario
The scenarios always gives a better description on what should and what is expected to be
done, as it is a starting point from where you start from a simple description of the model
and end up with algorithms and simulations. The scenario that will be simulated as well by
using NI LabView and SolidWorks software, starts with:
Vehicles arrive at the cross-road. They establish communication &
negotiate the order of crossing. From that, then commands are sent to the
vehicle control system to change speed (if needed) brake or accelerate.
In the simulation should be included:
Individual vehicle model
Communication block (Communication between vehicles)
Algorithm for negotiation
Algorithm for vehicle control

24
Kingston University – V2V Communication
4.2 V-Model in Software Development
V-Model is a process model that helps by giving description of the step that should be
followed for planning and executing projects, it belongs in the high level languages
(semantic languages). The objectives of V-Model are (V-MODELL®XT, 2008):
Minimization of project risks
Improvement and guarantee of quality
Minimizing the total cost of the project
The stakeholders to have a better and improved communication.
One of the biggest advantages of the V Model is that every stage is tested. (Waterfall-
model.com, 2011)
4.3 Research strategy
A very intensive literature review was helpful to gather the information’s and data that
would be useful to move on the research for having an idea what already has been done
and how. The research will start with the first step that is described in the V-Model picture
above.
Figure 14: V-Model with the description of the stages. (Chou, 2010)

25
Kingston University – V2V Communication
Concept of Operations (General description):
a. Vehicles communicate with each other in the desirable area (WiFi range)
b. Exchange data about position, velocity, acceleration and their direction
c. Calculating the measurements and order of crossing
d. Giving priority depending on speed and position of other vehicles (distance from
the cross-road)
e. Establish accidents scenarios so that the collision avoidance calculations can be
faster
f. Detection of oncoming and crossing vehicles
g. Depending on the situation, accelerate or slow down the vehicle
Requirements and Architecture
All the vehicles will be equipped with the same devices so that V2V Communication Unit
can be connected with all the vehicles. The main device will be connected with:
Gps device: Gps will provide the main unit with the position of our vehicle
(longitude and latitude), speed, acceleration, distance from the crossroad and the
direction that our vehicle is going to take (the information’s that are going to be
necessary for the cross-road are to turn right, left or go straight)
WiFi device: it will be connected with the main device and provide it with other
vehicles information (vehicle ID, position (longitude and latitude), speed,
acceleration, distance from the crossroad and the direction that they are going to
have (if they are going to turn left, right or go straight in the crossroad).
Gps
Unit
Main V2V
Communication
Device
WiFi
Unit
My speed,
position,
acceleration
distance &
direction
Others ID,
speed, position,
acceleration
distance &
direction Calculations, Warnings,
Order of crossing etc.
Figure 15: Main unit connected with Gps and WiFi.

26
Kingston University – V2V Communication
Figure 16: Architect of data flow algorithm.
From the above picture you can see the flow of data. Phase 1 is the collection of the
information’s, phase 2 is the calculation of the information’s that were received from the
previous step and finally all the calculations ends to phase 3, where the alerting, acting and
saving algorithms take place. In the picture where the main unit is connected with Gps and
Host Vehicle
Longitude,
Latitude,
Velocity,
Acceleration,
Priority
Neighbors vehicle
V1xR1 V2xR2 V3xR3
V… x R…
Calculations
Warnings
Accelerate
Slow down
Alerting the driver
Vehicle Action (accelerates, slow down or brake)
Save the results
Brake

27
Kingston University – V2V Communication
Wi-Fi, you can see that the data flow from Gps is only from one direction, but the data
flow from Wi-Fi is from both directions, because of the fact that this device receives
information’s about other vehicles but also send information’s to the others about our
vehicle. In calculations phase, the brake order will be used only for emergencies, as the
car’s will not have to brake because of the fact that their order of pass will be calculated
before they reach the crossroad.
The inputs are:
Our speed (Tachometer or Gps)
Our position (Gps)
Our direction (Gps)
Other vehicles speed (Wi-Fi)
Other vehicles position (Wi-Fi)
Other vehicles direction (Wi-Fi)
Consider that from all the above the direction speed and position of other vehicles could
come from Gps as well, but in order the system to be faster, it is more preferable to receive
them from Wi-Fi. Wi-Fi technology has the ability to send more Mb/s than a Gps, but also
the reception of the Gps in some cases in not very clear.
The outputs (through Wi-Fi) are going to be:
Our speed
Our position
Our direction
Our vehicle ID
Detailed design
To manage to make the vehicle to accelerate and slow down, it is important to control the
gears of the vehicle. The Gear Control of the vehicles is available in the electronic cars.
With a Compact Rio (C-Rio) it is possible to connect the LabView software (during
simulation) with the vehicle and link them together so that the control of different parts of
the vehicle can be from the main unit (and algorithm).
28
Kingston University – V2V Communication
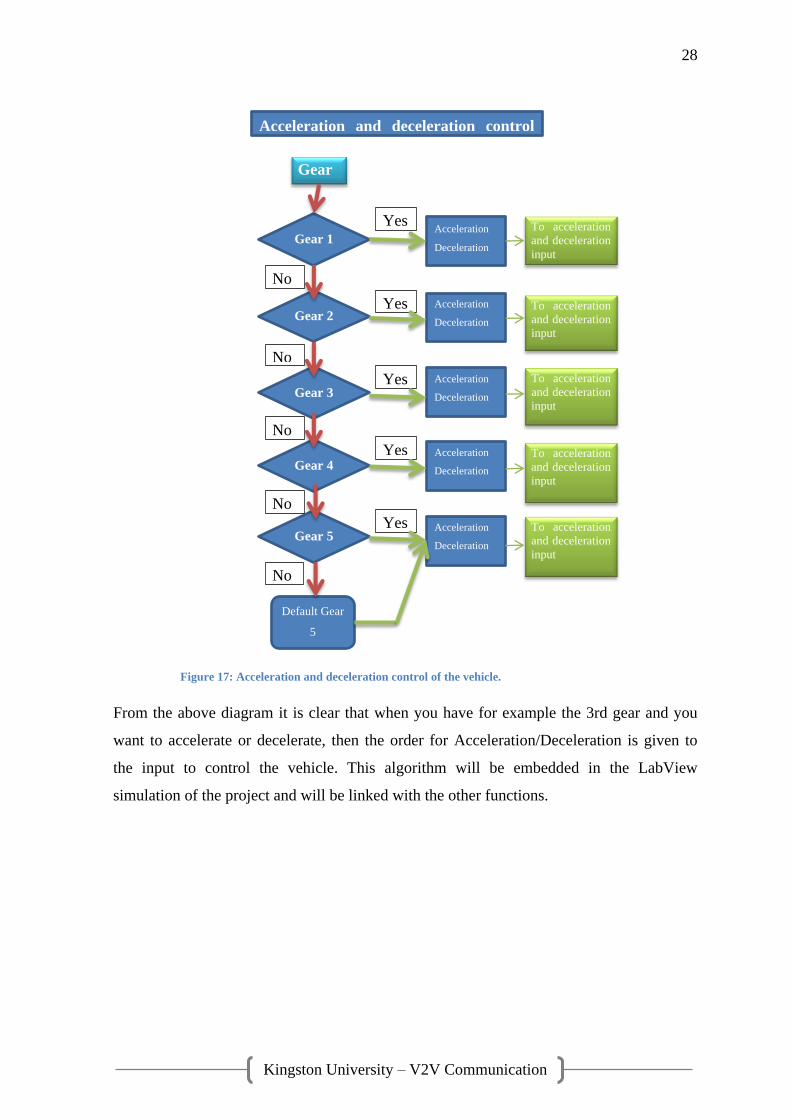
Figure 17: Acceleration and deceleration control of the vehicle.
From the above diagram it is clear that when you have for example the 3rd gear and you
want to accelerate or decelerate, then the order for Acceleration/Deceleration is given to
the input to control the vehicle. This algorithm will be embedded in the LabView
simulation of the project and will be linked with the other functions.
Acceleration and deceleration control
Gear
Gear 1
Gear 2
Gear 3
Gear 4
Gear 5
Default Gear
5
No
No
No
No
No
Yes
Yes
Yes
Yes
Yes
Acceleration
Deceleration
Acceleration
Deceleration
eleration
Acceleration
Deceleration
Acceleration
Deceleration
Acceleration
Deceleration
To acceleration
and deceleration input
To acceleration
and deceleration input
To acceleration
and deceleration input
To acceleration
and deceleration input
To acceleration
and deceleration input

29
Kingston University – V2V Communication
To control the speed of the car, it is necessary to control the gears of the vehicle as well.
The above picture shows the way and the correct speed to change gear to the vehicle. This
algorithm starts by getting the value of the current vehicle speed (from Gps) and
comparing it with above values. When the vehicle will enter in the crossroad area and get
the order of passing for each car, then the control of the car will be handed from the v2v
communication technology. Even if the driver tries to speed up or brake, the vehicle will
not respond, but it will release the control after passing the cross-road.
Priority given
The priority given to the vehicles has to be calculated. The decision on which vehicle
should pass first depends on what is most important, speed or position? In this paper, the
priority will be given depending:
a) On which vehicle is going to reach first the cross-road by using the t= v/x (t=time,
v=velocity, x=distance from the crossroad), so the order of crossing will depend on
both values (speed and position).
b) Secondly, the priority will depend on the direction of the vehicles as well. This is
because in case two vehicles have opposite direction but different distance and
Gear Control Current velocity (CV)
If cv<20km/h
21<cv<40km/h
41<cv<55km/h
No
56<cv<70km/h
cv>90km/h
No
No
No
No
Gear=1 To acceleration
control
Gear=2 To acceleration
control
Gear=3 To acceleration
control
Gear=4 To acceleration
control
Gear=5 To acceleration
control
Yes
Yes
Yes
Yes
Yes
Figure 18: Gear control algorithm of the vehicle. (Values from (Fischer, 2006)

30
Kingston University – V2V Communication
speed, it will not affect them, because there is no collision between them and they
can move free to their directions.
As it was mentioned earlier, the direction will be given from Gps. Also, because of the fact
that Gps can calculate the angle of turning (from maps) in the crossroad, this value will be
an input. By getting the angle of turning in the crossroad it is possible to control the wheel
and turn it in the required direction and angle. As you can see in the flow chart, the
straight value is 0, the right is 1 and the left 2.
Tire size and velocity (Tirerack.com, 2010)
Wheel diameter: 225mm
Circumference: pi*d=225*3.14=706.5mm=0.7065m
750 rpm is 12.5 rev/s (divide by 60s/min)
0: straight
1: right
2: left
Direction input
from GPS (d) d=0
d=1 d=2
No
Yes
sa<=0
Steering angle
(sa) input from
GPS
sa>=0 Yes No
Yes
Set soa=(-)sax60/135
Velocity=(-)750x9/sa
Yes
Set soa=sax60/135
Velocity=750x9/sa
No No
To steering angle
and velocity input Set soa=0
Velocity=750rpm
Yes
Steering
output angle
(soa)
Figure 19: Flow chart of controlling the steering angle and the velocity of the vehicle.

31
Kingston University – V2V Communication
0.7065m/rev x 12.5rev/s=8.83m/s=31.78Km/h
Direction: Straight
If our route is straight, the direction input is going to be 0. In this case the steering output
angle of the wheel is going to be set as 0 and the velocity will be constant (because of the
fact that it is a wheel, the speed of the wheel is counted as rpm). The constant velocity that
the vehicles will move in the crossroad for security reasons has been set as 31.78Km/h or
8.83m/s. After that the outputs are given to the steering angle and velocity input for the
vehicle control.
Direction: Right
If the vehicle is going to turn right in the crossroad, then it is going to get the value 1 from
the Gps. The Gps is also going to give as an input the turning angle in the crossroad. If the
turning angle is positive, then soa=sax60/135 and Velocity=750x9/sa. Let’s suppose that
the turning agle is 90degrees, then the Steering output angle is going to be
soa=90x60/135=40degrees. It means that the steering is going to turn around 40degrees.
Because of the fact that the vehicle is turning, the vehicle speed has to reduce. The
reducing speed is done by the equation above where Velocity=750x9/90=75rpm. These
values are given to the Steering angle and velocity input to control the vehicle.
Direction: Left
It is going to be the same with the right direction, but the only change in this case here is
the negative value. The turning angle when you turn on the left is going to be negative, so
the value that will result will negative as well. For this purpose a negative sign has been
added in front of the equation. The negative sign has been added in both of the values
soa=(-)sax60/135
Velocity=(-)750x9/sa

32
Kingston University – V2V Communication
The flow chart above is showing the way that the vehicles get the priority by calculating
the time that the vehicles will reach the crossroad and give the first priority to the vehicle
that will reach first (has smaller reaching time to the crossroad). The flowchart is showing
the path of how the getting order of passing works. The Gps is an input that gives our
vehicle current position. If there is no current position then the system returns error. After
getting the position of our vehicle and calculating the distance from the crossroad (given
from gps) will get the time that the vehicle will reach the crossroad. Also, from Gps the
Priority flow chart
Position Input from Gps
Current position:p p
Set the priority by time
predicted
Error No
Yes
The vehicle that has
smaller reaching time
(t=v/x) get the first
priority and so on.
If position of any other
vehicle reduces to
zero, then increment
the priority by 1
Estimate time for the vehicle to
reach the junction=estimated time
for all the other vehicles to reach the
junction +2sec of safety delay
Car velocity = current
position/current estimated
time
To velocity
input
Figure 20: Priority flow chart.

33
Kingston University – V2V Communication
system will get the values of other vehicles around as well and sort the times from the Low
to High. The vehicle with the lowest value will cross first the crossroad and so on. Also, to
the vehicles has been given a 2sec delay security time (The two second rule) (RSA, 2007).
4.4 Limitations and Potential Problems
Always in all the projects and the beginning, the ambitions are many, but most of the times
the end is shorter from the aims you had to reach. In this paper, the limitations started after
attempt to implement and design the simulation as described. The limitations and potential
problems found are:
4.4.1 Labview limitations
In the aim and objectives, was mentioned that a simulation of different vehicles would take
place by using labview software (for the simulation part and statistic measurement part).
After an intensive search in the software itself but and over the internet the result was that
this was not possible to be done. The limitations that were found are:
Does not support vehicle simulation (or any 2D or 3D simulation with multiple
models, although of the fact that it is a Graphical Programming Software).
Doesn’t support Wi-Fi simulation of different connections.
Doesn’t support Gps simulation and positions.
Does not support complicate C code
Because of the fact that some limitations were about Gps and Wi-Fi, the simulation was
not possible to get automatic values of other vehicles but not even its position. This limited
the simulation. All the data that are going to be used have to be entered manually but in
real world (or real simulation with vehicle models and gps modules installed) this data are
Figure 21: Figure explanation of the 2sec rule. (RSA, 2007)

34
Kingston University – V2V Communication
going to be given as described, automatically. The values-data that are affected are the
speed and position of each vehicle. The C code also had to be more simple, as while using
complicated equations the program was not running.
After this limitations and searching in labview forums, there was found a solution.
SolidWork software and LabView software could corporate together. There was a
communication/control of SolidWorks by using LabView environment. After that, the aim
was to use LabView environment and its algorithms to control and run the simulation that
was described in SolidWork software.
4.4.2 SolidWorks limitations
Dassault Systems SolidWork is a 3D Cad Computer Aided Design program. It is used
worldwide by engineers and designers at many companies in different countries. During
the investigation on how it was possible to do the simulation required by using solidworks,
there were found some limitations and problems. The limitations that were found are:
Not possible to insert more than one vehicle in the simulation environment that
would corporate with LabView.
The processing requirements were very high while it was linked and working with
LabView at the same time for the simulation (sometime the software was crashing)
The fact that it was not possible to add more vehicles in the SolidWorks environment
limited the simulation from at least two cars to one car. The high processing requirements
limited the simulation from one vehicle (car) to one wheel (tire) of the vehicle. But because
of the fact that even a model of a real tire was very demanding on processing power and
was crashing the software, a very simple model of tire was used.

35
Kingston University – V2V Communication
4.5 Test and verifications
Being one step before the simulation, some tests have to be done so that the simulation can
work properly. The vehicle that is going to take part in the simulation was downloaded
from SolidWorks 3D ContentCentral Toold box and modified so that it comes to the
parameters required for simulation. 3D ContentCentral tooldbox can be found inside
SolidWorks environment (as it is shown below).
The vehicle in the below picture was initially suggested to start the simulation with, but
after some failures of both programs (SolidWorks and Labview) because of the fact that
this 3D Model required a lot of processing power, it was necessary to revise and make the
simulation more simple. It was suggested instead of the whole vehicle, to use only one tire.
With one tire it is available to see the reactions and behaviour of the vehicle and evaluate it
like it was the whole vehicle.
Figure 22: 3D ContentCentral toolbox for online available 3D models.

36
Kingston University – V2V Communication
After implemented the tire in the system, it was observed that the simulation was working
and it wasn’t crashing, but it was running very in very slow motion because of the fact that
the vehicle had many details. A second revise was necessary; the wheel had to be simpler
so that it can run without problems and delays. A new simple 3D wheel had to be designed.
After two revisions, an attempt had been done so that the wheel could be as simple as
possible. The simple 3D design of the wheel can be viewed in the picture below.
The 3D model of the wheel consists of three parts. The whole on part 1 is designed so that
it can show that the vehicle is moving-turning.
Figure 23: The first revision. From the whole 3D vehicle model ended up to one 3D tire. Vehicle (Miller, 2010)
and tire (Allenbaugh, 2008)
Figure 24: The simple 3D wheel model designed for the need of the simulation.
37
Kingston University – V2V Communication
After testing this 3D model, it was a noticeable improvement on the speed that the
simulation was running while the simulation was on.
5. Simulation
The 3D designed model and the Labview project with the algorithms are both going to
work together to simulate the scenario of the vehicles reaching in a crossroad. Firstly, it is
necessary to create a scenario of the simulation. The simulation is the last process which
verifies that everything in the previous chapters was done properly. But to reach there the
whole process and the software setup has to be explained properly.
5.1 Software Setup
5.1.1 SolidWorks
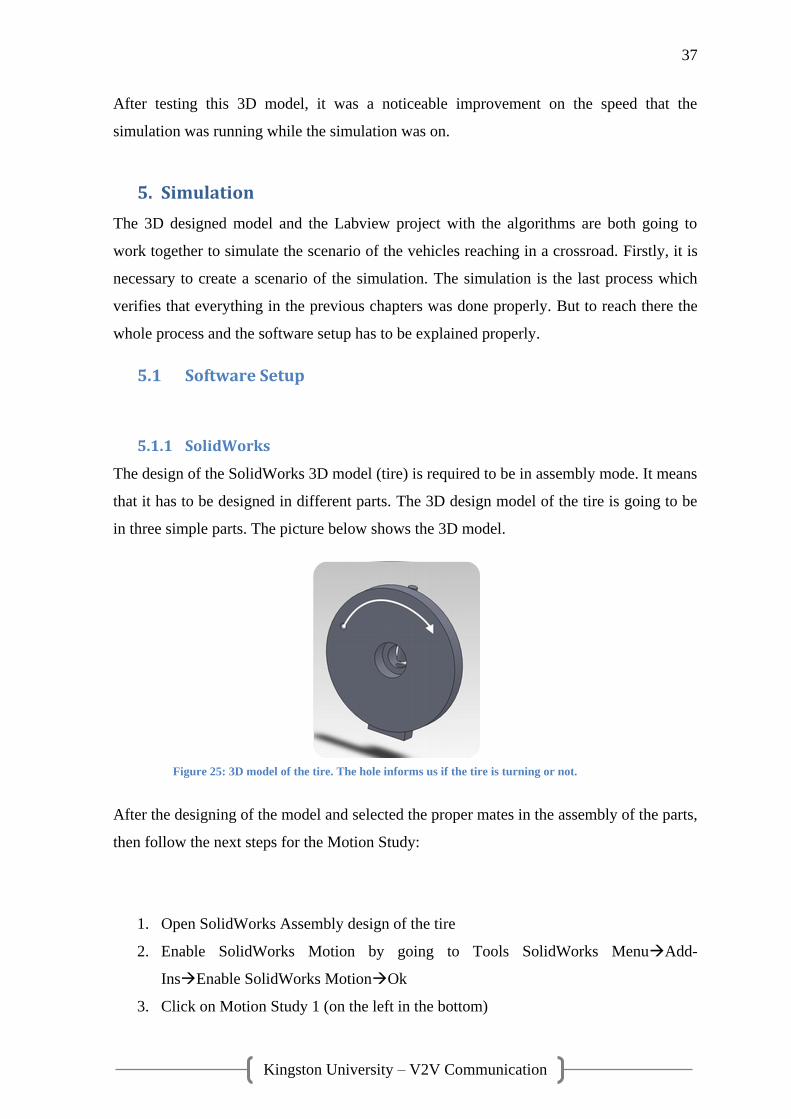
The design of the SolidWorks 3D model (tire) is required to be in assembly mode. It means
that it has to be designed in different parts. The 3D design model of the tire is going to be
in three simple parts. The picture below shows the 3D model.
After the designing of the model and selected the proper mates in the assembly of the parts,
then follow the next steps for the Motion Study:
1. Open SolidWorks Assembly design of the tire
2. Enable SolidWorks Motion by going to Tools SolidWorks MenuAdd-
InsEnable SolidWorks MotionOk
3. Click on Motion Study 1 (on the left in the bottom)
Figure 25: 3D model of the tire. The hole informs us if the tire is turning or not.

38
Kingston University – V2V Communication
4. Change from Animation to Motion Analysis
5. Select Motor (a new window will appear)
6. At the Component/Direction select the inner surface of the tire and enter the values
(as shown in the picture below)Ok. A vector will appear.
Figure 27: steps on how to enable SolidWorks Motion Add-in.
Figure 26: Motor window with the surface selected.

39
Kingston University – V2V Communication
7. Repeat Step 6Select the surface shown in the picture belowAdd the values as
in the picture Ok. A round vector will appear.
8. The final step is necessary to test if everything went ok. To do that click on Move
Component tool and click and hold anywhere in the surface of the tire, if the tire moves,
then everything ok, if the tire doesn’t move then repeat the steps again.
Figure 28: Motor for turning left-right is selected.
Figure 29: Checking if the tire moves by selecting the "Move Component" tool.
40
Kingston University – V2V Communication
5.1.2 LabView
The procedure to create a new LabView project is shown below:
1. Open new Empty project in NI LabVIEW
2. Go to SolidWorks and check whether the Solidworks Motion Add- in is enabled.
This can be check by going into Tool menu in SolidWorks.
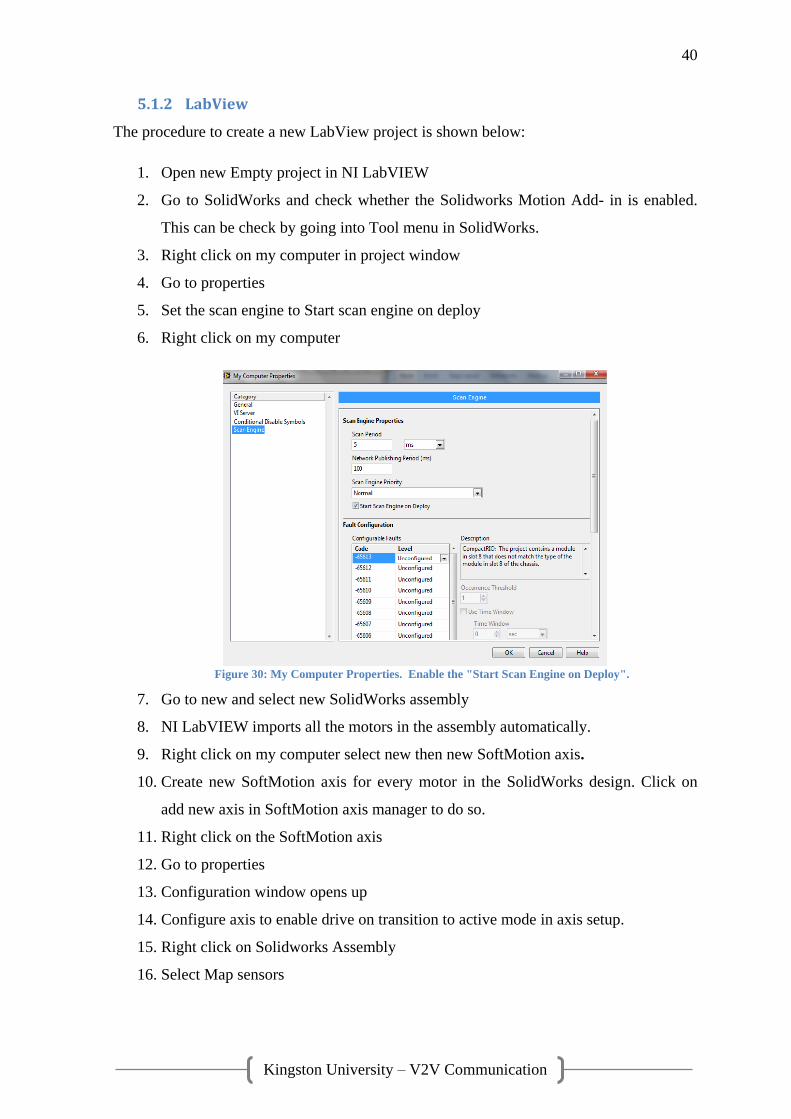
3. Right click on my computer in project window
4. Go to properties
5. Set the scan engine to Start scan engine on deploy
6. Right click on my computer
7. Go to new and select new SolidWorks assembly
8. NI LabVIEW imports all the motors in the assembly automatically.
9. Right click on my computer select new then new SoftMotion axis.
10. Create new SoftMotion axis for every motor in the SolidWorks design. Click on
add new axis in SoftMotion axis manager to do so.
11. Right click on the SoftMotion axis
12. Go to properties
13. Configuration window opens up
14. Configure axis to enable drive on transition to active mode in axis setup.
15. Right click on Solidworks Assembly
16. Select Map sensors
Figure 30: My Computer Properties. Enable the "Start Scan Engine on Deploy".

41
Kingston University – V2V Communication
17. Map sensors on Digital/analog inputs 0-7 and/or on forward and reverse limit
inputs.
18. Right click on my computer
19. Select new VI to create new VI file to control the motors in your Solidworks
assembly or Select AddNew file and then
brows to previously created VI code and select
it.
20. Once the project is configured, select all the
SoftMotion items.
21. Use Ctrl of Shift key to do so.
22. Right click and deploy
23. Scan engine will switch from configuration
mode to active mode automatically.
24. It can be identified if the scan engine is in active
mode or in configuration mode by moving the
mouse pointer over solidworks window. In
active mode the mouse pointer turns into a sand
clock.
25. If not Switch it manually by right clicking my
computerUtilitiesScan engine mode Active mode
Figure 31: Axis configuration window.
Figure 32: Project Explorer window after
configuration

42
Kingston University – V2V Communication
26. Once deployed in active mode, VI code can be run to analyse the SolidWorks
assembly.
Manual Procedure to configure the Solidworks Model with LabVIEW for Simulation
1) System Requirements
Solidworks 2009 SP2.1 or later
Add-in: Solidworks Motion simulation. Enable the motion simulation add in from Tools
menu in Solidworks. While enabling the motion simulation Add- in, place the checkmark
in both left and right checkboxes to avoid repetition of enabling every time.
LabVIEW 2009 (32-bit) or later.
Add-in: LabVIEW NI SoftMotion Module Standard or Premium.
Computer requirements: System with at least a 3 GHz Intel Pentium 4 processor or
equivalent and 2 GB of RAM for optimal performance.
2) Conditions to be satisfied for Successive Configuration
Solidworks Conditions: Designing the model in a proper way is crucial step. It is
important to keep in mind certain points during designing. These points should be strictly
followed for successful simulation of this model and thus in turn to create fully operational
virtual prototype of it. These points are stated below:
The main assembly model should not contain any subassemblies. This is because every
subassembly is treated as a single part. Part models inside the subassembly cannot be
identified individually and thus cannot be worked on individually, so if there are any
joints inside subassembly, motors cannot be assigned to them and hence these joints
cannot be used during simulations. Similarly any sensors inside the subassembly
cannot be identified and hence cannot be used during simulation.
All the parts of the final mechanism should be assembled in a single assembly model.
Once the motors axes for all the joints are identified, mates in the design should be
such that, sliding joints should be free to slide along the axes in case of linear motors
and rotary joints should be free to rotate about the motor axes in case of rotary motors.
Any mates that make these joints rigid should be removed.

43
Kingston University – V2V Communication
All the movable parts of the design should be in FLOAT state and not FIX state. State
of all the parts may be changed by right clicking on individual part, if the part is in
float state an option to change it in fix state can be seen, and if the part is in fix state, an
option to change it in fixed state can be seen. An example of simple slider mechanism
is shown below to show this,
Any part of the assembly which is in fix state cannot be moved with the motors and in
such condition simulations fails to perform as it is expected to.
There has to be at least one fix part in the assembly, this will act as solid base for entire
assembly. If this is not done then assembly might just collapse during the simulation or
it won’t perform as it is expected to.
Assign appropriate materials to each part of the main assembly. This is done by right
clicking individual part material Edit material and then select appropriate
material from the list provided then click apply to apply the properties of the selected
material to the part.
To include the friction effect during the simulation, right click on the mates defined for
the joints, where friction is expected, click edit features, click on the analysis tab, check
in the friction, select the desired parameters and accept the settings.
Note that even though material is assigned to each part before, you have to again select
it while setting up the friction parameters.
Once the SolidWorks model is design properly, a motion study needs to be created.
To create a motion study, select the motion study tab at the bottom left corner of
the screen.
Here, first we need to select type of motion study. There are three types available,
namely
o Animation
o Basic motion
o Motion analysis

44
Kingston University – V2V Communication
Type of motion study chooses the amount of realism in the motion study. More realistic
study takes more amount of time for its calculations. Here, animation is the least realistic
type of motion study which uses 8 frames per second during the simulation of motion
study whereas Motion Analysis is the most realistic type of motion study that uses 200
frames per second during the simulation of the motion study. Basic motion uses 16 frames
per second during the simulation of the motion study. To be able create motion control
application using LabVIEW’s Softmotion module for virtual prototyping, Motion Analysis
must be chosen as a type of motion study.
o Finally we assign appropriate motors, i.e. linear or rotary motor, at the
selected joints.
o Note that all the motors should be of Distance type, for them to be able to
use for motion application in LabVIEW.
Motors Conditions:
o All the motors assigned or configured in Solidworks model should be
distance type.
o For linear motors, conversion rate of Soft motion is 1 count/mm for encoder
counts/unit.
o For rotary motors, conversion rate is 1 count/degree for encoder counts/unit.
o In case of rotary motors for one scan period, velocity should not be greater
than 360 degree.
Next step was to integrate two software’s. The procedure to create new project and the
integration process of the two software’s is discussed below,
45
Kingston University – V2V Communication
5.2 Scenario
The details of the scenario that is going to be simulated are:
Six vehicles (including your vehicle) are going to reach the crossroad and they are
in the Wi-Fi covered area and detect each other
They communicate and exchange data with each other (in this case the data will be
added manually-explained in limitations)
o Vehicle 1: Speed: 45, Position: 45
o Vehicle 2: Speed: 150, Position: 56
o Vehicle 3: Speed: 90, Position: 34
o Vehicle 4: Speed: 130, Position: 25
o Vehicle 5: Speed: 180, Position: 99
o Vehicle 6: Speed: 0.5, Position: 79
Our vehicle will start from zero speed and accelerate.
Negotiate order of passing before reaching the crossroad.
Control the vehicle (steering wheel, gear and tire).
Follow your destination.

46
Kingston University – V2V Communication
5.3 Simulation
To move on with Simulation, it is mandatory to have completed all the steps on Software
Setup chapter. As it was described in the scenario, six vehicles are reaching the crossroad
and they establish communication with each other by using Wi-Fi technology. The Wi-Fi
data transmitted to each of the vehicle will equip the V2V Communication device with all
the data required: position, distance, speed and direction. Because of the restrictions of the
software, this data will be added manually (as they were added automatically from Gps).
The values of s1 to s5 (speed of vehicle 1 to 5) and p1 to p5 (position of vehicle 1
to 5) will be added manually.
At the “p” box will be our position and at “d” box will be given our destination
(that in normal case would had been given from Gps).
The “Gear” box will show the gear that our vehicle is currently using.
The “Priority” box is showing the current priority-passing order of our vehicle.
The “velocity” box shows the current velocity of our vehicle
The “target speed” box is showing the speed that our vehicle should reach. This
speed is given by Gps as the speed that is allowed to move on the street. The value
in “velocity” box will increase/decrease till it reaches the target speed.
The “time” array is the time that each car need to reach the crossroad (without
sorting, the first box is corresponding to vehicle1 or s1)
The “sorted array” sorts the values from the “time” array starting from the smaller
value and increasing. This way is given the “order of crossing” at the intersections.
The “Stop” button stops immediately our vehicle in case of emergency.
After getting an idea of how the Front Panel of LabView works and what are the
meanings of each of the boxes, the next step is to add the values from the scenario.
Figure 33: Explaining the LabView front panel

47
Kingston University – V2V Communication
After running the simulation the first seconds, in the front panel you can see that the values
and order of crossing the intersection has already been sorted out. The priority of our
vehicle is number 6 (last). Because of the fact that the vehicle just started, our vehicle has
the first gear. From the time array you can see the times that each vehicle need to read the
crossroad (the low values of the time are because of the fact that the distance is given is in
mm and the speed in rpm). The sorted array gives the “order of crossing” of each vehicle
and in this case the order of crossing has already been sorted out. According to the results
above the order of crossing of the vehicles is going to be like this: 1st: vehicle 4, 2
nd:
vehicle 5, 3rd
: vehicle 2, 4th
: vehicle 3, 5th
: vehicle 1 and 6th
: vehicle 6 (our vehicle).
Also, parameters have been given to the algorithm to control the steering wheel. The driver
can turn the steering wheel, but no command will be given to the tire. The steering wheel
will move only in the direction that it has to turn.
After the moment that our vehicle reach the crossroad and turn, then the vehicle start to
gear up and accelerate (until it reach the target speed given from the gps).
Figure 34: Adding the values of the scenario and running the simulation by pressing the "Run" button.

48
Kingston University – V2V Communication
From the above picture you can see that the all the vehicles have left, and is our turn to
move on. From the Gear you can see that our vehicle is using gear 3. The target speed that
it has to reach (given from Gps) is 250, so the velocity will increase till it reaches the
target.
Figure 35: Simulation after reaching the destination.
Figure 36: Trying to turn the steering wheel while the vehicle is still far from the target.

49
Kingston University – V2V Communication
From the above picture-simulation you can see that despite of the fact that it is our priority
(but the vehicle is far from the target) if you try to turn the steering wheel, it will not obey
the orders and will remain in the same position. From the below pictures you can see that
when you have reached the crossroad the vehicle turns on the right hand (as it is given
from the destination d=1). It follows the command of the algorithm as predicted. The
picture on the right hand has already turned and crossed the intersection and is in a straight
street (destination d=0) and it doesn’t follow the order from the driver to turn the vehicle
on the left hand. Something else you can notice from the above pictures is the gear. When
the vehicle moved from the crossroad to a straight road, it started to gear up and accelerate
(from gear 3 to 4) as it was predicted.
Figure 37: Simulation of the vehicle in the crossroad commanding the tire.

50
Kingston University – V2V Communication
6. Discussion and conclusion
This dissertation developed a research based on Vehicle to Vehicle communication, that
communicate with each other by using wireless technology (Wi-Fi) to exchange the
required data with each other but also to take the control of the vehicles to avoid collision
in the crossroads caused by human actions. This research was based mostly on what was
found in the literature review and combined all the knowledge-methods used from people
who have done something similar. V-Model was used for the planning and executing the
project. The limitations that occurred on LabView software during the research changed
the aim of the dissertation; visually it would have been with more vehicles moving in real
time and a model of the crossroad. But after working and controlling SolidWorks software,
the simulation of at least one vehicle was achieved. Through the LabView software the
results of the actions from the other vehicle could be viewed.
The vehicles could contact with each other by using IEEE 802.11p Wireless technology
that has dedicated seven communication channels for V2V communication. The V-Model
was very helpful to develop the scenarios, analyse, test and implement the results after
verification. Despite of the difficulties that were found by using labview, the software
turned to be a powerful tool if you know how to use it. The controlling of the SolidWorks
by using LabView was a new experience with a lot of promising in the future. The control
of the vehicle can become reality using C-Rio devices. The C-Rio devices can play the
intersection role between LabView and the devices or the control system of the vehicles
(instead of virtual control like SolidWorks).
The simulation results show us that the vehicles exchange the desirable data with each
other and receive the order of crossing in their own vehicle, they cross the intersection as
predicted (by using the two second rule for security). Any human intervention while the
vehicle is reaching the crossroad is not accepted. The human intervention is accepted only
in the moment that the vehicle will turn to its destination.
V2V Communication-Negotiating the order of crossing at intersections showed the ability
to avoid using the traffic lights. It showed that with the technology nowadays the long
waiting at the traffic lights can be avoided by having as initial target to avoid the collisions
and save many human lives around the world by reducing accidents.

51
Kingston University – V2V Communication
6.1 Recommendations:
Some of the recommendations would be:
The vehicle control to be completely automatic and the human’s intervention to be
as small as possible.
Trying to implement this technology at old vehicles (it can only be used from new
electronic vehicles)
System that would recognize the pedestrians that are going to cross the
intersections
The use of wireless sensor networks to improve the safety to the vehicles
Standardise the patents as soon as possible to save thousands of human lives around
the world.
7. Future work
The future work of V2V Communication is very bright, as it is a technology still under
development and many people around the world are trying to improve the existing
technologies and come up with new and bright ideas. The future work should include:
Include V2X communication, so that the technology can recognize the pedestrians
and the bicycle’s
Using WiMAX network communication, will give better speed and more data to
transfer, but also the ability to have more services in the vehicle (internet, internet
radio etc)
The ability to control the vehicles in a bigger crossroad even when the vehicles are
going to change lane at the same time.
V2V communication and control of the vehicles depending on the weather
conditions
A vibration device for the deaf people to warn them about the upcoming danger.
A warning device for the blind people to prevent them from having accidents when
they cross the road
Warning signal at the helmet of the motorbike drivers, this would save time for the
reactions of the driver but also make it clear that the driver got the warning
(sometime devices in the motorbike are hard to be seen-depending on the weather
or traffic)

52
Kingston University – V2V Communication
But in the meantime whatever has already been done should come out in the market, even
in its initial form. As soon as it comes out in the market, the more human lives it is going
to save worldwide.

53
Kingston University – V2V Communication
Bibliography
Allenbaugh, A., 2008. 3D Content Central. [Online]
Available at: http://www.3dcontentcentral.com/Download-
Model.aspx?catalogid=171&id=130715
[Accessed 15 10 2011].
Chou, A., 2010. Military embedded systems. [Online]
Available at: http://www.mil-embedded.com/articles/id/?4508
[Accessed 13 01 2012].
Chung-Ming, H., Shih-Yang, L., Chia-Ching, Y. & Chih-Hsun, C., 2009. A Collision Pre-
Warning Algorithm based on V2V Communication. Taiwan: Institute for Information
Industry.
Chung-Ming, H., Shih-Yang, L., Chia-Ching, Y. & Chih-Hsun, C., 2009. A Collision Pre-
Warning Algorithm Based on V2V Communication. Fukuoka: Kung University.
Creed, B., Nalaka, K. & Scott, V., 2010. Development of a Full Car Vehicle Dynamics
Model for Use in the Design of an Active Suspension Control System. California:
University of California.
CSGNetwork, 2011. CSGNetwork. [Online]
Available at: http://www.csgnetwork.com/stopdistcalc.html
[Accessed 05 11 2011].
Firstcarnow, 2009. www.firstcarnow.com. [Online]
Available at: http://www.firstcarnow.com/
[Accessed 15 Dec 2011].
Fischer, D., 2006. Driving-school. [Online]
Available at: http://www.driving-school.com.au/gears.htm
[Accessed 03 01 2012].
Ho Ting, C., Hangguan Shan & Weihua, Z., 2010.
Infotainmentandroadsafetyservicesupportinvehicularnetworking:. Ontario, University of
Waterloo.

54
Kingston University – V2V Communication
Huang, H., 2011. sine.ni.com. [Online]
Available at: http://sine.ni.com/cs/app/doc/p/id/cs-13257
[Accessed 05 12 2011].
Instrument, N., 2009. NI SoftMotion for SolidWorks. [Online]
Available at: http://zone.ni.com/devzone/cda/tut/p/id/10493
[Accessed 15 09 2011].
Instrument, N., 2011. ni.com. [Online]
Available at: http://www.ni.com/compactrio/whatis/
[Accessed 15 09 2011].
Instruments, N., 2009. Getting Started with NI SoftMotion for SolidWorks. [Online]
Available at: http://zone.ni.com/devzone/cda/tut/p/id/9566
[Accessed 05 08 2011].
Instruments, N., 2009. National Instruments. [Online]
Available at: http://zone.ni.com/devzone/cda/tut/p/id/7139
[Accessed 10 09 2011].
Instruments, N., 2011. zone.ni.com. [Online]
Available at: http://zone.ni.com/devzone/cda/tut/p/id/13015#toc0
[Accessed 10 01 2012].
Instruments, N., 2011. zone.ni.com. [Online]
Available at: http://zone.ni.com/devzone/cda/tut/p/id/13013
[Accessed 17 01 2012].
Instruments, N., 2011. zone.ni.com. [Online]
Available at: http://zone.ni.com/devzone/cda/tut/p/id/13014
[Accessed 20 10 2011].
Joseph, W., 2010. Agilent Engineering Excellence Program: Collision Avoidance System.
[Online]
Available at:
http://www.home.agilent.com/upload/cmc_upload/All/Collision_Avoidance_System.pdf?
&cc=GB&lc=eng
[Accessed 19 01 2012].
55
Kingston University – V2V Communication
Lie, L., Xue, Y., Feng, Z. & N., H. V., 2004. A Vehicle-to-Vehicle Communication
Protocol. Illinois: MOBIQUITOUS.
Margolis, D. & Taehyun, S., 2000. A bond graph model incorporating sensors,actuators,
and vehicle dynamics for developingcontrollers for vehicle safety. California: Pergamon.
Miller, J., 2010. 3D Content Central. [Online]
Available at: http://www.3dcontentcentral.com/Download-
Model.aspx?catalogid=171&id=183277
[Accessed 15 01 2012].
Naik, A., 2005. Arc Path Collision Avoidance Algorithm for Autonomous Ground.
Blacksburg: Virginia Polytechnic Institute.
Ordys, A., Karwatzki, J. & Curley, A., 2006. Practical Aspects of Predictive Control
Algorithms. London: Kingston University.
Ordys, A., S.B., A., G., C. & D.S., L., 2011. Control Algorithm for driving test simulation.
London: Kingston University.
Publishing, S. E., 2009. Machines and Inventions-Factoscope Series. s.l.:Saddleback,
R.I.C. Publications, 2008.
Roth, D., 2007. V2V communication as a safety feature. [Online]
Available at: http://www.autoblog.com/2007/07/13/v2v-communication-as-a-safety-
feature/
[Accessed 07 09 2011].
RSA, 2007. Road Safet Authority. [Online]
Available at: http://www.rotr.ie/rules-for-driving/speed-limits/speed-limits_2-second-
rule.html
[Accessed 20 09 2011].
Schagrin, M., 2012. Intelligent Transportation Systems. [Online]
Available at: http://www.its.dot.gov/research/v2v.htm
[Accessed 28 01 2012].

56
Kingston University – V2V Communication
Shadyoldlady, 2012. www.shadyoldlady.com. [Online]
Available at: http://www.shadyoldlady.com/location.php?loc=843
[Accessed 12 01 2012].
Skiena, S. S., 2008. The Algorithm Design Manual. Second Edition ed. New York, USA:
Springer.
Soheila, V. B. & Pravin , V., 2001. Space division multiple access (SDMA) for robust ad
hoc vehicle communication networks. s.l.:IEEE In Intelligent Transportation Systems.
Strang, T. & Rockl, M., 2009. sti innsbruck. [Online]
Available at: http://www.sti-innsbruck.at/fileadmin/documents/vn-ws0809/11-VN-
WAVE.pdf
[Accessed 5 01 2012].
Subir, B., Tatchikou, R. & Francois, D., 2006. Vehicle-to-Vehicle Wireless
Communication protocols for enhancing highway traffic safety. IEEE Communications
Magazine, January.
T.M., F.-C., M., G.-L. & L., C., 2011. Mobile WiMAX for vehicular applications:
Performance evaluation. Coruna, Spain, University of A Coruna.
Tirerack.com, 2010. TIRE RACK. [Online]
Available at: http://www.tirerack.com/tires/tiretech/techpage.jsp?techid=46
[Accessed 12 01 2012].
transportation, U. s. d. o., 2010. fastlane.dot.gov. [Online]
Available at: http://fastlane.dot.gov/2010/05/coming-intelligent-technologies-promise-
greater-road-safety.html
[Accessed 05 11 2011].
V-MODELL®XT, 2008. Fundamentals of the V-Modell. s.l.:APACHE LICENSE.
Waterfall-model.com, 2011. Waterfall Model. [Online]
Available at: http://www.waterfall-model.com/v-model-waterfall-model/
[Accessed 7 01 2012].
Xue, Y., Jie, L. & Feng, Z., 2004. A Vehicle-to-Vehicle Communication Protocol for
cooperative collision warning. Illinois: Mobiquitous.

57
Kingston University – V2V Communication
Yamao, Y. & Minato, K., 2009. Vehicle-roadside-vehicle relay communication network
employing multiple frequencies and routing function. Tuscany: ISWCS 2009.

58
Kingston University – V2V Communication
Appendix-A

59
Kingston University – V2V Communication