VEHICLE THEFTS DOWN FOR SECOND YEAR · 2014 California Vehicle Theft Facts VEHICLE THEFTS In 2014,...
12
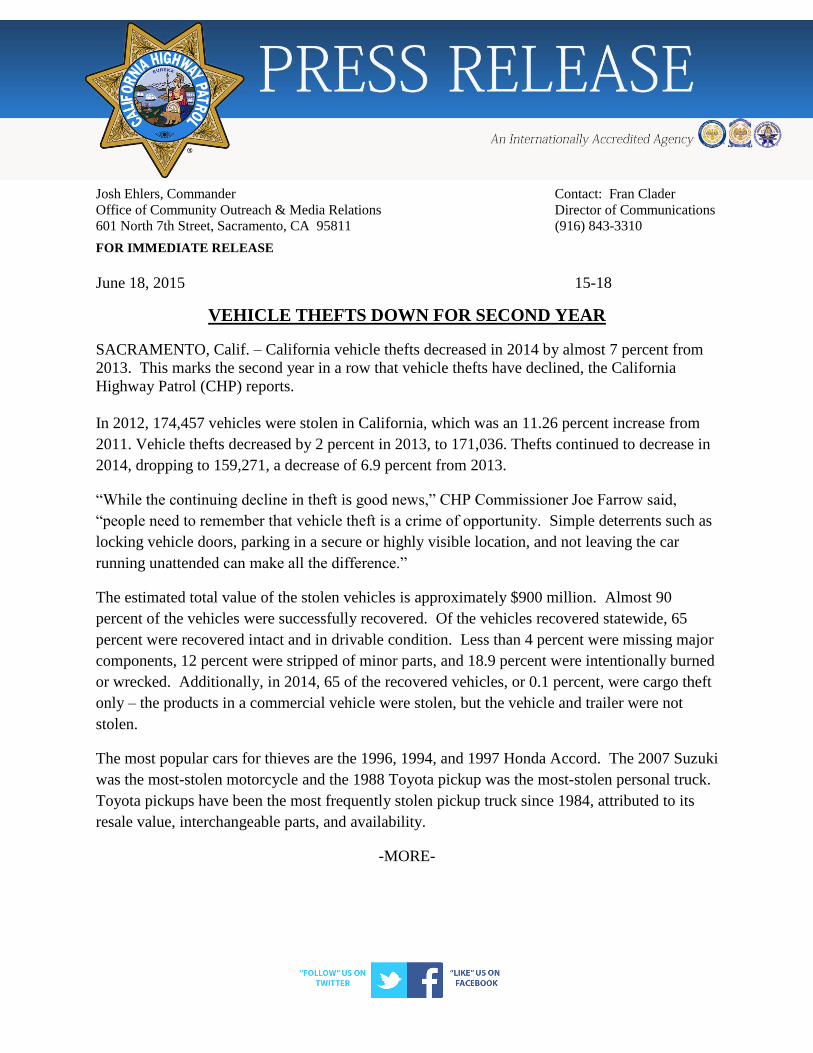
Josh Ehlers, Commander Contact: Fran Clader Office of Community Outreach & Media Relations Director of Communications 601 North 7th Street, Sacramento, CA 95811 (916) 843-3310 FOR IMMEDIATE RELEASE June 18, 2015 15-18 VEHICLE THEFTS DOWN FOR SECOND YEAR SACRAMENTO, Calif. – California vehicle thefts decreased in 2014 by almost 7 percent from 2013. This marks the second year in a row that vehicle thefts have declined, the California Highway Patrol (CHP) reports. In 2012, 174,457 vehicles were stolen in California, which was an 11.26 percent increase from 2011. Vehicle thefts decreased by 2 percent in 2013, to 171,036. Thefts continued to decrease in 2014, dropping to 159,271, a decrease of 6.9 percent from 2013. “While the continuing decline in theft is good news,” CHP Commissioner Joe Farrow said, “people need to remember that vehicle theft is a crime of opportunity. Simple deterrents such as locking vehicle doors, parking in a secure or highly visible location, and not leaving the car running unattended can make all the difference.” The estimated total value of the stolen vehicles is approximately $900 million. Almost 90 percent of the vehicles were successfully recovered. Of the vehicles recovered statewide, 65 percent were recovered intact and in drivable condition. Less than 4 percent were missing major components, 12 percent were stripped of minor parts, and 18.9 percent were intentionally burned or wrecked. Additionally, in 2014, 65 of the recovered vehicles, or 0.1 percent, were cargo theft only – the products in a commercial vehicle were stolen, but the vehicle and trailer were not stolen. The most popular cars for thieves are the 1996, 1994, and 1997 Honda Accord. The 2007 Suzuki was the most-stolen motorcycle and the 1988 Toyota pickup was the most-stolen personal truck. Toyota pickups have been the most frequently stolen pickup truck since 1984, attributed to its resale value, interchangeable parts, and availability. -MORE-
Transcript of VEHICLE THEFTS DOWN FOR SECOND YEAR · 2014 California Vehicle Theft Facts VEHICLE THEFTS In 2014,...
Josh Ehlers, Commander Contact: Fran Clader
Office of Community Outreach & Media Relations Director of Communications
601 North 7th Street, Sacramento, CA 95811 (916) 843-3310
FOR IMMEDIATE RELEASE
June 18, 2015 15-18
VEHICLE THEFTS DOWN FOR SECOND YEAR
SACRAMENTO, Calif. – California vehicle thefts decreased in 2014 by almost 7 percent from
2013. This marks the second year in a row that vehicle thefts have declined, the California
Highway Patrol (CHP) reports.
In 2012, 174,457 vehicles were stolen in California, which was an 11.26 percent increase from
2011. Vehicle thefts decreased by 2 percent in 2013, to 171,036. Thefts continued to decrease in
2014, dropping to 159,271, a decrease of 6.9 percent from 2013.
“While the continuing decline in theft is good news,” CHP Commissioner Joe Farrow said,
“people need to remember that vehicle theft is a crime of opportunity. Simple deterrents such as
locking vehicle doors, parking in a secure or highly visible location, and not leaving the car
running unattended can make all the difference.”
The estimated total value of the stolen vehicles is approximately $900 million. Almost 90
percent of the vehicles were successfully recovered. Of the vehicles recovered statewide, 65
percent were recovered intact and in drivable condition. Less than 4 percent were missing major
components, 12 percent were stripped of minor parts, and 18.9 percent were intentionally burned
or wrecked. Additionally, in 2014, 65 of the recovered vehicles, or 0.1 percent, were cargo theft
only – the products in a commercial vehicle were stolen, but the vehicle and trailer were not
stolen.
The most popular cars for thieves are the 1996, 1994, and 1997 Honda Accord. The 2007 Suzuki
was the most-stolen motorcycle and the 1988 Toyota pickup was the most-stolen personal truck.
Toyota pickups have been the most frequently stolen pickup truck since 1984, attributed to its
resale value, interchangeable parts, and availability.
-MORE-

An Internationally Accredited Agency
Almost half of vehicle thefts occurred in the five Southern California counties of Los Angeles,
Orange, Riverside, San Bernardino, and San Diego, which constitute 54 percent of California’s
population. The five Bay Area counties of Alameda, Marin, San Francisco, San Mateo, and
Santa Clara accounted for approximately 20 percent of all vehicle thefts.
The CHP offers drivers additional anti-theft tips:
Always make sure you receive an ownership certificate when purchasing a used vehicle.
Never hide a spare ignition key on the vehicle.
Take extra precautions against theft if you drive one of the vehicles that is popular with
thieves.
Be aware of your surroundings prior to leaving your vehicle.
Report possible vehicle theft activity by calling 1-800-TELL-CHP (1-800-835-5247).
The mission of the California Highway Patrol is to provide the highest level of Safety, Service,
and Security.
# # #

2014 California Vehicle Theft Facts
VEHICLE THEFTS
In 2014, 159,271 vehicles were stolen. The estimated total value of the stolen vehicles is approximately $900 million. (This figure is based on the average replacement value established by the Federal Bureau of Investigation.)
Of the vehicles stolen in 2014, 58.2 percent were automobiles, 26.2 percent were personal trucks and vans, 3.7 percent were commercial trucks and trailers, and 4.6 percent were motorcycles. All other vehicles (recreational vehicles, construction and farm equipment, special construction, etc.) accounted for 7.3 percent.
For each theft target category, the three most popular targets are listed below: Autos Commercial Trucks Honda Accord 1996 Freightliner 2007 Honda Accord 1994 Freightliner 2006 Honda Accord 1997 Freightliner 2008 Motorcycles Recreational Vehicles Suzuki 2007 All-Terrain Vehicle 2005 Yamaha 2007 Specialized Golf Cart 2014 Suzuki 2006 All-Terrain Vehicle 2013 Personal Trucks and Vans Trailers Toyota Pickup 1988 Homemade Utility Trailer 2014 Chevrolet Silverado 2003 Homemade Utility Trailer 2000 Honda CRV 1999 Carson Trailer 2005

2014 California Vehicle Theft Facts Page 2 WHERE THE THEFTS OCCURRED
Approximately 48.4 percent of all thefts occurred in Southern California (Los Angeles, Orange, Riverside, San Bernardino, and San Diego Counties). Of the thefts in Southern California, 51.1 percent occurred in Los Angeles County.
Approximately 20 percent of all thefts occurred in the San Francisco Bay area (Alameda, Marin, San Francisco, San Mateo, and Santa Clara Counties). Of the thefts in the San Francisco Bay area, 41.3 occurred in Alameda County.
Approximately 4.2 percent of all thefts occurred in Sacramento County.
Approximately 3.1 percent of all thefts occurred in Fresno County.
The remaining 24.3 percent of thefts occurred throughout California.

2014 California Vehicle Theft Facts Page 3 VEHICLE THEFT TRENDS
The 1996 Honda Accord ranks as the number one stolen vehicle statewide, the 1994 and 1997 Honda Accord are ranked at numbers two and three, respectively. The Honda Accord has remained the top ranking vehicle for theft since 2006.
Since 1984, Toyota pickups have consistently ranked as the number one most frequently stolen pickup truck. Its popularity is due to its resale value, interchangeable parts, easily defeated ignition system, and availability.
The 2007 Suzuki and the 2007 Yamaha have ranked as the number one and two most frequently stolen motorcycles every year since 2008.
Model years 2007, 2006, and 2008 Freightliner commercial trucks are ranked as the three most frequently stolen vehicles in their category. John Deere farm equipment has ranked as the number one stolen vehicle in its category since 2008. These vehicles and equipment are popular targets because of their high resale value, popularity, and availability.
VEHICLE RECOVERIES
Of the 159,271 vehicles stolen statewide in 2014, 89.6 percent were successfully recovered, representing 142,784 recovered vehicles.
Of the vehicles stolen statewide, 95.5 percent of the automobiles, 46.1 percent of the motorcycles, 90.1 percent of the personal trucks and vans, and 86 percent of the commercial trucks were recovered.
Of the vehicles recovered statewide, 65 percent were recovered intact and in drivable condition, 3.6 percent were missing major components, 12.4 percent were stripped of minor parts, and 18.9 percent were intentionally burned and/or wrecked, the remaining .1 percent is considered cargo theft only.
In 2014, it was determined that 65 of the recovered vehicles were cargo theft only. At .1 percent, the total number of cargo thefts in California is low compared to overall vehicle thefts, however, it is considered an ongoing problem as cargo theft is estimated to cost Californians hundreds of millions of dollars annually.

2014 California Vehicle Theft Facts Page 4
INFORMATION SOURCES
California Department of Justice, Stolen Vehicle System
California Highway Patrol, Vehicle Theft Information System
Federal Bureau of Investigation

DEPARTMENT OF CALIFORNIA HIGHWAY PATROL
THEFT AND RECOVERY DATA
A. THEFTS 2014 2013 % +/-
Automobiles 92,685 100,818 -8.1%
Motorcycles 7,308 7,511 -2.7%
Personal trucks and vans 41,768 44,127 -5.3%
Commercial trucks 987 1,501 -34.2%
Recreational vehicles 1,206 1,272 -5.2%
Trailers 4,882 6,177 -21.1%
Other 10,435 9,630 8.4%
TOTAL 159,271 171,036 -6.9%
B. RECOVERIES
Automobiles 88,479 96,838 -8.6%
Motorcycles 3,367 3,144 7.1%
Personal trucks and vans 37,613 39,727 -5.3%
Commercial trucks 849 1,277 -33.5%
Recreational vehicles 612 627 -2.4%
Trailers 2,522 2,317 -8.8%
Other 9,342 8,483 10.1%
TOTAL 142,784 152,413 -6.3%
C. RECOVERY RATE (%)
Automobiles 95.5% 96.1% -0.6%
Motorcycles 46.1% 41.9% 4.2%
Personal trucks and vans 90.1% 90.0% 0.1%
Commercial trucks 86.0% 85.1% 0.9%
Recreational vehicles 50.7% 49.3% 1.4%
Trailers 51.7% 37.6% 14.2%
Other 89.5% 88.1% 1.4%
TOTAL 89.6% 89.1% 0.5%
2014 CALIFORNIA
VEHICLE THEFT
065 - FIELD SUPPORT SECTION

2014
COUNTY 2013 2014 % +/- COUNTY 2013 2014 % +/-
Alameda 14,118 13,224 -6.3% Orange 7,639 6,624 -13.3%
Alpine 0 1 0.0% Placer 549 546 -0.5%
Amador 40 46 15.0% Plumas 8 20 150.0%
Butte 934 878 -6.0% Riverside 10,070 9,521 -5.5%
Calaveras 122 94 -23.0% Sacramento 7,191 6,772 -5.8%
Colusa 47 30 -36.2% San Benito 122 115 -5.7%
Contra Costa 6,497 6,394 -1.6% San Bernardino 12,357 11,178 -9.5%
Del Norte 79 80 1.3% San Diego 12,200 10,383 -14.9%
El Dorado 239 259 8.4% San Francisco 5,574 6,392 14.7%
Fresno 6,494 4,962 -23.6% San Joaquin 4,360 4,137 -5.1%
Glenn 69 58 -15.9% San Luis Obispo 339 352 3.8%
Humboldt 551 514 -6.7% San Mateo 1,607 1,670 3.9%
Imperial 478 570 19.2% Santa Barbara 1,076 1,165 8.3%
Inyo 15 12 -20.0% Santa Clara 10,460 10,153 -2.9%
Kern 5,903 4,891 -17.1% Santa Cruz 813 929 14.3%
Kings 442 364 -17.6% Shasta 1,091 884 -19.0%
Lake 168 170 1.2% Sierra 1 1 0.0%
Lassen 45 37 -17.8% Siskiyou 71 64 -9.9%
Los Angeles 41,811 39,470 -5.6% Solano 2,410 2,326 -3.5%
Madera 456 427 -6.4% Sonoma 730 832 14.0%
Marin 622 533 -14.3% Stanislaus 3,479 2,935 -15.6%
Mariposa 10 7 -30.0% Sutter 688 505 -26.6%
Mendocino 125 131 4.8% Tehama 230 234 1.7%
Merced 1,250 1,099 -12.1% Trinity 23 23 0.0%
Modoc 9 9 0.0% Tulare 2,158 1,867 -13.5%
Mono 2 7 250.0% Tuolumne 115 126 9.6%
Monterey 2,035 2,219 9.0% Ventura 1,698 1,639 -3.5%
Napa 245 216 -11.8% Yolo 591 618 4.6%
Nevada 149 147 -1.3% Yuba 159 115 -27.7%
Other 272 296 8.8%
2013 2014 % +/-
171,036 159,271 -6.9%Total
Thefts by
County
065 - FIELD SUPPORT SECTION

2014
COUNTY 2013 2014 % +/- COUNTY 2013 2014 % +/-
Alameda 13,586 12,769 -6.0% Orange 5,948 5,317 -10.6%
Alpine 0 0 0.0% Placer 431 400 -7.2%
Amador 31 37 19.4% Plumas 7 13 85.7%
Butte 771 730 -5.3% Riverside 8,861 8,477 -4.3%
Calaveras 85 46 -45.9% Sacramento 6,639 6,228 -6.2%
Colusa 33 25 -24.2% San Benito 165 158 -4.2%
Contra Costa 6,339 6,259 -1.3% San Bernardino 10,999 9,920 -9.8%
Del Norte 64 60 -6.3% San Diego 10,197 8,428 -17.3%
El Dorado 182 216 18.7% San Francisco 5,066 5,861 15.7%
Fresno 6,130 4,536 -26.0% San Joaquin 3,760 3,684 -2.0%
Glenn 50 49 -2.0% San Luis Obispo 320 331 3.4%
Humboldt 498 468 -6.0% San Mateo 1,319 1,381 4.7%
Imperial 239 263 10.0% Santa Barbara 932 1,040 11.6%
Inyo 11 11 0.0% Santa Clara 9,914 9,436 -4.8%
Kern 5,003 4,210 -15.9% Santa Cruz 694 780 12.4%
Kings 319 304 -4.7% Shasta 945 797 -15.7%
Lake 125 137 9.6% Sierra 0 0 0.0%
Lassen 39 32 -17.9% Siskiyou 46 51 10.9%
Los Angeles 36,760 34,578 -5.9% Solano 2,121 2,172 2.4%
Madera 399 342 -14.3% Sonoma 611 736 20.5%
Marin 470 386 -17.9% Stanislaus 2,980 2,666 -10.5%
Mariposa 6 4 -33.3% Sutter 601 463 -23.0%
Mendocino 114 130 14.0% Tehama 208 218 4.8%
Merced 1,082 998 -7.8% Trinity 13 18 38.5%
Modoc 4 9 125.0% Tulare 2,265 1,820 -19.6%
Mono 2 7 250.0% Tuolumne 88 82 -6.8%
Monterey 1,901 2,105 10.7% Ventura 1,419 1,430 0.8%
Napa 190 181 -4.7% Yolo 491 496 1.0%
Nevada 110 129 17.3% Yuba 161 99 -38.5%
Other 1,110 1,261 13.6%
2013 2014 % +/-
152,854 142,784 -6.6%Total
Recoveries by
County
065 - FIELD SUPPORT SECTION
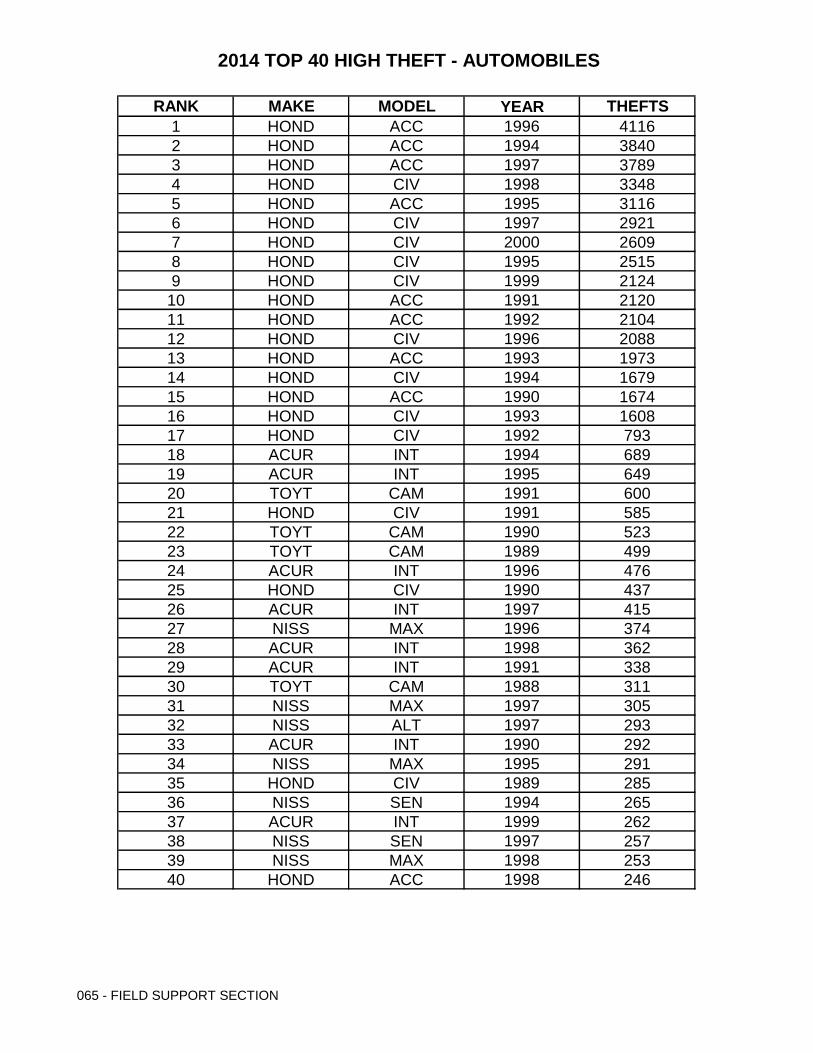
2014 TOP 40 HIGH THEFT - AUTOMOBILES
RANK MAKE MODEL YEAR THEFTS
1 HOND ACC 1996 4116
2 HOND ACC 1994 3840
3 HOND ACC 1997 3789
4 HOND CIV 1998 3348
5 HOND ACC 1995 3116
6 HOND CIV 1997 2921
7 HOND CIV 2000 2609
8 HOND CIV 1995 2515
9 HOND CIV 1999 2124
10 HOND ACC 1991 2120
11 HOND ACC 1992 2104
12 HOND CIV 1996 2088
13 HOND ACC 1993 1973
14 HOND CIV 1994 1679
15 HOND ACC 1990 1674
16 HOND CIV 1993 1608
17 HOND CIV 1992 793
18 ACUR INT 1994 689
19 ACUR INT 1995 649
20 TOYT CAM 1991 600
21 HOND CIV 1991 585
22 TOYT CAM 1990 523
23 TOYT CAM 1989 499
24 ACUR INT 1996 476
25 HOND CIV 1990 437
26 ACUR INT 1997 415
27 NISS MAX 1996 374
28 ACUR INT 1998 362
29 ACUR INT 1991 338
30 TOYT CAM 1988 311
31 NISS MAX 1997 305
32 NISS ALT 1997 293
33 ACUR INT 1990 292
34 NISS MAX 1995 291
35 HOND CIV 1989 285
36 NISS SEN 1994 265
37 ACUR INT 1999 262
38 NISS SEN 1997 257
39 NISS MAX 1998 253
40 HOND ACC 1998 246
065 - FIELD SUPPORT SECTION

2014 TOP 40 HIGH THEFT - PERSONAL TRUCKS
RANK MAKE MODEL YEAR THEFTS
1 TOYT PK 1988 299
2 CHEV SLV 2003 277
3 HOND CRV 1999 271
4 CHEV SLV 2006 266
5 HOND CRV 1998 246
6 TOYT PK 1986 246
7 CHEV SLV 2004 243
8 CHEV SLV 2005 242
9 HOND CRV 2000 235
10 NISS PK 1995 229
11 CHEV SLV 2001 222
12 HOND CRV 1997 217
13 TOYT PK 1987 215
14 HOND CRV 2001 214
15 NISS PK 1997 206
16 TOYT PK 1989 206
17 CHEV SLV 2000 203
18 TOYT PK 1985 199
19 NISS PK 1986 198
20 NISS PK 1993 195
21 CHEV SLV 2002 189
22 NISS PK 1991 189
23 CHEV TAH 2001 180
24 CHEV SLV 2007 174
25 CHEV TAH 2003 169
26 FORD F15 2014 163
27 TOYT PK 1990 163
28 NISS PK 1994 162
29 CHEV TAH 2004 158
30 TOYT PK 1994 157
31 TOYT PK 1992 154
32 TOYT PK 1993 154
33 CHEV TAH 2002 144
34 NISS PK 1990 143
35 TOYT PK 1991 140
36 NISS PK 1992 139
37 NISS PK 1987 136
38 CHEV TAH 2005 126
39 CADI ESC 2002 125
40 FORD F15 2013 122
065 - FIELD SUPPORT SECTION

2014 TOP 40 HIGH THEFT - MOTORCYCLES
RANK MAKE MODEL YEAR THEFTS
1 SUZI MC 2007 182
2 YAMA MC 2007 129
3 SUZI MC 2006 110
4 YAMA MC 2012 107
5 YAMA MC 2006 104
6 HOND MC 2005 103
7 YAMA MC 2005 100
8 HOND MC 2006 98
9 YAMA MC 2013 98
10 YAMA MC 2009 96
11 HOND MC 2007 92
12 HOND MC 2004 87
13 SUZI MC 2008 86
14 HOND MC 2003 82
15 SUZI MC 2013 78
16 HOND MC 2008 74
17 KAWK MC 2007 73
18 YAMA MC 2008 70
19 YAMA MC 2014 69
20 SUZI MC 2005 68
21 YAMA MC 2003 68
22 HD MC 2013 67
23 YAMA MC 2004 67
24 HOND MC 2002 66
25 HD MC 2006 63
26 HOND MC 2012 63
27 KAWK MC 2006 59
28 KAWK MC 2013 59
29 SUZI MC 2009 59
30 HD MC 2007 58
31 HOND MC 2013 58
32 HOND MC 2001 57
33 KAWK MC 2005 57
34 HD MC 2005 56
35 HD MC 2008 53
36 KAWK MC 2009 52
37 HOND MC 2009 50
38 SUZI MC 2012 50
39 HD MC 2003 49
40 SUZI MC 2011 49
065 - FIELD SUPPORT SECTION