Vehicle Technologies and Hydrogen and Fuel Cell ...
56
NREL is a national laboratory of the U.S. Department of Energy Office of Energy Efficiency & Renewable Energy Operated by the Alliance for Sustainable Energy, LLC This report is available at no cost from the National Renewable Energy Laboratory (NREL) at www.nrel.gov/publications. Contract No. DE-AC36-08GO28308 Technical Report NREL/TP-5400-79617 August 2021 Vehicle Technologies and Hydrogen and Fuel Cell Technologies Research and Development Programs Benefits Assessment Report for 2020 Aaron Brooker, Alicia Birky, Evan Reznicek, Jeff Gonder, Chad Hunter, Jason Lustbader, Chen Zhang, Lauren Sittler, Arthur Yip, Fan Yang, and Dong-Yeon Lee National Renewable Energy Laboratory
Transcript of Vehicle Technologies and Hydrogen and Fuel Cell ...
NREL is a national laboratory of the U.S. Department of Energy Office of Energy Efficiency & Renewable Energy Operated by the Alliance for Sustainable Energy, LLC This report is available at no cost from the National Renewable Energy Laboratory (NREL) at www.nrel.gov/publications.
Contract No. DE-AC36-08GO28308
Technical Report NREL/TP-5400-79617 August 2021
Vehicle Technologies and Hydrogen and Fuel Cell Technologies Research and Development Programs Benefits Assessment Report for 2020
Aaron Brooker, Alicia Birky, Evan Reznicek, Jeff Gonder, Chad Hunter, Jason Lustbader, Chen Zhang, Lauren Sittler, Arthur Yip, Fan Yang, and Dong-Yeon Lee
National Renewable Energy Laboratory

NREL is a national laboratory of the U.S. Department of Energy Office of Energy Efficiency & Renewable Energy Operated by the Alliance for Sustainable Energy, LLC This report is available at no cost from the National Renewable Energy Laboratory (NREL) at www.nrel.gov/publications.
Contract No. DE-AC36-08GO28308
National Renewable Energy Laboratory 15013 Denver West Parkway Golden, CO 80401 303-275-3000 • www.nrel.gov
Technical Report NREL/TP-5400-79617 August 2021
Vehicle Technologies and Hydrogen and Fuel Cell Technologies Research and Development Programs Benefits Assessment Report for 2020
Aaron Brooker, Alicia Birky, Evan Reznicek, Jeff Gonder, Chad Hunter, Jason Lustbader, Chen Zhang, Lauren Sittler, Arthur Yip, Fan Yang, and Dong-Yeon Lee
National Renewable Energy Laboratory
Suggested Citation Brooker, Aaron, Alicia Birky, Evan Reznicek, Jeff Gonder, Chad Hunter, Jason Lustbader, Chen Zhang, Lauren Sittler, Arthur Yip, Fan Yang, and Dong-Yeon Lee. 2021. Vehicle Technologies and Hydrogen and Fuel Cell Technologies Research and Development Programs Benefits Assessment Report for 2020. Golden, CO: National Renewable Energy Laboratory. NREL/TP-5400-79617. https://www.nrel.gov/docs/fy21osti/79617.pdf.

NOTICE
This work was authored by the National Renewable Energy Laboratory, operated by Alliance for Sustainable Energy, LLC, for the U.S. Department of Energy (DOE) under Contract No. DE-AC36-08GO28308. Funding provided by the U.S. Department of Energy Office of Energy Efficiency and Renewable Energy Vehicle Technologies Office and Hydrogen and Fuel Cell Technologies Office. The views expressed herein do not necessarily represent the views of the DOE or the U.S. Government.
This report is available at no cost from the National Renewable Energy Laboratory (NREL) at www.nrel.gov/publications.
U.S. Department of Energy (DOE) reports produced after 1991 and a growing number of pre-1991 documents are available free via www.OSTI.gov.
Cover Photos by Dennis Schroeder: (clockwise, left to right) NREL 51934, NREL 45897, NREL 42160, NREL 45891, NREL 48097, NREL 46526.
NREL prints on paper that contains recycled content.

iii This report is available at no cost from the National Renewable Energy Laboratory at www.nrel.gov/publications.
Acknowledgments We would like to thank staff and support contractors with the U.S. Department of Energy’s Vehicle Technologies Office (VTO) and Hydrogen and Fuel Cell Technologies Office (HFTO) for their program and technical support. Specifically, we would like to thank Jacob Ward, David Howell, Madhur Boloor, and Raphael Isaac on the VTO side and Neha Rustagi, Sunita Satyapal, Marc Melaina, and Mariya Koleva on the HFTO side for their program support, technical guidance, and coordination with technology managers. Thanks to Sarah Kleinbaum, David Gotthold, and Felix Wu for input and feedback on lightweighting technologies. Thanks to Gurpreet Singh, Ken Howden, Kevin Stork, Michael Weismiller, and Siddiq Khan for input on advanced combustion and fuels. Thanks to Brian Cunningham, Samm Gillard, and Susan Rogers for input on batteries and electric drive technologies. Thanks to Ned Stetson, Dimitrios Papageorgopoulos, Jesse Adams, and Greg Kleen for input on hydrogen fuel cell and storage technologies.

iv This report is available at no cost from the National Renewable Energy Laboratory at www.nrel.gov/publications.
List of Acronyms 21CTP 21st Century Truck Partnership ADOPT Automotive Deployment Options Projection Tool AEO Annual Energy Outlook BEV battery electric vehicle DOE U.S. Department of Energy EDT electric drive technologies EIA U.S. Energy Information Administration FASTSim Future Automotive Systems Technology Simulator FCEV fuel cell electric vehicle GREET Greenhouse Gases, Regulated Emissions, and Energy Use in
Transportation HEV hybrid electric vehicle HFTO Hydrogen and Fuel Cell Technologies Office LD light-duty MDHD medium- and heavy-duty NREL National Renewable Energy Laboratory PEV plug-in electric vehicle (includes PHEVs and BEVs) PHEV plug-in hybrid electric vehicle R&D research and development VTO Vehicle Technologies Office
Units kg kilogram kW kilowatt kWh kilowatt-hour mpg miles per gallon MPGDE miles per gallon diesel equivalent

v This report is available at no cost from the National Renewable Energy Laboratory at www.nrel.gov/publications.
Executive Summary The U.S. Department of Energy’s Vehicle Technologies Office (VTO) and Hydrogen and Fuel Cell Technologies Office (HFTO) support research and development to decarbonize transportation with affordable, energy-efficient technologies. VTO and HFTO regularly revisit and update relevant research and development goals and areas of emphasis in response to the latest technological advancements and in alignment with current national priorities. As such, analyses of expected benefits resulting from VTO and HFTO investments and anticipated goal achievements are updated periodically, and will be again for 2021 in the context of the latest national-level transportation decarbonization goals. The analysis in the present report is based on technical progress goals established in VTO and HFTO in the years immediately prior to and including 2020, and summarizes the estimated energy and emissions benefits corresponding to achievement of those goals. The goals span research activities on batteries, electric drive technologies (EDT), combustion, lightweight materials, fuel cells, hydrogen storage, and hydrogen fuel. The evaluation includes detailed analyses into the benefits of technology improvements on the U.S. light-duty (LD) vehicle fleet and separately on the U.S. medium- and heavy-duty (MDHD) vehicle fleet. This report summarizes the outcomes from each of these analyses both independently and in combination.
The analyses include an assumption that once technology improvements are achieved in a laboratory environment, it takes 5 years before they begin entering the new vehicle market. Accordingly, the analyses assume that research investments up through 2020 influence technologies appearing in new vehicles up through 2025. The analyses exclude impacts from such past research investments, and therefore focus on benefits from prospective future investments as reflected in estimated new vehicle sales from 2025–2050. Although the analyses do not explicitly quantify estimated benefits beyond 2050, the trends suggest benefits continue to accrue further into the future.
Light-Duty Vehicle Analysis The Automotive Deployment Options Projection Tool (ADOPT) is used to estimate the benefits for LD vehicles. ADOPT is a vehicle choice and stock model that estimates vehicle technology improvement impacts on sales, energy, and emissions [1, 2]. It includes all the existing vehicle options for realism, estimates their sales based on extensively validated consumer preferences, generates new market-driven vehicle options through time, and rolls up sales to estimate energy and emissions. The analysis for this report assumes continuation of private ownership, as opposed to large-scale shifts to alternate travel paradigms like ride-hailing. It also excludes potential future breakthrough technologies and policy drivers such as rollout of high-power extreme fast charging, grant funding for hydrogen stations, and/or mandated phaseout of combustion engine vehicles in the future.
ADOPT applies technology progress assumptions to the modeled vehicles through time. The assumptions are represented by a “No Program” scenario that reflects the technology improvements assumed to occur without further investments from VTO or HFTO (e.g., improvements that may occur due to investments from other organizations, such as separate government agencies worldwide or the private sector), and a “Program Success” scenario under which VTO and HFTO program goals are realized. Figure ES-1 shows the No Program versus Program Success assumptions for several key technologies. In addition to the 5-year delay

vi This report is available at no cost from the National Renewable Energy Laboratory at www.nrel.gov/publications.
between the indicated achievement dates and the year that each technology level becomes available in new vehicles, the analysis assumes a 1.5 cost multiplier to convert manufacturing costs to baseline consumer price in a vehicle.
Figure ES-1. Key LD technology assumptions and program goals by Lab year
0
5
10
15
20
2010 2020 2030 2040 2050
Cost
($/k
W)
High Voltage System Cost(without boost)
No Program
Program Success
$0$5
$10$15$20$25$30$35
0% 10% 20% 30%
Cost
($/k
g)
No Program Lightweigh�ng Cost
20202025
20352045
$0$5
$10$15$20$25$30$35
0% 10% 20% 30%
Cost
($/k
g)
Program Success Lightweigh�ng Cost
2020
20252035
2045
%
20%
40%
60%
80%
2010 2020 2030 2040 2050
Peak Fuel Cell System Efficiency
Program SuccessNo Program
%
20%
40%
60%
80%
2010 2020 2030 2040 2050
Peak Gasoline Engine Efficiency
Program Success
No Program
0
50
100
150
200
2010 2020 2030 2040 2050
Cost
($/k
W)
Fuel Cell System Cost
No ProgramProgram Success
0
50
100
150
200
250
2010 2020 2030 2040 2050
Usab
le E
nerg
y Co
st ($
/kW
h)
BEV Ba�ery Pack Cost
No Program
Program Success
0
1000
2000
3000
4000
5000
2010 2020 2030 2040 2050
Cost
($)
Hydrogen Storage Cost (5.6 kg)
No ProgramProgram Success
vii This report is available at no cost from the National Renewable Energy Laboratory at www.nrel.gov/publications.
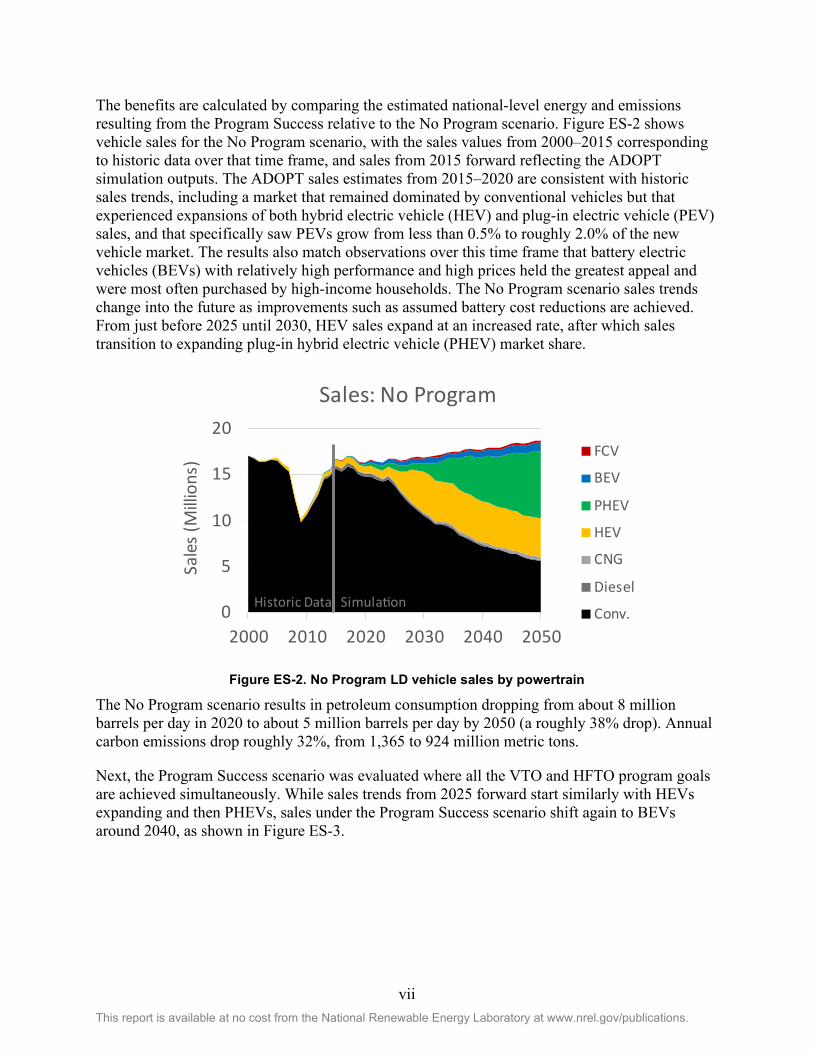
The benefits are calculated by comparing the estimated national-level energy and emissions resulting from the Program Success relative to the No Program scenario. Figure ES-2 shows vehicle sales for the No Program scenario, with the sales values from 2000–2015 corresponding to historic data over that time frame, and sales from 2015 forward reflecting the ADOPT simulation outputs. The ADOPT sales estimates from 2015–2020 are consistent with historic sales trends, including a market that remained dominated by conventional vehicles but that experienced expansions of both hybrid electric vehicle (HEV) and plug-in electric vehicle (PEV) sales, and that specifically saw PEVs grow from less than 0.5% to roughly 2.0% of the new vehicle market. The results also match observations over this time frame that battery electric vehicles (BEVs) with relatively high performance and high prices held the greatest appeal and were most often purchased by high-income households. The No Program scenario sales trends change into the future as improvements such as assumed battery cost reductions are achieved. From just before 2025 until 2030, HEV sales expand at an increased rate, after which sales transition to expanding plug-in hybrid electric vehicle (PHEV) market share.
Figure ES-2. No Program LD vehicle sales by powertrain
The No Program scenario results in petroleum consumption dropping from about 8 million barrels per day in 2020 to about 5 million barrels per day by 2050 (a roughly 38% drop). Annual carbon emissions drop roughly 32%, from 1,365 to 924 million metric tons.
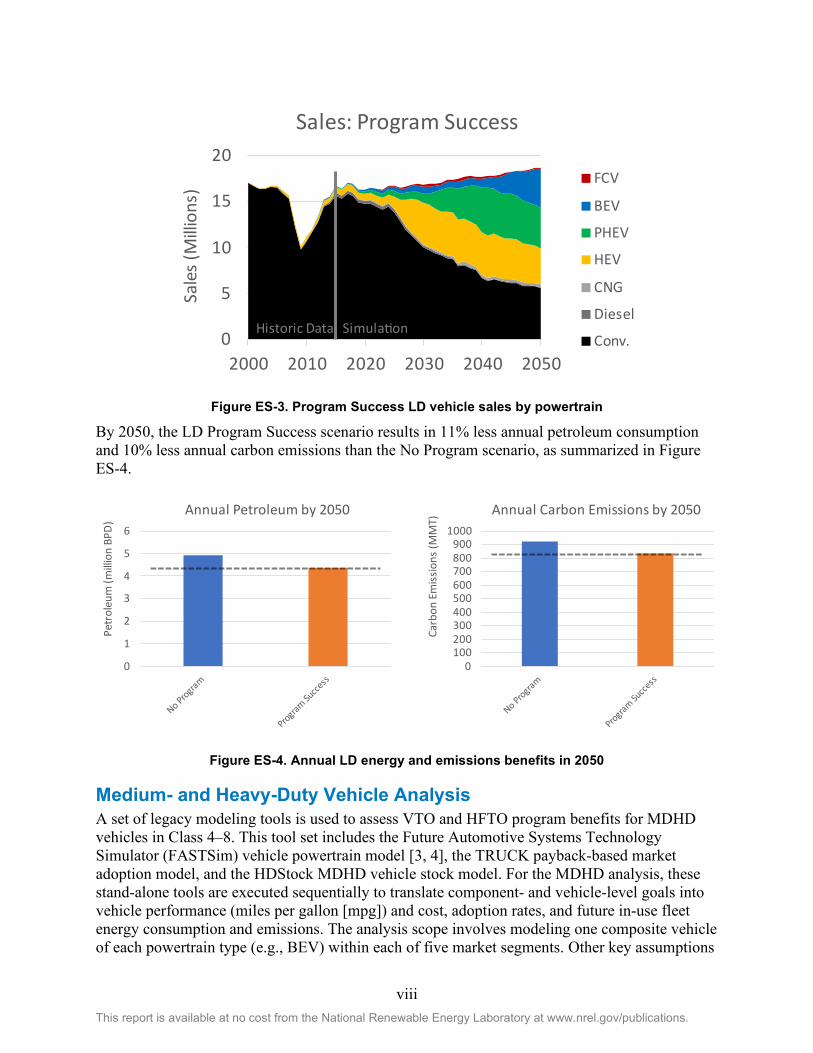
Next, the Program Success scenario was evaluated where all the VTO and HFTO program goals are achieved simultaneously. While sales trends from 2025 forward start similarly with HEVs expanding and then PHEVs, sales under the Program Success scenario shift again to BEVs around 2040, as shown in Figure ES-3.
0
5
10
15
20
2000 2010 2020 2030 2040 2050
Sale
s (M
illion
s)
Sales: No Program
FCV
BEV
PHEV
HEV
CNG
Diesel
Conv.Historic Data Simula�on
viii This report is available at no cost from the National Renewable Energy Laboratory at www.nrel.gov/publications.
Figure ES-3. Program Success LD vehicle sales by powertrain
By 2050, the LD Program Success scenario results in 11% less annual petroleum consumption and 10% less annual carbon emissions than the No Program scenario, as summarized in Figure ES-4.
Figure ES-4. Annual LD energy and emissions benefits in 2050
Medium- and Heavy-Duty Vehicle Analysis A set of legacy modeling tools is used to assess VTO and HFTO program benefits for MDHD vehicles in Class 4–8. This tool set includes the Future Automotive Systems Technology Simulator (FASTSim) vehicle powertrain model [3, 4], the TRUCK payback-based market adoption model, and the HDStock MDHD vehicle stock model. For the MDHD analysis, these stand-alone tools are executed sequentially to translate component- and vehicle-level goals into vehicle performance (miles per gallon [mpg]) and cost, adoption rates, and future in-use fleet energy consumption and emissions. The analysis scope involves modeling one composite vehicle of each powertrain type (e.g., BEV) within each of five market segments. Other key assumptions
0
5
10
15
20
2000 2010 2020 2030 2040 2050
Sale
s (M
illion
s)
Sales: Program Success
FCV
BEV
PHEV
HEV
CNG
Diesel
Conv.Historic Data Simula�on
0
1
2
3
4
5
6
Petr
oleu
m (m
illion
BPD
)
Annual Petroleum by 2050
0100200300400500600700800900
1000
Carb
on E
miss
ions
(MM
T)
Annual Carbon Emissions by 2050

ix This report is available at no cost from the National Renewable Energy Laboratory at www.nrel.gov/publications.
include overnight but no en route charging for electrified vehicles, and no fueling infrastructure constraints for Class 7 and 8 trucks or any depot-refueled vehicles.
In general, VTO does not have component-level goals specific to MDHD vehicles, but rather the SuperTruck II initiative has engine efficiency and vehicle-level freight efficiency goals. HFTO recently established goals for Class 8 long-haul tractors [5]. These goals, in addition to recent analysis by the National Renewable Energy Laboratory (NREL) for VTO, are used to establish future vehicle characteristics as inputs to FASTSim, which then feed into TRUCK, which in turn provides inputs for HDStock. As with the LD analysis, technologies incorporating research goals are assumed to enter the market 5 years after program success with a 1.5 cost multiplier to convert manufacturing costs to consumer price. Several key technology improvement assumptions are shown in Figure ES-5.
Figure ES-5. Key MDHD technology assumptions by model year (Lab year + 5)
x This report is available at no cost from the National Renewable Energy Laboratory at www.nrel.gov/publications.
The Program Success results represent realization of these program goals and are compared to a No Program case derived from the 2020 Annual Energy Outlook (AEO) Reference Case [6] by removing future adoption of component technologies supported by VTO or HFTO research and development (R&D). The No Program case retains the very small penetration of alternative powertrains from the AEO Reference Case, including PHEVs, BEVs, and fuel cell electric vehicles (FCEVs). The projections for each powertrain are below 0.6% of sales within each vehicle class and combined account for less than 1.7% of sales within any vehicle class. There is no market penetration of strong hybrids in either the Reference or No Program cases.
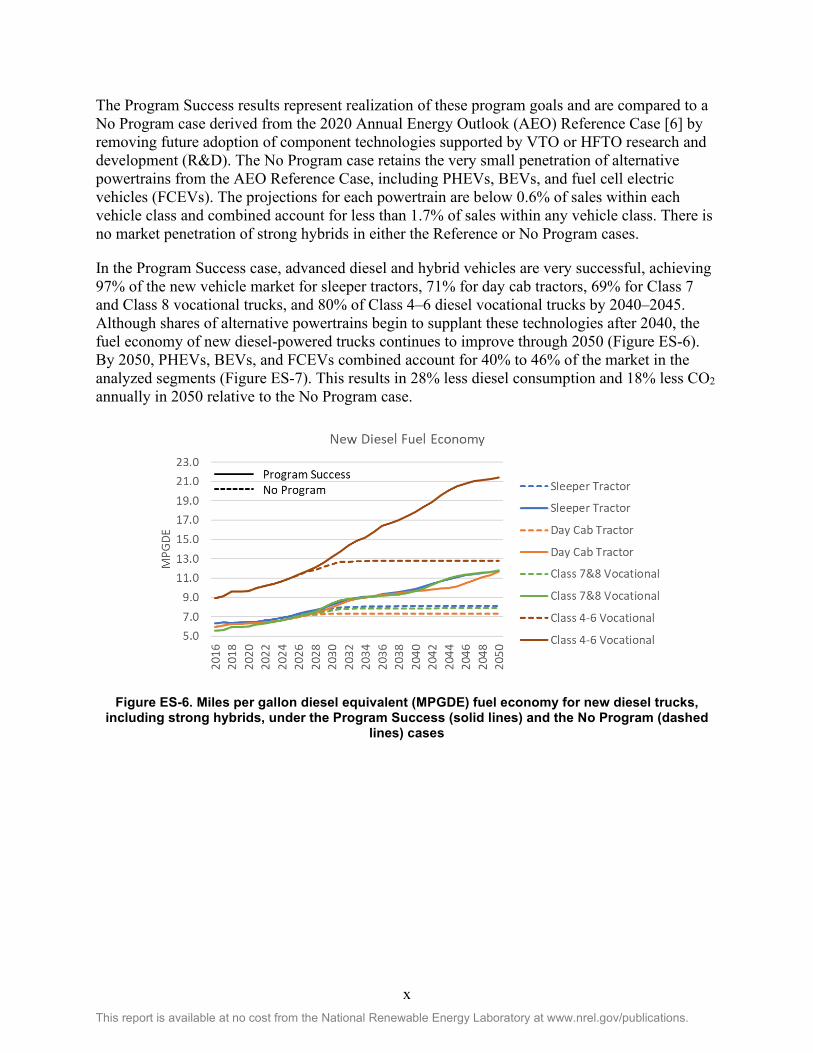
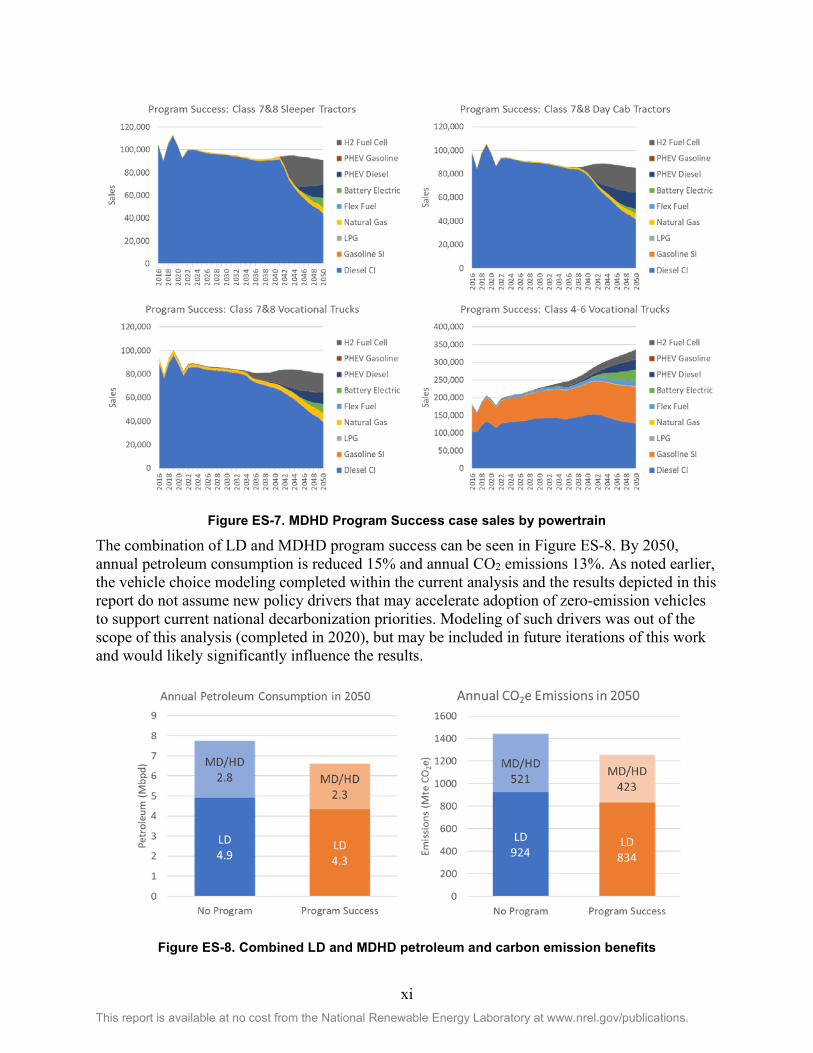
In the Program Success case, advanced diesel and hybrid vehicles are very successful, achieving 97% of the new vehicle market for sleeper tractors, 71% for day cab tractors, 69% for Class 7 and Class 8 vocational trucks, and 80% of Class 4–6 diesel vocational trucks by 2040–2045. Although shares of alternative powertrains begin to supplant these technologies after 2040, the fuel economy of new diesel-powered trucks continues to improve through 2050 (Figure ES-6). By 2050, PHEVs, BEVs, and FCEVs combined account for 40% to 46% of the market in the analyzed segments (Figure ES-7). This results in 28% less diesel consumption and 18% less CO2 annually in 2050 relative to the No Program case.
Figure ES-6. Miles per gallon diesel equivalent (MPGDE) fuel economy for new diesel trucks, including strong hybrids, under the Program Success (solid lines) and the No Program (dashed
lines) cases
xi This report is available at no cost from the National Renewable Energy Laboratory at www.nrel.gov/publications.
Figure ES-7. MDHD Program Success case sales by powertrain
The combination of LD and MDHD program success can be seen in Figure ES-8. By 2050, annual petroleum consumption is reduced 15% and annual CO2 emissions 13%. As noted earlier, the vehicle choice modeling completed within the current analysis and the results depicted in this report do not assume new policy drivers that may accelerate adoption of zero-emission vehicles to support current national decarbonization priorities. Modeling of such drivers was out of the scope of this analysis (completed in 2020), but may be included in future iterations of this work and would likely significantly influence the results.
Figure ES-8. Combined LD and MDHD petroleum and carbon emission benefits
xii This report is available at no cost from the National Renewable Energy Laboratory at www.nrel.gov/publications.
Table of Contents Executive Summary .................................................................................................................................... v Introduction ................................................................................................................................................. 1 Light-Duty Vehicle Benefits ....................................................................................................................... 1
Approach ................................................................................................................................................ 1 Assumptions ........................................................................................................................................... 3
Fuel Prices ..................................................................................................................................... 4 Carbon Emissions .......................................................................................................................... 4
VTO Program Goals ............................................................................................................................... 5 Batteries ......................................................................................................................................... 5 Electric Drive Technologies .......................................................................................................... 6 Combustion ................................................................................................................................... 6 Materials ........................................................................................................................................ 7
HFTO Program Goals ............................................................................................................................ 7 Fuel Cells and Hydrogen Storage .................................................................................................. 7 Hydrogen Prices and Emissions .................................................................................................... 8
Results .................................................................................................................................................... 9 No Program ................................................................................................................................... 9 Program Success ......................................................................................................................... 15 LD Benefits Analysis Summary .................................................................................................. 17
Heavy-Duty Vehicle Benefits.................................................................................................................... 18 Approach .............................................................................................................................................. 18
Scope and Market Segmentation ................................................................................................. 18 No Program Case ........................................................................................................................ 19 Vehicle Modeling ........................................................................................................................ 20 Market Adoption ......................................................................................................................... 20 Benefits Estimation ..................................................................................................................... 22
Assumptions ......................................................................................................................................... 22 Fuel Prices ................................................................................................................................... 22 Fuel Availability .......................................................................................................................... 23 Emissions .................................................................................................................................... 24
VTO Program Goals ............................................................................................................................. 25 Batteries ....................................................................................................................................... 25 Electric Drive Technologies ........................................................................................................ 26 Combustion ................................................................................................................................. 27 Glider and Other Goals ............................................................................................................... 27
HFTO Program Goals .......................................................................................................................... 28 Fuel Cells and Hydrogen Storage ................................................................................................ 28
Results .................................................................................................................................................. 29 No Program ................................................................................................................................. 29 Program Success ......................................................................................................................... 31 MDHD Benefits Analysis Summary ........................................................................................... 38
Combined Light-Duty and Medium-/Heavy-Duty Benefits Summary................................................... 39 References ................................................................................................................................................. 40
xiii This report is available at no cost from the National Renewable Energy Laboratory at www.nrel.gov/publications.
List of Figures Figure ES-1. Key LD technology assumptions and program goals by Lab year ......................................... vi Figure ES-2. No Program LD vehicle sales by powertrain ......................................................................... vii Figure ES-3. Program Success LD vehicle sales by powertrain ................................................................ viii Figure ES-4. Annual LD energy and emissions benefits in 2050 .............................................................. viii Figure ES-5. Key MDHD technology assumptions by model year (Lab year + 5) ..................................... ix Figure ES-6. Miles per gallon diesel equivalent (MPGDE) fuel economy for new diesel trucks, including
strong hybrids, under the Program Success (solid lines) and the No Program (dashed lines) cases ......................................................................................................................................... x
Figure ES-7. MDHD Program Success case sales by powertrain ................................................................ xi Figure ES-8. Combined LD and MDHD petroleum and carbon emission benefits ..................................... xi Figure 1. Overview of the ADOPT model .................................................................................................... 2 Figure 2. Example ADOPT validation (comparing model estimates against actual national vehicle sales
data in 2015)............................................................................................................................. 3 Figure 3. AEO 2020 reference case fuel prices and hydrogen fuel assumptions .......................................... 4 Figure 4. AEO 2020 reference case fuel carbon intensity and hydrogen fuel assumptions .......................... 5 Figure 5. ADOPT’s estimated sales by powertrain compared to historical data [15] ................................. 10 Figure 6. ADOPT estimates compared to historical BEV and PHEV sales [15] ........................................ 11 Figure 7. Comparing ADOPT estimates to historical data on the income distribution of electric vehicle
owners [16] ............................................................................................................................ 11 Figure 8. Sales by vehicle price in 2016 [17].............................................................................................. 12 Figure 9. No Program sales by powertrain ................................................................................................. 12 Figure 10. Relative generalized cost and sales for bestselling vehicle options by powertrain in 2025 for
the No Program scenario ........................................................................................................ 13 Figure 11. No Program scenario bestselling vehicles by powertrain in 2030 ............................................. 15 Figure 12. No Program scenario energy consumption and CO2 emissions by powertrain ......................... 15 Figure 13. Sales comparison between the No Program and Program Success scenarios ........................... 16 Figure 14. Program Success scenario bestselling vehicles by powertrain in 2040 ..................................... 16 Figure 15. Program Success energy and emissions benefits ....................................................................... 17 Figure 16. Summary of estimated program benefits for light-duty vehicles .............................................. 17 Figure 17. MDHD analysis approach ......................................................................................................... 18 Figure 18. TRUCK model mileage cohorts ................................................................................................ 21 Figure 19. MDHD fuel price assumptions .................................................................................................. 23 Figure 20. Fuel availability assumptions for Class 4–6 vocational trucks ................................................. 24 Figure 21. MDHD well-to-wheels emissions factors .................................................................................. 24 Figure 22. MDHD battery goals ................................................................................................................. 26 Figure 23. No Program case new diesel fleet fuel economy (MPGDE) ..................................................... 30 Figure 24. No Program case energy consumption ...................................................................................... 31 Figure 25. Program Success case MDHD simulation results ..................................................................... 32 Figure 26. Estimated MDHD electric range ............................................................................................... 32 Figure 27. Program Success case MDHD estimated cost ........................................................................... 33 Figure 28. Improvement in diesel truck fuel economy due to adoption of advanced diesels and strong
hybrids .................................................................................................................................... 34 Figure 29. MDHD Program Success case sales by powertrain ................................................................... 34 Figure 30. Change in new MDHD fleet fuel economy ............................................................................... 35 Figure 31. Change in MDHD in-use fleet fuel economy (MPGDE) .......................................................... 36 Figure 32. MDHD Program Success case energy use and CO2 emissions ................................................. 37 Figure 33. Change in MDHD vehicle and fuel expenditures in the Program Success case relative to the No
Program case .......................................................................................................................... 38 Figure 34. Combined LD and MDHD petroleum and carbon emission benefits ........................................ 39

xiv This report is available at no cost from the National Renewable Energy Laboratory at www.nrel.gov/publications.
List of Tables Table 1. Battery No Program Assumption by Year ...................................................................................... 5 Table 2. Battery Program Success Assumptions by Year ............................................................................. 5 Table 3. EDT No Program Assumptions by Year......................................................................................... 6 Table 4. EDT Program Success assumptions by year. .................................................................................. 6 Table 5. Combustion No Program Peak Engine Efficiency Assumptions by Type and Year ...................... 6 Table 6. Combustion Program Success Peak Efficiency Assumptions by Engine Type and Year .............. 6 Table 7. Materials No Program Price ($/kg) Lightweighting Assumptions by Percent of Lightweighting
and Year ................................................................................................................................... 7 Table 8. Materials Program Success Price ($/kg) Lightweighting Assumptions by Percent of
Lightweighting and Year ......................................................................................................... 7 Table 9. Fuel Cells and Hydrogen Storage No Program Scenario Assumptions .......................................... 8 Table 10. Fuel Cells and Hydrogen Storage Program Success Scenario Assumptions. ............................... 8 Table 11. Hydrogen No Program Fuel Prices and Emissions ....................................................................... 9 Table 12. Hydrogen Program Success Fuel prices and emissions. ............................................................... 9 Table 13. MDHD FASTSim Modeling Approach ...................................................................................... 20 Table 14. MDHD Battery Goals ................................................................................................................. 26 Table 15. Electric Drive Technology Goals ................................................................................................ 26 Table 16. Engine Peak Efficiency Goals .................................................................................................... 27 Table 17. MDHD Aerodynamic Drag, Rolling Resistance, and Auxiliary Loads ...................................... 28 Table 18. Fuel Cell and Hydrogen Storage Goals....................................................................................... 29

1 This report is available at no cost from the National Renewable Energy Laboratory at www.nrel.gov/publications.
Introduction The U.S. Department of Energy’s (DOE’s) Vehicle Technologies Office (VTO) and Hydrogen and Fuel Cell Technologies Office (HFTO) support research and development of efficient and sustainable transportation technologies that will affordably reduce emissions from transportation. VTO and HFTO regularly revisit and update relevant research and development goals and areas of emphasis in response to the latest technological advancements and in alignment with current national priorities. As such, analyses of expected benefits resulting from VTO and HFTO investments and anticipated goal achievements are updated periodically and will be again for 2021 in the context of the latest national-level transportation decarbonization goals. The analysis in the present report is based on technical progress goals established in VTO and HFTO in the years immediately prior to and including 2020, and summarizes the estimated energy and emissions benefits corresponding to achievement of those goals. The goals span research activities on batteries, electric drive technologies (EDT), combustion, lightweight materials, fuel cells, hydrogen storage, and hydrogen fuel. The evaluation includes detailed analyses into the benefits of technology improvements on the U.S. light-duty (LD) vehicle fleet and separately on the U.S. medium- and heavy-duty (MDHD) vehicle fleet. This report summarizes the outcomes from each of these analyses both independently and in combination.
The analyses include an assumption that once technology improvements are achieved in a laboratory environment, it takes 5 years before they begin entering the new vehicle market. Accordingly, the analyses assume that research investments up through 2020 influence technologies appearing in new vehicles up through 2025. The analyses exclude impacts from such past research investments, and therefore focus on benefits from prospective future investments as reflected in estimated new vehicle sales from 2025–2050. Although the analyses do not explicitly quantify estimated benefits beyond 2050, the trends suggest benefits continue to accrue further into the future.
Light-Duty Vehicle Benefits Approach This study uses the Automotive Deployment Options Projection Tool (ADOPT) to estimate LD VTO and HFTO technology improvement impacts on energy and CO2 emissions benefits. The National Renewable Energy Laboratory (NREL), with support from VTO, HFTO, and the Bioenergy Technologies Office, has developed and applied ADOPT for many similar analyses [1, 2, 7, 8]. Figure 1 shows an overview illustration of how ADOPT operates.

2 This report is available at no cost from the National Renewable Energy Laboratory at www.nrel.gov/publications.
Figure 1. Overview of the ADOPT model
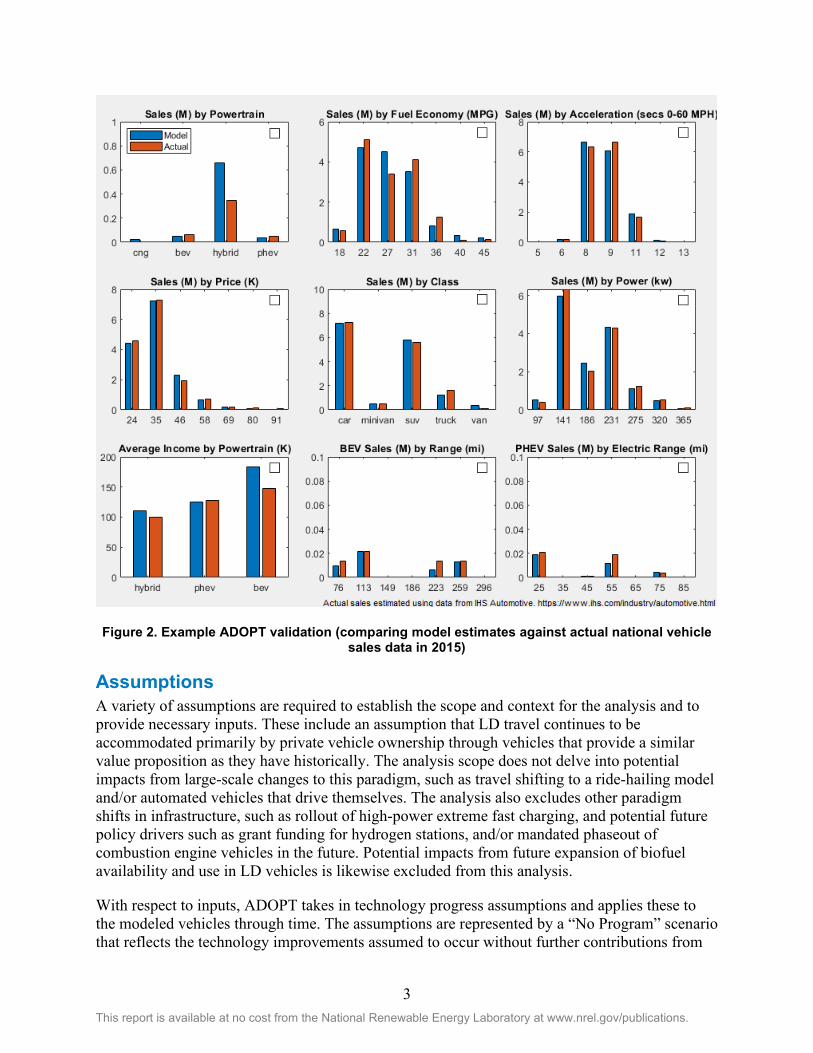
ADOPT is a vehicle choice and stock model that estimates vehicle technology improvement impacts on sales, energy, and CO2 emissions. Simulations start with the over 700 existing vehicle makes, models, and options. This provides realism, captures any outlier characteristics of the bestselling advanced vehicles, and enables regulation influences to be modeled. Sales among the vehicles are estimated based on their attributes including price, fuel cost per mile, acceleration, size, and range. The modeled consumer value of the attributes changes nonlinearly across their range and as a function of consumer income. For example, differences in acceleration are more important for very quick or very slow accelerating vehicles, and acceleration importance increases for high-income households. This approach enables ADOPT to match historical sales in many dimensions, as shown in Figure 2, and across multiple years—all of which helps to provide confidence in the results. The consumer preferences are also used to create new future vehicle options based on market conditions using the integrated Future Automotive Systems Technology Simulator (FASTSim) vehicle powertrain model [3, 4]. Using an optimization routine, ADOPT sends FASTSim different component sizes, such as engine or battery size, and gets back vehicle attributes, including efficiency and acceleration. It then uses those attributes to estimate sales and find the best component sizes. This leads to market-driven vehicle options. For example, as battery prices decrease, ADOPT tends to create battery electric vehicles (BEVs) with larger batteries that provide longer range and better acceleration. The sales estimates feed into a stock model that tracks sales, miles traveled, and survival of vehicles to quantify energy consumption and carbon emissions.
3 This report is available at no cost from the National Renewable Energy Laboratory at www.nrel.gov/publications.
Figure 2. Example ADOPT validation (comparing model estimates against actual national vehicle sales data in 2015)
Assumptions A variety of assumptions are required to establish the scope and context for the analysis and to provide necessary inputs. These include an assumption that LD travel continues to be accommodated primarily by private vehicle ownership through vehicles that provide a similar value proposition as they have historically. The analysis scope does not delve into potential impacts from large-scale changes to this paradigm, such as travel shifting to a ride-hailing model and/or automated vehicles that drive themselves. The analysis also excludes other paradigm shifts in infrastructure, such as rollout of high-power extreme fast charging, and potential future policy drivers such as grant funding for hydrogen stations, and/or mandated phaseout of combustion engine vehicles in the future. Potential impacts from future expansion of biofuel availability and use in LD vehicles is likewise excluded from this analysis.
With respect to inputs, ADOPT takes in technology progress assumptions and applies these to the modeled vehicles through time. The assumptions are represented by a “No Program” scenario that reflects the technology improvements assumed to occur without further contributions from
4 This report is available at no cost from the National Renewable Energy Laboratory at www.nrel.gov/publications.
VTO or HFTO, and a “Program Success” scenario under which VTO and HFTO program goals are realized. In addition to the assumed 5-year delay between the targeted achievement dates and the year that each technology level becomes available in new vehicles, the analysis assumes a 1.5 cost multiplier to convert manufacturing costs to baseline consumer price. The following subsections detail the future assumptions about fuels and vehicle component technology development used in the analysis.
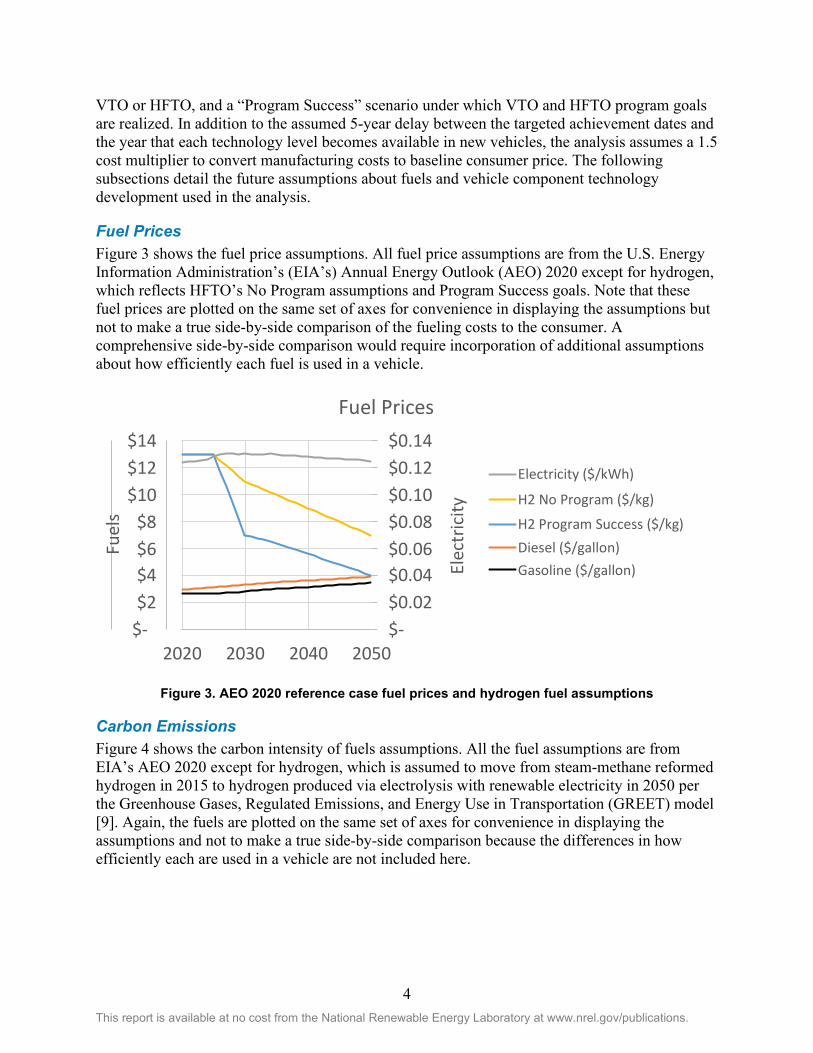
Fuel Prices Figure 3 shows the fuel price assumptions. All fuel price assumptions are from the U.S. Energy Information Administration’s (EIA’s) Annual Energy Outlook (AEO) 2020 except for hydrogen, which reflects HFTO’s No Program assumptions and Program Success goals. Note that these fuel prices are plotted on the same set of axes for convenience in displaying the assumptions but not to make a true side-by-side comparison of the fueling costs to the consumer. A comprehensive side-by-side comparison would require incorporation of additional assumptions about how efficiently each fuel is used in a vehicle.
Figure 3. AEO 2020 reference case fuel prices and hydrogen fuel assumptions
Carbon Emissions Figure 4 shows the carbon intensity of fuels assumptions. All the fuel assumptions are from EIA’s AEO 2020 except for hydrogen, which is assumed to move from steam-methane reformed hydrogen in 2015 to hydrogen produced via electrolysis with renewable electricity in 2050 per the Greenhouse Gases, Regulated Emissions, and Energy Use in Transportation (GREET) model [9]. Again, the fuels are plotted on the same set of axes for convenience in displaying the assumptions and not to make a true side-by-side comparison because the differences in how efficiently each are used in a vehicle are not included here.
$- $0.02 $0.04 $0.06 $0.08 $0.10 $0.12 $0.14
$- $2 $4 $6 $8
$10 $12 $14
2020 2030 2040 2050
Elec
tric
ity
Fuel
s
Fuel Prices
Diesel ($/gallon) Gasoline ($/gallon)
H2 No Program ($/kg)
H2 Program Success ($/kg)
Electricity ($/kWh)

5 This report is available at no cost from the National Renewable Energy Laboratory at www.nrel.gov/publications.
Figure 4. AEO 2020 reference case fuel carbon intensity and hydrogen fuel assumptions
VTO Program Goals
Batteries The Batteries program includes battery cost and mass goals, as shown in Table 1 and Table 2. These are used in ADOPT to adjust new vehicle prices, acceleration, and efficiency.
Table 1. Battery No Program Assumption by Year
No Program 2015 2020 2025 2035 2045
PHEVa energy density (Wh/kg) 62.5 95 105 110 115
PHEV battery cost ($/kWh) 500 365 210 185 160
BEV energy density (Wh/kg) 150 170 230 240 280
BEV battery cost ($/kWh) 220 180 144 140 120
a Plug-in hybrid electric vehicle
Table 2. Battery Program Success Assumptions by Year
Program Success 2015 2020 2025 2035 2045
PHEV energy density (Wh/kg) 62.5 95 125 140 170
PHEV battery cost ($/kWh) 500 365 160 130 120
BEV energy density (Wh/kg) 150 170 310 320 320
BEV battery cost ($/kWh) 220 180 125 98 80
0
0.2
0.4
0.6
0.8
1
0
5
10
15
20
25
2020 2030 2040 2050
Elec
tric
ity
Fuel
s Carbon Intensity Assumptions
Diesel (lbs CO2 per gallon)
Gasoline (lbs CO2 per gallon)
H2 No Program (lbs CO2 per kg)
H2 Program Success (lbs CO2 per kg)
Electricity (lbs CO2 per kWh)

6 This report is available at no cost from the National Renewable Energy Laboratory at www.nrel.gov/publications.
Electric Drive Technologies The EDT goals include cost reductions for electric motors and power electronics, as shown in Table 3 and Table 4. These result in price reductions for new electrified vehicles over time.
Table 3. EDT No Program Assumptions by Year
No Program 2015 2020 2025 2035 2045
Boost converter cost ($/kW) 8 5 4.8 4.7 4.5
High-voltage system cost ($/kW) 17 13 10 7.8 6.3
DC/DC buck converter cost ($/kW) 65 60 50 38 29
On-board charger cost ($) 125 100 65 45 33
Table 4. EDT Program Success Assumptions by year.
Program Success 2015 2020 2025 2035 2045
Boost converter cost ($/kW) 8 5 2.7 2.5 2
High-voltage system cost ($/kW) 17 13 6 5 4
DC/DC buck converter cost ($/kW) 65 60 30 23 18
On-board charger cost ($) 125 100 35 25 18
Combustion The Advanced Engine and Fuel Technologies program works to improve engine efficiency. The assumptions used in ADOPT to estimate their benefit are shown in Table 5 and Table 6. Engine efficiency influences new vehicle fuel cost per mile for combustion engine vehicles.
Table 5. Combustion No Program Peak Engine Efficiency Assumptions by Type and Year
No Program 2015 2020 2025 2030 2045
Conventional gasoline
36 38 40 42 44
Diesel 42 43 44 47 48
Atkinson (HEVs)a 39 40 41 41 43
a Hybrid electric vehicles
Table 6. Combustion Program Success Peak Efficiency Assumptions by Engine Type and Year
Program Success 2015 2020 2025 2030 2045
Conventional Gasoline
36 38 43 45 47
Diesel 42 43 50 51 52
Atkinson (HEVs) 39 40 46 48 50

7 This report is available at no cost from the National Renewable Energy Laboratory at www.nrel.gov/publications.
Materials The Materials program does research to improve vehicle efficiency by reducing vehicle mass. The assumptions shown in Table 7 and Table 8 are used with consumer preferences to estimate the amount of lightweighting applied to new vehicles every 5 years. Each row in the tables represents a degree of lightweighting that could be applied to the glider, or non-powertrain components of the vehicle, as indicated by the percentage ranges shown in the first column. For the specified future years, the subsequent columns provide the anticipated cost per kilogram of mass reduction that would be needed to achieve lightweighting within the respective percentage ranges (note that higher per kilogram costs are required to achieve the higher levels of lightweighting). ADOPT first uses these inputs to evaluate different amounts of lightweighting for each vehicle, then observes how this influences vehicle price, acceleration, and fuel cost per mile, and finally selects the level that achieves the greatest sales demand. Unlike other program assumptions, the Materials assumptions are shown in terms of price to the consumer rather than manufacturing cost and are thus not multiplied by the 1.5 factor to translate manufacturing cost to consumer price.
Table 7. Materials No Program Lightweighting Price ($/kg) Assumptions by Percent of Lightweighting and Year
No Program 2015 2020 2025 2035 2045
0%–10% 4 2 2 2 2
10%–20% 12 12 11 11 10
>20% 32 32 30 28 26
Table 8. Materials Program Success Lightweighting Price ($/kg) Assumptions by Percent of Lightweighting and Year
Program Success
2015 2020 2025 2035 2045
0%–10% 4 2 2 1.5 1.5
10%–20% 12 12 11 7.5 4
>20% 32 32 29 22 16
HFTO Program Goals
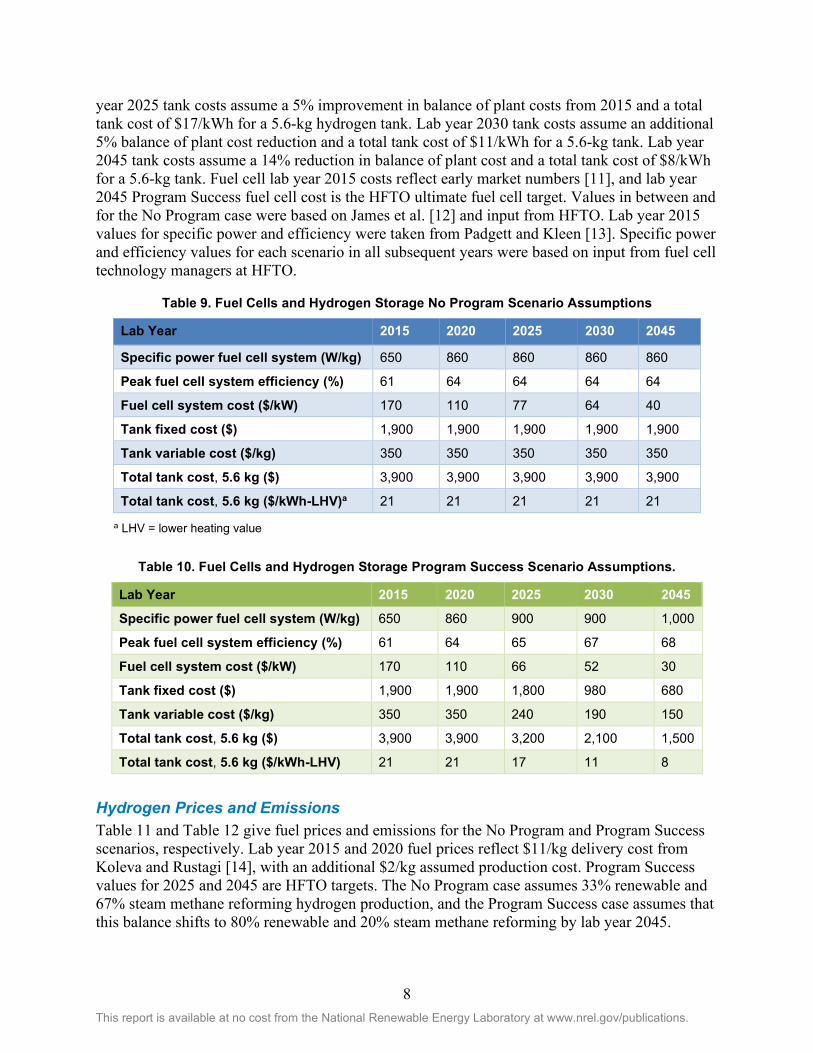
Fuel Cells and Hydrogen Storage Table 9 and Table 10 show fuel cell electric vehicle (FCEV) input assumptions for the No Program and Program Success scenarios, respectively. These values are given for lab year, which is assumed to be 5 years ahead of the year for which the technologies are commercially available in vehicles and thus implemented in ADOPT. A corporate markup is applied to all listed capital costs, which are manufacturer costs. All cost and performance assumptions were derived based on input from Technology Managers at HFTO and manufacturing cost estimates in reports published by Strategic Analysis, Incorporated. Lab year 2015 tank costs are based on data from Houchins and James [10], equating to roughly $21/kWh for a 5.6-kg hydrogen tank. The No Program case assumes no tank cost reductions from 2015. For the Program Success case, lab
8 This report is available at no cost from the National Renewable Energy Laboratory at www.nrel.gov/publications.
year 2025 tank costs assume a 5% improvement in balance of plant costs from 2015 and a total tank cost of $17/kWh for a 5.6-kg hydrogen tank. Lab year 2030 tank costs assume an additional 5% balance of plant cost reduction and a total tank cost of $11/kWh for a 5.6-kg tank. Lab year 2045 tank costs assume a 14% reduction in balance of plant cost and a total tank cost of $8/kWh for a 5.6-kg tank. Fuel cell lab year 2015 costs reflect early market numbers [11], and lab year 2045 Program Success fuel cell cost is the HFTO ultimate fuel cell target. Values in between and for the No Program case were based on James et al. [12] and input from HFTO. Lab year 2015 values for specific power and efficiency were taken from Padgett and Kleen [13]. Specific power and efficiency values for each scenario in all subsequent years were based on input from fuel cell technology managers at HFTO.
Table 9. Fuel Cells and Hydrogen Storage No Program Scenario Assumptions
Lab Year 2015 2020 2025 2030 2045
Specific power fuel cell system (W/kg) 650 860 860 860 860
Peak fuel cell system efficiency (%) 61 64 64 64 64
Fuel cell system cost ($/kW) 170 110 77 64 40
Tank fixed cost ($) 1,900 1,900 1,900 1,900 1,900
Tank variable cost ($/kg) 350 350 350 350 350
Total tank cost, 5.6 kg ($) 3,900 3,900 3,900 3,900 3,900
Total tank cost, 5.6 kg ($/kWh-LHV)a 21 21 21 21 21
a LHV = lower heating value
Table 10. Fuel Cells and Hydrogen Storage Program Success Scenario Assumptions.
Lab Year 2015 2020 2025 2030 2045
Specific power fuel cell system (W/kg) 650 860 900 900 1,000
Peak fuel cell system efficiency (%) 61 64 65 67 68
Fuel cell system cost ($/kW) 170 110 66 52 30
Tank fixed cost ($) 1,900 1,900 1,800 980 680
Tank variable cost ($/kg) 350 350 240 190 150
Total tank cost, 5.6 kg ($) 3,900 3,900 3,200 2,100 1,500
Total tank cost, 5.6 kg ($/kWh-LHV) 21 21 17 11 8
Hydrogen Prices and Emissions Table 11 and Table 12 give fuel prices and emissions for the No Program and Program Success scenarios, respectively. Lab year 2015 and 2020 fuel prices reflect $11/kg delivery cost from Koleva and Rustagi [14], with an additional $2/kg assumed production cost. Program Success values for 2025 and 2045 are HFTO targets. The No Program case assumes 33% renewable and 67% steam methane reforming hydrogen production, and the Program Success case assumes that this balance shifts to 80% renewable and 20% steam methane reforming by lab year 2045.

9 This report is available at no cost from the National Renewable Energy Laboratory at www.nrel.gov/publications.
Emissions for renewable and steam methane reforming-based hydrogen are estimated at 4.44 and 24.6 lb CO2 per gasoline gallon equivalent, respectively, according to the GREET model [9].
Table 11. Hydrogen No Program Fuel Prices and Emissions
Lab Year 2015 2020 2025 2030 2045
Fuel price ($/kg) 13 13 11 10 7
Emissions (lb CO2/kg H2) 18 18 18 18 18
Emissions (% renewable) 33% 33% 33% 33% 33%
Table 12. Hydrogen Program Success Fuel prices and emissions.
Lab Year 2015 2020 2025 2030 2045
Fuel price ($/kg) 13 13 7 6 4
Emissions (lb CO2/kg H2) 18 18 16 14 9
Emissions (% renewable) 33% 33% 42% 52% 80%
Results
No Program The benefits are calculated by comparing the estimated national-level energy and emissions resulting from the Program Success relative to the No Program scenario. For both scenarios, the ADOPT simulation starts in 2015, and the model’s sales estimates are consistent with historical sales trends through 2020, as shown in Figure 5. This provides further confidence in the validity of future year sales estimates. ADOPT accurately captures how sales during this time remained primarily conventional gasoline vehicles, with some HEVs and small numbers of BEVs and PHEVs.

10 This report is available at no cost from the National Renewable Energy Laboratory at www.nrel.gov/publications.
Figure 5. ADOPT’s estimated sales by powertrain compared to historical data [15]
Despite plug-in electric vehicles (PEVs) being a small portion of the market relative to both conventional vehicles and HEVs, ADOPT also matches several subtleties with PEV sales trends since 2015. This includes overall PEV growth from roughly 0.5% of new vehicle sales in 2015 to just over 2% of new sales in 2020, as shown in Figure 6. This figure further shows ADOPT’s estimates for the relative sales shares of BEVs and PHEVs closely agreeing with historic data through the first several years of this time frame, though whereas the model estimated continued growth in both BEV and PHEV sales in 2019 and 2020, the data in those years show a slight drop in PHEV sales coinciding with one of the top-selling PHEVs (the Chevy Volt) being discontinued. While it remains to be seen how year-to-year sales fluctuations will average out over time, another dimension to examine is how well ADOPT estimates which consumers are driving current PEV sales. As shown in Figure 7, both ADOPT and historical trends show PEVs selling primarily to high-income households. ADOPT’s ability to accurately estimate the income distributions of current PEV purchasers lends further confidence that the model is accurately representing consumer preferences.

11 This report is available at no cost from the National Renewable Energy Laboratory at www.nrel.gov/publications.
Figure 6. ADOPT estimates compared to historical BEV and PHEV sales [15]
Figure 7. Comparing ADOPT estimates to historical data on the income distribution of electric vehicle owners [16]
Capturing such nuances of sales by income and vehicle price is important for accurately representing PEV market potential both before and after realization of future anticipated battery cost reductions and other technology improvements. As shown in Figure 8, most vehicles sell for less than $40,000, and most cars sell for less than $30,000. Current PEV sales are predominantly cars, with the bestselling BEV starting around $40,000 and selling relatively well in the high-price vehicle segment. The bestselling PHEV starts around $28,000, capturing a smaller percentage of a larger vehicle segment.
0.0%
0.5%
1.0%
1.5%
2.0%
2010 2012 2014 2016 2018 2020
BEV and PHEV Sales Share by Year
BEV Historical
BEV ADOPT
PHEV Historical
PHEV ADOPT

12 This report is available at no cost from the National Renewable Energy Laboratory at www.nrel.gov/publications.
Figure 8. Sales by vehicle price in 2016 [17].
Figure 9 shows ADOPT’s sales estimates into the future under the No Program technology progress assumptions. Initial sales estimates past 2020 continue with historical trends of primarily conventional vehicle sales with some HEV sales and a small percentage of PEV sales, still limited primarily to high-income households. The sales trends change as anticipated technology improvements enter the market, beginning with a noticeable expansion of HEV sales from just before 2025 through 2030.
Figure 9. No Program sales by powertrain
0
5
10
15
20
2000 2010 2020 2030 2040 2050
Sale
s (M
illion
s)
Sales: No Program
FCV
BEV
PHEV
HEV
CNG
Diesel
Conv.Historic Data Simula�on
13 This report is available at no cost from the National Renewable Energy Laboratory at www.nrel.gov/publications.
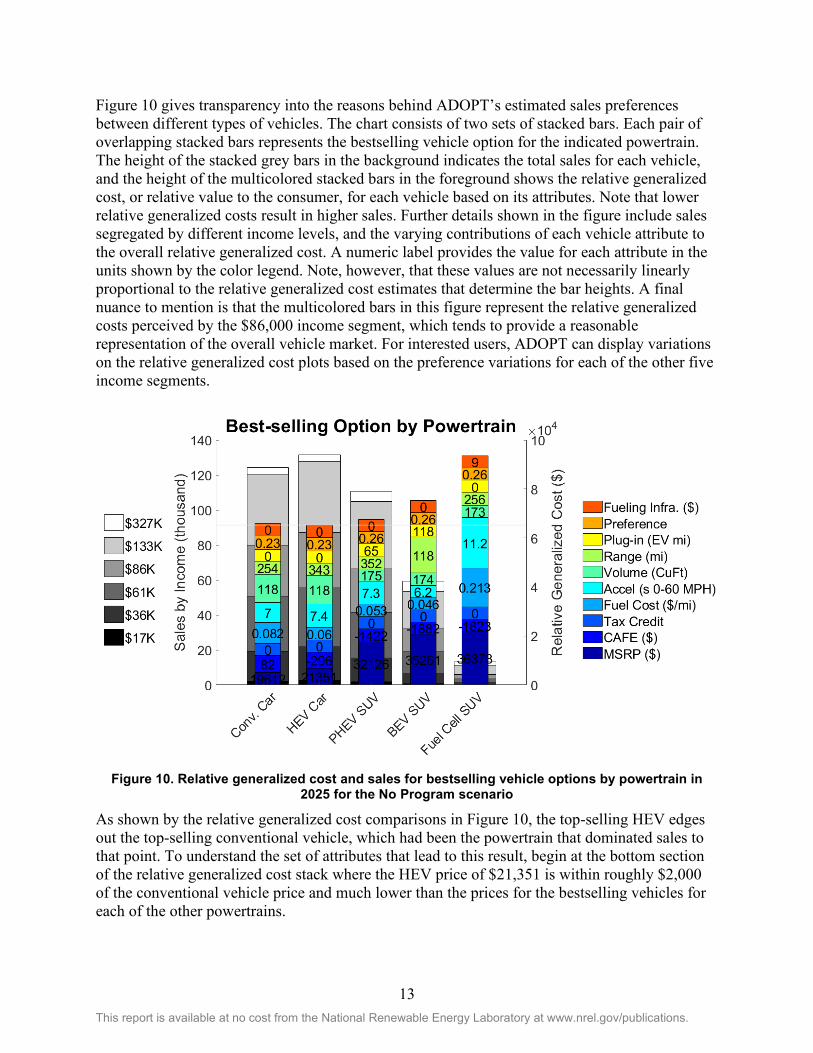
Figure 10 gives transparency into the reasons behind ADOPT’s estimated sales preferences between different types of vehicles. The chart consists of two sets of stacked bars. Each pair of overlapping stacked bars represents the bestselling vehicle option for the indicated powertrain. The height of the stacked grey bars in the background indicates the total sales for each vehicle, and the height of the multicolored stacked bars in the foreground shows the relative generalized cost, or relative value to the consumer, for each vehicle based on its attributes. Note that lower relative generalized costs result in higher sales. Further details shown in the figure include sales segregated by different income levels, and the varying contributions of each vehicle attribute to the overall relative generalized cost. A numeric label provides the value for each attribute in the units shown by the color legend. Note, however, that these values are not necessarily linearly proportional to the relative generalized cost estimates that determine the bar heights. A final nuance to mention is that the multicolored bars in this figure represent the relative generalized costs perceived by the $86,000 income segment, which tends to provide a reasonable representation of the overall vehicle market. For interested users, ADOPT can display variations on the relative generalized cost plots based on the preference variations for each of the other five income segments.
Figure 10. Relative generalized cost and sales for bestselling vehicle options by powertrain in 2025 for the No Program scenario
As shown by the relative generalized cost comparisons in Figure 10, the top-selling HEV edges out the top-selling conventional vehicle, which had been the powertrain that dominated sales to that point. To understand the set of attributes that lead to this result, begin at the bottom section of the relative generalized cost stack where the HEV price of $21,351 is within roughly $2,000 of the conventional vehicle price and much lower than the prices for the bestselling vehicles for each of the other powertrains.

14 This report is available at no cost from the National Renewable Energy Laboratory at www.nrel.gov/publications.
The next stack section shows the modeled penalty applied to each vehicle to shift sales toward meeting the Corporate Average Fuel Economy and greenhouse gas emission standards. A “penalty” is applied to the purchase price of each less efficient vehicle, proportional to the amount it falls short of the regulation. Likewise, an “incentive” is applied to the purchase price of each more efficient vehicle, proportional to the amount it exceeds the regulations. The rate of penalty or incentive is solved for each year such that the total penalties for vehicles that fall short of meeting the regulations cover the total incentives applied to vehicles that exceed the regulations. For the best-selling vehicles indicated in Figure 10, the hybrid gets a $296 price reduction for exceeding the regulations, compared to the $82 penalty for the conventional vehicle, which fell short of the fuel economy regulation level.
The next stack section represents the federal tax credit. Based on the existing law, all credits have phased out by 2025 under the modeled scenario. The subsequent stack section captures the perceived value of fuel cost per mile, and here the HEV again edges out the conventional vehicle. The fuel cost and estimated manufacturer incentive to meet regulations more than offset the additional price of the HEV compared to the conventional vehicle. Because the consumer perception of all the other attributes between these two vehicles are similar, the HEV becomes the bestselling overall.
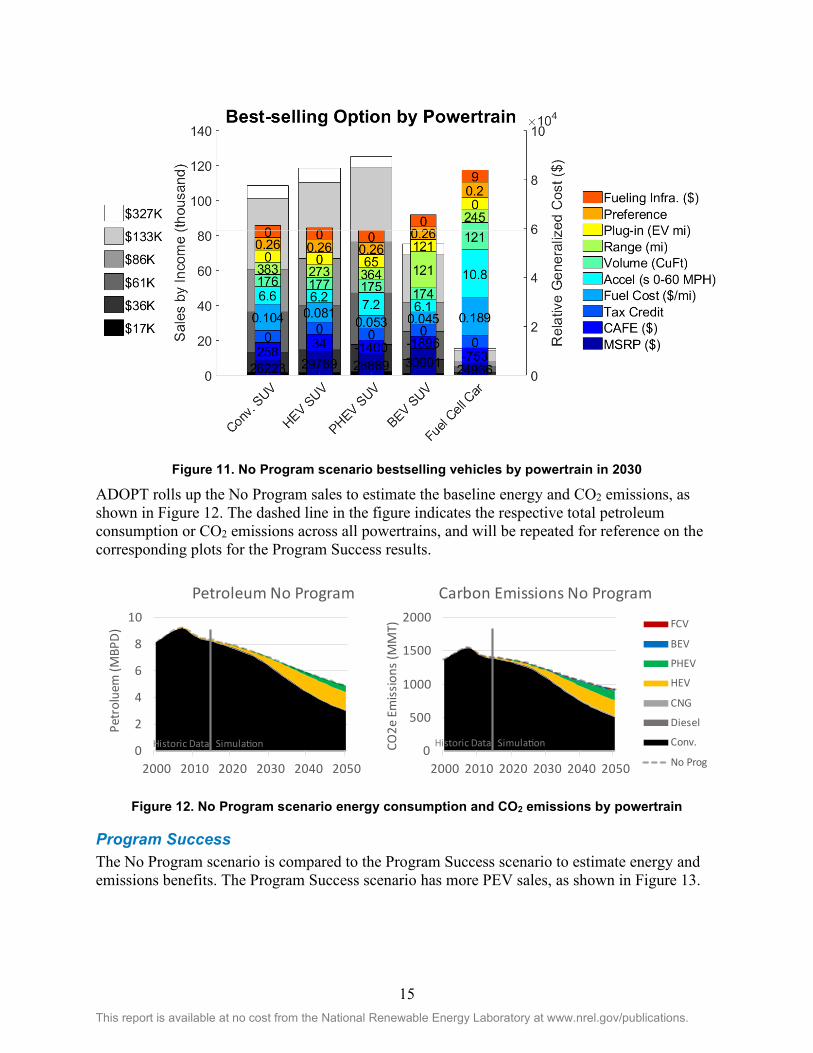
Shortly after HEV shares begin to expand, market share expansion shifts to PHEVs. Consistent with the description provided for Figure 10, Figure 11 shows in 2030 that the PHEV sells best because of its low price, reasonable acceleration, favorable regulation incentive, and low fuel cost for operating primarily on efficient, low-cost electricity. It has a higher price relative to the bestselling conventional vehicle, but primarily makes up for it with lower fuel cost. Likewise, whereas the bestselling HEV shows superior acceleration performance, the bestselling PHEV’s design for low vehicle price and fuel cost gives it the overall edge. The bestselling BEV has become more competitive than in the 2025 scenario, but the PHEV still sells better with its lower price and better range. Finally, the bestselling FCEV has substantially higher fuel cost and slower acceleration than the other powertrain bestsellers in this 2030 No Program scenario.
15 This report is available at no cost from the National Renewable Energy Laboratory at www.nrel.gov/publications.
Figure 11. No Program scenario bestselling vehicles by powertrain in 2030
ADOPT rolls up the No Program sales to estimate the baseline energy and CO2 emissions, as shown in Figure 12. The dashed line in the figure indicates the respective total petroleum consumption or CO2 emissions across all powertrains, and will be repeated for reference on the corresponding plots for the Program Success results.
Figure 12. No Program scenario energy consumption and CO2 emissions by powertrain
Program Success The No Program scenario is compared to the Program Success scenario to estimate energy and emissions benefits. The Program Success scenario has more PEV sales, as shown in Figure 13.
0
2
4
6
8
10
2000 2010 2020 2030 2040 2050
Petr
olue
m (M
BPD)
Petroleum No Program
FCV
BEV
PHEV
HEV
CNG
Diesel
Conv.
No Prog
Historic Data Simula�on 0
500
1000
1500
2000
2000 2010 2020 2030 2040 2050
CO2e
Em
issio
ns (M
MT)
Carbon Emissions No Program
FCV
BEV
PHEV
HEV
CNG
Diesel
Conv.
No Prog
Historic Data Simula�on
16 This report is available at no cost from the National Renewable Energy Laboratory at www.nrel.gov/publications.
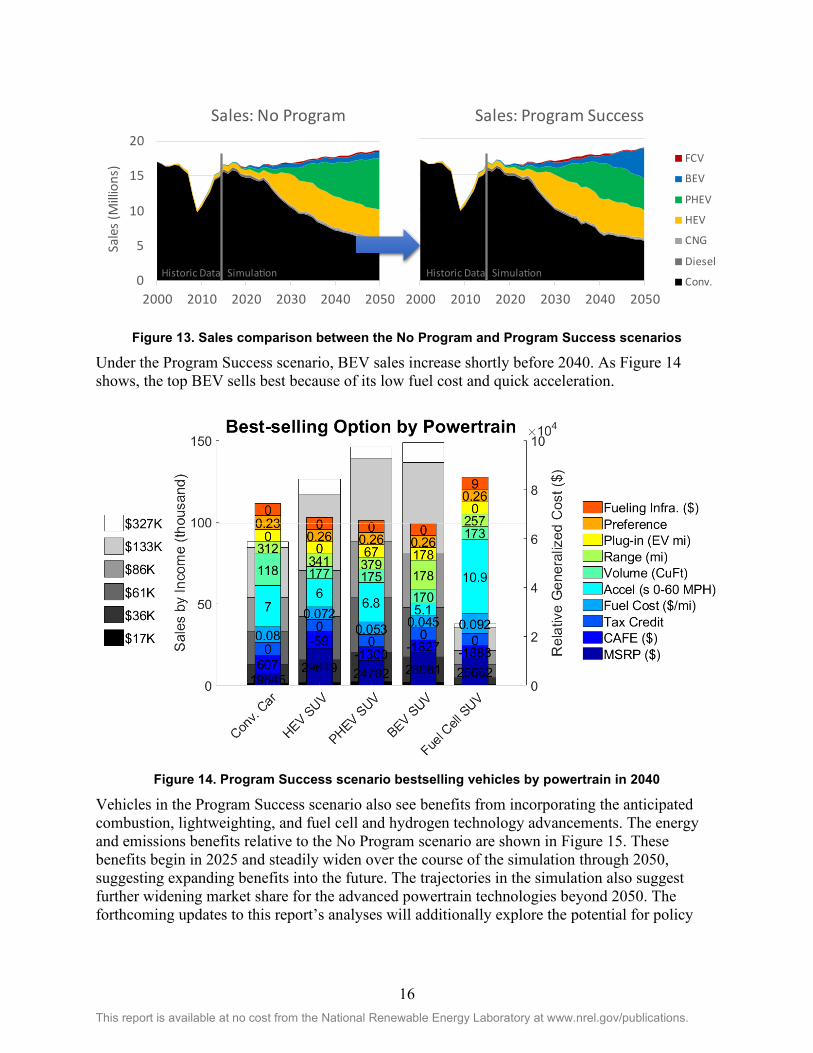
Figure 13. Sales comparison between the No Program and Program Success scenarios
Under the Program Success scenario, BEV sales increase shortly before 2040. As Figure 14 shows, the top BEV sells best because of its low fuel cost and quick acceleration.
Figure 14. Program Success scenario bestselling vehicles by powertrain in 2040
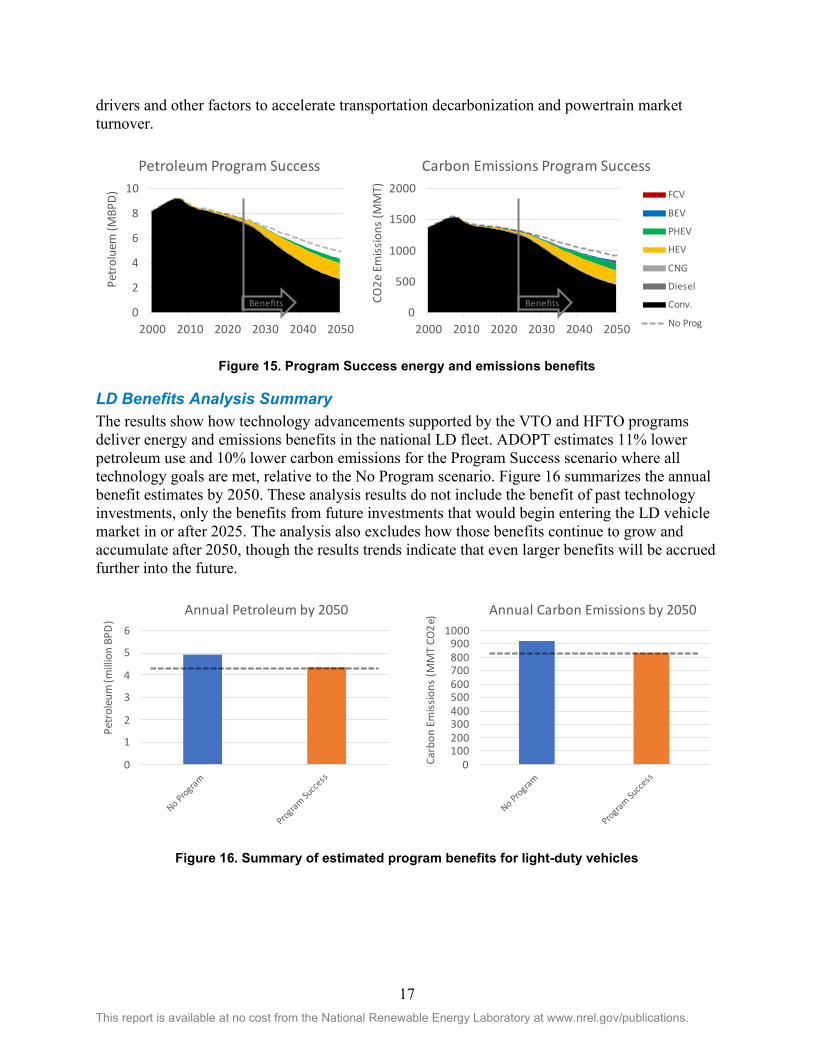
Vehicles in the Program Success scenario also see benefits from incorporating the anticipated combustion, lightweighting, and fuel cell and hydrogen technology advancements. The energy and emissions benefits relative to the No Program scenario are shown in Figure 15. These benefits begin in 2025 and steadily widen over the course of the simulation through 2050, suggesting expanding benefits into the future. The trajectories in the simulation also suggest further widening market share for the advanced powertrain technologies beyond 2050. The forthcoming updates to this report’s analyses will additionally explore the potential for policy
0
5
10
15
20
2000 2010 2020 2030 2040 2050
Sale
s (M
illion
s)Sales: No Program
FCV
BEV
PHEV
HEV
CNG
Diesel
Conv.Historic Data Simula�on
2000 2010 2020 2030 2040 2050
Sales: Program Success
FCV
BEV
PHEV
HEV
CNG
Diesel
Conv.Historic Data Simula�on
17 This report is available at no cost from the National Renewable Energy Laboratory at www.nrel.gov/publications.
drivers and other factors to accelerate transportation decarbonization and powertrain market turnover.
Figure 15. Program Success energy and emissions benefits
LD Benefits Analysis Summary The results show how technology advancements supported by the VTO and HFTO programs deliver energy and emissions benefits in the national LD fleet. ADOPT estimates 11% lower petroleum use and 10% lower carbon emissions for the Program Success scenario where all technology goals are met, relative to the No Program scenario. Figure 16 summarizes the annual benefit estimates by 2050. These analysis results do not include the benefit of past technology investments, only the benefits from future investments that would begin entering the LD vehicle market in or after 2025. The analysis also excludes how those benefits continue to grow and accumulate after 2050, though the results trends indicate that even larger benefits will be accrued further into the future.
Figure 16. Summary of estimated program benefits for light-duty vehicles
0
2
4
6
8
10
2000 2010 2020 2030 2040 2050
Petr
olue
m (M
BPD)
Petroleum Program Success
Benefits0
500
1000
1500
2000
2000 2010 2020 2030 2040 2050
CO2e
Em
issio
ns (M
MT)
Carbon Emissions Program Success
FCV
BEV
PHEV
HEV
CNG
Diesel
Conv.
No Prog
Benefits
0
1
2
3
4
5
6
Petr
oleu
m (m
illion
BPD
)
Annual Petroleum by 2050
0100200300400500600700800900
1000
Carb
on E
miss
ions
(MM
T CO
2e) Annual Carbon Emissions by 2050
18 This report is available at no cost from the National Renewable Energy Laboratory at www.nrel.gov/publications.
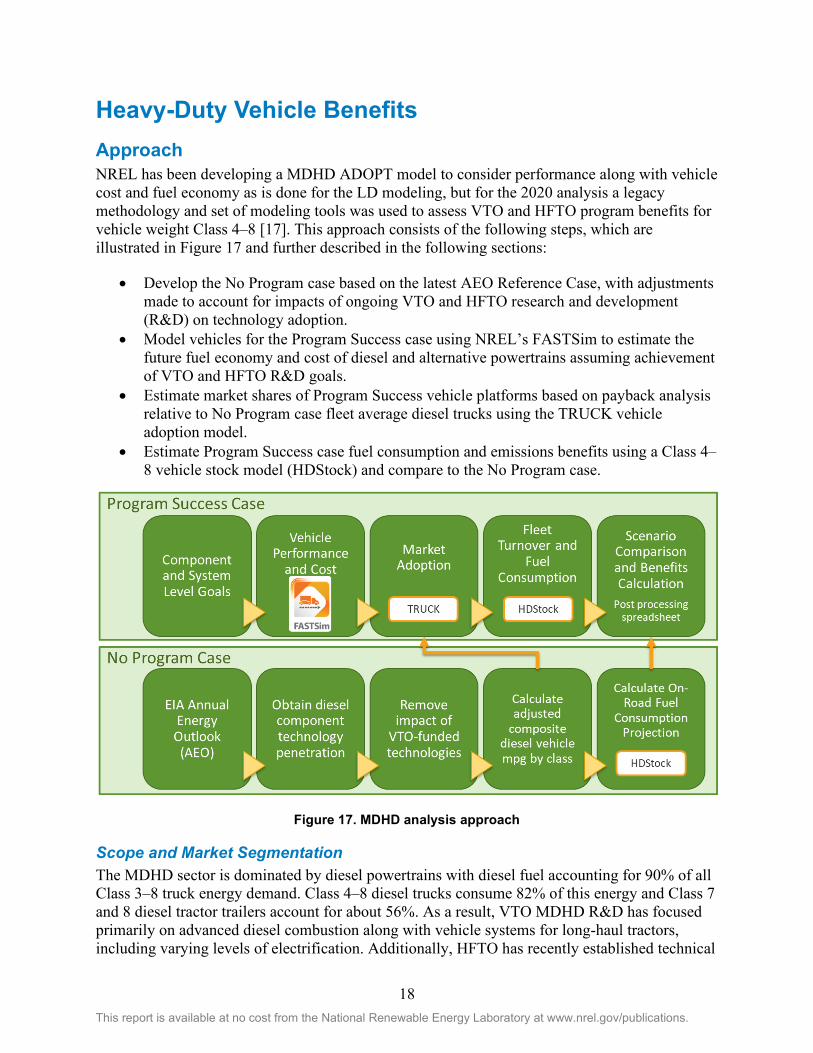
Heavy-Duty Vehicle Benefits Approach NREL has been developing a MDHD ADOPT model to consider performance along with vehicle cost and fuel economy as is done for the LD modeling, but for the 2020 analysis a legacy methodology and set of modeling tools was used to assess VTO and HFTO program benefits for vehicle weight Class 4–8 [17]. This approach consists of the following steps, which are illustrated in Figure 17 and further described in the following sections:
• Develop the No Program case based on the latest AEO Reference Case, with adjustments made to account for impacts of ongoing VTO and HFTO research and development (R&D) on technology adoption.
• Model vehicles for the Program Success case using NREL’s FASTSim to estimate the future fuel economy and cost of diesel and alternative powertrains assuming achievement of VTO and HFTO R&D goals.
• Estimate market shares of Program Success vehicle platforms based on payback analysis relative to No Program case fleet average diesel trucks using the TRUCK vehicle adoption model.
• Estimate Program Success case fuel consumption and emissions benefits using a Class 4–8 vehicle stock model (HDStock) and compare to the No Program case.
Figure 17. MDHD analysis approach
Scope and Market Segmentation The MDHD sector is dominated by diesel powertrains with diesel fuel accounting for 90% of all Class 3–8 truck energy demand. Class 4–8 diesel trucks consume 82% of this energy and Class 7 and 8 diesel tractor trailers account for about 56%. As a result, VTO MDHD R&D has focused primarily on advanced diesel combustion along with vehicle systems for long-haul tractors, including varying levels of electrification. Additionally, HFTO has recently established technical

19 This report is available at no cost from the National Renewable Energy Laboratory at www.nrel.gov/publications.
targets for hydrogen and fuel cells in Class 8 long-haul tractors. The benefits analysis for MDHD vehicles thus covers trucks in weight Class 4–8, or with gross vehicle weight rating (GVWR) over 14,000 lbs. In addition, this analysis considers only technologies developed for or that are expected to become competitive with diesel trucks.
The No Program and Program Success cases assume no change in the sales and fuel economy of gasoline, flex fuel, propane, or natural gas trucks. Similarly, no change is assumed for Class 3 vehicle sales mix or performance. While DOE-funded research for both light- and heavy-duty vehicles is likely to have spillovers that improve the fuel economy of the omitted vehicles, this impact is estimated to be relatively small compared to the fuel savings for Class 4–8 diesel trucks given that the vehicles included in the analysis account for the vast majority of MDHD fuel consumption. In addition, gasoline trucks are driven fewer miles annually and fuel cost savings accrue more slowly than for diesel trucks. This extends the payback period for investment in advanced technologies and results in lower market adoption rates and lower fleet fuel savings.
The analysis uses a market segmentation consistent with the National Energy Modeling System (NEMS) used by EIA for the AEO and with the following MDHD fuel consumption regulations:
• Class 7 and 8 sleeper cab tractors • Class 7 and 8 day cab tractors • Class 7 and 8 vocational trucks • Class 4–6 vocational trucks.
The term “vocational” was adopted from the MDHD fuel consumption regulations and refers to all trucks that are not tractors, conventional vans, or pickups. These include van- or box-type delivery trucks as well as service vehicles such as cement mixers, refuse haulers, dump trucks, and utility vehicles, which are more commonly referred to as vocational trucks.
No Program Case The No Program case was developed from the AEO 2020 Reference Case, with adjustments made to reflect the degree of technology progress that would be expected without any additional investments from VTO or HFTO. This is generally accomplished by re-estimating the sales fleet average fuel economy for diesel vehicles after removing the market penetration of component technologies supported by DOE R&D. Note that these potential adjustments include hybrid powertrains since the AEO includes mild and strong hybridization without plug-in capability as a diesel component technology rather than tracking their adoption and stock as separate powertrains.
The Reference Case projects no market penetration of strong hybrids by 2050 and projects very small penetration of alternative powertrains, including PHEVs, BEVs, and FCEVs. The projections for each powertrain are below 0.6% of sales within each vehicle class and below 0.3% overall, and combined account for less than 1.7% of sales within any vehicle class and less than 1% overall. Therefore, the shares and performance of alternative powertrains in the No Program case is assumed to be the same as the AEO Reference Case. Similarly, the No Program case retains the Reference Case sales shares and performance of gasoline, flex fuel, natural gas, and propane vehicles, which are excluded from the analysis scope as described previously. The
20 This report is available at no cost from the National Renewable Energy Laboratory at www.nrel.gov/publications.
adjusted diesel sales fleet fuel economy is applied to the HDStock model to project fuel consumption and emissions for the No Program case.
Vehicle Modeling VTO and HFTO component technology targets and cost projections were implemented into FASTSim to estimate the future performance and cost of future vehicles assuming achievement of R&D goals. FASTSim is an open-source, publicly available vehicle powertrain modeling tool developed by NREL [3, 4]. It is designed to provide a good balance between predictive accuracy and model complexity and is well suited for powertrain efficiency trade-off studies. Simulation models were completed for five powertrains: conventional, diesel hybrid, diesel PHEV, BEV, and FCEV. Component sizing (e.g., battery capacity and motor power) is generally determined through constrained optimization considering cost and performance.
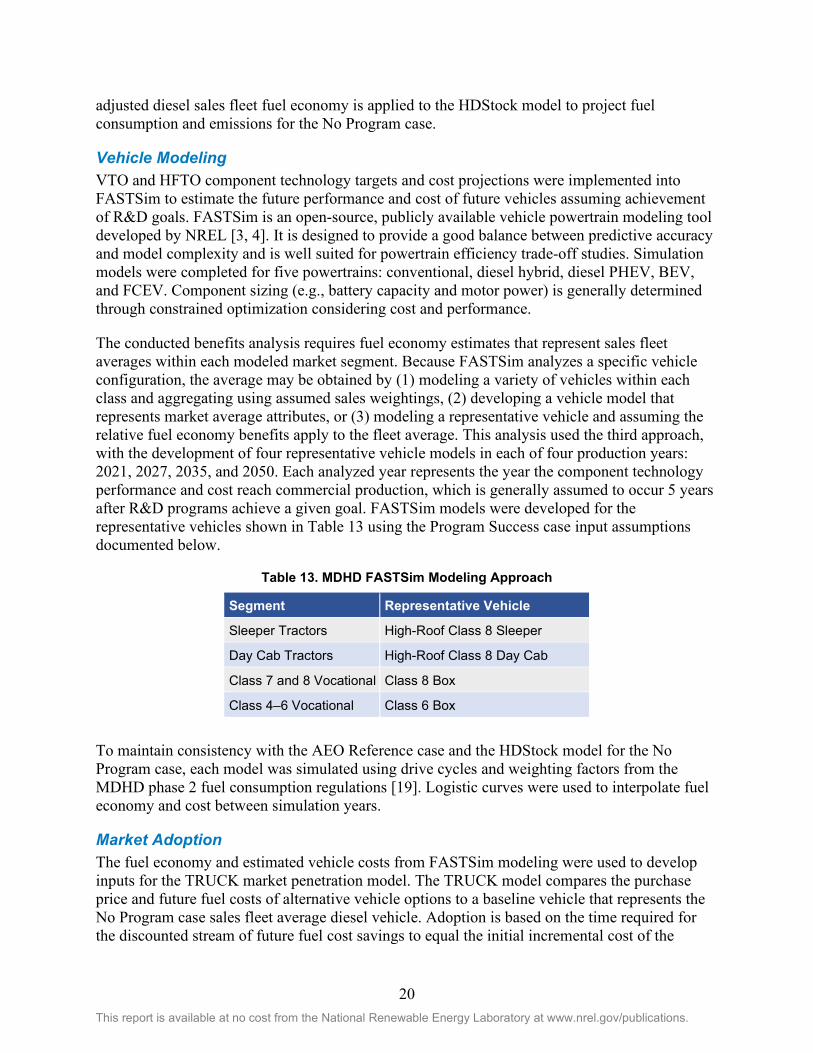
The conducted benefits analysis requires fuel economy estimates that represent sales fleet averages within each modeled market segment. Because FASTSim analyzes a specific vehicle configuration, the average may be obtained by (1) modeling a variety of vehicles within each class and aggregating using assumed sales weightings, (2) developing a vehicle model that represents market average attributes, or (3) modeling a representative vehicle and assuming the relative fuel economy benefits apply to the fleet average. This analysis used the third approach, with the development of four representative vehicle models in each of four production years: 2021, 2027, 2035, and 2050. Each analyzed year represents the year the component technology performance and cost reach commercial production, which is generally assumed to occur 5 years after R&D programs achieve a given goal. FASTSim models were developed for the representative vehicles shown in Table 13 using the Program Success case input assumptions documented below.
Table 13. MDHD FASTSim Modeling Approach
Segment Representative Vehicle
Sleeper Tractors High-Roof Class 8 Sleeper
Day Cab Tractors High-Roof Class 8 Day Cab
Class 7 and 8 Vocational Class 8 Box
Class 4–6 Vocational Class 6 Box
To maintain consistency with the AEO Reference case and the HDStock model for the No Program case, each model was simulated using drive cycles and weighting factors from the MDHD phase 2 fuel consumption regulations [19]. Logistic curves were used to interpolate fuel economy and cost between simulation years.
Market Adoption The fuel economy and estimated vehicle costs from FASTSim modeling were used to develop inputs for the TRUCK market penetration model. The TRUCK model compares the purchase price and future fuel costs of alternative vehicle options to a baseline vehicle that represents the No Program case sales fleet average diesel vehicle. Adoption is based on the time required for the discounted stream of future fuel cost savings to equal the initial incremental cost of the
21 This report is available at no cost from the National Renewable Energy Laboratory at www.nrel.gov/publications.
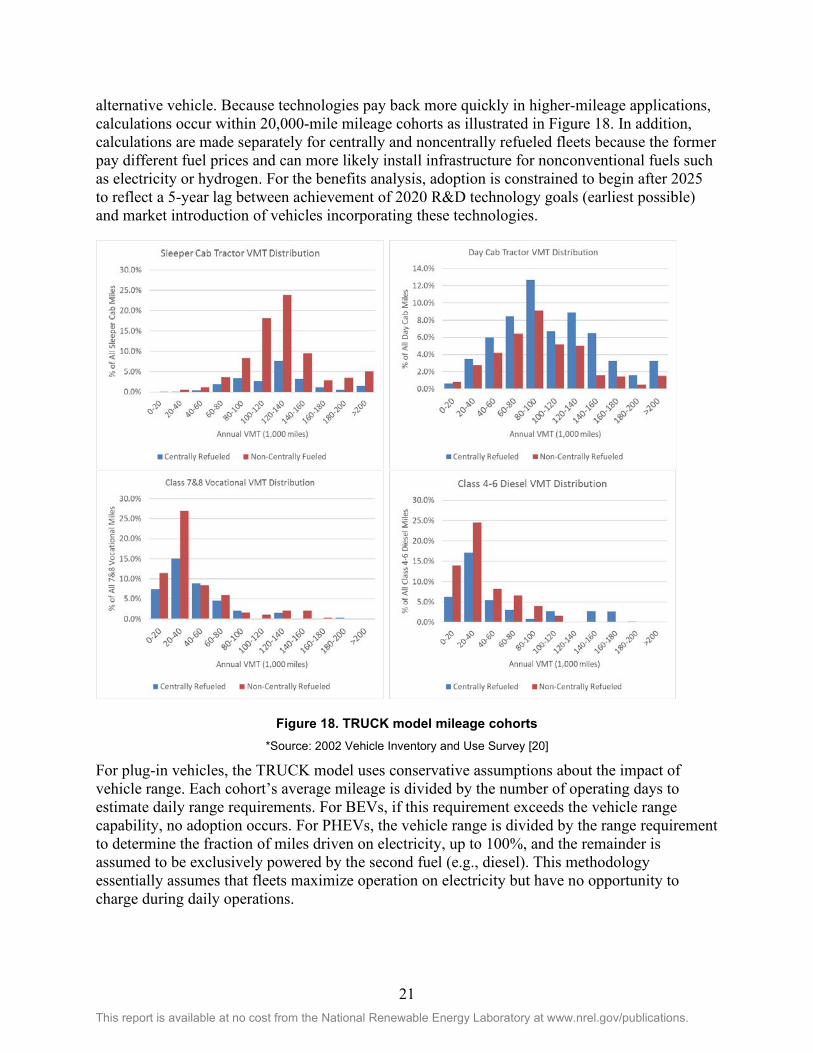
alternative vehicle. Because technologies pay back more quickly in higher-mileage applications, calculations occur within 20,000-mile mileage cohorts as illustrated in Figure 18. In addition, calculations are made separately for centrally and noncentrally refueled fleets because the former pay different fuel prices and can more likely install infrastructure for nonconventional fuels such as electricity or hydrogen. For the benefits analysis, adoption is constrained to begin after 2025 to reflect a 5-year lag between achievement of 2020 R&D technology goals (earliest possible) and market introduction of vehicles incorporating these technologies.
Figure 18. TRUCK model mileage cohorts *Source: 2002 Vehicle Inventory and Use Survey [20]
For plug-in vehicles, the TRUCK model uses conservative assumptions about the impact of vehicle range. Each cohort’s average mileage is divided by the number of operating days to estimate daily range requirements. For BEVs, if this requirement exceeds the vehicle range capability, no adoption occurs. For PHEVs, the vehicle range is divided by the range requirement to determine the fraction of miles driven on electricity, up to 100%, and the remainder is assumed to be exclusively powered by the second fuel (e.g., diesel). This methodology essentially assumes that fleets maximize operation on electricity but have no opportunity to charge during daily operations.

22 This report is available at no cost from the National Renewable Energy Laboratory at www.nrel.gov/publications.
TRUCK also has the capability to curtail adoption based on fuel availability relative to baseline fuel (gasoline or diesel). These adjustments are only made to noncentrally refueled vehicles because centrally refueled fleets are assumed to have the ability to install private fueling infrastructure if desired.
The TRUCK model reports technology market shares as a fraction of new vehicles and new vehicle annual miles. The latter is used as input to the HDStock model because all vehicles of a given vintage in the stock model travel the same (average) miles annually. Therefore, the market share as a fraction of miles provides a more accurate representation of the fleet average fuel consumption. TRUCK also reports fraction of miles by centrally refueled fleets and by fuel share for multifuel vehicles such as PHEVs. This allows HDStock to estimate consumption by fuel and fuel expenditures.
Benefits Estimation Fuel economy, vehicle price, and market shares from the FASTSim and TRUCK models, and fuel price assumptions are used as inputs to the HDStock model, which accounts for vehicle turnover and estimates future vehicle population, mileage, energy demand, fuel consumption, expenditures, and emissions. HDStock uses segmentation, vehicle scrappage rates, and vintaged mileage schedules consistent with the National Energy Modeling System model and is calibrated to AEO 2020 [6]. AEO Reference Case inputs are replaced with No Program and Program Success case inputs and the results of the two cases are compared to calculate program benefits through 2050.
Assumptions
Fuel Prices Fuel prices determine the value of future fuel savings and therefore the adoption of alternative powertrains. Projected prices are intended to reflect the price paid at the pump or meter, including production, distribution, dispensing, fees, and taxes. Fuel price projections for noncentrally refueled fleets were taken from the AEO 2020 Reference Case, with two exceptions: hydrogen and electricity. The AEO does not report hydrogen price to transportation and the HFTO research program includes technologies for hydrogen production and dispensing. Therefore, hydrogen prices for the Program Success case were provided by HFTO and represent the price of hydrogen for refueling fuel cell electric buses in 2020 [21], along with DOE HFTO ultimate cost targets of $4/kg for dispensed hydrogen. The AEO electricity price to transportation, which averages around $0.12/kWh in the Reference Case, largely reflects the cost for LD charging because there is no public and very little private charging infrastructure for larger, commercial vehicles. Borlaug et al. [22] report variation of $0.08/kWh to $0.27/kWh in the cost to charge LD BEVs. Recovery of the cost to install higher-power charging at the scale necessary to support the truck fleet could result in substantially higher electricity price, especially if demand charges are incurred. In the absence of an MDHD cost assessment, this analysis assumed an electricity price double the AEO Reference Case through 2035 and declining to the AEO price by 2050. This results in a maximum price of $0.25/kWh, which is within the bounds of the Borlaug et al. study [22].
Diesel price for centrally refueled fleets was assumed to be about 5% lower than noncentrally refueled fleets, based on the April 2018 Clean Cities Alternative Fuel Price Report [23].
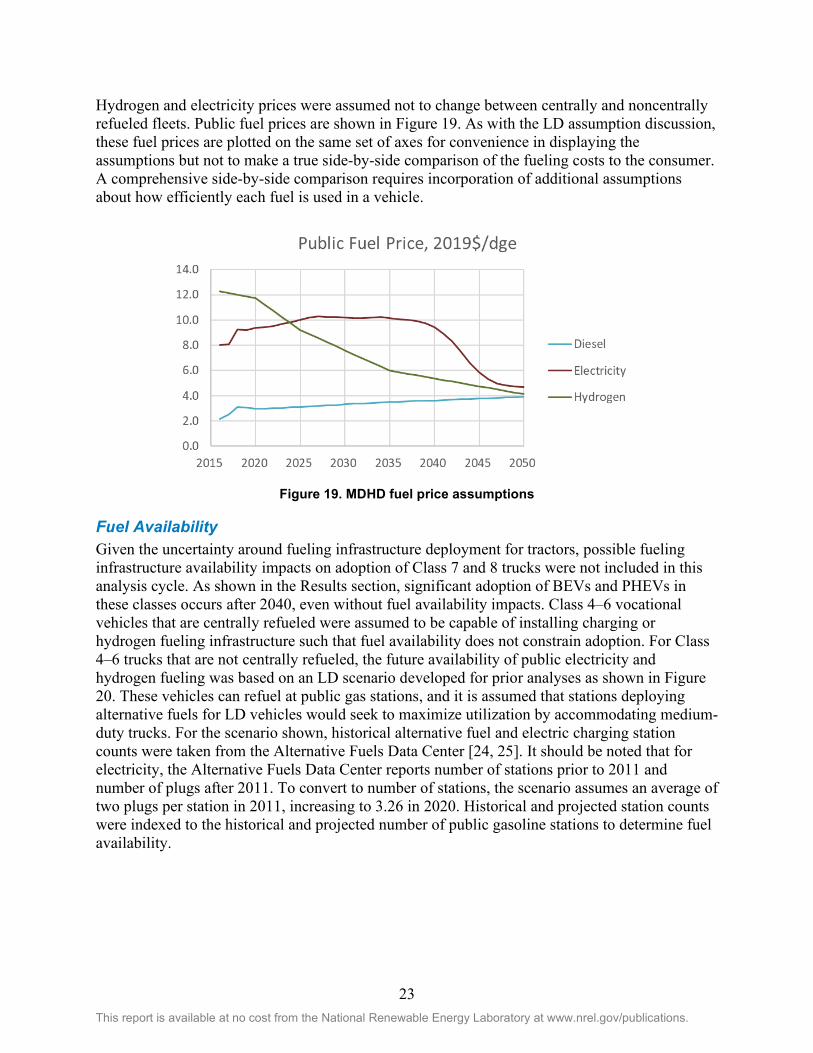
23 This report is available at no cost from the National Renewable Energy Laboratory at www.nrel.gov/publications.
Hydrogen and electricity prices were assumed not to change between centrally and noncentrally refueled fleets. Public fuel prices are shown in Figure 19. As with the LD assumption discussion, these fuel prices are plotted on the same set of axes for convenience in displaying the assumptions but not to make a true side-by-side comparison of the fueling costs to the consumer. A comprehensive side-by-side comparison requires incorporation of additional assumptions about how efficiently each fuel is used in a vehicle.
Figure 19. MDHD fuel price assumptions
Fuel Availability Given the uncertainty around fueling infrastructure deployment for tractors, possible fueling infrastructure availability impacts on adoption of Class 7 and 8 trucks were not included in this analysis cycle. As shown in the Results section, significant adoption of BEVs and PHEVs in these classes occurs after 2040, even without fuel availability impacts. Class 4–6 vocational vehicles that are centrally refueled were assumed to be capable of installing charging or hydrogen fueling infrastructure such that fuel availability does not constrain adoption. For Class 4–6 trucks that are not centrally refueled, the future availability of public electricity and hydrogen fueling was based on an LD scenario developed for prior analyses as shown in Figure 20. These vehicles can refuel at public gas stations, and it is assumed that stations deploying alternative fuels for LD vehicles would seek to maximize utilization by accommodating medium-duty trucks. For the scenario shown, historical alternative fuel and electric charging station counts were taken from the Alternative Fuels Data Center [24, 25]. It should be noted that for electricity, the Alternative Fuels Data Center reports number of stations prior to 2011 and number of plugs after 2011. To convert to number of stations, the scenario assumes an average of two plugs per station in 2011, increasing to 3.26 in 2020. Historical and projected station counts were indexed to the historical and projected number of public gasoline stations to determine fuel availability.

24 This report is available at no cost from the National Renewable Energy Laboratory at www.nrel.gov/publications.
Figure 20. Fuel availability assumptions for Class 4–6 vocational trucks *Source: historical data, Alternative Fuels Data Center [24, 25]
Emissions HDStock projects well-to-wheels (WTW) CO2 emissions based on rates from Argonne National Laboratory’s VISION model which uses GREET model results [26, 9]. Emissions rates for electricity assume the AEO Reference Case national utility mix. Emission rates for hydrogen are the same as the LD scenario described in the Light-Duty Vehicle Benefits Carbon Emissions Assumptions section. Emissions rates per quad of energy consumed (vehicle level) are shown in Figure 21.
Figure 21. MDHD well-to-wheels emissions factors
25 This report is available at no cost from the National Renewable Energy Laboratory at www.nrel.gov/publications.
VTO Program Goals SuperTruck represents VTO’s major ongoing initiative to improve the energy efficiency of commercial vehicles. Building on successes achieved in 2010–2015, SuperTruck II seeks to further increase the efficiency of diesel engines and long-haul tractors by 2021. In addition, VTO supports the 21st Century Truck Partnership (21CTP), a government/industry research collaboration with partners across the commercial truck value chain and federal agencies with both civilian and military missions. 21CTP has established high-level goals for heavy vehicles and engines and is in the process of developing targets for electrification technologies for commercial vehicles across the MDHD spectrum.
VTO has established goals for LD vehicle electrification, including energy storage and electric drive technology, and is currently contemplating analogous goals for MDHD that consider the specific performance and cost-effectiveness requirements of these vehicles. Rather than apply VTO’s LD targets, this analysis adopted goals resulting from a 2019 effort funded by VTO under the LabTRUCK Consortium. The 2019 analysis assessed the current state of electrification technologies for commercial vehicles and the historical rate of improvement, then accelerated that improvement to achieve earlier price parity for several vehicle applications. This study used the most aggressive acceleration scenario for long-haul trucks, because their performance requirements (power and range) are the most challenging for electrification.
Batteries Table 14 and Figure 22 present the battery goals for state-of-charge window, energy density, and usable pack cost.
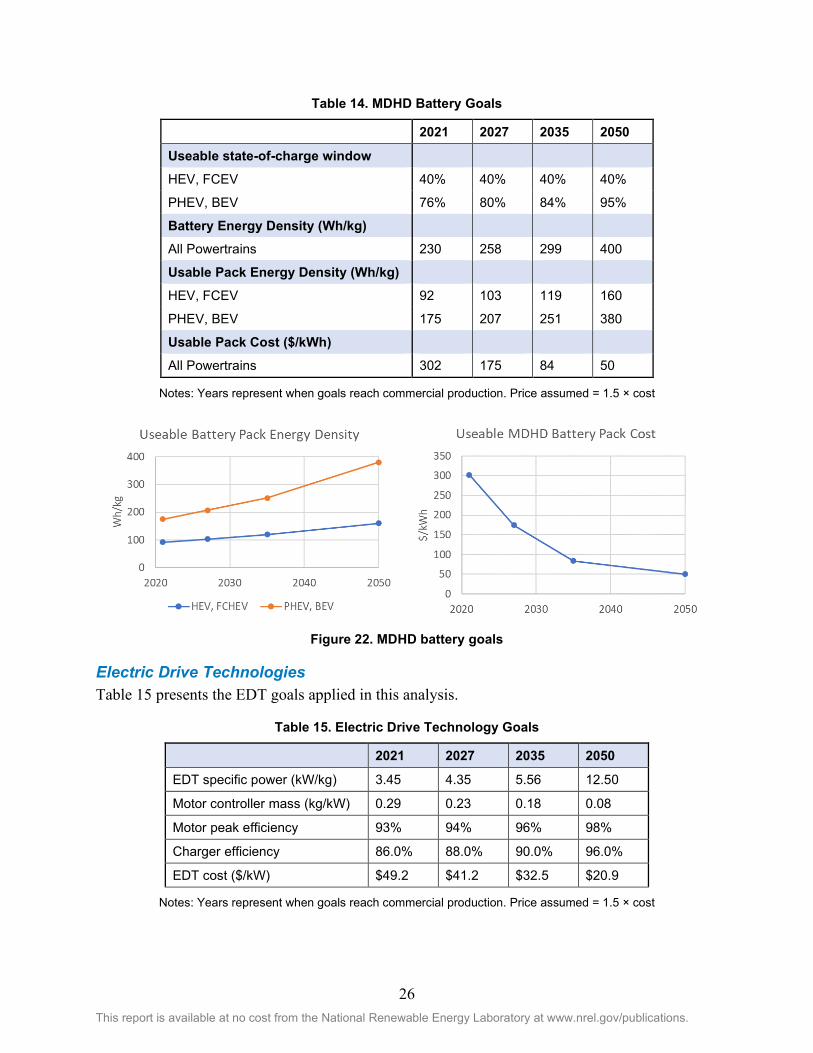
26 This report is available at no cost from the National Renewable Energy Laboratory at www.nrel.gov/publications.
Table 14. MDHD Battery Goals
2021 2027 2035 2050
Useable state-of-charge window
HEV, FCEV 40% 40% 40% 40%
PHEV, BEV 76% 80% 84% 95%
Battery Energy Density (Wh/kg)
All Powertrains 230 258 299 400
Usable Pack Energy Density (Wh/kg)
HEV, FCEV 92 103 119 160
PHEV, BEV 175 207 251 380
Usable Pack Cost ($/kWh)
All Powertrains 302 175 84 50
Notes: Years represent when goals reach commercial production. Price assumed = 1.5 × cost
Figure 22. MDHD battery goals
Electric Drive Technologies Table 15 presents the EDT goals applied in this analysis.
Table 15. Electric Drive Technology Goals
2021 2027 2035 2050
EDT specific power (kW/kg) 3.45 4.35 5.56 12.50
Motor controller mass (kg/kW) 0.29 0.23 0.18 0.08
Motor peak efficiency 93% 94% 96% 98%
Charger efficiency 86.0% 88.0% 90.0% 96.0%
EDT cost ($/kW) $49.2 $41.2 $32.5 $20.9
Notes: Years represent when goals reach commercial production. Price assumed = 1.5 × cost

27 This report is available at no cost from the National Renewable Energy Laboratory at www.nrel.gov/publications.
Combustion The SuperTruck II initiative’s goal is to demonstrate an operational engine that achieves 55% or greater brake thermal efficiency on a dynamometer by 2021, whereas the 21CTP has established a longer-term goal of 57% brake thermal efficiency. As shown in Table 16, this analysis assumed that there would be significant lag between demonstrating 55% on a dynamometer in 2021 and developing a reliable, million-mile, cost-effective production engine. This reflects the assumption that a Rankine cycle waste heat recovery system will be required to achieve brake thermal efficiency over about 52%. In addition, these efficiencies are assumed to be less achievable and/or less cost-effective for smaller engines and duty cycles with lower speeds and more frequent stops. Therefore, lower efficiency goals are adopted for vocational vehicles. No waste heat recovery is included on vocational engines, but other engine and transmission technologies are assumed to achieve incremental improvement in performance and costs. Technology costs for 2021 and 2027 are taken from EPA with extrapolation of reductions after 2027 [19].
Table 16. Engine Peak Efficiency Goals
Segment Base engine size (L) 2021 2027 2035 2050
Sleeper Tractor 15 46.0% 50.0% 55.0% 57.0%
Day Cab Tractor 15 46.0% 50.0% 55.0% 57.0%
Class 8 Vocational 11 43.0% 46.4% 48.0% 52.0%
Class 6 Vocational 7 41.0% 44.4% 46.0% 50.0%
Glider and Other Goals The SuperTruck II teams are pursuing multiple tractor and trailer vehicle-level approaches to increase the freight efficiency (gal/ton-mile) of long-haul trucks by 100% relative to a 2009 baseline. These include reductions in aerodynamic drag, tire rolling resistance, weight reduction, and auxiliary loads. However, DOE does not have explicit MDHD goals for these improvements. Aerodynamic drag and rolling resistance represent opportunities for cost-effective fuel savings, have synergies with electrification, and are explicitly included in the vehicle simulations, as are modest improvements in auxiliary loads. Although weight reduction also has important synergies with electrification and represents a critical strategy for designing long-haul BEVs that require large battery capacity, it was not included for the current analysis cycle. Even with lightweighting, MDHD BEVs may operate at the same weight, but with lower payload, whereas lighter freight vehicles of other powertrains may carry more payload while operating at the same total weight. In fact, the SuperTruck initiative specifies operating weight and instead captures weight changes through payload capacity and a freight efficiency improvement goal. Unfortunately, the modeling framework used for benefits analysis has no capability to account for changes in truck payload capacity, loading factors, or the resulting change in vehicle-miles. However, as VTO and HFTO develop specific MDHD goals, future analyses should capture these benefits.
Table 17 provides modeling input assumptions for aerodynamic drag, tire rolling resistance, and auxiliary loads.
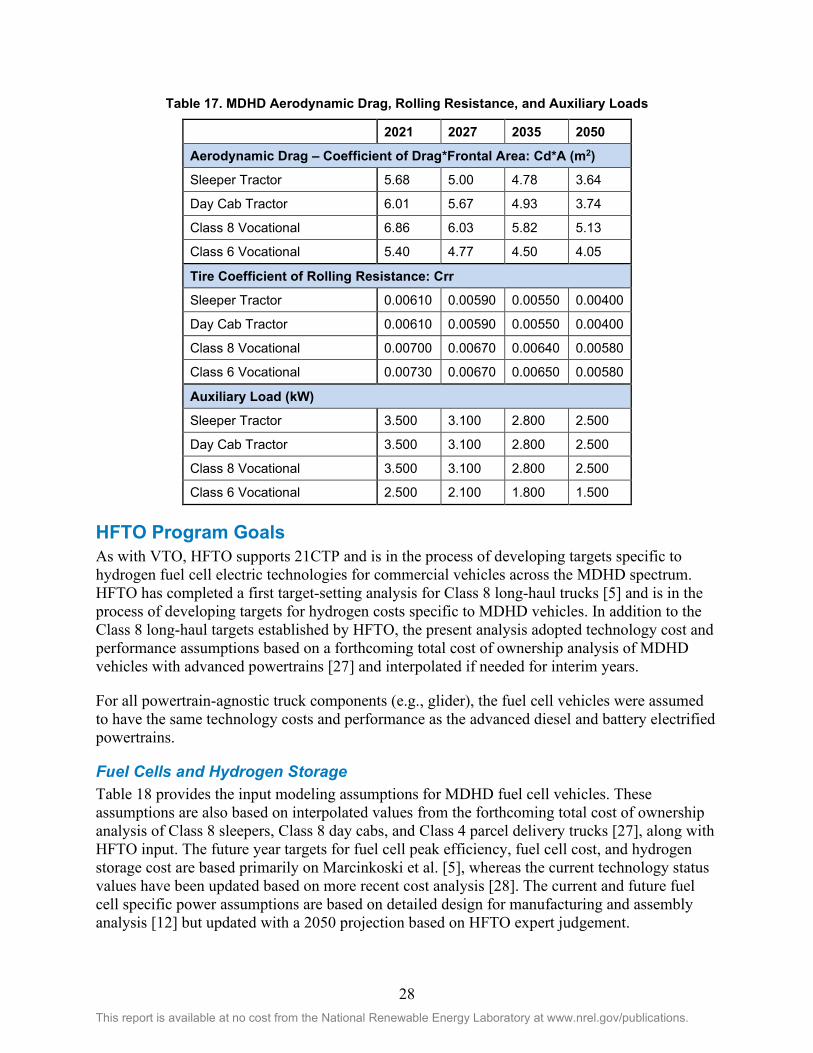
28 This report is available at no cost from the National Renewable Energy Laboratory at www.nrel.gov/publications.
Table 17. MDHD Aerodynamic Drag, Rolling Resistance, and Auxiliary Loads
2021 2027 2035 2050
Aerodynamic Drag – Coefficient of Drag*Frontal Area: Cd*A (m2)
Sleeper Tractor 5.68 5.00 4.78 3.64
Day Cab Tractor 6.01 5.67 4.93 3.74
Class 8 Vocational 6.86 6.03 5.82 5.13
Class 6 Vocational 5.40 4.77 4.50 4.05
Tire Coefficient of Rolling Resistance: Crr
Sleeper Tractor 0.00610 0.00590 0.00550 0.00400
Day Cab Tractor 0.00610 0.00590 0.00550 0.00400
Class 8 Vocational 0.00700 0.00670 0.00640 0.00580
Class 6 Vocational 0.00730 0.00670 0.00650 0.00580
Auxiliary Load (kW)
Sleeper Tractor 3.500 3.100 2.800 2.500
Day Cab Tractor 3.500 3.100 2.800 2.500
Class 8 Vocational 3.500 3.100 2.800 2.500
Class 6 Vocational 2.500 2.100 1.800 1.500
HFTO Program Goals As with VTO, HFTO supports 21CTP and is in the process of developing targets specific to hydrogen fuel cell electric technologies for commercial vehicles across the MDHD spectrum. HFTO has completed a first target-setting analysis for Class 8 long-haul trucks [5] and is in the process of developing targets for hydrogen costs specific to MDHD vehicles. In addition to the Class 8 long-haul targets established by HFTO, the present analysis adopted technology cost and performance assumptions based on a forthcoming total cost of ownership analysis of MDHD vehicles with advanced powertrains [27] and interpolated if needed for interim years.
For all powertrain-agnostic truck components (e.g., glider), the fuel cell vehicles were assumed to have the same technology costs and performance as the advanced diesel and battery electrified powertrains.
Fuel Cells and Hydrogen Storage Table 18 provides the input modeling assumptions for MDHD fuel cell vehicles. These assumptions are also based on interpolated values from the forthcoming total cost of ownership analysis of Class 8 sleepers, Class 8 day cabs, and Class 4 parcel delivery trucks [27], along with HFTO input. The future year targets for fuel cell peak efficiency, fuel cell cost, and hydrogen storage cost are based primarily on Marcinkoski et al. [5], whereas the current technology status values have been updated based on more recent cost analysis [28]. The current and future fuel cell specific power assumptions are based on detailed design for manufacturing and assembly analysis [12] but updated with a 2050 projection based on HFTO expert judgement.

29 This report is available at no cost from the National Renewable Energy Laboratory at www.nrel.gov/publications.
It should be noted that hydrogen prices are described in the previous Fuels Prices section, and the life cycle emissions were based on GREET [9] using the same assumptions as in the LD vehicle modeling.
Table 18. Fuel Cell and Hydrogen Storage Assumptions
2021 2027 2035 2050
Fuel Cell Specific Power (kW/kg) 0.94 0.99 1.04 1.08
Peak Efficiency 63% 65% 68% 72%
Cost ($/kW) $206 $159 $80 $60
Hydrogen storage cost ($/kWh) $42 $25 $9 $8
Notes: Years represent when goals reach commercial production. Price assumed = 1.5 × cost
Costs provided reflect estimates made at the time this report was completed. More recent analysis indicates that the cost of fuel cells for medium- and heavy-duty applications is $196/kW in 2021, assuming a manufacturing volume of 50,000 units/year [29].
Results
No Program As shown in Figure 23, removing DOE-supported technologies from the 2020 AEO Reference Case new diesel fleet reduces the average fuel economy of day cab tractors by about 4% and vocational trucks by about 1%. Sleeper cab tractor fuel economy was not adjusted because the AEO Reference Case fuel economy for this class just meets the phase 2 regulations. This analysis assumes that a different suite of non-VTO-supported technologies would be used to meet this regulation under the No Program case.
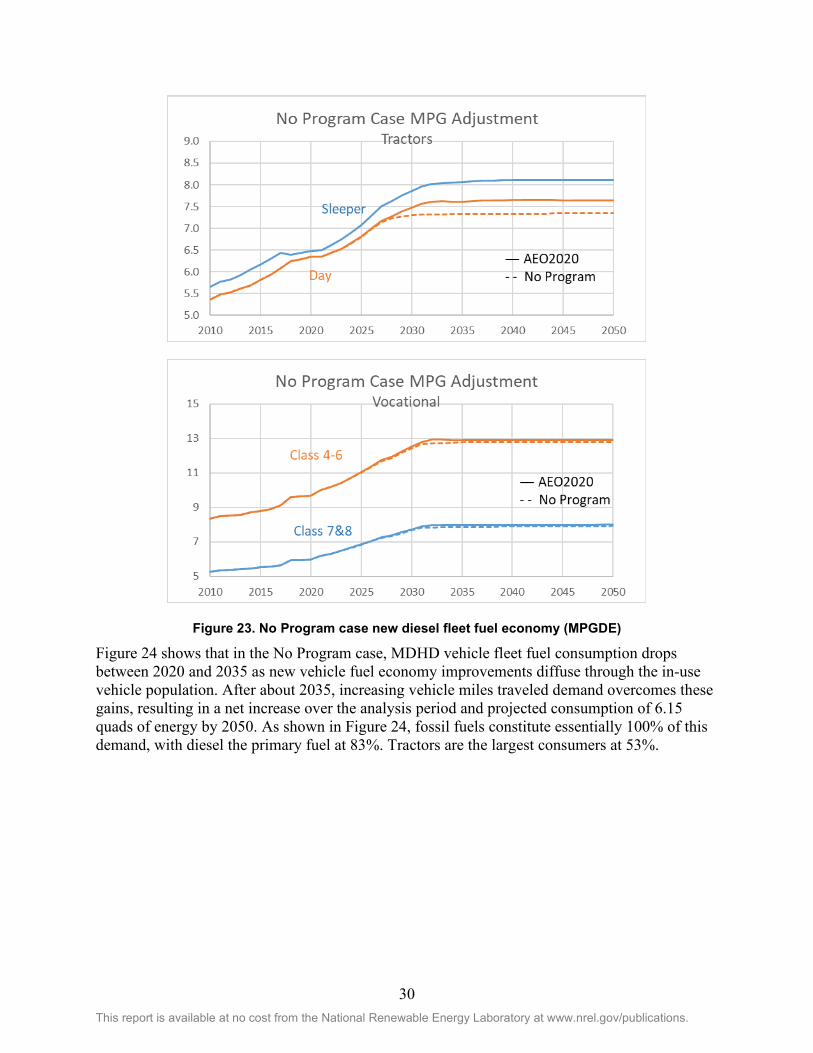
30 This report is available at no cost from the National Renewable Energy Laboratory at www.nrel.gov/publications.
Figure 23. No Program case new diesel fleet fuel economy (MPGDE)
Figure 24 shows that in the No Program case, MDHD vehicle fleet fuel consumption drops between 2020 and 2035 as new vehicle fuel economy improvements diffuse through the in-use vehicle population. After about 2035, increasing vehicle miles traveled demand overcomes these gains, resulting in a net increase over the analysis period and projected consumption of 6.15 quads of energy by 2050. As shown in Figure 24, fossil fuels constitute essentially 100% of this demand, with diesel the primary fuel at 83%. Tractors are the largest consumers at 53%.

31 This report is available at no cost from the National Renewable Energy Laboratory at www.nrel.gov/publications.
Figure 24. No Program case energy consumption
Program Success Figure 25 shows the FASTSim simulation results, interpolated between analysis years using a sigmoid function, and Figure 26 shows the electric range for plug-in vehicles. These values represent cycle-weighted averages of the three phase 2 fuel consumption regulation duty cycles, using weighting factors provided in the regulations. For vocational vehicles, there are three sets of weighting factors for different usage profiles (regional, multipurpose, and urban). These resulting fuel economies and ranges were aggregated using fleet composition found in the regulatory impact assessment [19]. Figure 27 shows the estimated cost of these vehicles.
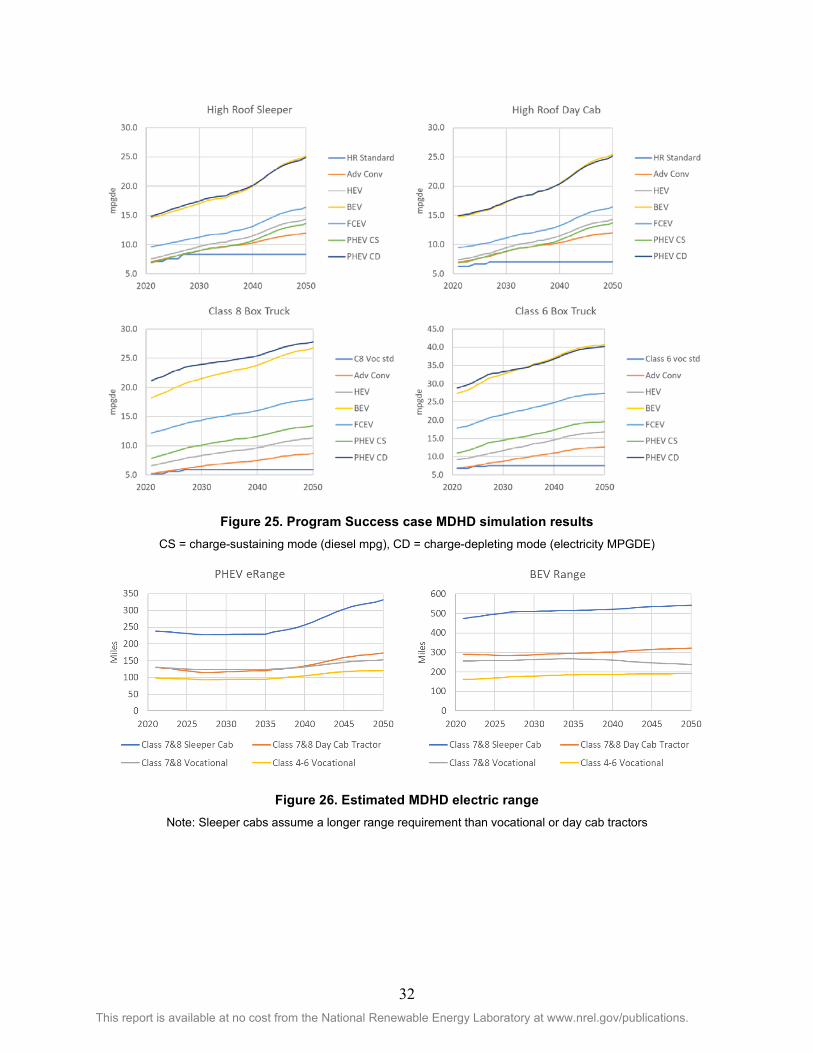
32 This report is available at no cost from the National Renewable Energy Laboratory at www.nrel.gov/publications.
Figure 25. Program Success case MDHD simulation results CS = charge-sustaining mode (diesel mpg), CD = charge-depleting mode (electricity MPGDE)
Figure 26. Estimated MDHD electric range Note: Sleeper cabs assume a longer range requirement than vocational or day cab tractors

33 This report is available at no cost from the National Renewable Energy Laboratory at www.nrel.gov/publications.
Figure 27. Program Success case MDHD estimated cost
In the Program Success case, vehicles incorporating VTO and HFTO technologies achieve significant market shares. Advanced diesels and HEVs initially are the most attractive choice, achieving 97% of the market for sleeper tractors, 71% for day cab tractors, 69% for Class 7 and 8 vocational trucks, and 80% for Class 4–6 diesel vocational trucks until around 2040. As shown in Figure 28, the fuel economy of new diesel trucks in the Program Success case is greater than that in the No Program case by 46% to 59% in Class 7 and 8 and 68% in Class 4–6 by 2050. After 2040, electrified powertrains become cost-effective, and by 2050, PHEVs, BEVs, and FCEVs combined account for a significant share of mileage-weighted sales at 46% of sleepers and day cabs, 42% of Class 7 and 8 vocational trucks, and 41% of Class 4–6 diesel market trucks.
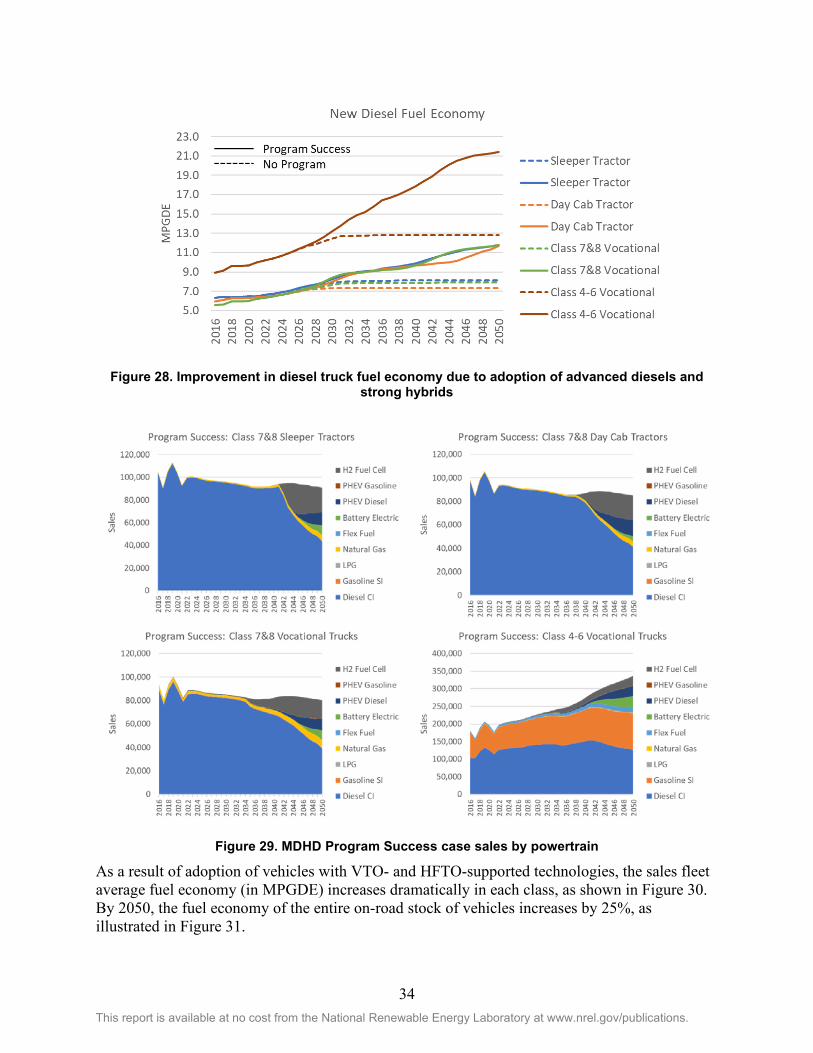
34 This report is available at no cost from the National Renewable Energy Laboratory at www.nrel.gov/publications.
Figure 28. Improvement in diesel truck fuel economy due to adoption of advanced diesels and strong hybrids
Figure 29. MDHD Program Success case sales by powertrain
As a result of adoption of vehicles with VTO- and HFTO-supported technologies, the sales fleet average fuel economy (in MPGDE) increases dramatically in each class, as shown in Figure 30. By 2050, the fuel economy of the entire on-road stock of vehicles increases by 25%, as illustrated in Figure 31.

35 This report is available at no cost from the National Renewable Energy Laboratory at www.nrel.gov/publications.
Figure 30. Change in new MDHD fleet fuel economy
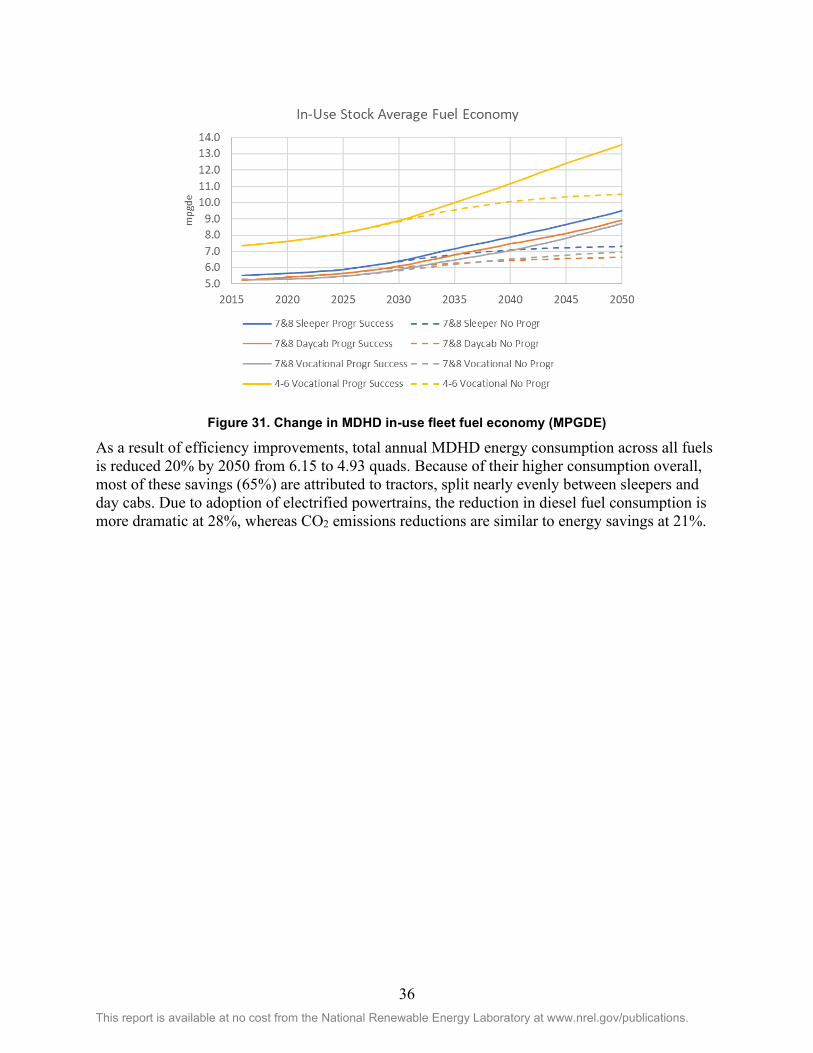
36 This report is available at no cost from the National Renewable Energy Laboratory at www.nrel.gov/publications.
Figure 31. Change in MDHD in-use fleet fuel economy (MPGDE)
As a result of efficiency improvements, total annual MDHD energy consumption across all fuels is reduced 20% by 2050 from 6.15 to 4.93 quads. Because of their higher consumption overall, most of these savings (65%) are attributed to tractors, split nearly evenly between sleepers and day cabs. Due to adoption of electrified powertrains, the reduction in diesel fuel consumption is more dramatic at 28%, whereas CO2 emissions reductions are similar to energy savings at 21%.

37 This report is available at no cost from the National Renewable Energy Laboratory at www.nrel.gov/publications.
Figure 32. MDHD Program Success case energy use and CO2 emissions

38 This report is available at no cost from the National Renewable Energy Laboratory at www.nrel.gov/publications.
The increase in annual expenditures on new MDHD vehicles is shown in Figure 33 along with annual savings on fuel expenditures. As the efficiency of the stock of in-use vehicles increases, the savings quickly outpace additional vehicle costs, and net cumulative benefits begin in 2037. By 2050, annual fuel cost savings reach $35.3 billion, and cumulative savings of $339 billion are twice the cumulative vehicle expenditures ($163 billion). Net savings reach $175.8 billion in 2050 will continue to grow beyond the analysis horizon.
Figure 33. Change in MDHD vehicle and fuel expenditures in the Program Success case relative to the No Program case
MDHD Benefits Analysis Summary The VTO and HFTO programs show significant impact on MDHD diesel consumption and CO2 emissions, with respective annual reductions reaching about 28% and 18% by 2050. Though annual expenditures on vehicle purchases increase, savings from fuel purchases quickly outpace these costs as more efficient vehicles in the stock continue to reap benefits. These results do not include the benefit of R&D investments prior to 2020, but rather only the benefits due to technologies that start entering the market in 2025. They also do not capture benefits after the 2050 analysis horizon, which trends suggest will continue to grow and accumulate.

39 This report is available at no cost from the National Renewable Energy Laboratory at www.nrel.gov/publications.
Combined Light-Duty and Medium-/Heavy-Duty Benefits Summary The combination of LD and MDHD program success can be seen in Figure 34. By 2050, annual petroleum consumption is reduced 15% and annual CO2 emissions 13%. As previously noted, these Program Success cases were based on technology goals in 2020, and do not account for potential future policies that may drive a more rapid transition to zero-emission vehicles.
Figure 34. Combined LD and MDHD petroleum and carbon emission benefits
40 This report is available at no cost from the National Renewable Energy Laboratory at www.nrel.gov/publications.
References
[1] A. Brooker, J. Gonder, S. Lopp and J. Ward, "ADOPT: A Historically Validated Light Duty Vehicle Consumer Choice Model," SAE Technical Paper 2015-01-0974, 2015.
[2] NREL, "ADOPT: Automotive Deployment Options Projection Tool," 2021. [Online]. Available: https://www.nrel.gov/transportation/adopt.html. [Accessed March 2021].
[3] NREL, "FASTSim: Future Automotive Systems Technology Simulator," 2018. [Online]. Available: https://www.nre.gov/transportation/fastsim.html. [Accessed 15 March 2021].
[4] A. Brooker, J. Gonder, L. Wang, S. Lopp and L. Ramroth, "FASTSim: A Model to Estimate Vehicle Efficiency, Cost and Performance," SAE Technical Paper 2015-01-0973, 2015.
[5] J. Marcinkoski, "Hydrogen Class 8 Long Haul Truck Targets," Hydrogen Fuel Cell Technology Office Program Record # 19006, 2019.
[6] EIA, "Annual Energy Outlook 2020," Energy Information Administration, Washington, DC, 2020.
[7] E. Kontou, M. Melaina and A. Brooker, "Light-Duty Vehicle Attribute Projections (Years 2015-2030)," California Energy Commission. Publication Number: CEC-200-2018-008., 2018.
[8] C. E. Johnson, E. Newes, A. Brooker, R. McCormick, S. Peterson, P. Leiby, R. Uria Martinez, G. Oladosu and M. Brown, "High-Octane Mid-Level Ethanol Blend Market Assessment," National Renewable Energy Laboratory Technical Report NREL/TP-5400-63698, 2015.
[9] ANL, "GREET 2020," 2020. [Online]. Available: https://greet.es.anl.gov/. [10] C. Houchins and B. D. James, "Hydrogen Storage System Cost Analysis: Summary of FY
2020 Activities," Strategic Analysis, Inc., 2020. [11] E. Padgett and G. Kleen, "DOE Hydrogen and Fuel Cells Program Record: Early Market
Transportation Fuel Cell Cost," Hydrogen Fuel Cells Technology Office Program Record # 20002, 2020.
[12] B. D. James, J. M. Huya-Kouadio, C. Houchins and D. A. DeSantis, "Mass Production Cost Estimation of Direct H2 PEM Fuel Cell Systems for Transportation Applications: 2018 Update," Strategic Analysis, Inc., 2018.
[13] E. Padgett and G. Kleen, "DOE Hydrogen and Fuel Cells Program Record: Automotive Fuel Cell Targets and Status," Hydrogen Fuel Cells Technology Office Program Record # 20005, 2020.
[14] M. Koleva and N. Rustagi, "DOE Hydrogen and Fuel Cells Program Record: Hydrogen Delivery and Dispensing Cost," Hydrogen Fuel Cells Technology Office Program Record # 20007, 2020.
[15] Y. Zhou, U.S. Light Duty Electric Drive Vehicles Monthly Sales Update, March 2021, Argonne National Laboratory, 2021.
[16] EIA, "Today in Energy, "Electrified vehicles continue to see slow growth and less use than conventional vehicles"," May 2018. [Online]. Available: https://www.eia.gov/todayinenergy/detail.php?id=36312.

41 This report is available at no cost from the National Renewable Energy Laboratory at www.nrel.gov/publications.
[17] A. Birky and A. Brooker, "Medium- and Heavy-Duty Vehicle Choice Modeling and Applied Analysis," in DOE Vehicle Technologies Program 2020 Annual Merit Review and Peer Evaluation Meeting, 2020.
[18] R. Vijayagopal, D. Nieto Prada and A. Rousseau, "Fuel Economy and Cost Estimates for Medium-and Heavy-Duty Trucks," Argonne National Laboratory, Report to the US Department of Energy, Contract ANL/ESD-19/8, 2019.
[19] U.S. EPA, "Greenhouse Gas Emissions and Fuel Efficiency Standards for Medium- and Heavy-Duty Engines and Vehicles – Phase 2, Regulatory Impact Analysis," 2016.
[20] U.S Census Bureau, "2002 Economic Census, Vehicle Inventory and Use Survey," Department of Commerce, Washington, DC, 2004.
[21] L. Eudy, "Technology Acceleration: Fuel Cell Bus Evaluations," in DOE Hydrogen and Fuel Cells Program: 2019 Annual Merit Review and Peer Evaluation Meeting, Crystal City, Virginia, 2019.
[22] B. Borlaug, S. Salisbury, M. Gerdes and M. Muratori, "Levelized Cost of Charging Electric Vehicles in the United States," Joule, vol. 4, pp. 1470-1485, 2020.
[23] U.S. DOE, "Clean Cities Alternative Fuel Price Report," April 2018. [24] U.S. DOE, "U.S. Alternative Fueling Stations by Fuel Type," [Online]. Available:
https://www.afdc.energy.gov/data/10332. [25] U.S. DOE, "Alternative Fueling Station Counts by State," [Online]. Available:
https://afdc.energy.gov/stations/states. [26] ANL, "VISION Model Download," 2020. [Online]. Available:
https://www.anl.gov/es/vision-model-download. [27] C. Hunter, M. Penev, E. Reznicek, J. Lustbader, A. Birky and C. Zhang, "Spatial and
Temporal Analysis of the Total Cost of Ownership for Class 8 Tractors and Class 4 Parcel Delivery Trucks," National Renewable Energy Laboratory. NREL/ TP-5400-71796, Golden, CO, 2021 forthcoming.
[28] B. D. James, J. M. Huya-Kouadio, B. M. Murphy, C. Houchins and D. A. DeSantis, "Mass Production Cost Estimation of Direct H2 PEM Fuel Cell Systems for Transportation Applications: 2019 Update on Medium and Heavy-Duty Vehicles," Strategic Analysis, Inc..
[29] D. Papageorgopoulos, "Fuel Cell Technologies Overview," in 2021 HFTO Annual Merit Review and Peer Evaluation Meeting, Washington, D.C., June 7, 2021.