Vegetation Establishment For Erosion Control Under ...
14
California State University, Sacramento (CSUS) University of California, Davis (UCD) California Department of Transportation (Caltrans) Vegetation Establishment For Erosion Control Under Simulated Rainfall Presented at: International Erosion Control Association (IECA), 34th Annual Conference and Expo., Las Vegas, Nevada, February 24-28, 2003 Authors: Brent G. Hallock, California Polytechnic State University, San Luis Obispo Misty Scharff, Caltrans/CSUS Storm Water Program Steve Rein, California Polytechnic State University, San Luis Obispo Kaila Dettman, California Polytechnic State University, San Luis Obispo Disclaimer: This work reflects the author’s opinions and does not represent official policy or endorsement by the California Department of Transportation, the California State University, or the University of California. Caltrans Storm Water Program Office of Water Programs, CSU, Sacramento 7801 Folsom Boulevard, Suite 102, Sacramento, CA 95826 PP045
Transcript of Vegetation Establishment For Erosion Control Under ...

California State University, Sacramento (CSUS)
University of California, Davis (UCD)
California Department of Transportation (Caltrans)
Vegetation Establishment For Erosion Control Under Simulated Rainfall
Presented at:
International Erosion Control Association (IECA), 34th Annual Conference and Expo., Las Vegas, Nevada, February 24-28, 2003
Authors:
Brent G. Hallock, California Polytechnic State University, San Luis Obispo Misty Scharff, Caltrans/CSUS Storm Water Program Steve Rein, California Polytechnic State University, San Luis Obispo Kaila Dettman, California Polytechnic State University, San Luis Obispo
Disclaimer:
This work reflects the author’s opinions and does not represent official policy or endorsement by the California Department of Transportation, the California State University, or the University of California.
Caltrans Storm Water Program
Office of Water Programs, CSU, Sacramento 7801 Folsom Boulevard, Suite 102, Sacramento, CA 95826
PP045
VEMS IECA–Vegetation Establishment For Erosion Control
Vegetation Establishment For Erosion Control Under Simulated Rainfall
Brent G. Hallock (contact) Professor
Earth and Soil Sciences Department California Polytechnic State University
San Luis Obispo, CA, 93407 805.756.2436
805.756.5412 (fax) [email protected]
Misty Scharff Soil Scientist
Office of Water Programs California State University
Sacramento, CA, 95826 916.278.8106
916.278.8140 (fax) [email protected]
Steve Rein
Assistant Professor Statistics Department
California Polytechnic State University San Luis Obispo, CA, 93407
805.756.2941 805.756.5412(fax) [email protected]
Kaila Dettman
Research Associate Earth and Soil Sciences Department
California Polytechnic State University San Luis Obispo, CA, 93407
805.756.2436 805.756.5412 (fax)

VEMS IECA–Vegetation Establishment For Erosion Control
Biographical Sketches
Brent G. Hallock
Brent G. Hallock, Ph.D., CPSS, and CPESC, is a professor at California Polytechnic State University, San Luis Obispo, since 1979. He teaches an undergraduate course in Soil Erosion and Water Conservation, an upper division course in Rangeland Resources, and a graduate course in Soil Erosion and Sediment Control. Brent earned Cal Poly's highest award of Distinguished Teacher in 2000. He has taught over 30 seminars and short courses in site analysis, erosion control, and selection of management measures. Dr. Hallock's research grants with Caltrans, RWQCB, and EPA on the use of vegetation in erosion control and water quality total over two million dollars in the past seven years.
Misty Scharff
Ms. Misty Scharff has been involved with California State University Sacramento performing research on erosion and sediment control for Caltrans since 2000. Misty was educated in soil science from California Polytechnic State University, San Luis Obispo, were she assisted in numerous erosion control research studies. Misty has been a member of IECA since 1996.
Steve Rein
Steven Rein, Ph.D. is an assistant professor in the Statistics Department at Cal Poly State University in San Luis Obispo, California. Between receiving his Ph.D. in 1993 from U.C. Berkeley and coming to Cal Poly in 1998, he was an assistant professor at Virginia Commonwealth University in Richmond, Virginia where he held appointments in both the Mathematical Sciences Department and at the Center for Environmental Studies. His primary area of research interest is in the application of statistical methodology to problems in ecology and the biological sciences. Past work includes an analysis of the relationship between environmental factors and California's Chinook salmon population and contributing to the development of Virginia's Environmental Quality Index (VEQI).
Kaila Dettman Kaila Dettman earned her BS degree in Animal Science, with a concentration in Rangeland Resources, from Cal Poly State University, San Luis Obispo. Her interest center on rangeland vegetation for decreasing accelerated erosion and increasing water quality and rangeland health. Kaila is presently in the MS program at Cal Poly and is developing an erosion control plan for the Animal Science Unit.

VEMS IECA–Vegetation Establishment For Erosion Control
Abstract The California Department of Transportation (Caltrans) manages rights of ways that transect 41 m H (101m ac) and span over 3000 m (9000 ft) in elevation from seashore to sup alpine. There are approximately 4,900 native and 1,000 naturalized alien plant species in California. Only a few hundred are reliably useful in erosion and sediment control. Specifying native and naturalized vegetation mixes for use in hydroseeding or plug planting in conjunction with mechanical erosion control methods can have varying result for minimizing accelerated soil erosion. To investigate these factors, Cal Poly, San Luis Obispo, in conjunction with Caltrans and CSU, Sacramento, conducted a study establishing vegetation using hydroseeding and plug planting with erosion control practices of crimped straw, jute netting, gypsum, BFM, and guar tackifier. The vegetative treatments included native vegetation from Caltrans District 5, Bromus carinatus (California brome) seeds and plugs, a typical naturalized erosion control mix from Farm Supply, existing seed bank, mostly Lolium multiflorum (rye grass), and two control boxes left untreated. Percent cover and runoff quality were measured for each box.
The goal was to identify initially fast growing vegetation that establishes within 70 days and demonstrates long-term erosion control. Treatments were conducted in 0.6 by 2 m soil test boxes set at a 2:1 (V:H) slope. Seeding rates were typical for District 5 and plugs were planted at 22 and 44/m2. Boxes were filled with a sandy clay loam (USDA) soil typical of District 5 fill slopes, compacted to 90 %. The rainfall simulators mimicked a 30-year storm along the California coast with 1.5” of rain in 1.5 hours.
The highest percentage of vegetation was with the native seedings and plugs, with jute and straw consisting mostly of legumes and forbs. The EC mix and gypsum produced the least amount of grasses. The EC mix and BFM were very dense stands of legumes. Gypsum and tackifier treatments were relatively bare. Native plants were poorly established in all treatments. The plug plantings were well established.
The lowest runoff sediment concentration was with both the native and EC mix seedings and jute, followed by BFM, plugs and jute and finally jute alone. The range was 7.8 to 1,0002.5 mg/L. The highest runoff sediment concentration was the existing vegetation and guar tackifier, crimpled straw, gypsum, and bare soil. The range was 6,921.4 to 46,894.2 mg/L.
Key Words: Establishing Native Vegetation for erosion control, Hydroseeding vs. Plug Planting, Rainfall Simulators, and Caltrans
Marketing Paragraph This paper discusses the use of rainfall simulators in establishing native vegetation using typical hydroseeding and plug planting techniques along the California Central Coast. Erosion Control treatments included straw, tackifier, BFM, and jute. Native vegetation, runoff, and water quality were dependent on the erosion control treatments. The highest percentage of vegetation was the non-native species that already had a seed bank in the soil. The results will be presented on what treatment is most effective and how hydroseeding affects native plant establishment and water quality.

VEMS IECA–Vegetation Establishment For Erosion Control
Vegetation Establishment For Erosion Control Under Simulated Rainfall
Project Overview The purpose of this multi-year project is to develop guidance for effective establishment of erosion control vegetation for rapid short-term growth and for long-term establishment. The plants examined in this study included both native and non-native naturalized species.
The California Department of Transportation (Caltrans) will use the results of this study in an effort to increase vegetation establishment, decrease erosion, and thereby improve water quality. There is a need to address proper seed selection, proper time of year for seeding, appropriate methods of hydroseeding and plant establishment criteria as it relates to erosion control and soil stabilization.
Results from the two most recently completed experiments from 2001-2002 are presented here.
Principal Goals & Objectives The general goal of this and related experiments is to identify and select plant species that demonstrate initially fast growth and potential long-term erosion control under a variety of rainfall regimes. The specific objective of the two experiments presented here were:
1. To compare the establishment of a native Central Coastal California seeding and a non-native seeding mix using hydroseeding vs. the existing seed bank for rapid cover and their respective effectiveness at controlling sediment transport under intense simulated rainfall at 45 and 70 days.
2. To compare hydroseeded versus plug-planted California Brome (Bromus cariantus H.&A. sensu stricto) in respective effectiveness at controlling sediment transport under intense simulated rainfall at 70 days.
Experimental Designs Elements Common to Both Experiments Box Design Two criteria were used to determine the size of the erosion test boxes. First, box dimensions must relate to boxes used in experiments found in the soil erosion literature. Second, size, shape, and weight must be appropriate for easy handling by two people using a simple one-ton chain hoist. Pearce et al (1998) utilized field micro-plots of 0.6 meters (2 feet) by 2.0 meters (6.6 feet) alongside standard plots of 3.0 meters (9.9 feet) by 10 meters (32.9 feet). A box having the same dimensions as the micro-plots and with a soil depth of 20 cm (7.8 inches) weighs less than a ton when saturated and is easily moved by two people using a hoist. A total of 32 erosion test boxes, each measuring 2.0m L x 0.6m W x 0.3m, were constructed and filled with Sandy Clay Loam soil. One end of each box was cut to a height of 20 cm (7.8 inches) to coincide with the height of the added soil.
In addition to the erosion test boxes, Clint Iwanicha Designs created plans for a support stand. Ten of these supports were used in this study. The supports are constructed of pressure treated lumber, and 2.5 cm OD, schedule 40, galvanized steel pipe to support the boxes at a 2:1 slope. These supports were used during rainfall simulations, and for positioning boxes throughout the experiment. Each box had a designated space under the box transport system. The erosion test boxes were situated next to each other, five boxes per row with a total of five rows.
A length of vinyl gutter was used to collect runoff from the base of the erosion test box and channel it into a basin where it was collected. A rectangular piece of synthetic pond liner was cut and riveted to the vinyl gutter. This prevented simulated rainfall from entering the erosion collection system. The collection system was secured to the box with screws. The basin consisted of an 7.5 Liter plastic container, trimmed to accept the curve of the gutter.
VEMS IECA–Vegetation Establishment For Erosion Control
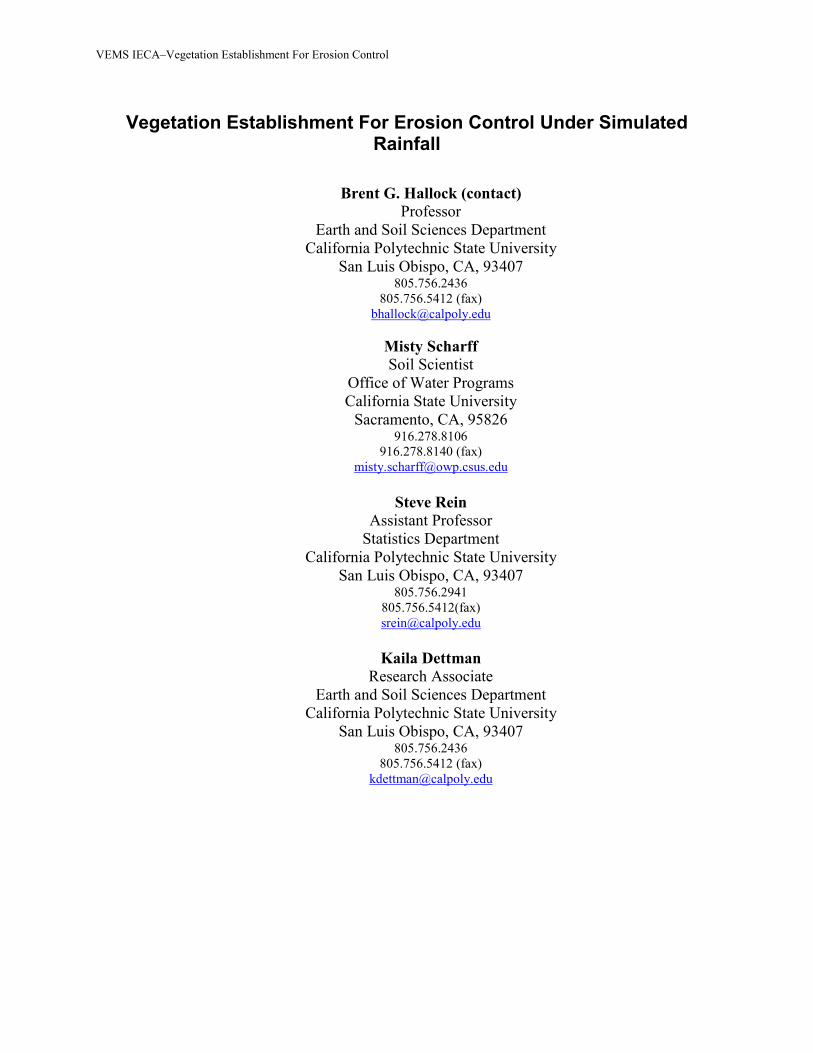
Runoff Collection System
Soil Analysis Soil core samples for laboratory analysis were taken from the upper and lower halves of boxes 14, 38, and a control box. Box 14 (V1EC2) was treated with Bonded Fiber Matrix (BFM) and hydroseeded with Brome. Box 38 (V2EC4) was Imprinted and planted with Brome plugs at 22/m2. The control box was untreated. Bulk density was calculated by the core method and soil texture was determined by the bouyoucos hydrometer method (Taskey 1996). All soil chemical analyses were performed using the Lab Manual for the study of
Fertilizers in Improving Soil Fertility (Dickson 1990). The same soil was used for both experiments (RS2 and RS3).
The average bulk density in the upper and lower halves of the boxes were 1.40g/cm3 and 1.54g/cm3, respectively. The USDA texture is Sandy Clay Loam with an average grade of 57.6% sand, 20.8% silt, and 21.7% clay. Concentrations of phosphorous, chloride, sulfate, sodium and the electrical conductivity (EC) were greater in the lower halves of the boxes.
The high concentration of chloride (above 50 ppm) in the lower half of Box 38 could damage chloride sensitive plants. Additionally, the EC of the lower half of Box 38 was above 2.0 ms/cm and could cause problems with plant growth (Dickson 1990). The high concentration of calcium and the moderately alkaline pH are indicative of a high amount of lime present in the soil.
Soil Physical Analysis
Control Upper
Control Lower Box 14 Upper Box 14 Lower Box 38 Upper Box 38 Lower
% Clay 19.7 20.8 22.2 21.8 23.0 22.5 % Silt 22.8 21.7 21.5 20.5 20.6 17.5 % Sand 57.5 57.5 56.3 57.7 56.4 60.0 USDA Soil Texture
Sandy Loam Sandy Clay Loam
Sandy Clay Loam
Sandy Clay Loam
Sandy Clay Loam
Sandy Clay Loam
Bulk Density* 1.46 1.58 1.32 1.52 1.42 1.53 *Bulk density calculations are in g/cm3.
Soil Chemical Analysis
Control Upper Control Lower Box 14 Upper Box 14 Lower Box 38 Upper Box 38 Lower P (ppm) 51 86 56.5 47.5 52.5 62.5 Cl (ppm) ND 35 ND 30 ND 87.5 SO4 (ppm) 19.5 30.5 16.5 27 19 23.6 Ca (ppm) 3210 3265 3165 3095 3290 3170 Mg (ppm) 900 900 900 900 950 900 K (ppm) 275 340 245 225 270 240 Na (ppm) 110 165 115 170 125 230 NO3 (ppm) 27.2 23.2 16.8 17.2 14.8 14.4 EC (ms/cm) 0.715 1.286 0.723 1.144 0.772 2.645 pH 8.01 7.97 8.37 8.33 8.38 8.33
ND - Results below detection limits.
VEMS IECA–Vegetation Establishment For Erosion Control
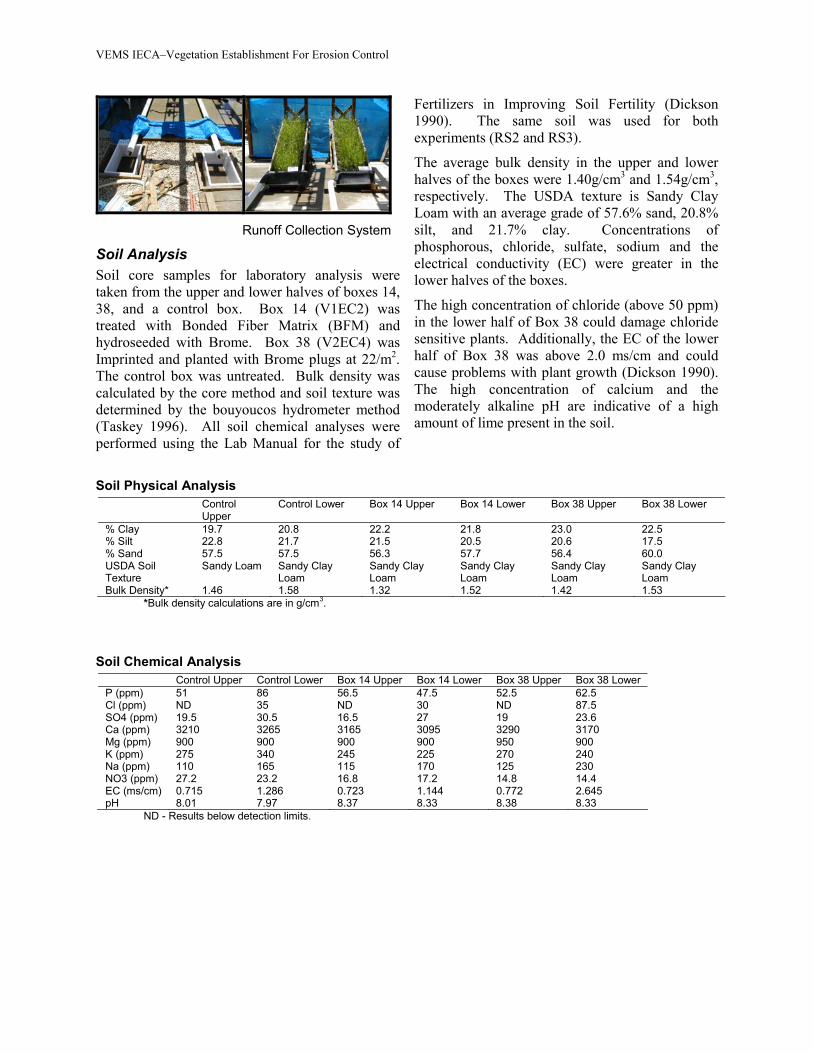
Rainfall Simulators Two Norton Ladder Type variable sweep rainfall simulators were purchased for use in this study. They were developed at the USDA Erosion Research Center at Purdue University and manufactured by Advanced Design and Machine, Clarks Hill, IN. The rainfall simulator is a pressurized nozzle type, currently utilized in erosion research. It consists of a boom oscillating side-to-side by way of a cam. A small motor drives the cam at one end of each simulator. Intensity of rainfall is determined by how many times the nozzles of the boom sweep past the box opening. The boxes are configured to regulate spray pattern and return non-effective rainfall to the water supply system. The rainfall simulators have industrial spray nozzles. They have an optimum pressure range of 5 to 300 psi, and for rainfall simulation purposes, set at 6 psi. At 41 kPa (6 psi), the drop size should be about 2.25 mm in diameter. This drop size corresponds to the average drop size of erosive storms in the Midwest. Drop size along the Pacific Coast is frequently smaller, but actual measurement data are lacking in the literature.
Rainfall Simulators
Maintenance Irrigation The 50-year average annual rainfall for the San Luis Obispo area is 620 mm (24.4 in). The 2001-2002 rainfall season (1 July to 30 June) was the 9th driest on record with 405mm (15.94 in) or 65% of average (National Weather Service Oxnard 2002). Because of insufficient and inconsistent natural precipitation during the duration of these experiments, all boxes were supplementally irrigated using micro sprayers such that the soil was never allowed to dry completely. Thus, seedlings were grown under a “best-case” scenario in order to
show the maximum potential of vegetation to control erosion.
Vegetation Measurements The three primary measures of vegetation are: density, number of individuals of a species, lifeform, or structural class per unit area; biomass, quantity of herbaceous or woody tissue produced by individuals of a species, lifeform, or structural class per unit area; and cover, a two-dimensional perpendicular projection onto the ground surface of the three-dimensional aerial vegetation above (Bonham 1989; Interagency Technical Team 1996; Kent and Coker 1992; Mueller-Dombois and Ellenberg 1974).
For these experiments, aerial plant cover was reasoned to be the most logical and readily assessed vegetation variable in that the interception of raindrops by aerial plant parts is fundamental in retarding water-driven soil erosion processes. Although plant density can provide important information about how many individuals of a given species in a seed mix germinated and established, obtaining plant counts are extremely labor intensive and time consuming, especially in a multi-species mix.
The oldest, most objective, and most repeatable measure of plant cover is by point intercept whereby a theoretically infinitely small point projected from above onto vegetation surfaces contacts individual plant structures, soil surface litter, rock, or bare soil. Each contact is termed a “hit” for each category scored. Rules must be established beforehand regarding exactly what constitutes a “hit” for each purpose-dependent investigation.
For these experiments, a modified point-transect method was used. A 600mm length of 20mm square stock (wood) was notched along the length of each angled face at 25mm intervals. Along each face 10 positions were selected using random numbers to render four different point position arrays. The ends of the stock were affixed and allowed to rotate on uprights so that the bar was held approximately 25mm above, and parallel to, the soil surface.
For sampling purposes, each soil test box was conceptually divided into an upper and a lower half to assess whether differences in plant cover exist between the two halves owing to greater gravity water flow and retention in the lower end of each

VEMS IECA–Vegetation Establishment For Erosion Control
inclined box. Positions were marked every decimeter along the rails of each box. This rendered nine possible transect positions in each half of every box. A computer spreadsheet was used to assign randomly generated numbers to each of the nine possible positions, to sort the nine positions, and to select the first five unique positions for each box. Positions selected for the upper half were used for the lower half of the same box. Again, a computer spreadsheet was used to assign randomly generated numbers to each of the 21 possible sample point positions, to sort the 21 positions, and to select the first 10 unique positions for each transect. Positions selected for the five transects in the upper half were used for lower half transects of the same box. The design rendered 100 observations per box. Thus, a total of 3200 observations over 32 boxes were made.
Plant identifications were made based largely on observer knowledge of the flora. Verifications of some preliminary identifications were made using the most recent taxonomical manual (Hickman 1993), and specimens in the Hoover Herbarium at Cal Poly. Data were then entered into a computer spreadsheet and verified for accuracy and completeness.
Water Quality Measurements Suspended plus settleable solids (Total Solids) were analyzed for all runoff samples. The procedure combined ASTM D3977-97 and EPA Method 160.2 with common water treatment flocculant (1M AlCl3). After collection of each weighed runoff sample, highly turbid samples received 10-20 ml of the flocculant. The supernatant, or clean water after flocculation, was then filtered through a Fisher Scientific fritted disc filter assembly using a pre-weighed Whatman 934 AH 90mm filter paper to collect any suspended materials. The filter paper was then oven dried for 24 hours at 800C and weighed. The remaining sediment on the bottom of each storage container was rinsed into an evaporating dish to be oven dried. The storage container with sediment was oven dried at 1150C for 24-48 hours until fully dried, and then weighed. The total water runoff weight was calculated from the original collection container minus the sediment and container weight. The total sediment weight was the filter sediment weight plus the evaporating dish sediment weight. Sediment concentration (mg/L) could then be
calculated from the total runoff and total sediment values.
Runoff Samples
Statistical Methodology Proportion cover was analyzed using logistic regression and vegetation specific analyses were analyzed with multinomial logistic regression.
Percent cover was measured in each box-half by determining cover or no cover for each of 50 points. If the presence or absence of plant matter is considered at each sampled location as the response variable of interest, then this is related to the experimental factors (Montogomery 1991). Logistic regression is a method by which one can model the presence of plant matter at any point in the box as a function of erosion control treatment, vegetation treatment and other factors.
Water runoff, sediment in the runoff and sediment concentration in the runoff were analyzed (perhaps after an appropriate normalization transformation) via analysis of variance (ANOVA).

VEMS IECA–Vegetation Establishment For Erosion Control
Elements Unique to Each Experiment RS2 Rainfall Simulation Experiment Seed and erosion control treatments were randomly assigned to each of 30 soil boxes in a replicated, crossed design where three different seed treatments were paired with five different erosion control treatments subjected to two different simulated rainfall treatments. Two additional boxes received no seed or erosion control treatment, but were subjected to the two different rainfall treatments as “controls”.
CROSSED DESIGN & NUMBER OF REPLICATES
V1 V2 V3 1 1 1 R1 EC1 1 1 1 R2
1 1 1 R1 EC2 1 1 1 R2
1 1 1 R1 EC3 1 1 1 R2
1 1 1 R1 EC4 1 1 1 R2
1 1 1 R1 EC5 1 1 1 R2
10 10 10
RS2 VEGETATION TREATMENTS
V1 Existing (No Added Seed)
V2 Existing+(600g EC Mix + wood fiber @ 9 kg / 190 L)
V3 Existing+(1000g D5 Native Mix + fiber @ 9 kg / 190 L)
RS2 EROSION CONTROL TREATMENTS
EC1 Crimped Straw @ 0.22 kg / m2
EC2 Jute (25 mm mesh)
EC3 Gypsum (11 kg / 95 L)
EC4 BFM (22 kg / 190 L)
EC5 Tackifier (0.7 kg / 95 L)
RS2 SIMULATED RAINFALL TREATMENTS
R1 Storm Event @ 45 days only
R2 Storm Event @ 45 days & @ 70 days
RS2 Hydroseeding Boxes were placed in a random design before hydroseeding. Prior to hydroseeding, straw was crimped into the six EC1 treatment boxes. Hydroseeding proceeded according to the steps listed below. The tank on the hydroseeder was completely flushed with water between applications.
Tank Load
Water
EC Material
Vegetation
# of Boxes Treated
1 190 L 11kg Fiber
V2 10
2 190 L 11 kg Fiber
V3 10
3 190 L 22 kg BFM
6
4 95 L 0.7 kg Tackifier
6
5 95 L 11 kg Gypsum
6
RS2-V2: Erosion Control (EC) Alien Species Mix
Common Name Scientific Name Rate
(seeds/m2) %PLS of mix
Annual Grasses Annual Ryegrass Lolium multiflorum 580 70.0
Cereal Barley Hordeum vulgare 580 10.0
Annual Forbs Rose clover Trifolium hirtum 96 10.0
Crimson Clover Trifolium incarnatum 96 10.0
100.0
RS2-V3: District 5 (D5) Native Species Mix
Common Name Scientific Name Rate
(seeds/m2)%PLS of mix
Perennial Grasses California Brome Bromus carinatus 580 25.0Blue Wild Rye Elymus glaucus 580 12.5Foothill Needlegrass Nassella lepida 580 5.0Purple Needlegrass Nassella pulchra 580 5.0
Annual Grasses Small Fescue Festuca microstachys 580 2.5Perennial Forbs Common Yarrow Achillea millefolium 290 2.5
Annual Forbs California Poppy Eschscholzia californica 96 5.0Arroyo Lupine Lupinus succulentus 96 5.0Pinpoint Clover Trifolium gracilentum 96 12.5
Shrubs California Sagebrush Artemisia californica 96 2.5Coyote Bush Baccharis pilularis 96 2.5California Buckwheat Eriogonum fasiculatum
9612.5
Deer Lotus Lotus scoparius 96 5.0Black Sage Salvia mellifera 96 2.5 100.0

VEMS IECA–Vegetation Establishment For Erosion Control
RS3 Rainfall Simulation Experiment Seed or 75mm (3in) plugs of California Brome (Bromus carinatus H.&A.) and erosion control treatments were randomly assigned to each of 30 soil boxes in a replicated, crossed design where three different seed treatments were paired with five different erosion control treatments subjected to one simulated rainfall treatment at 70 days from installation. Two additional boxes, or controls, received no seed or erosion control treatment, but were subjected to the same rainfall treatment.
CROSSED DESIGN & NUMBER OF REPLICATES
V1 V2 V3 EC1 2 2 2 R1 EC2 2 2 2 R1 EC3 2 2 2 R1 EC4 2 2 2 R1 EC5 2 2 2 R1
10 10 10
RS3 Hydroseeding Boxes were placed in a random design before hydroseeding. Prior to hydroseeding, the six EC4 treatment boxes were imprinted using spades to simulate a track-walk. California Brome was seeded at a rate of 580 PLS per m2.
SEED / PLUG TREATMENTS
V1 Bromus carinatus seed @ 580 PLS / m2
V2 Bromus carinatus plugs @ 22 / m2
V3 Bromus carinatus plugs @ 44 / m2
EROSION CONTROL TREATMENTS
EC1 Jute (2.5cm mesh)
EC2 BFM (22kg / 190 L)
EC3 Fiber (22kg / 190 L + Tackifier (0.7 kg / 95 L)
EC4 Imprinting
EC5 None
SIMULATED RAINFALL TREATMENTS
R1 Storm Event @ 70 days from installation
Results and Discussion RS2 Vegetation At 45 days seedling cover was poor and rendered vegetation as an insignificant factor in runoff. Cover values are presented below. No statistically significant difference was detected between Grass cover (p=.253) and Forb cover (p=.060) across the five EC treatments. However, we did find that there were differences in plant cover across the seeding treatments (p<.001). Seeding with the D5 mix increased the forb cover while seeding with the EC mix increased both Forb and Grass cover.
Class 45_D
ay_H
its
AB
SCov
er%
REL
Cov
er%
70_D
ay_H
its
AB
SCov
er%
REL
Cov
er%
Grasses 189 6.3 53.8 615 20.5 38.8Legume Forbs 735 24.5 46.3
Other Forbs 218 7.3 13.7All Forbs 162 5.4 46.2 953 31.8 60.1Shrubs 0 19 0.6 1.2All Veg 351 11.7 100.0 1587 52.9 100.0No Veg 2649 88.3 1413 47.1 3000 100.0 3000 100.0
At 70 days, both the EC mix and the D5 mix produced significantly greater cover over the existing seed bank (p<.001). Thus, given the soil used for this experiment, added seed produced more plant cover. The EC treatments were found to have an effect on cover in general (disregarding the type of vegetation cover, p<.001) with jute, straw, BFM, or tack allowing the most plant cover and gypsum allowing the least. The statistical analysis found differences among jute, straw, BFM, and tack to be statistically insignificant, but all were found to be statistically different from gypsum with regards to cover.
Shrubs were so scarce that they were eliminated from the analysis (only 19 shrubs occurred in 3000 data points) because no relationships between treatments and shrub cover could be estimated with any reliability. With the adjusted analysis, we found that there was a statistically significant EC treatment effect on cover for Legumes and Grasses, but not for Forbs. Jute and BFM seemed to increase Legume cover the most and gypsum the least. Jute, tackifier or straw increased Grass cover the most and BFM the least. Jute seemed to be a
VEMS IECA–Vegetation Establishment For Erosion Control
middle ground in increasing cover for the two vegetation types, being among the best treatments for both plant types. Gypsum consistently rendered poor cover across vegetation types.
The seeding treatment also affected vegetation cover type. Seeding with D5 natives increased Legumes (p<.001) while seeding with the EC mix increased both Legumes and Grasses (p<.001). There was no statistically significant effect of seeding method on Forbs.
RS2 Water Quality At 70 days, the District-5 (V3) seed mixture resulted in statistically lower total runoff than the existing seed bank (V1). The existing seed bank yielded the highest total sediment load. No seeding treatment had an effect on sediment concentration. Erosion control treatment analysis showed jute and BFM to be the best for erosion control. At the .05 level, gypsum has a higher concentration in the runoff than jute or BFM. (At the .10 level, Jute and BFM are better than tackifier as well.)
With respect to sediment load, V3 is significantly better than V2 or V1. The best treatment is BFM followed by Jute, Straw, gypsum and Tackifier. V3 yielded significantly lower sediment values than did V2 or V1. Sediment levels obtained from BFM, Jute, or Straw were not statistically different from each other. All three were significantly lower than gypsum or Tackifier. With respect to sediment concentration, BFM, Straw, or Tackifier were not significantly different. Gypsum was significantly different than the above three treatments.
RS3 Vegetation After 45 days, no significant differences existed in percent cover among vegetation treatments. However, EC treatment did have a statistically significant effect. Both jute netting and the wood fiber/tackifier mix allowed significantly more overall cover than BFM or imprinting (at �=.05).
Different vegetation and EC treatments also had an effect on composition of plants in the boxes. For Legumes, vegetation treatment had a significant effect (p=.004) with Seeded Brome producing a higher Legume cover than Brome Plugs @ 22/ m2. Most of these Legumes in the seeded boxes consisted of weedy annuals such as Medicago polymorpha, Melilotus indica, and Vicia sativa. This increase was perhaps due to the open disturbed soil without shade or competition from
already established Brome Plugs. EC treatment also had a statistically significant Legume cover rate (p<.001) with jute netting resulting in a higher Legume cover rate than no treatment.
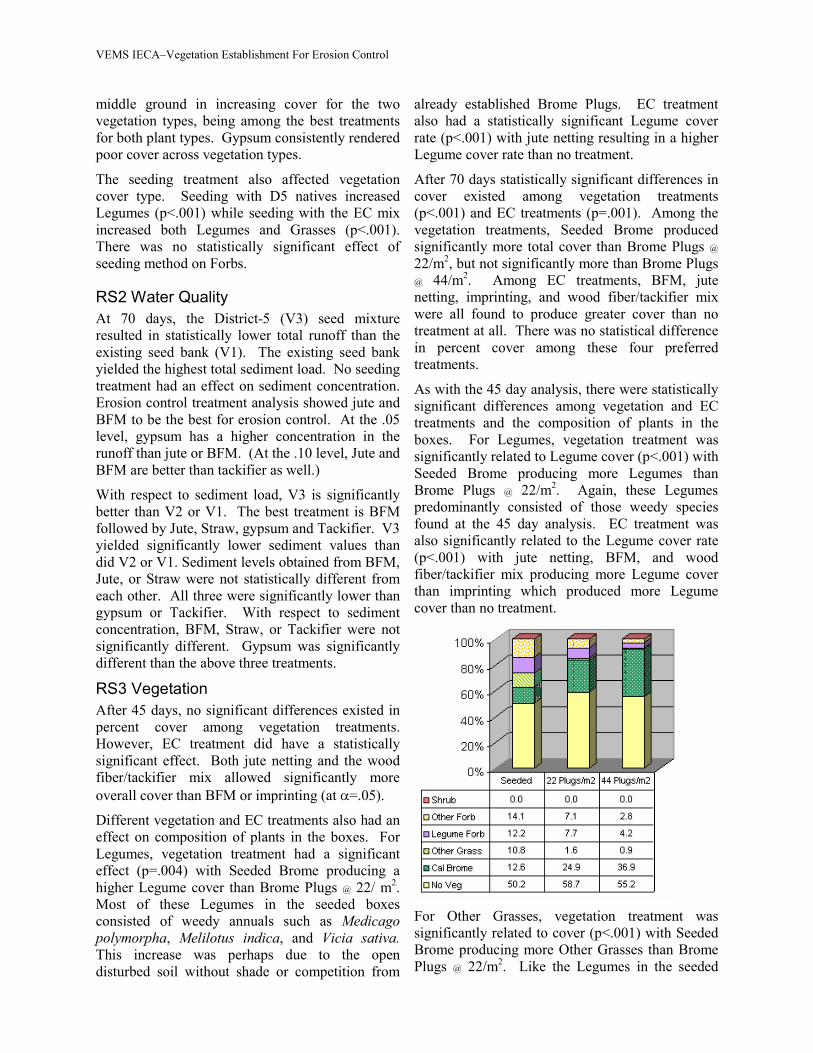
After 70 days statistically significant differences in cover existed among vegetation treatments (p<.001) and EC treatments (p=.001). Among the vegetation treatments, Seeded Brome produced significantly more total cover than Brome Plugs @ 22/m2, but not significantly more than Brome Plugs @ 44/m2. Among EC treatments, BFM, jute netting, imprinting, and wood fiber/tackifier mix were all found to produce greater cover than no treatment at all. There was no statistical difference in percent cover among these four preferred treatments.
As with the 45 day analysis, there were statistically significant differences among vegetation and EC treatments and the composition of plants in the boxes. For Legumes, vegetation treatment was significantly related to Legume cover (p<.001) with Seeded Brome producing more Legumes than Brome Plugs @ 22/m2. Again, these Legumes predominantly consisted of those weedy species found at the 45 day analysis. EC treatment was also significantly related to the Legume cover rate (p<.001) with jute netting, BFM, and wood fiber/tackifier mix producing more Legume cover than imprinting which produced more Legume cover than no treatment.
For Other Grasses, vegetation treatment was significantly related to cover (p<.001) with Seeded Brome producing more Other Grasses than Brome Plugs @ 22/m2. Like the Legumes in the seeded
VEMS IECA–Vegetation Establishment For Erosion Control
boxes, the majority of these species were common weedy ruderal grasses such as Lolium multiflorum, Avena fatua, Bromus hordeaceus, and B. diandrus. No treatment and imprinting had significantly lower Other Grass cover than jute netting. BFM and wood fiber/tackifier had a lower Other Grass cover than did jute netting. The no treatment plot had lower Other Grass cover than all other treatments.
For Other Forbs, vegetation treatment was significantly related to cover (p<.001) with Seeded Brome resulting in a higher proportion cover than either plugging treatment. The majority of these species found in the 45 day analysis were weedy annuals. EC treatment was significantly related to forb cover (p<.001) with wood fiber/tackifier mix and jute netting producing greater forb cover than no treatment and imprinting. Like the previous seeded boxes, most of these Forbs were weedy annuals such as Polygonum arenastrum, Chenopodium album, Picris echioides, Silybum marianum, and Malva parviflora.
For California Brome, vegetation treatment was significantly related to cover (p<.001) with Brome Plugs @ 22/m2 yielding greater California Brome cover than Brome Plugs @ 44/m2 which yielded greater California Brome cover than seeding with California Brome.
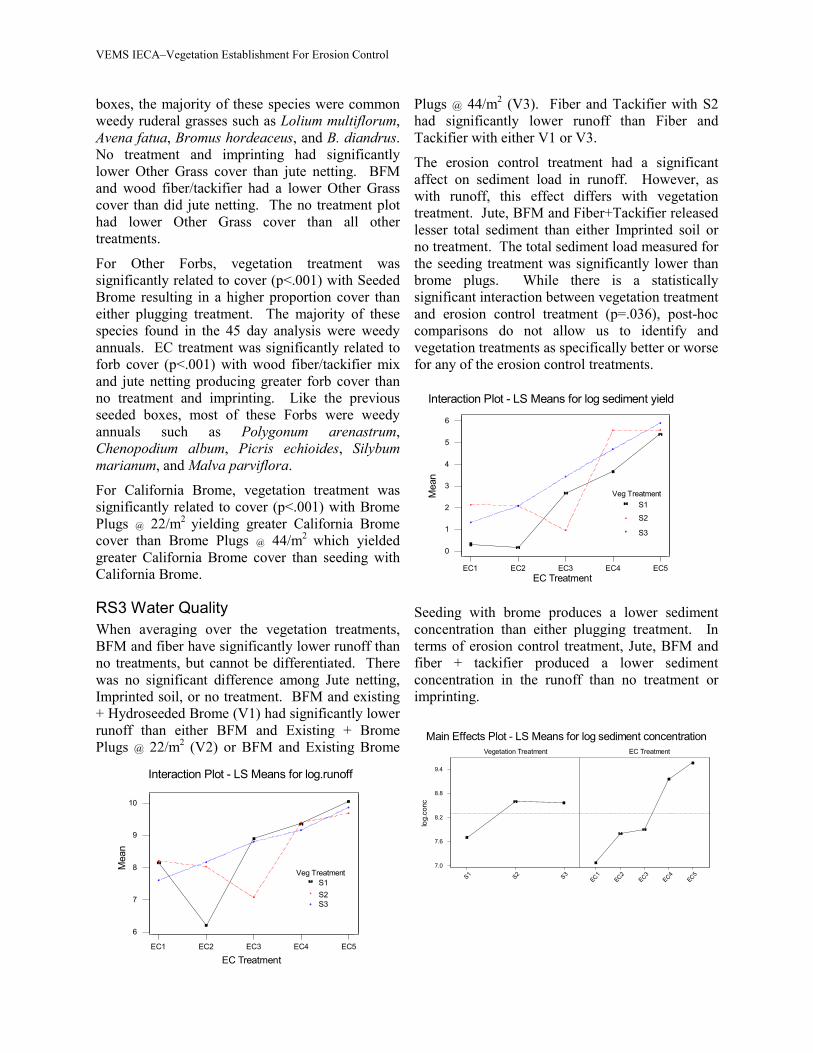
RS3 Water Quality When averaging over the vegetation treatments, BFM and fiber have significantly lower runoff than no treatments, but cannot be differentiated. There was no significant difference among Jute netting, Imprinted soil, or no treatment. BFM and existing + Hydroseeded Brome (V1) had significantly lower runoff than either BFM and Existing + Brome Plugs @ 22/m2 (V2) or BFM and Existing Brome
Plugs @ 44/m2 (V3). Fiber and Tackifier with S2 had significantly lower runoff than Fiber and Tackifier with either V1 or V3.
The erosion control treatment had a significant affect on sediment load in runoff. However, as with runoff, this effect differs with vegetation treatment. Jute, BFM and Fiber+Tackifier released lesser total sediment than either Imprinted soil or no treatment. The total sediment load measured for the seeding treatment was significantly lower than brome plugs. While there is a statistically significant interaction between vegetation treatment and erosion control treatment (p=.036), post-hoc comparisons do not allow us to identify and vegetation treatments as specifically better or worse for any of the erosion control treatments.
Seeding with brome produces a lower sediment concentration than either plugging treatment. In terms of erosion control treatment, Jute, BFM and fiber + tackifier produced a lower sediment concentration in the runoff than no treatment or imprinting.
EC5EC4EC3EC2EC1
6
5
4
3
2
1
0
EC Treatment
Mea
n
Interaction Plot - LS Means for log sediment yield
Veg TreatmentS1
S2
S3
Vegetation Treatment EC Treatment
S1 S2 S3EC1
EC2EC3
EC4EC5
7.0
7.6
8.2
8.8
9.4
log.
conc
Main Effects Plot - LS Means for log sediment concentration
S1 S2 S3
EC1 EC2 EC3 EC4 EC5
6
7
8
9
10
EC Treatment
Veg Treatment
Mea
n
Interaction Plot - LS Means for log.runoff

VEMS IECA–Vegetation Establishment For Erosion Control
RS3 Vegetation & Water Quality Interactions Summary At 70 days, significant interactions existed among vegetation and EC treatments regarding runoff and sediment yield. The results showed an EC treatment effect (p<.001) that differed by vegetation treatment (p=.040). While no significant difference existed across the three vegetation treatments for jute netting, imprinting, and no treatment, Seeded Brome had significantly lower runoff than either plug treatments for BFM, and Brome Plugs @ 22/m2 had a significantly lower runoff than Seeded Brome and Brome Plugs @ 44/m2 for the wood fiber/tackifier mix.
There are notable interactions observed between vegetative establishment and erosion control materials and. Therefore it is important to determine the final goal for each project site before determining which erosion control products and vegetation are appropriate for the site.
It was found that native hydroseeding and plug planting significantly increased cover over the existing seed bank in the soil. Gypsum as an EC treatment produced the least amount of vegetation. Jute and Wood Fiber treatments consistently produced the highest amount of vegetative cover. Therefore it is important to assess the importance of vegetation establishment when selecting EC treatments.
EC treatment was found to have a statistically significant effect on sediment yield that varied with vegetation treatment. At α =0.10, Seeded Brome had a lower sediment yield than Brome Plugs @ 22/m2 for jute netting, a lower sediment yield than both plug treatments for BFM, and a lower sediment yield than Brome Plugs @ 22/m2 with imprinting. Seeded Brome did not consistently have lower sediment levels than the plugged treatments. For the tack and fiber mix, Brome Plugs @ 22/m2 had a lower sediment yield than Seeded Brome as well as Brome Plugs @ 44/m2.
It was found that Jute and BFM and Wood Fiber had the best water quality. The existing seed bank had the highest total sediment and the D-5 native seed mix and BFM had the lowest sediment load. Hydroseeding with native seeds decreased sediment over plug planting of native plants.
The vegetation treatment had a significant effect on sediment concentration (p=.002). There was no significant interaction between the EC treatment and the vegetation treatment. Seeded Brome had a significantly lower sediment concentration than either plug treatment.

VEMS IECA–Vegetation Establishment For Erosion Control
References Agresti, A. 1996. An Introduction to Categorical
Data Analysis. New York: Wiley & Sons.
Bonham, C.D. 1989. Measurements for Terrestrial Vegetation. New York: Wiley & Sons.
Dickson, Bruce. 1990. A Laboratory Manual for the study of Fertilizers In Improving Soil Fertility. Soil Science Department, California Polytechnic State University, San Luis Obispo.
Fortin, M.-J., P. Drapeau, and P. Legendre. 1989. “Spatial autocorrelation and sampling design in plant ecology”. Vegetatio 83: 209-222
Hickman, J.C. (ed.). 1993. The Jepson Manual: Higher Plants of California. Berkeley: University of California Press.
Interagency Technical Team. 1996. “Sampling Vegetation Attributes”. Bureau of Land Management National Applied Resource Sciences Center. USDI-BLM/RS/ST-96/002+1730
Montgomery, D.C. 1991. Design And Analysis Of Experiments. ed. 3. New York: Wiley & Sons.
Mueller-Dombois, D., and H. Ellenberg. 1974. Aims and Methods of Vegetation Ecology. New York: Wiley & Sons.
Pearce, R. A., G.W. Fraisier, M.J. Trlica, W.C. Leininger, J.S. Stednick, and J.L. Smith. 1998. “Sediment Filtration in a Montane Riparian Zone Under Simulated Rainfall”. Journal of Range Management 51: 309-314.
Taskey, R.D.. 1996. Soil Physics Laboratory Manual. Soil Science Department, California Polytechnic State University, San Luis Obispo.
National Weather Service Oxnard. 2002. “A preliminary monthly precipitation summary and a seasonal precipitation summary for various stations in Southern California”. http://www.wrh.noaa.gov/cgi-bin/Oxnard/afd?LAXPNSLOX