Vegetables and Melons Outlook - Cornell...
43
United States Department of Agriculture www.ers.usda.gov Electronic Outlook Report from the Economic Research Service Vegetables and Melons Outlook Gary Lucier and Alberto Jerardo Pulse Production Down, Prices Up In the 2006/07 crop year, production of all dry beans is expected to decline 11 percent. Consequently, the season-average dry bean price is projected to rise to a range of $20 to $22 per hundredweight (cwt)—up from $18.50/cwt last season but below the 2004/05 season average of $25.70/cwt. With production lower than expected due to poor yields, market prices for dry peas and lentils have strengthened. These higher prices may affect export demand in the coming year. In fact, over the first 4 months of the 2006/07 marketing year dry pea and lentil exports were down 4 percent from a year ago. Leading destinations included India, Spain, and Cuba. Despite higher prices in 2006/07, acreage for dry peas and lentils may be under downward pressure in 2007 due to strong returns for crops such as spring wheat. Fresh-market tomato shipping-point prices averaged 51 percent above a year earlier during the summer quarter and remained strong until tomato supplies began to build throughout October. Although tomato prices averaged 52.3 cents per pound in October, they declined to a more seasonal 31.1 cents in November. The November shipping-point price was 15 percent below a year earlier and the lowest since July. Retail prices for frozen vegetables are expected to have risen about 1 percent during 2006, with all of the gain coming during the first quarter. However, since the January-March quarter, retail prices for frozen vegetables have fallen back to near the averages of a year earlier despite higher processing, warehousing, and transportation costs. Retail prices for canned and frozen vegetables have each increased about 2 percent annually since 1990. Average potato prices during 2006 have been running 8 to 9 percent higher than a year earlier. Fresh-market potato prices are up 10 percent while processing prices are up 6 percent. These higher prices, if sustained through the marketing year, will push average per-acre farm potato sales to a record $2,700 (or more) for the 2006 crop, up 8 percent from a year earlier. The production value of horticulture crops—fruits, tree nuts, vegetables, melons, greenhouse, and nursery—is forecast to grow at an average 2.5-percent pace from 2007 to 2016. From $50 billion in 2006, the value of these crops is projected to reach about $64 billion in 2016, of which $20 billion will consist of vegetables and melons. U.S. eggplant consumption has trended higher over the past 5 decades, with per capita use estimated to average 0.8 pound during 2000-05 compared with 0.5 pound in the 1990s. VGS-318 Dec. 14, 2006 Contents Industry Overview Fresh-Market Vegetables Processing Vegetables Potatoes Longrun Outlook Dry Edible Beans Dry Peas & Lentils Commodity Highlight: Eggplant Contacts & Links Appendix Tables Web Sites Veg. & Melons Potatoes Tomatoes Dry Beans Market News NASS Statistics FAS Horticulture Organics Transportation -------------- The next release is Feb. 22, 2007 -------------- Approved by the World Agricultural Outlook Board
Transcript of Vegetables and Melons Outlook - Cornell...

United StatesDepartmentof Agriculture
www.ers.usda.gov
Electronic Outlook Report from the Economic Research Service
Vegetables and Melons Outlook Gary Lucier and Alberto Jerardo Pulse Production Down, Prices Up
In the 2006/07 crop year, production of all dry beans is expected to decline 11 percent. Consequently, the season-average dry bean price is projected to rise to a range of $20 to $22 per hundredweight (cwt)—up from $18.50/cwt last season but below the 2004/05 season average of $25.70/cwt. With production lower than expected due to poor yields, market prices for dry peas and lentils have strengthened. These higher prices may affect export demand in the coming year. In fact, over the first 4 months of the 2006/07 marketing year dry pea and lentil exports were down 4 percent from a year ago. Leading destinations included India, Spain, and Cuba. Despite higher prices in 2006/07, acreage for dry peas and lentils may be under downward pressure in 2007 due to strong returns for crops such as spring wheat. Fresh-market tomato shipping-point prices averaged 51 percent above a year earlier during the summer quarter and remained strong until tomato supplies began to build throughout October. Although tomato prices averaged 52.3 cents per pound in October, they declined to a more seasonal 31.1 cents in November. The November shipping-point price was 15 percent below a year earlier and the lowest since July. Retail prices for frozen vegetables are expected to have risen about 1 percent during 2006, with all of the gain coming during the first quarter. However, since the January-March quarter, retail prices for frozen vegetables have fallen back to near the averages of a year earlier despite higher processing, warehousing, and transportation costs. Retail prices for canned and frozen vegetables have each increased about 2 percent annually since 1990. Average potato prices during 2006 have been running 8 to 9 percent higher than a year earlier. Fresh-market potato prices are up 10 percent while processing prices are up 6 percent. These higher prices, if sustained through the marketing year, will push average per-acre farm potato sales to a record $2,700 (or more) for the 2006 crop, up 8 percent from a year earlier. The production value of horticulture crops—fruits, tree nuts, vegetables, melons, greenhouse, and nursery—is forecast to grow at an average 2.5-percent pace from 2007 to 2016. From $50 billion in 2006, the value of these crops is projected to reach about $64 billion in 2016, of which $20 billion will consist of vegetables and melons. U.S. eggplant consumption has trended higher over the past 5 decades, with per capita use estimated to average 0.8 pound during 2000-05 compared with 0.5 pound in the 1990s.
VGS-318 Dec. 14, 2006
Contents Industry Overview Fresh-Market Vegetables Processing Vegetables Potatoes Longrun Outlook Dry Edible Beans Dry Peas & Lentils Commodity Highlight: Eggplant Contacts & Links Appendix Tables Web Sites Veg. & Melons Potatoes Tomatoes Dry Beans Market News NASS Statistics FAS Horticulture Organics Transportation -------------- The next release is Feb. 22, 2007 -------------- Approved by the World Agricultural Outlook Board

Industry Overview
2 Vegetables and Melons Outlook/VGS-318/December 14, 2006
Economic Research Service, USDA
Fresh vegetables: During the first 10 months of 2006, the value of fresh-market vegetable imports (excluding potatoes, melons, and mushrooms) jumped 16 percent to $3.1 billion. A portion of this increase was spurred by higher prices resulting from the impact of extreme summer heat. This winter, with an El Nino weather pattern in place, vegetable production could be slowed by cool, wet weather in the desert southwest, affecting crops such as lettuce, broccoli, and carrots. Melons: The value of fresh-market melon imports increased 14 percent during the January-October period to $296 million due largely to an 11 percent increase in import volume. Most of this gain in volume came from a 25-percent surge in watermelon imports, which have already exceeded their 2005 record high. The majority of watermelon imports entered from Mexico during April and May. Reflecting year-round demand and new seedless varieties, imports are expected to account for nearly one-fifth of domestic watermelon consumption in 2006—double that of a decade ago. Processing vegetables: During the first 10 months of 2006, the value of processed vegetable imports (canned, frozen, dehydrated) rose 10 percent to $1.4 billion. Canned vegetable imports increased 8 percent to $706 million, while frozen imports (excluding potatoes) rose 7 percent to $428 million. Dehydrated imports rose 19 percent to $275 million led by garlic (up 37 percent)—most coming from China. Potatoes: With strong potato prices over the past year providing an incentive for importers, U.S. potato and potato product import value increased 9 percent during January-October. Fresh (including seed) imports jumped 38 percent while frozen imports rose 10 percent to $474 million. About 85 percent of all potato and potato product imports enter the U.S. market from Canada. Sweet potatoes: Imports only account for about 1 percent of U.S. domestic disappearance of sweet potatoes. During the first 10 months of 2006, the value of fresh and frozen imports increased 23 percent to about $5 million. Most fresh imports arrive from the Dominican Republic and are marketed in Puerto Rico. Longrun outlook: The average annual growth rate for vegetable and melon production value is forecast at 2.5 percent through 2016, with the value of vegetables expected to reach $20 million by 2016. About three-fourths of the total value of U.S. vegetable production is expected to come from fresh-market crops. Dry edible beans: With a smaller crop in 2006 and higher prices, imports of dry edible beans are expected to increase over the next several months. During January-October 2006, the value of dry bean imports was unchanged at $68 million. Canada, Mexico, and China remain the top 3 foreign sources for dry beans. Dry peas and lentils: With production lower than expected due to poor yields, market prices for dry peas and lentils have strengthened since mid-summer. These higher prices have attracted volume from other countries. During January-October, the value of dry pea and lentil imports surged 53 percent above a year earlier to $37 million. The majority of the increase was for lentils and split peas. Eggplant: Domestic disappearance of eggplant averaged 238 million pounds (0.81 pounds per person) during 2003-05—about two-thirds higher than a decade earlier. California, Florida, and New Jersey are the leading domestic producers of eggplant. However, about 46 percent of the eggplant consumed in the United States is imported, primarily from Mexico, to help satisfy year-round demand.

3 Vegetables and Melons Outlook/VGS-318/December 14, 2006
Economic Research Service, USDA
Table 1--U.S. vegetable industry at a glance, 2004-07 Item Unit 2004 2005 2006 1/ 2007 1/
Area harvested 1,000 ac. 6,581 7,149 7,281 6,899 Vegetables: Fresh & melons 1,000 ac. 1,940 1,936 1,948 1,958 Processing 1,000 ac. 1,297 1,286 1,273 1,265 Potatoes 1,000 ac. 1,167 1,087 1,119 1,120 Dry beans 1,000 ac. 1,219 1,534 1,530 1,295 Other 2/ 1,000 ac. 957 1,321 1,380 1,262
Production Mil. cw t 1,355 1,300 1,301 1,333 Vegetables: Fresh & melons Mil. cw t 485 473 471 480 Processing Mil. cw t 356 317 320 350 Potatoes Mil. cw t 456 424 435 440 Dry beans Mil. cw t 18 27 24 21 Other 2/ Mil. cw t 41 44 42 42Crop value $ mil. 15,533 15,862 16,866 16,795 Vegetables: Fresh & melons $ mil. 9,701 9,819 10,000 10,150 Processing $ mil. 1,473 1,323 1,525 1,600 Potatoes $ mil. 2,575 2,903 3,325 3,200 Dry beans $ mil. 453 526 501 495 Mushrooms $ mil. 919 909 881 890 Other 2/ $ mil. 412 434 460 460Unit value 3/ $/cw t 11.46 12.20 12.97 12.60 Vegetables: Fresh & melons $/cw t 20.02 20.77 21.23 21.13 Processing $/cw t 4.14 4.17 4.77 4.57 Potatoes $/cw t 5.66 7.06 7.65 7.27 Dry beans $/cw t 25.70 18.50 20.99 24.00 Other 2/ $/cw t 10.15 9.91 10.97 11.04Trade Imports $ mil. 6,212 6,603 7,408 7,775 Vegetables: Fresh & melons $ mil. 3,458 3,668 4,275 4,500 Processing 4/ $ mil. 1,448 1,587 1,730 1,800 Potatoes & products $ mil. 791 787 855 890 Dry beans $ mil. 65 82 80 90 Other 5/ $ mil. 449 479 485 495 Exports $ mil. 3,479 3,855 4,170 4,260 Vegetables: Fresh & melons $ mil. 1,364 1,515 1,580 1,625 Processing 4/ $ mil. 794 828 870 885 Potatoes & products $ mil. 745 841 950 975 Dry beans $ mil. 145 160 210 195 Other 5/ $ mil. 432 511 560 580Per capita use Pounds 448 440 443 443 Vegetables: Fresh & melons Pounds 175 174 175 175 Processing Pounds 123 125 126 124 Potatoes & products Pounds 135 126 126 128 Dry beans Pounds 6 6 7 6 Other 2/ Pounds 9 9 9 9 1/ ERS forecasts. 2/ Includes sw eet potatoes, dry peas, lentils, and mushrooms (except for crop value). 3/ Ratio of total value to total production. 4/ Includes canned, frozen, and dried. Excludes potatoes, pulses, and mushrooms. 5/ Other includes mushrooms, dry peas, lentils, sw eet potatoes, and vegetable seed. All trade data are on a calendar-year basis.Sources: Derived by ERS from data of USDA, National Agricultural Statistics Service, Crop Production, Acreage, Agricultural Prices, Crop Values, Mushrooms, and Potatoes, and from U.S. trade data of the U.S. Dept. of Commerce, U.S. Census Bureau.

4 Vegetables and Melons Outlook/VGS-318/December 14, 2006
Economic Research Service, USDA
Figure 1 F.o.b. shipping-point prices for fresh-market vegetables
Source: USDA, National Agricultural Statistics Service, Agricultural Prices.
0
10
20
30
40
50
60
Jan. Mar. May July Sep. Nov.
BroccoliCents per lb
2006 2004
2005
10
15
20
25
30
Jan. Mar. May July Sep. Nov.
CarrotsCents per lb
2005
2004
2006
0
5
10
15
20
25
30
Jan. Mar. May July Sep. Nov.
CeleryCents per lb
2005
2004
2006
010203040506070
Jan. Mar. May July Sep. Nov.
CucumbersCents per lb
2005
2004
2006
05
10152025303540
Jan. Mar. May July Sep. Nov.
Head lettuceCents per lb
2005
2006
2004
0
5
10
15
20
25
Jan. Mar. May July Sep. Nov.
OnionsCents per lb
2005
2004
2006
0
20
40
60
80
100
Jan. Mar. May July Sep. Nov.
Snap beansCents per lb
2005
2004
2006
0
25
50
75
100
125
Jan. Mar. May July Sep. Nov.
TomatoesCents per lb
2005
2004
2006

Fresh-Market Vegetables
5 Vegetables and Melons Outlook/VGS-318/December 14, 2006
Economic Research Service, USDA
Favorable fall weather has boosted crop yields and fresh-market vegetable shipments from both California and Florida since mid-October. As a result, shipping-point prices for fresh-market vegetables have generally weakened following the late summer-early fall highs caused largely by the yield-depressing impacts of extreme summer heat. November’s fresh-market shipments increased from a year earlier, with volume rising for items such as iceberg lettuce, snap beans, cucumbers, and bell peppers. Although there have been reports of weak demand for some leafy crops this fall, few seem to be suffering major impacts from last summer’s widely publicized outbreak of E. coli on fresh spinach. In fact, spinach demand may be rebounding, with November shipments up 11 percent from a year earlier to 10.3 million pounds after being reduced by at least half during the previous 2 months. Free on board (f.o.b.) shipping point prices for fresh market vegetables and melons averaged 19 percent above a year earlier during the summer quarter (July-September). Prices were higher for tomatoes and most cool-season (heat intolerant) crops such as iceberg lettuce, broccoli, and celery. Although light desert frost slowed harvest in late November and early December and caused temporary spikes in some farm prices, most prices have eased since mid-October. Thus, fall season (October-December) fresh vegetable prices are expected to average about a tenth below a year earlier. This would be the third consecutive fall-quarter price decline Table 2--Selected fresh-market vegetable shipments 1/
Annual October November Change previous: 3/ Item 2005 2006 2005 2/ 2006 Month Year
--1,000 cwt -- PercentAsparagus 3,680 249 267 248 0 -7Snap beans 2,596 178 290 400 125 38Broccoli 9,803 739 956 886 20 -7Cabbage 1,364 775 1,310 1,127 45 -14Cantaloup 28,587 1,772 1,179 1,287 -27 9Carrots 11,085 562 906 740 32 -18Cauliflower 4,293 293 400 346 18 -14Celery 17,848 1,078 2,197 2,028 88 -8Chinese cabbage 1,197 71 119 102 44 -14Sweet corn 9,972 336 244 442 32 81Cucumbers 14,100 865 1,260 1,652 91 31Greens 2,437 137 310 288 110 -7Head lettuce 38,255 2,828 3,571 3,670 30 3Romaine 14,510 1,110 1,501 1,512 36 1Onions, dry bulb 50,296 2,031 4,289 4,541 124 6Onions, green 3,540 163 389 391 140 1Peppers, bell 16,577 619 1,354 1,623 162 20Peppers, chile 4,009 132 397 370 180 -7Spinach 1,156 41 113 120 193 6Squash 7,019 428 835 876 105 5Tomato, round 28,920 2,032 2,685 2,840 40 6Tomato, roma 11,098 524 1,093 858 64 -22Tomato, ghouse 4/ 8,468 659 842 873 32 4Tomato, cherry 5/ 4,227 269 433 427 59 -1Watermelon 35,110 557 726 897 61 24Selected total 326,467 18,199 27,399 28,296 55 3 1/ All monthly data are preliminary. They include domestic and imported product. 2/ For comparison,preliminary data are show n for November 2005. Final monthly data can be found on the Market New sData Portal at http://marketnew s.usda.gov/portal/fv. 3/ Change in November 2006. 4/ Includes alltypes of tomatoes produced under cover. 5/ Includes grape tomatoes.
Source: USDA, Agricultural Marketing Service, Fresh Fruit and Vegetable Shipments.

6 Vegetables and Melons Outlook/VGS-318/December 14, 2006
Economic Research Service, USDA
Table 3—U.S. quarterly f.o.b. shipping-point prices, 2005-07 2005 2006 2007 Change
Commodity Fourth First Second Third Fourth* First* Second* 4th Q 1/Cents/pound Percent
Asparagus 175.00 202.50 136.73 -- -- 175.00 130.00 --Broccoli 21.77 27.97 37.50 40.83 29.50 33.00 30.00 35.5Cantaloup 13.27 -- 23.80 14.93 21.50 -- 20.00 62.0Carrots 22.17 21.47 21.23 21.27 20.25 21.50 21.50 -8.7Cauliflower 29.70 31.23 33.13 33.17 34.00 36.00 32.50 14.5Celery 12.00 11.78 15.70 23.97 22.00 17.00 14.50 83.3Sweet corn 28.00 35.07 22.13 21.97 21.00 26.00 19.00 -25.0Cucumbers 40.47 32.30 25.10 22.80 30.00 26.00 22.00 -25.9Lettuce, head 12.94 13.90 22.60 16.40 16.00 17.00 17.75 23.6Onions, dry bulb 12.47 10.76 13.44 16.43 12.25 12.00 19.00 -1.8Snap beans 58.10 50.23 37.07 72.60 62.00 58.50 42.00 6.7Tomatoes, field 36.90 56.10 36.67 50.43 38.00 38.50 37.00 3.0
All vegetables 2/ 897 892 1006 969 880 910 900 -1.9
-- = not available. * = ERS forecast. 1/ Change in 4th-quarter 2006 over 4th-quarter 2005. 2/ Price index w ith base period of 1910-14 (the period w hen the index equaled 100).
Source: Derived by ERS from USDA, National Agricultural Statistics Service, Agricultural Prices. since the record-high of 2003 caused largely by abnormally high fall temperatures in California. Fall tomato growers are enjoying favorable weather and a “normal” season for the first time in 3 years. With El Nino bringing a relatively quiet Atlantic hurricane season, crops progressed in Florida without major interruption. After the low supplies from heat-damaged summer crops gave way to fall crops, fresh tomato f.o.b. shipping-point prices began to decline. Tomato shipping-point prices averaged 51 percent above a year earlier during the summer quarter and remained strong until fall tomato supplies began to build throughout October. Although tomato prices averaged 52.3 cents per pound in October, they declined to a more seasonal 31.1 cents in November, according to the National Agricultural Statistics Service. The November price was 15 percent below a year earlier and the lowest since July. In early December, the tomato market remained well supplied, which has likely helped Florida shippers regain the market share lost over the past 2 years. Winter Outlook This winter (largely January-March), fresh-market vegetable and melon area for harvest is expected to remain near that of a year earlier (USDA-NASS estimates will be released on January 8). Barring an early winter freeze in either Florida or California, favorable yields should provide adequate supplies this winter. Last winter, with the exception of some damage in Florida from a light mid-February freeze, yields and supplies remained strong. Thus, as usual, the outlook for the winter season is largely dependant on the weather in southern Florida, various areas in Mexico (particularly Sinaloa), and the desert growing regions of California and Arizona. According to the Climate Prediction Center of the National Oceanic and Atmospheric Administration (NOAA), a moderate El-Nino event is currently underway. El Nino episodes occur about every 4 to 5 years and can last more than a year. They typically develop from March to June and reach peak intensity during the winter and early spring. Thus, wetter-than-average conditions are more likely in the winter vegetable regions of California, Arizona, Texas, Florida and Mexico.

7 Vegetables and Melons Outlook/VGS-318/December 14, 2006
Economic Research Service, USDA
This increased rainfall is expected to be accompanied by average temperatures in most of these areas. The NOAA outlook also indicates a milder-than-average winter for much of the major population areas in the northern half of the Nation. This helps to support winter demand since consumers tend to be less active during cold snowy periods. The winter season forecast can be found on the NOAA web site. Although the usual pressure from imports will be felt this winter due largely to improved fall weather and yields in West Mexico, the weaker dollar, lower U.S. prices, and high transportation costs may serve as a partial drag on imports. Given average domestic and import supplies and a good employment outlook, winter season shipping-point prices for commercial fresh-market vegetables are expected to average near those of a year earlier. Higher shipping-point prices are expected for lettuce, broccoli, and cauliflower, while prices may average lower for tomatoes, cucumbers, onions, and sweet corn. Fresh Imports Continue To Move Higher During the first 10 months of 2006 (January to October), the volume of fresh-market vegetable imports (excluding potatoes, mushrooms, melons, and pulses) was up 7 percent from a year earlier. The top five sources of fresh vegetable imports were Mexico (72 percent of total volume), Canada (15 percent), Costa Rica (3 percent), China (2 percent), and Peru (2 percent). Tomatoes remain the leading fresh import item by volume, followed by cucumbers, onions, bell peppers, chile peppers, and squash. With prices higher this year, the value of fresh vegetable imports increased 16 percent through October to $3.1 billion, while fresh melon import value rose 14 percent to $296 million. Over the final quarter of 2006, with weaker prices for several items providing a disincentive for importers, import value will likely decline. However, given the continued expansion in year-round vegetable demand, calendar-year fresh vegetable and melon imports are expected to rise again in 2007. Table 4--Selected fresh-market vegetable trade volume, 2004-06 1/
2005 January - October Change Item Annual 2004 2005 2006 2005-06
--1,000 cwt-- PercentExports, fresh: Onions, dry bulb 6,678 4,823 5,390 4,808 -11 Lettuce, head 4,501 3,939 3,803 3,084 -19 Lettuce, other 4,863 3,880 3,987 3,854 -3 Broccoli 3,147 2,754 2,594 2,627 1 Tomatoes 3,265 3,184 2,766 2,584 -7 Other 16,851 14,498 14,156 13,551 -4 Total 39,306 33,078 32,696 30,508 -7Imports, fresh: Tomatoes, all 20,981 17,487 17,501 19,127 9 Cucumbers 9,551 7,149 7,596 7,484 -1 Onions, dry bulb 6,592 5,570 5,142 4,981 -3 Peppers, sweet 6,526 4,650 5,170 6,036 17 Peppers, chile 4,254 3,461 3,424 4,291 25 Squash 2/ 5,244 3,630 3,838 3,897 2 Other 23,149 17,013 18,694 20,058 7 Total 76,297 58,960 61,364 65,875 7
1/ Excludes melons, potatoes, mushrooms, dry pulses, and sw eet potatoes. 2/ Excludes chayote. Source: Prepared by ERS using data from U.S. Department of Commerce, U.S. Census Bureau.

Processing Vegetables
8 Vegetables and Melons Outlook/VGS-318/December 14, 2006
Economic Research Service, USDA
Thanks to favorable fall weather, California tomato processors were able to process a large volume of product in October and run into early November. Periods of extreme heat delayed blooming and damaged tomato plants this past summer, requiring some replanting. As a result, 15 percent of the crop was harvested and processed after September 30, a time when tomatoes are at increased risk of weather-related crop damage in California, largely from heavy rain. According to the California Processing Tomato Advisory Board, normally 2 to 5 percent of the crop is harvested after September, with November harvest very rare (this year, 2 percent of the crop was harvested in November). Among the 16 counties producing tomatoes for processing in California, Fresno (40 percent), Yolo (12 percent), and San Joaquin (11 percent) counties accounted for two-thirds of the 2006 crop. With the late season push by California processors, the U.S. processing tomato crop likely increased 4 percent to 10.6 million short tons in 2006. Despite the increase, supplies of most tomato products will remain below average due to low stocks entering the 2006/07 marketing year. As a result, wholesale prices for tomato products are averaging well above year earlier levels. For example, the wholesale price for a 300-gallon bin of industrial tomato paste (31 percent soluble solids) is running around $0.43 per pound—about one-third higher than a year earlier and the highest since the 1998/99 season. Given these strong prices, processors will likely contract for a larger tomato crop in 2007. However, with yields well below average since the 2004 record high and an El Nino weather pattern developing, producing a larger crop may be difficult. With higher wholesale prices, imports of tomato products are expected to remain above a year earlier in the coming months. During the first 4 months of the marketing year (July-October), import volume for all processed tomato products (on a fresh-equivalent basis) was nearly one-fifth higher than a year ago. Canada (47 percent), Italy (24 percent), and Mexico (13 percent) were the top three sources of imported tomato products thus far in the marketing year. Over the past 3 years, imports have averaged 6 percent of the domestic disappearance of processing tomatoes—compared with less than 4 percent a decade earlier. Table 5--Processing vegetables: Consumer and producer price indexes
2005 2006 Change previous: Item Oct. Sept. Oct. Month Year
-- Index -- -- Percent --Consumer Price Indexes (12/97=100) Processed fruits and vegetables 120.6 123.3 122.8 0.4 1.8 Canned vegetables 126.0 125.3 124.7 0.5 -1.0 Frozen vegetables (1982-84=100) 179.1 179.6 177.7 1.1 -0.8 Dry beans, peas, lentils 118.7 120.8 120.5 0.2 1.5 Olives, pickles, relishes 119.5 117.5 118.6 -0.9 -0.8
Producer Price Indexes (1982=100) Canned vegetables and juices 137.7 141.0 141.0 0.0 2.4 Pickles and products 185.4 189.2 189.2 0.0 2.0 Tomato catsup and sauces 1/ 130.3 135.4 135.3 -0.1 3.8 Canned dry beans 131.0 136.7 136.2 -0.4 4.0 Vegetable juices 1/ 113.6 116.1 116.8 0.6 2.8 Frozen vegetables 136.7 140.0 142.0 1.4 3.9 Frozen vegetable combinations 105.0 107.1 107.0 -0.1 1.9 Dried/dehyd. fruit & vegetables 150.6 169.4 169.0 -0.2 12.2
1/ Index base year is 1987. Source: U.S. Dept. of Labor, Bureau of Labor Statistics (http://w w w .bls.gov/data/home.htm)

9 Vegetables and Melons Outlook/VGS-318/December 14, 2006
Economic Research Service, USDA
100102104106108110112114116118120122
J-M A-J J-S O-D J-M A-J J-S O-D
2004 2005 2006
Figure 2U.S. canned and frozen vegetables: Quarterly consumer price indexes Percent of 2000
Source: Compiled by ERS from data of U.S. Department of Labor, Bureau of Labor Statistics.
Canned Frozen
Fall Retail Prices Unchanged From 2005 During 2006, retail prices for canned vegetables likely rose about 3 percent with all the increase coming during the beginning of the year—likely reflecting increased costs during 2005 for such things as metal cans (up 9 percent) and energy (up 24 percent). During the fall quarter of 2006 (October-December), retail prices for canned vegetables are expected to remain about even with a year earlier. For frozen vegetables, retail prices likely rose about 1 percent during 2006, with all of the gain coming during the first quarter. However, since last winter, retail prices for frozen vegetables have fallen back to near the averages of a year earlier despite higher processing, warehousing, and transportation costs. Retail prices for canned and frozen vegetables have each increased about 2 percent annually since 1990. Processed Trade: Imports Continue To Rise The value of processed (canned, frozen, dried) vegetable and melon imports rose 10 percent from a year earlier during January to October 2006. Mexico (25 percent of the total), Canada (13 percent), and China (11 percent) remain the top three suppliers of processed vegetables. Import volume and values for the canned, frozen, and dehydrated categories were each above a year earlier (table 6). Import volume for canned vegetables was up 4 percent from a year earlier, with increases for bulk industrial tomato paste, tomato ketchup, and canned asparagus outweighing declines for canned sweet corn, carrots, waterchestnuts, and bamboo shoots. Among the top four foreign suppliers of canned vegetables, the volume of products entering from China declined 9 percent, while volume leaders, Mexico and Canada, each rose less than 1 percent. Canned import volume from Italy rose nearly 8 percent. Italy accounted for 12 percent of canned vegetable import volume, with tomato sauces accounting for about 90 percent of the volume. By volume, China (32 percent), Mexico (16 percent), and Peru (10 percent) are the top three foreign suppliers of dehydrated vegetables to the United States. Through October, imports from Peru rose 8 percent due largely to increased demand for paprika. Volume from China was down 1 percent from a year ago as increased

10 Vegetables and Melons Outlook/VGS-318/December 14, 2006
Economic Research Service, USDA
shipments of dried garlic products and dried carrots was outweighed by reductions in crops such as dried peppers and onion powder. Although the value of frozen vegetable imports (excluding potatoes) was up through October, volume was up less than 1 percent. Shipments from Mexico, which accounted for 42 percent of U.S. frozen vegetable imports (excluding potatoes), declined 8 percent. Volume from Canada, which held 19 percent of the market, also was lower through October. However, imports from China, now the third leading supplier of frozen vegetables other than potatoes, jumped 45 percent as shipments of products such as green beans, spinach, and green peas increased. Imports of frozen green peas now arrive primarily from Canada, China, Guatemala, and New Zealand. Imports of green peas have risen 69 percent between 2003-05 and 1993-95 and imports now account for 11 percent of domestic disappearance (fig. 3). Imports of frozen spinach accounted for 14 percent of domestic use during 2003-05—up from less than 6 percent a decade earlier. Imports have increased in recent years, led by rising volume from China. China now holds 50 percent of the U.S. frozen spinach import market compared with less than 1 percent prior to 2003. China and Mexico account for over 90 percent of U.S. frozen spinach imports.
0
10
20
30
40
50
60
70
80
1980 82 84 86 88 90 92 94 96 98 2000 02 04 060
2
4
6
8
10
12
14
16U.S. imports Share of domestic use 2/
Figure 3U.S. frozen green peas: Import volume and share of consumption 1/ Million lbs Percent
1/ Imports are expressed on a fresh-weight basis. 2/ Share of domestic disappearance. Source: Computed by ERS based on data of U.S. Commerce Department, U.S. Census Bureau.
Table 6--Value of processed vegetable trade 1/
2005 January - October Change Item Annual 2004 2005 2006 2005-06
--Million dollars-- PercentImports: Canned 812 596 662 706 7 Frozen 493 375 401 428 7 Dehydrated 2/ 291 211 232 275 19
Exports: Canned 539 437 442 460 4 Frozen 160 121 134 144 8 Dehydrated 2/ 128 97 105 106 11/ Excludes potatoes and mushrooms. 2/ Includes dried products. Source: Derived by ERS from data of the U.S. Department of Commerce, U.S. Census Bureau.

Potatoes
11 Vegetables and Melons Outlook/VGS-318/December 14, 2006
Economic Research Service, USDA
Higher Prices Reflect Stronger Demand The production value of the 2006 potato crop is projected to rise 11 percent to $3.3 billion from $3 billion for the 2005 crop. This estimate is based on the 3-percent increase for all-season potato production in 2006 and an ERS projection of a 9- percent gain in average price to $7.67 per hundred pounds (cwt)—up from $7.06 in 2005. From the twin boosts in production and price, which last occurred in 1999, the value of sales for the 2006 crop is forecast at $3.1 billion (based on 2005’s sales/production ratio)—an 11-percent jump in farm receipts. In addition to lower carryover stocks than a year earlier, higher prices may also reflect increasing consumer demand for potatoes and potato products, in part due to the waning appeal of various low-carbohydrate-type diets. Average potato prices during 2006 have been running 8 to 9 percent higher than a year earlier. Fresh-market potato prices are up 10 percent while processing prices are up 6 percent. These higher prices, if sustained through the marketing year, will push average per-acre farm potato sales to a record $2,700 (or more) for the 2006 crop, up 8 percent from $2,538 for the 2005 crop. Assuming that sales from the 2006 fall crop are proportional to a year earlier, the value of fall 2006 potato sales will exceed $2.5 billion—up 12 percent from 2005. The corresponding sales per acre for the fall 2006 crop are $2,600, up 8 percent from $2,400 a year ago. Based on corresponding shares of total sales of the 2005 crop, the values of fresh-market and processing potato sales from the 2006 crop are expected to be approximately equal at $1.4 billion each. After subtracting net exports (or adding net imports), the value of domestic use of 2006/07 potatoes is projected to be close to $3 billion, or 10 percent more than the 2005/06 crop. In per capita terms, domestic use value will exceed $9—about $4.60 each for fresh-market and processed potatoes, or 8 percent more, on average, than the 2005 crop. The $9 per capita value is almost 50 percent higher than a decade ago.
0
100
200
300
400
500
1990/91 92/93 94/95 96/97 98/99 2000/01 02/03 04/05 06/070
1
2
3
4
5
6
7
8Production Farm price (t-1)
Figure 4U.S. fall potatoes: Production and lagged farm price, 1990-2006Million cwt $/cwt
Cwt = 100-pound bags.Source: USDA, National Agricultural Statistics Service, Potatoes.
12 Vegetables and Melons Outlook/VGS-318/December 14, 2006
Economic Research Service, USDA
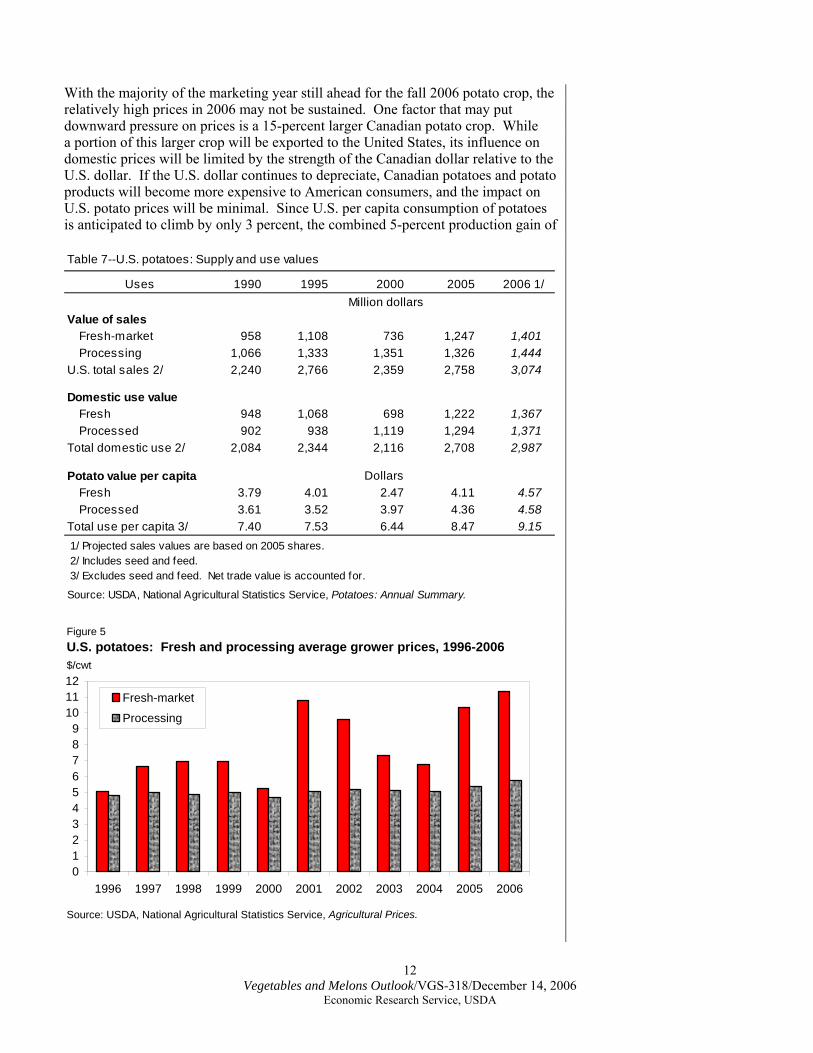
With the majority of the marketing year still ahead for the fall 2006 potato crop, the relatively high prices in 2006 may not be sustained. One factor that may put downward pressure on prices is a 15-percent larger Canadian potato crop. While a portion of this larger crop will be exported to the United States, its influence on domestic prices will be limited by the strength of the Canadian dollar relative to the U.S. dollar. If the U.S. dollar continues to depreciate, Canadian potatoes and potato products will become more expensive to American consumers, and the impact on U.S. potato prices will be minimal. Since U.S. per capita consumption of potatoes is anticipated to climb by only 3 percent, the combined 5-percent production gain of Table 7--U.S. potatoes: Supply and use values
Uses 1990 1995 2000 2005 2006 1/Million dollars
Value of salesFresh-market 958 1,108 736 1,247 1,401Processing 1,066 1,333 1,351 1,326 1,444
U.S. total sales 2/ 2,240 2,766 2,359 2,758 3,074
Domestic use valueFresh 948 1,068 698 1,222 1,367Processed 902 938 1,119 1,294 1,371
Total domestic use 2/ 2,084 2,344 2,116 2,708 2,987
Potato value per capita DollarsFresh 3.79 4.01 2.47 4.11 4.57Processed 3.61 3.52 3.97 4.36 4.58
Total use per capita 3/ 7.40 7.53 6.44 8.47 9.15 1/ Projected sales values are based on 2005 shares. 2/ Includes seed and feed. 3/ Excludes seed and feed. Net trade value is accounted for.
Source: USDA, National Agricultural Statistics Service, Potatoes: Annual Summary.
0123456789
101112
1996 1997 1998 1999 2000 2001 2002 2003 2004 2005 2006
Fresh-market
Processing
Figure 5U.S. potatoes: Fresh and processing average grower prices, 1996-2006$/cwt
Source: USDA, National Agricultural Statistics Service, Agricultural Prices.

13 Vegetables and Melons Outlook/VGS-318/December 14, 2006
Economic Research Service, USDA
the 2006 U.S. and Canadian crops will keep prices relatively stable through the current marketing year. The remaining production surplus will likely be shipped abroad as exports. Sales Firm to Foreign Markets Dehydrated and frozen potatoes are largely driving U.S. export growth, which is estimated to be 13 percent in 2006. The 29-percent higher export unit values of fresh potatoes are also helping raise U.S. export sales. Exports to Mexico are up 29 percent in 2006, accounted for in part by continued strong demand for potato chips. U.S. production of dehydrated potato products has likely increased as fewer of these products were imported in 2006 and more were exported. Because of smaller U.S. imports of potato chips and dehydrated potatoes, the U.S. trade surplus in potatoes is projected to rise from $54 million in 2005 to $87 million in 2006. Nevertheless, the trade deficit vis-à-vis Canada is expected to grow 9 percent to $511 million. U.S. imports of frozen French fries from Canada will total almost $509 million in 2006, up 8 percent. Although Japan is expected to remain the primary market for U.S. potatoes in 2006, particularly for frozen fries, Canada may take over the top spot in 2007. U.S. potato exports to Canada, especially fresh, seed, and frozen fries, accelerated in 2006 due to the smaller Canadian potato crop in 2005 and an exchange rate favorable to the United States. While Canada’s 2006 crop is significantly larger, the currently competitive U.S. dollar relative to the Canadian dollar is likely to boost more shipments of U.S. potatoes north of the border. Japan’s import demand for U.S. frozen fries is still more than triple that of Canada’s, but Japan’s imports of fresh potatoes and potato chips trail those of Canada.
0 25 50 75 100 125 150 175
2002
2003
2004
2005
2006p
Dehydrated
Chips
Frozen fries
Fresh-mkt
Figure 6Selected U.S. potato products: Index of average export price, 2002-06
Index, 2000=100
p = preliminary.Source: Derived by ERS from data of U.S. Dept. of Commerce, U.S. Census Bureau.

Longrun Outlook
14 Vegetables and Melons Outlook/VGS-318/December 14, 2006
Economic Research Service, USDA
The production value of horticulture crops—fruit, tree nuts, vegetables, melons, mushrooms, greenhouse, and nursery—is forecast to grow at an average 2.5-percent pace from 2007 to 2016. From $50 billion in 2006, these crops’ value will climb to $63.6 billion in 2016. The 2.5-percent annual gain consists of 0.9 percent increase in yearly production volume and an average 1.7-percent producer price inflation rate. The 0.9-percent projected growth in U.S. horticulture production volume is intended to coincide with expected U.S. population growth over the next decade. By 2016, the total horticulture production value of $63.6 billion is divided into $22 billion for fruit and nuts, $20 billion for vegetables and melons, and $21 billion for greenhouse and nursery crops. Fruit and tree nuts will grow the fastest in value because of a 2-percent price inflation rate, largely for noncitrus fruit and tree nuts. Horticulture crops facing increased import competition due to slower domestic production are citrus fruit and processing vegetables. Fresh-market vegetables are also expected to face strong import competition due in part to growth in domestic demand. Fresh vegetable imports have risen about 10 percent annually over the past decade (based on import value). The import pace of other high-value “horticulture” products—wine, beer, essential oils, and prepared foods—also exceeded 10 percent annually from 1996 to 2007, largely due to higher prices. In 2006, the share of exports from U.S. horticulture production value was 33 percent. This share is expected to climb to 38 percent by 2016, largely driven by exports of fruits and nuts whose combined export share of production in 2016 is estimated at 46 percent, up from 40 percent in 2005. About 25 percent of U.S. vegetable production value will be exported over the next decade. With respect to imports, an average of 49 percent of the fruits and nuts consumed in the U.S. will be imported during 2007 to 2016. For vegetables, the import share of domestic consumption value is forecast to rise from 35 to 41 percent between 2006 and 2016. Among the fastest export earners, wine and tree nuts, particularly almonds, are expected to continue to lead other U.S. horticulture exports based on their double- digit growth over the past decade. As a group, exports of U.S. horticulture products will rise close to 3 percent annually through 2016. About 73 percent of these Table 8--ERS baseline forecasts of horticulture production values
Crop 2002 2004 2006 2008 2010 2012 2014 2016-- Billion dollars --
Vegetables 1/ 15.6 15.5 16.3 16.6 17.4 18.3 19.2 20.1Fresh market 11.7 11.7 12.5 12.8 13.5 14.3 15.1 16.0Processing 3.4 3.5 3.4 3.5 3.6 3.6 3.7 3.8
Fruit and nuts 12.8 15.0 16.7 17.7 18.7 19.8 21.0 22.2Citrus fruits 2.6 2.5 2.3 2.4 2.5 2.6 2.6 2.7Noncitrus fruits 8.1 9.0 10.2 10.8 11.5 12.2 12.9 13.6Tree nuts 2.1 3.5 4.1 4.4 4.7 5.1 5.5 5.9
Nursery / greenhouse 15.2 15.9 16.6 17.3 18.2 19.0 19.9 20.9Floriculture 5.1 5.3 5.5 5.7 5.9 6.1 6.4 6.6Nursery and other 10.1 10.6 11.1 11.7 12.3 12.9 13.5 14.2
Total horticulture 2/ 44.1 46.9 50.0 52.1 54.7 57.6 60.5 63.6
1/ Includes value of production not sold (feed, seed, or unutilized).2/ Includes other crops such as honey, hops, essential oils, and maple syrup.
Sources: Derived by ERS using data of USDA, National Agricultural Statistics Service.

15 Vegetables and Melons Outlook/VGS-318/December 14, 2006
Economic Research Service, USDA
exports will be processed products and a quarter will be fresh produce. Horticulture imports, on the other hand, are projected to expand at a 3.8-percent annual pace. From 45 percent in 2006, horticulture imports will account for more than half of total U.S. agricultural import value by 2016. From a quarter of U.S. horticulture imports in 2006, beverages, largely wine and beer, will account for a third of horticulture import value by 2016. Processed imports will comprise around two-thirds of all imported horticulture products versus 30 percent for fresh produce. Table 9--U.S. horticulture: Longrun outlook for exports and imports
Product group 2002 2004 2006 2008 2010 2012 2014 2016-- Billion dollars --
ExportsVegetables 3.0 3.2 3.8 4.1 4.3 4.5 4.7 5.0 Fresh market 1.2 1.3 1.6 1.8 1.9 2.0 2.1 2.2 Processed 1/ 1.8 1.8 2.2 2.3 2.4 2.5 2.6 2.7Fruit and nuts 4.7 5.7 7.5 8.3 8.7 9.2 9.7 10.2 Fresh fruits 2.1 2.4 2.8 3.1 3.2 3.4 3.5 3.7 Processed fruits 1.4 1.5 1.7 1.8 1.9 2.0 2.1 2.2 Tree nuts 1.2 1.9 2.9 3.4 3.6 3.8 4.1 4.3Other horticulture 2/ 3.7 4.7 5.3 6.5 7.0 7.5 8.1 8.7Total horticulture 11.4 13.6 16.7 18.9 20.1 21.2 22.5 23.9
ImportsVegetables 1/ 4.3 5.6 6.7 7.5 8.2 8.9 9.7 10.5 Fresh market 2.4 3.1 4.0 4.5 4.9 5.4 5.9 6.4 Processed 1.9 2.5 2.8 3.0 3.3 3.5 3.8 4.1Fruit and nuts 5.5 6.6 8.4 9.2 9.7 10.3 10.9 11.5 Fresh fruits 3.3 3.8 4.7 5.2 5.5 5.8 6.1 6.5 Processed fruits 1.5 2.0 2.6 2.9 3.0 3.2 3.3 3.5 Tree nuts 0.6 0.9 1.1 1.1 1.2 1.3 1.4 1.5Other horticulture 2/ 8.5 11.7 14.1 15.7 17.0 18.4 19.9 21.6
Total horticulture 18.3 23.9 29.2 32.4 34.9 37.6 40.5 43.6
1/ Includes dry edible beans, peas, lentils, and potatoes.2/ Includes greenhouse/nursery, w ine, beer, essential oils, and other products.Source: Forecasts by ERS based on data of U.S. Department of Commerce, U.S. Census Bureau.
05
10152025303540455055
2000 01 02 03 04 05 06 07 08 09 10 11 12 13 14 15 16
Fruit and nuts Vegetables *
Figure 7U.S. fruit and vegetables: Export share of production value, 2000-16Percent
* Vegetable production includes melons.Sources: Estimates and projections developed by USDA, Economic Research Service.

Dry Beans
16 Vegetables and Melons Outlook/VGS-318/December 14, 2006
Economic Research Service, USDA
The U.S. dry edible bean crop was estimated to be 23.8 million cwt—down 11 percent from a year earlier. Although harvested area was down less than 1 percent, hot, dry weather in most major states impacted crop development and yield potential. As a result, national per-acre yield averaged 15.6 cwt, down 11 percent from a year earlier but 7 percent above the freeze-impacted low of 2 years ago. In North Dakota, again the leading State with 32 percent of the 2006 crop, production declined 11 percent to 7.62 million cwt. Crop conditions in Michigan, the second leading State in 2006, were favorable for dry beans until late in the harvest season, with State yield rising 6 percent to 18.0 cwt per acre. In Nebraska, the third leading producer, dry bean yields were reduced 4 percent by an early frost. The first estimate of dry bean production by class was released by USDA on December 11. Production of 10 of the 15 identified bean classes fell below a year Table 10--U.S. dry beans: Production by class, 2002-06
Change Item 2002 2003 2004 2005 2006 2005-06
--1,000 cwt-- PercentPinto 13,188 10,453 7,814 12,601 9,602 -23.8Navy 5,389 2,514 2,142 3,995 4,253 6.5Great Northern 1,558 2,216 951 1,585 1,179 -25.6Black 3,120 1,263 1,870 1,798 2,584 43.7Lt. red kidney 1,207 1,095 806 1,103 739 -33.0Dk. red kidney 1,136 845 682 1,047 821 -21.6Garbanzo 861 417 593 1,061 1,330 25.4Small red 592 581 601 903 622 -31.1Pink 596 612 521 662 725 9.5Blackeye 543 785 384 406 554 36.5Baby lima 501 325 267 385 283 -26.5Large lima 334 369 307 359 214 -40.4Cranberry 359 190 180 162 149 -8.0Others 928 827 670 705 788 11.8United States 30,312 22,492 17,788 26,772 23,843 -10.9
Source: USDA, National Agricultural Statistics Service, Crop Production.
15
20
25
30
35
Sep. Oct. Nov. Dec. Jan. Feb. Mar. Apr. May June July Aug.
2004/052005/062006/07
Figure 8U.S. dry edible beans: Average monthly grower priceCents/pound
Source: USDA, National Agricultural Statistics Service, Agricultural Prices.

17 Vegetables and Melons Outlook/VGS-318/December 14, 2006
Economic Research Service, USDA
Table 11--U.S. dry pinto beans: Area, production, and value 1/
Crop Acres Yield per Average Cropyear Planted Harvested acre Production price 1/ value 2/
1,000 acres Cwt 1,000 cwt $/cwt $ Mil.
1990 964.2 925.1 1,476 13,650 14.89 203.21995 841.0 758.2 1,484 11,253 18.56 208.92000 724.5 652.2 1,653 10,778 12.01 129.42001 558.6 509.4 1,718 8,750 25.18 220.32002 832.3 742.3 1,777 13,188 13.79 181.92003 663.9 639.2 1,635 10,453 15.84 165.62004 650.9 573.7 1,362 7,814 26.84 209.72005 784.8 726.1 1,735 12,601 13.95 175.82006 f 692.1 651.7 1,473 9,602 22.00 211.2
f = ERS forecast for 2006 price and value. 1/ Season-average grow er bids. 2/ Estimated by ERS.
Source: USDA, National Agricultural Statistics Service, Crop Production and USDA, Agricultural Marketing Service, Bean Market News.
earlier, with the biggest percentage declines for large lima, light red kidney, and small red beans (table 10). Output of Great Northern beans fell 26 percent in 2006 as an early frost in Nebraska reduced yields 12 percent. A combination of less harvested area and reduced yields pulled the pinto crop down, but pintos easily remained the top bean class with 40 percent of the 2006 crop. Pinto bean harvested area was down 10 percent to 651,700 acres, while average yields dropped 15 percent due largely to the hot, dry summer. Pinto output was down in 11 of the 14 producing States, with North Dakota, the leading producer, down 25 percent to 4.91 million cwt. Output of pinto beans declined 34 percent in Nebraska, the second-leading producer, largely because of a 31-percent cut in harvested area. Growers in Colorado produced 8 percent fewer pintos as a 20 percent reduction in harvested area outweighed a 15-percent gain in yield. Pinto yield in Colorado was second only to the 2002 record. As pinto bean stocks are drawn lower this season, grower and wholesale prices are likely to continue strengthening. Grower prices (CO/NE) began the marketing year in September at $17.67 per cwt, up 20 percent from a year earlier. With limited open market activity, grower bids in North Dakota-Minnesota had climbed to $19.50 by mid-December, up 40 percent from a year earlier. Although the total dry bean crop was lower, several bean types managed to post increases in 2006. Production of navy beans, the second-leading dry bean class, increased 6 percent as output was higher in both North Dakota (up 19 percent) and Michigan (up 9 percent). Output of black beans also increased, led by greater harvested area in the 2 leading states, Michigan and North Dakota. This was the largest black bean crop since 2002, reflecting stronger demand and higher prices over the past year. With higher prices encouraging larger planted area in several States, the garbanzo bean (small and large chickpeas) crop was the largest since the 2001 record high. Large kabuli chickpeas accounted for 90 percent of the total garbanzo crop. Despite a record-large crop, prices in the chickpea/ garbanzo market remain relatively strong, reflecting good domestic and world demand.

18 Vegetables and Melons Outlook/VGS-318/December 14, 2006
Economic Research Service, USDA
Table 12--U.S. dry beans: Monthly grower prices for selected classes, 2005-2006 1/2005 2006 Chg. prev. year:
Commodity Nov. Dec. Nov. Dec. 2/ Nov. Dec.--- Cents per pound --- --- Percent ---
All dry beans 18.00 18.10 21.00 -- 16.7 --Pinto (ND/MN) 13.70 13.83 19.25 19.50 40.5 41.0Navy (pea bean) (MI) 18.50 18.50 17.44 18.25 -5.7 -1.4Great Northern (NE/WY) 15.60 16.00 19.63 20.00 25.8 25.0Black (MI) 19.90 20.50 21.00 21.50 5.5 4.9Light red kidney (MI) 21.50 21.50 23.75 23.50 10.5 9.3Dark red kidney (MN/WI) 21.20 20.50 23.50 23.50 10.8 14.6Baby lima (CA) 34.50 34.67 44.13 44.00 27.9 26.9Large lima (CA) 42.70 44.33 60.00 61.00 40.5 37.6Blackeye (CA) 34.00 39.00 48.00 48.00 41.2 23.1Small red (WA/ID) 19.90 19.50 21.00 22.00 5.5 12.8Pink (WA/ID) 19.90 19.50 21.00 21.00 5.5 7.7Cranberry (MI) 23.75 -- 35.00 -- 47.4 --Garbanzo (WA/ID) -- -- 27.75 28.25 -- --
-- = not available. 1/ Prices are U.S. No. 1, cleaned basis. 2/ Partial month estimate. Sources: USDA, Agricultural Marketing Service, Bean Market News, except "all dry beans" from USDA, National Agricultural Statistics Service, Agricultural Prices. Outlook for 2007/08 With stocks of several dry bean classes likely to be low by next summer, reduced supplies and higher prices over the coming marketing year would normally be an automatic indicator of a significant increase in area planted next spring. However, dry beans may face a substantial challenge in the coming year from traditional rotational crops such as corn, soybeans, barley, and wheat. Prices for these grains have risen greatly over the past few months due in part to strong demand for field corn by a rapidly expanding ethanol industry. Fundamentals in the corn market set the tone in many agricultural crop markets. Currently, field corn is running at more than $3.00/bushel, wheat is over $4.50/bushel, and soybeans are over $6/bushel—all well above a year earlier and their longrun averages. Although dry bean prices have risen, they are currently uncompetitive with most of these alternative crops. This suggests that in the absence of changes in commodity price relationships this winter, U.S. dry bean acreage could decline 10-15 percent in 2007. Assuming that yields return to either trend or their longrun average, the decline in U.S. dry bean production would be less than the percentage reduction in area. September-October Exports Up U.S. dry edible bean export volume for the initial 2 months of the 2006/07 marketing year increased 24 percent from a year earlier (table 13). Export gains were led by pinto, navy, and black beans. The top destinations were Mexico, Japan, Cuba, and the United Kingdom. Pinto bean exports were strong in 2005/06, rising 114 percent to 2.64 million cwt. This strength has carried over into the first 2 months of 2006/07, with pinto volume up 31 percent from the same time a year ago. A large shipment to Cuba in September and increased movement to Mexico pushed pinto bean exports higher. With prices likely to rise in coming months due to tighter supplies, pinto bean exports are expected to decline. Navy bean export volume has been trending lower since the late 1990s but managed to increase 6 percent from a year earlier during 2005/06 (fig. 9). During the first 2 months of 2006/07, volume is up 28 percent with increased movement to Canada and Mexico outweighing reduced movement to the United Kingdom. Exports

19 Vegetables and Melons Outlook/VGS-318/December 14, 2006
Economic Research Service, USDA
accounted for about 19 percent of the disposition of 2006 supplies, down from 21 percent in 2000 and 24 percent during the 1990s. Imports (excluding guar seeds) during September-October were up 20 percent from a year earlier, led by black (up 123 percent) and black gram/urd (up 68 percent) beans. Greater dry bean import volume from Mexico (up 24 percent) and China (up 26 percent) was likely driven by dwindling preharvest supplies and increased wholesale prices in the U.S. dry bean market. During September-October, the producer price index (PPI) for canned dry beans was up 6 percent from a year earlier, while the PPI for dry pinto beans was 15 percent above a year earlier. Table 13--U.S. dry bean crop-year export volume
Crop year September - October Change Bean class 2005/06 2004/05 2005/06 2006/07 2005-06
1,000 cwt (bags) Percent
Pinto 2,643 197 386 504 31 Navy (pea) 1,061 223 355 453 28 Black 763 182 177 238 35 Great Northern 516 67 83 54 -35 Garbanzo 380 72 63 113 80 Baby lima 265 20 34 34 0 Dark-red kidney 252 39 21 29 40 Small red 182 15 26 20 -21 Light-red kidney 153 8 19 22 16 Large lima 135 25 10 9 -13 Cranberry 84 8 12 17 36 Pink 65 5 5 6 19 Blackeye 32 6 3 4 18 Other 796 108 185 202 9
Total 7,327 968 1,374 1,701 24
Source: Compiled by ERS from data of U.S. Department of Commerce, U.S. Census Bureau.
0.0
0.5
1.0
1.5
2.0
2.5
3.0
1990/91 92/93 94/95 96/97 98/99 2000/01 02/03 04/05 06/07f0
5
10
15
20
25
30Export volume Export unit value
Figure 9U.S. navy beans: Crop year export volume and unit valueMillion cwt $/cwt
f = ERS forecast. Cwt = 100-pound bags.Sources: Prepared by ERS using data of the U.S. Department of Commerce, U.S. Census Bureau.

Dry Peas and Lentils
20 Vegetables and Melons Outlook/VGS-318/December 14, 2006
Economic Research Service, USDA
Dry Pea and Lentil Output Declines According to USDA crop estimates, hot, dry weather hindered the production of dry peas and lentils in 2006 by reducing yields and increasing acreage losses. Average yields for dry peas declined 18 percent to 1,496 pounds per acre—the lowest since 1996. However, the extended summer dry spell affected lentils even more with yields plummeting 30 percent to just 822 pounds per acre—the lowest since 1985. Production of dry edible peas (green and yellow) fell 6 percent to 13.1 million cwt, as a 14 percent increase in area for harvest was outweighed by lower yields. North Dakota, the industry leader in dry peas, harvested 15 percent more area but saw lower yields reduce the crop 5 percent from a year earlier. Montana, now the second-leading State in dry peas, harvested 50 percent more acres in 2006 but the hot, dry summer slashed yields, resulting in an 8 percent decline in production. In Washington, acreage was down and yields remained below average for the second consecutive year, resulting in the smallest dry pea crop since 1977. The U.S. Austrian winter pea crop declined largely because of acreage losses and low yields in Montana. Production of lentils dropped 36 percent to 3.3 million cwt due to a combination of lower harvested area and crop yields. Acreage planted to lentils declined for the first time since 2001 as stronger returns for alternative crops such as spring wheat caused some growers to shift acreage. Despite a 39-percent reduction in yields, North Dakota remained the leading lentil State with one-third of the national crop. With lower acreage outweighing improved yields, lentil production in Washington fell 4 percent to the lowest level since 1996. With supplies down and movement good at times this season, prices for dry peas and lentils have been rising. According to USDA’s National Agricultural Statistics Service, November grower prices for dry peas (all uses) were averaging 26 percent higher than a year earlier and 39 percent above the August lows. Although November lentil prices were up just 6 percent from a year earlier, the rise in prices over the past several months has been dramatic. With the extent of the 2006 crop decline evident and overseas interest expanding, lentil prices surged 54 percent Table 14--U.S. dry peas and lentils: Production by class, 2002-06
Change Item 2002 2003 2004 2005 2006 2005-06
--1,000 cwt-- Percent
Dry peas 4,727 5,202 11,419 14,003 13,103 -6.4Austrian winter peas 183 174 291 307 259 -15.6Chickpeas, all 861 417 593 1,061 1,330 25.4 Small -- 60 76 149 127 -14.8 Large -- 357 517 912 1,203 31.9Lentils 2,571 2,442 4,182 5,163 3,298 -36.1
Total 8,342 8,235 16,485 20,534 17,990 -12.4
Wrinkled seed peas 599 673 899 755 -- --
-- = not available.Source: USDA, National Agricultural Statistics Service, Crop Production.

21 Vegetables and Melons Outlook/VGS-318/December 14, 2006
Economic Research Service, USDA
Table 15--U.S. dry peas and lentils: Monthly grower prices by class, 2005-2006 Crop year & Dry Chickpeas Austrian All
month peas All Large Small winter peas Lentils--- Cents per pound ---
2005/06 July 5.16 27.90 28.20 -- 7.57 11.90 August 4.25 20.60 25.70 -- 6.75 11.80 September 4.66 26.50 26.80 -- 6.22 11.50 October 4.51 25.10 25.20 -- 6.83 11.80 November 4.80 25.20 25.40 -- 7.33 11.30 December 4.99 24.60 24.80 -- 6.99 12.20 January 4.74 27.40 27.80 -- 6.93 11.10 February 5.02 26.20 30.20 18.60 7.76 11.00 March 5.05 22.20 25.20 -- 6.54 10.50 April 4.88 26.80 30.90 15.40 6.44 9.51 May 5.25 15.90 -- 14.50 -- 9.68 June 5.30 28.20 30.70 11.30 6.23 7.81
2006/07 July 5.03 22.80 -- -- -- 7.80 August 4.46 24.60 26.30 -- 6.68 9.18 September 5.71 25.40 25.50 -- -- 12.10 October 5.80 21.30 25.00 15.90 6.04 11.00 November 1/ 6.20 27.00 27.20 14.00 -- 12.00
Percent change Nov. 05-06 29.2 7.1 7.1 -- -- 6.2
-- = not available. 1/ Prices for November 2006 are partial-month averages. Source: USDA, National Agricultural Statistics Service, Agricultural Prices. percent since hitting a seasonal low in July due in part to large carryover stocks from the 2005 crop. According to USDA’s Bean Market News, in early December, Pacific Northwest (PNW) grower bids for U.S. number one grade whole dry green peas were averaging around $7.75 per cwt—up 59 percent from a year earlier. Early December grower prices for whole dry yellow peas in the PNW were running about 50 percent above year-earlier levels. Prices for the top grade of brewer lentils stood at $14.50 per cwt in the Pacific Northwest in early December—up 41 percent from a year ago. Outlook for 2007/08 Despite the expectation of rising prices for both dry peas and lentils over the coming months, the focus of some growers may be drawn away from these crops in 2007/08. Potential returns for nearly every crop grown in rotation with dry peas and lentils are averaging well above those of a year earlier and futures markets indicate that prices for crops such as wheat and corn could move higher as planting decisions are made and seed orders are placed this winter. Spring wheat prices are stronger than a year earlier (especially for the types grown in the upper Midwest) and are expected to encourage some shifting of acreage away from peas and lentils. At this time, it appears that acreage planted to dry edible peas and lentils could each decline about a tenth in 2007. Assuming 5-year average yields (2002-06) for both dry peas and lentils (which would greatly improve on yields experienced in 2006), U.S. output of dry peas and lentils is expected to rise modestly in 2007.

22 Vegetables and Melons Outlook/VGS-318/December 14, 2006
Economic Research Service, USDA
Table 16--U.S. dry peas and lentils: Price support program Crop year & 2004/05 2005/06 2006/07 (thru Dec 6)
crop Units Total 1/ Total 1/ Dry peas Chickpeas Lentils
Loan deficiency (LDP) Applications Number 5,966 11,081 6,500 0 2,622 Quantity 000 cwt 13,611 18,595 12,557 0 2,492 Value 000 $ 31,716 41,580 26,561 0 12,401 Unit value $/cwt 2.33 2.24 2.12 0 4.98
CCC loans made 2/ Applications Number 282 535 129 0 170 Quantity 000 cwt 1,113 2,247 725 0 475 Value 000 $ 11,309 21,109 4,441 0 5,400 Unit value $/cwt 10.16 9.40 6.13 0 11.36
1/ Crop-year totals for all dry peas, lentils, and small chickpeas. 2/ Refers to crop placed under loan and does not measure net gain from the use of marketing loans. Source: USDA, Farm Service Agency, http://w w w .fsa.usda.gov/ Table 17--U.S. dry peas and lentils: Trade volume by class, July-October 1/
Crop year July-October Change Item 2005/06 2004/05 2005/06 2006/07 2005-06
--1,000 cwt-- Percent
Exports: Green peas 3,274.4 580.5 1,113.2 1,573.8 41 Yellow peas 2,626.7 168.7 688.2 1,051.1 53 Split peas 195.5 74.9 59.7 68.9 15 Austrian winter pea 30.5 4.4 9.0 14.8 65 Misc. dry peas 2,588.2 126.3 1,210.6 557.2 -54 Chickpeas, all 391.0 98.2 96.3 135.7 41 Lentils, all 3,495.4 512.6 1,167.1 764.5 -34 Total 12,601.7 1,565.6 4,344.0 4,166.0 -4
Imports: Split peas 264.8 104.1 73.3 141.1 93 Chickpeas, all 236.4 98.0 65.3 101.7 56 Other peas 450.7 78.3 155.6 162.2 4 Lentils, all 260.0 59.2 81.2 141.5 74
Total 1,211.9 339.6 375.4 546.6 46
1/ Excludes planting seed. Source: Compiled by ERS from data of U.S. Department of Commerce, U.S. Census Bureau. Exports Up During July-October In 2005/06, a record 12.6 million cwt of U.S. dry peas and lentils (including chickpeas) were shipped to other countries. During the first 4 months (July-October) of the 2006/07 marketing year, the U.S. shipped 4 percent fewer dry peas and lentils to other nations than a year earlier (table 17). India (24 percent of total volume), Spain (18 percent), and Cuba (10 percent) have been the top 3 markets for dry peas and lentils so far this season. Exports of green and yellow peas have remained strong, with movement of these crops accounting for about two-thirds of industry export volume. While movement of chickpeas also remained strong, exports of lentils were running well below year-earlier volume. With smaller supplies and higher prices, 2006/07 lentil export volume is unlikely to match that of 2005/06.

Commodity Highlight: Eggplant
23 Vegetables and Melons Outlook/VGS-318/December 14, 2006
Economic Research Service, USDA
Eggplant (Solanum melongena L) is a native of India and Pakistan and is thought to have originally been introduced into North America by Thomas Jefferson in his garden at Monticello. A member of the nightshade (Solanaceae) family, eggplant is related to potatoes, tomatoes, and bell peppers. Eggplant is a warm-season crop (sensitive to cool temperatures), which is grown primarily from transplants in the United States to reduce the growing period by about half (direct-seeded crops require as long as 150 days to mature). Eggplant (also known as aubergine in some parts of the world) reportedly received its name in the past when white, egg-shaped varieties were more common. Eggplant is available in a variety of colors (e.g., purplish black, red, white, and variegated) and shapes (e.g., egg-shaped, elongated, and round). Several varieties are produced in the United States, including the traditional Black Beauty and Black Bell, which tend to be oblong or globular in shape. Also found in well-stocked produce departments are the less commonly produced Asian varieties (which tend to be long and slender) and baby (or miniature) eggplant. World production of eggplant is highly concentrated, with 93 percent of output coming from seven countries. China (55 percent of world output) and India (28 percent) are the top producers, with the United States a distant 20th. Egypt, Turkey, and Japan round out the top five producing nations. More than 4 million acres are devoted to the cultivation of eggplant in the world. Eggplant Is Widely Grown Eggplant is a widely grown specialty vegetable in the United States, although there are less than 7,000 acres devoted to production annually. In the 2002 Census of Agriculture, 47 States reported harvesting eggplant, with the top five States accounting for 78 percent of the acreage. About 4 percent of the 54,000 farms that harvest vegetables (excluding potatoes and pulses) in the United States reported harvesting eggplant. About 98 percent of the eggplant grown in the United States is produced for the fresh market, with the remainder used for processed products such as frozen entrees and specialty dips and appetizers.
0
100
200
300
400
500
600
700
1995 1996 1997 1998 1999 2000 2001 2002 2003 2004
Others Japan China Turkey India Egypt
Figure 10Eggplant: World production, 1995-2004Mil. cwt
Source: United Nations, Food and Agriculture Organization, FAOStat (11/2006).

24 Vegetables and Melons Outlook/VGS-318/December 14, 2006
Economic Research Service, USDA
0
1,000
2,000
3,000
4,000
5,000
6,000
7,000
8,000
1982 1987 1992 1997 2002
CA FL GA
NJ MI Other
Figure 11U.S. eggplant: Acres harvested, census years, 1982-2002Acres
Source: USDA, National Agricultural Statistics Service, Census of Agriculture.
USDA has not collected complete domestic production statistics for eggplant since 2001. In 2001, nine States reported the production of eggplant with Georgia, Florida, California, New Jersey, and New York the top five producers. If Michigan had been included in the 2001 estimates program for eggplant, it would have supplanted New York as the fifth-largest producer. In 2005, California, New Jersey, New York, Michigan, and Hawaii reported production statistics for eggplant through their State vegetable estimates programs. Although acreage and production data are not reported for Georgia and Florida, information on market shipments are reported for these States by USDA’s Market News Service. Shipments data indicate that along with California, Georgia, and Florida remain among the top three eggplant-producing States today. According to Market News data, Georgia was the leading shipper of fresh-market eggplant in 2005. Georgia’s eggplant acreage increased from 719 acres in 1997 to over 1,100 acres in 2002. Only 44 farms reported producing eggplant in the 2002 census, down from 64 in 1997. The major producing counties are Colquitt (43 percent of area), Echols (21 percent), and Lowndes (13 percent). Between May and December, Georgia ships fresh-market eggplant monthly (except for August), with volume peaking in June and again in October. In California, about 90 percent of eggplant is produced in Fresno and Riverside counties, with Fresno accounting for about three-fourths of the crop. According to the California County Agricultural Commissioners Report, the farm value of the 2005 California eggplant crop was nearly $12 million—up from about $9 million 5 years earlier. In 2005, production came from 1,364 acres and totaled about 39 million pounds. California generally ships eggplant from late April to early December, with peak shipments occurring in early fall. In Florida, eggplant acreage is spread among 23 counties but the crop is primarily produced in the southeastern part of the State. In 2002, about 25 percent of Florida's harvested acreage was in Palm Beach County, with Hillsborough and Miami-Dade counties also important. Florida’s eggplant acreage has declined and is less than half of what it was in 1997 due to a combination of increasing per-acre yields (requiring less acreage to maintain production) and a shift of some acreage to Georgia. In 2002, Florida reported 1,174 acres of eggplant—down from 2,416

25 Vegetables and Melons Outlook/VGS-318/December 14, 2006
Economic Research Service, USDA
Table 18--California eggplant, all uses: Area, production, and value
Acres Yield per Average CropYear Planted Harvested acre Production price 1/ value
Acres Cwt 1,000 cwt $/cwt $ 1,000
1980 -- 370 144 53 31.00 1,653
1985 -- 394 192 76 24.00 1,5061990 -- 612 223 113 25.25 3,8321995 -- 840 331 277 32.50 9,0322000 1,600 1,600 205 328 27.50 9,0202001 1,400 1,400 235 329 24.50 8,0612002 -- 949 225 213 29.10 6,2022003 -- 997 241 241 29.00 6,9792004 -- 1,041 285 297 27.65 8,2022005 -- 1,364 289 395 29.63 11,697
-- = not available. Cw t = hundredw eight, a unit of measure equal to 100 pounds. 1/ Season-average farm price.
Sources: California County Agricultural Commissioner reports (1980-99 and 2002-05) and USDA, National Agricultural Statistics Service, Vegetables Summary (2000-01). acres in 1997. In 2005, USDA’s Market News Service reported that shipments of eggplant from Florida totaled about 35 million pounds, down from 48 million pounds in 1997. Florida ships eggplant monthly from October to June with volume peaking during the spring. In 2005, New Jersey harvested 800 acres of eggplant, with a farm value of nearly $4 million. The State’s eggplant is largely produced in Gloucester (31 percent), Cumberland (20 percent), and Atlantic (14 percent) counties. Eggplant acreage has trended lower in New Jersey, dropping 20 percent over the past decade. However, production has largely been maintained as per-acre yields have risen. New Jersey ships eggplant from mid-July to early October, when frost ends the season. The United States Is World’s Leading Importer Despite a per-capita consumption rate of less than 1 pound, the United States is the leading importer of eggplant in the world. According to the Food and Agriculture Organization of the United Nations, during 2002-04, the United States accounted for 19 percent of world eggplant import volume. France, Syria, Germany, and Canada round out the top five eggplant importers. The top five nations account for two-thirds of all eggplant imports. The volume of U.S. eggplant imports has jumped 130 percent between 1993-95 and 2003-05. During 2003-05, imports averaged about 46 percent of U.S. domestic eggplant use—up from 37 percent a decade earlier. Mexico accounted for 80 percent of 2005 eggplant import volume followed by Honduras with 17 percent. Over the past decade, Honduran exporters have been chipping away at Mexico’s dominance in this market. A decade earlier, Mexico held most of the eggplant import market with Honduras accounting for just 3 percent of volume. Most U.S. eggplant imports, which were valued at $46 million in 2005, enter during the cooler months of the year. However, import volume has begun to expand throughout the year. The winter season (January-March) accounted for 46 percent of eggplant imports during the last three years (2003-05)—up from 55 percent a decade earlier (1993-95). Florida is the only domestic shipper during the winter.

26 Vegetables and Melons Outlook/VGS-318/December 14, 2006
Economic Research Service, USDA
0102030405060708090
100110120130
1990 1992 1994 1996 1998 2000 2002 2004 2006f0
10
20
30
40
50
60Volume Share of consumption
Figure 12U.S. eggplant imports: Volume and share of consumption, 1990-2006Million lbs Percent
f = ERS forecast.Source: Derived by ERS from data of U.S. Dept. of Commerce, U.S. Census Bureau.
The fall (October-December) season, which is served by several States, accounted for 31 percent of import volume in 2003-05, up from 25 percent in 1993-95. The share of eggplant imports entering during the spring (April-June) remains around one-fifth, while 5 percent of volume comes in during the summer months—up from 1 percent a decade ago. On the export side of the eggplant market, the top five nations account for three-fourths of world eggplant export volume. Spain, Mexico, and Jordan are the leading eggplant export nations, with the United States a distant seventh. As with most U.S. fresh vegetables, the majority of U.S. exports is shipped to Canada (99 percent), with most of the remainder moving to Mexico. U.S. eggplant exports, which were valued at nearly $9 million in 2005, are distributed throughout the year, with slightly more volume during the spring and fall and less volume during the winter months. About 9 percent of U.S. eggplant supplies were exported annually during 2003-05—down from 13 percent a decade earlier. U.S. Eggplant Consumption Is Rising U.S. eggplant consumption has trended higher over the past 5 decades. ERS estimates indicate that per-capita domestic disappearance (consumption) of eggplant averaged: o 0.30 pound in the 1960s; o 0.42 pound in the 1970s; o 0.46 pound during the 1980s; o 0.54 pound during the 1990s; and o 0.80 pound over the 2000-05 period. Between 1993-95 and 2003-05, per-capita use of eggplant rose by two-thirds to 0.8 pound. Domestic disappearance averaged 238 million pounds during 2003-05 compared with 128 million pounds in 1993-95. The more rapid growth which has been apparent over the past decade may reflect the introduction of new processed products plus increased interest in following a vegetarian or vegan diet. According to a Harris Interactive poll conducted for the Vegetarian Resource Group, 7 percent of Americans 18 years or older never eat meat, while about 2 percent considered

27 Vegetables and Melons Outlook/VGS-318/December 14, 2006
Economic Research Service, USDA
themselves vegetarians in 2006. A decade earlier, about 1 percent of Americans considered themselves vegetarians. 1/ Eggplant can be prepared in many ways including fried, broiled, grilled, micro-waved, baked, stewed, pureed, breaded, and pickled. In addition to serving as a meat substitute in dishes such as Eggplant Parmesan, eggplant is used in traditional ethnic dishes such as moussaka and ratatouille and in appetizers such as baba ghanoush (dip) and various pureed eggplant spreads. Eggplant, which contains about 30 calories per cup, is a good source of several vitamins (including A and C) and potassium. Increases in both domestic production (up 51 percent) and import volume (up 130 percent) have each played key roles in supporting increased U.S. eggplant demand over the past decade.
0.00.10.20.30.40.50.60.70.80.91.0
1960 1964 1968 1972 1976 1980 1984 1988 1992 1996 2000 2004
Figure 13U.S. eggplant: Per capita use, 1960-2006Lb/person
Source: Computed and prepared by USDA, Economic Research Service.
Trend
Table 19--U.S. eggplant, all uses: Estimated supply, disappearance, and price
Supply Utilization Season-ave. priceYear Per Current Constant
Production Imports Total Exports Domestic capita dollars dollars1/ 2/ 2/ use 3/ 4/
-- Million pounds -- Pounds -- $/cw t --
1985 77.2 32.0 109.2 -- 109.2 0.46 13.03 18.691990 79.0 35.9 114.9 15.0 99.9 0.40 25.82 31.652000 165.4 85.8 251.2 23.3 227.9 0.81 26.00 26.002001 169.4 91.0 260.4 22.9 237.5 0.83 25.10 24.512002 140.8 89.3 230.1 22.9 207.2 0.72 29.10 27.932003 141.8 98.5 240.3 23.4 216.9 0.75 29.00 27.282004 136.2 109.7 245.9 21.1 224.8 0.77 27.65 25.352005 173.8 119.2 293.0 21.2 271.8 0.92 29.63 26.432006 f 156.1 115.0 271.1 21.9 249.2 0.83 -- --
-- = Not available. f = ERS forecast. 1/ Estimated by ERS from both state and census data except 2000-01 from USDA, NASS published data. 2/ Source is U.S. Census Bureau, USDC. 3/ Exceptfor 1985-2002 from NASS, prices are from California as reported by the California County Agricultural Commisioners. 4/ Constant dollar prices are calculated using the GDP deflator, 2000=100. Source: Compiled and computed by USDA, Economic Research Service.
1/ Stahler, Charles. “How Many Adults Are Vegetarian?” Vegetarian Journal. Issue 4, 2006. The Vegetarian Resource Group.

28Vegetables and Melons Outlook/VGS-318/December 14, 2006
Economic Research Service, USDA
Contacts and Links
29 Vegetables and Melons Outlook/VGS-318/December 14, 2006
Economic Research Service, USDA
Articles The following are links to articles released on subjects directly related to the vegetable and melon industry. These articles are in Adobe Acrobat (.pdf) format: 1. Eliminating Fruit and Vegetable Planting Restrictions http://www.ers.usda.gov/publications/err30/ This report finds that market effects would likely be limited and confined to specific regions and commodities. Eliminating these planting restrictions for commodity program participants might enable some producers to switch from program crops to fruit and vegetables in such areas as California, the upper Midwest and the coastal plain in the Southeastern States. 2. Fruit and Vegetable Backgrounder http://www.ers.usda.gov/Publications/vgs/apr06/VGS31301/ Fruit and Vegetable Backgrounder describes the economic characteristics of the U.S. fruit and vegetable industry, providing supply, demand, and policy background for an industry that accounts for nearly a third of U.S. crop cash receipts and a fifth of U.S. agricultural exports. A variety of challenges face this complex and diverse industry in both domestic and international markets, ranging from immigration reform and its effects on labor availability, to international competitiveness. 3. Understanding Fruit and Vegetable Choices—Research Briefs http://www.ers.usda.gov/publications/aib792/ USDA's Food Guide Pyramid recommends 2-4 servings of fruit and 3-5 servings of vegetables daily. As a member of the 5-A-Day public-private partnership, USDA partners with other government agencies and private sector groups to promote the health benefits of fruits and vegetables. Yet consumption of these healthful foods still does not meet dietary recommendations. How can we better understand the reasons for the persistent difficulty in increasing produce consumption? This series of research briefs provides information on the economic, social, and behavioral factors influencing consumers' fruit and vegetable choices.
Contact Information Gary Lucier Tel: (202) 694-5253 Fax: (202) 694-5820 Email: [email protected] Andy Jerardo Tel: (202) 694-5266 Fax: (202) 694-5820 Email: [email protected] Covers potatoes, sweet potatoes, long-run outlook Subscription Information Subscribe to ERS’ e-mail notification service http://www.ers.usda.gov/updates/ to receive timely notification of newsletter availability. Printed copies may be purchased from the USDA Order Desk by calling 1-800-999-6779 (specify the issue number or series SUB-VGS-4039).
E-mail Notification Readers of ERS outlook reports have two ways they can receive an e-mail notice about release of reports and associated data. • Receive timely notification (soon after the report is posted on the web) via USDA’s Economics, Statistics and Market Information System (which is housed at Cornell University’s Mann Library). Go to http://usda.mannlib.cornell.edu/ MannUsda/aboutEmailService.do and follow the instructions to receive e-mail notices about ERS, Agricultural Marketing Service, National Agricultural Statistics Service, and World Agricultural Outlook Board products. • Receive weekly notification (on Friday afternoon) via the ERS website. Go to http://www.ers.usda.gov/Updates/ and follow the instructions to receive notices about ERS outlook reports, Amber Waves magazine, and other reports and data products on specific topics. ERS also offers RSS (really simple syndication) feeds for all ERS products. Go to http://www.ers.usda.gov/rss/ to get started.
30 Vegetables and Melons Outlook/VGS-318/December 14, 2006
Economic Research Service, USDA
4. How Low Has the Farm Share of Retail Food Prices Really Fallen? http://www.ers.usda.gov/Publications/ERR24/ Growers have been receiving a decreasing share of what consumers pay for food at retail stores. Using updated baskets based on what American households bought for at-home consumption between 1999 and 2003, this report estimates farm share for fresh vegetables and fresh fruits. Findings indicate that growers are capturing more of the consumer’s food dollar than current estimates suggest. Data Tables The following links provide the most recent data on vegetables and melons. You may choose links for Adobe Acrobat (.pdf) table compilations or the original Excel workbook (spreadsheet) tables: 1. Per capita use (consumption) PDF file: http://www.ers.usda.gov/publications/vgs/tables/percap.pdf Excel file: http://www.ers.usda.gov/publications/vgs/tables/percap.xls 2. Vegetable prices PDF file: http://www.ers.usda.gov/publications/vgs/tables/price.pdf Excel file: http://www.ers.usda.gov/publications/vgs/tables/price.xls 3. Fresh vegetables and melons PDF file: http://www.ers.usda.gov/publications/vgs/tables/fresh.pdf Excel file: http://www.ers.usda.gov/publications/vgs/tables/fresh.xls 4. Processing vegetables PDF file: http://www.ers.usda.gov/publications/vgs/tables/proc.pdf Excel file: http://www.ers.usda.gov/publications/vgs/tables/proc.xls 5. Potatoes PDF file: http://www.ers.usda.gov/publications/vgs/tables/potat.pdf Excel file: http://www.ers.usda.gov/publications/vgs/tables/potat.xls 6. Sweet potatoes PDF file: http://www.ers.usda.gov/publications/vgs/tables/swpot.pdf Excel file: http://www.ers.usda.gov/publications/vgs/tables/swpot.xls 7. Dry edible beans PDF file: http://www.ers.usda.gov/publications/vgs/tables/drybn.pdf Excel file: http://www.ers.usda.gov/publications/vgs/tables/drybn.xls 8. Mushrooms PDF file: http://www.ers.usda.gov/publications/vgs/tables/mush.pdf Excel file: http://www.ers.usda.gov/publications/vgs/tables/mush.xls 9. Vegetable and melon trade PDF file: http://www.ers.usda.gov/publications/vgs/tables/trade.pdf Excel file: http://www.ers.usda.gov/publications/vgs/tables/trade.xls 10. Dry peas and lentils PDF file: http://www.ers.usda.gov/publications/vgs/tables/drypea.pdf Excel file: http://www.ers.usda.gov/publications/vgs/tables/drypea.xls 11. World vegetable production and harvested area PDF file: http://www.ers.usda.gov/publications/vgs/tables/world.pdf Excel file: http://www.ers.usda.gov/publications/vgs/tables/world.xls
31 Vegetables and Melons Outlook/VGS-318/December 14, 2006
Economic Research Service, USDA
12. Mexican and Canadian vegetable production PDF file: http://www.ers.usda.gov/publications/vgs/tables/Mexcan.pdf Excel file: http://www.ers.usda.gov/publications/vgs/tables/Mexcan.xls 13. U.S. farm cash receipts and cost indicators PDF file: http://www.ers.usda.gov/publications/vgs/tables/Receipt.pdf Excel file: http://www.ers.usda.gov/publications/vgs/tables/Receipt.xls Web Sites A. Vegetables and Melons: ERS’ Vegetables and Melons Briefing Room contains special articles, data, and links. http://www.ers.usda.gov/briefing/vegetables/ B. Potatoes: ERS’ Potato Briefing Room contains special articles, data, and links. http://www.ers.usda.gov/briefing/potatoes/ C. Tomatoes: ERS’ Tomato Briefing Room contains special articles, data, and links. http://www.ers.usda.gov/briefing/tomatoes/ D. Dry Beans: ERS’ Dry Bean Briefing Room contains special articles, data, and links. http://www.ers.usda.gov/briefing/drybeans/ E. USDA Market News: Agricultural Marketing Service’s web site containing fresh shipments, f.o.b. and terminal market prices, weekly truck rates, annual reports, and more. http://www.ams.usda.gov/fv/mncs/index.htm F. NASS Vegetables: Links to USDA, National Agricultural Statistics Service’s annual and quarterly reports on vegetables & melons. http://usda.mannlib.cornell.edu/MannUsda/viewDocumentInfo.do?documentID=1177 G. FAS, HTP: USDA, Foreign Agricultural Service’s Horticultural and Tropical Products web site. http://www.fas.usda.gov/htp/default.htm H. Organic Farming and Marketing: USDA, ERS Briefing Room contains articles, data, graphics, and links. http://www.ers.usda.gov/Briefing/Organic/ I. Truck Rate Report: USDA, AMS weekly report on cost of shipping by trailer truck. http://www.ams.usda.gov/mnreports/wa_fv190.txt
The U.S. Department of Agriculture (USDA) prohibits discrimination in all its programs and activities on the basis of race, color, national origin, age, disability, and, where applicable, sex, marital status, familial status, parental status, religion, sexual orientation, genetic information, political beliefs, reprisal, or because all or a part of an individual's income is derived from any public assistance program. (Not all prohibited bases apply to all programs.) Persons with disabilities who require alternative means for communication of program information (Braille, large print, audiotape, etc.) should contact USDA's TARGET Center at (202) 720-2600 (voice and TDD). To file a complaint of discrimination write to USDA, Director, Office of Civil Rights, 1400 Independence Avenue, S.W., Washington, D.C. 20250-9410 or call (800) 795-3272 (voice) or (202) 720-6382 (TDD). USDA is an equal opportunity provider and employer.

Price table 1—Commercial vegetables and potatoes: Indexes of prices received by U.S. growers, by month, 1995-2006 1/ Item Year Jan. Feb. Mar. Apr. May June July Aug. Sep. Oct. Nov. Dec. Annual
--1910-14=100--
Commercial 1995 803 772 989 1,161 1,037 808 653 680 781 651 658 678 806 vegetables 2/ 1996 631 742 986 818 691 774 661 775 679 727 747 643 740
1997 740 700 789 754 710 751 747 817 794 971 817 911 7921998 816 775 837 1,042 859 736 806 764 760 886 756 779 8181999 702 749 806 870 786 732 696 709 700 650 654 776 7362000 656 572 719 907 874 785 795 862 958 835 964 769 8082001 810 980 923 916 964 805 837 968 894 688 731 1,144 8882002 1,054 1,283 1,816 803 770 731 771 807 795 704 735 694 9142003 756 763 830 878 935 1,024 805 925 969 962 1,048 1,177 9232004 849 966 773 884 753 747 836 889 901 1,067 1,112 807 8822005 636 806 1,096 1,230 897 942 765 801 884 769 791 1,132 8962006 874 835 966 1,081 1,067 870 814 1,009 1,084 860 825
Potatoes 3/ 1995 466 450 484 505 529 612 729 586 497 539 548 547 5411996 564 589 633 668 696 707 700 521 482 461 452 434 5761997 426 431 433 433 477 431 499 544 440 433 457 477 4571998 491 524 554 546 559 539 517 481 449 415 450 475 5001999 489 497 520 546 532 557 610 517 451 429 474 463 5072000 475 496 519 545 529 511 559 464 406 384 383 395 4722001 409 450 437 466 453 486 532 632 516 461 538 578 4972002 620 645 715 699 748 806 884 651 520 466 524 547 6522003 533 554 567 592 590 559 570 483 458 443 479 493 5272004 488 504 530 568 558 558 552 495 485 444 477 506 5142005 535 535 578 566 576 573 622 574 491 472 533 576 5532006 596 622 683 671 678 716 901 672 542 520 559
--1990-92=100--
Commercial 1995 120 116 148 174 155 121 98 102 117 97 98 101 121 vegetables 2/ 1996 94 111 147 122 103 116 99 116 102 109 112 96 111
1997 111 105 118 113 106 112 112 122 119 145 122 136 1181998 122 116 125 156 129 110 121 114 114 133 113 117 1231999 105 112 121 130 118 110 104 106 105 97 98 116 1102000 98 86 107 136 131 117 119 129 143 125 144 115 1212001 121 147 138 137 144 120 125 145 134 103 109 171 1332002 158 192 272 120 115 109 115 121 119 105 110 104 1372003 113 114 124 131 140 153 120 138 145 144 157 176 1382004 127 144 116 132 113 112 125 133 135 160 166 121 1322005 95 121 164 184 134 141 114 120 132 115 118 169 1342006 131 125 145 162 160 130 122 151 162 129 124
Potatoes 3/ 1995 92 89 96 100 105 121 144 116 98 106 108 108 1071996 111 116 125 132 138 140 138 103 95 91 89 86 1141997 84 85 86 85 94 85 99 107 87 85 90 94 901998 97 104 109 108 111 106 102 95 89 82 89 94 991999 97 98 103 108 105 110 121 102 89 85 94 91 1002000 94 98 103 108 105 101 110 92 80 76 76 78 932001 81 89 86 92 90 96 105 125 102 91 106 114 982002 123 127 141 138 148 159 175 129 103 92 104 108 1292003 105 110 112 117 117 110 113 96 90 87 95 97 1042004 96 100 105 112 110 110 109 98 96 88 94 100 1022005 106 106 114 112 114 113 123 113 97 93 105 114 1092006 118 123 135 133 134 141 178 133 107 103 110
1/ Prices for 2006 are preliminary. 2/ Includes fresh and processing vegetables. 3/ Includes fresh potatoes and dry edible beans. For longer historical price series, see the Vegetables and Melons Situation and Outlook Yearbook at: http://usda.mannlib.cornell.edu/MannUsda/viewDocumentInfo.do?documentID=1212
Source: USDA, National Agricultural Statistics Service, Agricultural Prices.
32Vegetables and Melons Outlook /VGS-318/December 14, 2006
Economic Research Service, USDA
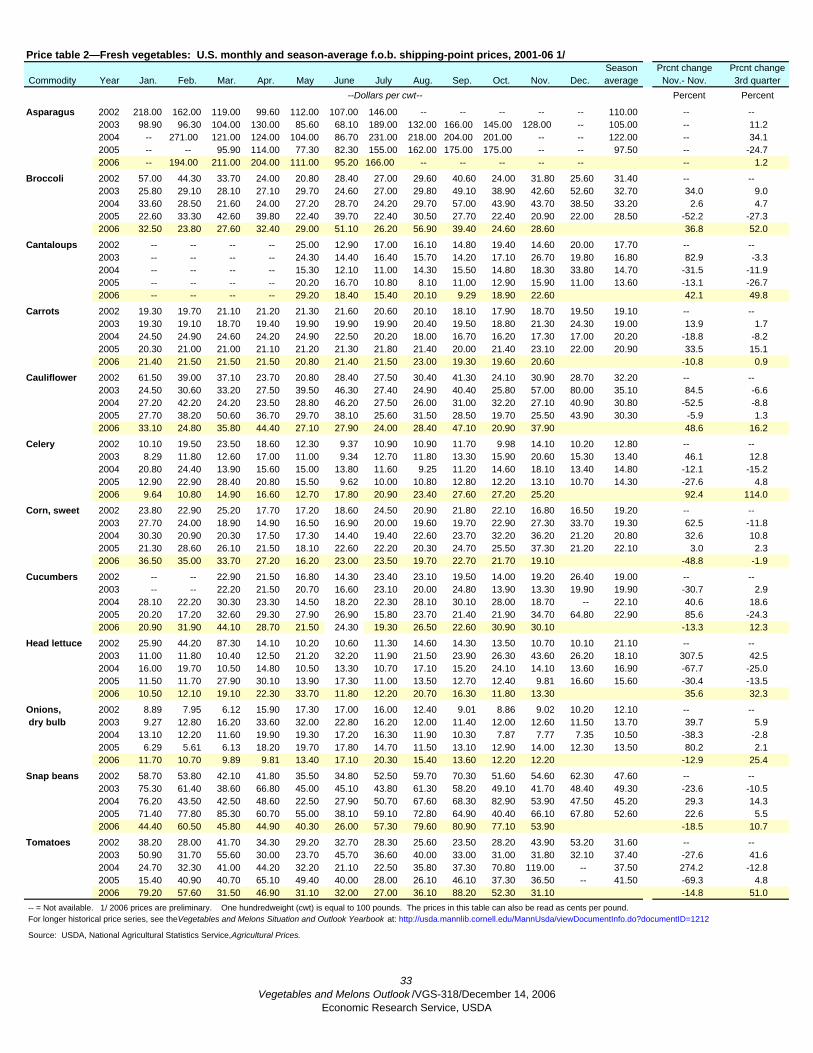
Price table 2—Fresh vegetables: U.S. monthly and season-average f.o.b. shipping-point prices, 2001-06 1/Season Prcnt change Prcnt change
Commodity Year Jan. Feb. Mar. Apr. May June July Aug. Sep. Oct. Nov. Dec. average Nov.- Nov. 3rd quarter--Dollars per cwt-- Percent Percent
Asparagus 2002 218.00 162.00 119.00 99.60 112.00 107.00 146.00 -- -- -- -- -- 110.00 -- --2003 98.90 96.30 104.00 130.00 85.60 68.10 189.00 132.00 166.00 145.00 128.00 -- 105.00 -- 11.22004 -- 271.00 121.00 124.00 104.00 86.70 231.00 218.00 204.00 201.00 -- -- 122.00 -- 34.12005 -- -- 95.90 114.00 77.30 82.30 155.00 162.00 175.00 175.00 -- -- 97.50 -- -24.72006 -- 194.00 211.00 204.00 111.00 95.20 166.00 -- -- -- -- -- -- 1.2
Broccoli 2002 57.00 44.30 33.70 24.00 20.80 28.40 27.00 29.60 40.60 24.00 31.80 25.60 31.40 -- --2003 25.80 29.10 28.10 27.10 29.70 24.60 27.00 29.80 49.10 38.90 42.60 52.60 32.70 34.0 9.02004 33.60 28.50 21.60 24.00 27.20 28.70 24.20 29.70 57.00 43.90 43.70 38.50 33.20 2.6 4.72005 22.60 33.30 42.60 39.80 22.40 39.70 22.40 30.50 27.70 22.40 20.90 22.00 28.50 -52.2 -27.32006 32.50 23.80 27.60 32.40 29.00 51.10 26.20 56.90 39.40 24.60 28.60 36.8 52.0
Cantaloups 2002 -- -- -- -- 25.00 12.90 17.00 16.10 14.80 19.40 14.60 20.00 17.70 -- --2003 -- -- -- -- 24.30 14.40 16.40 15.70 14.20 17.10 26.70 19.80 16.80 82.9 -3.32004 -- -- -- -- 15.30 12.10 11.00 14.30 15.50 14.80 18.30 33.80 14.70 -31.5 -11.92005 -- -- -- -- 20.20 16.70 10.80 8.10 11.00 12.90 15.90 11.00 13.60 -13.1 -26.72006 -- -- -- -- 29.20 18.40 15.40 20.10 9.29 18.90 22.60 42.1 49.8
Carrots 2002 19.30 19.70 21.10 21.20 21.30 21.60 20.60 20.10 18.10 17.90 18.70 19.50 19.10 -- --2003 19.30 19.10 18.70 19.40 19.90 19.90 19.90 20.40 19.50 18.80 21.30 24.30 19.00 13.9 1.72004 24.50 24.90 24.60 24.20 24.90 22.50 20.20 18.00 16.70 16.20 17.30 17.00 20.20 -18.8 -8.22005 20.30 21.00 21.00 21.10 21.20 21.30 21.80 21.40 20.00 21.40 23.10 22.00 20.90 33.5 15.12006 21.40 21.50 21.50 21.50 20.80 21.40 21.50 23.00 19.30 19.60 20.60 -10.8 0.9
Cauliflower 2002 61.50 39.00 37.10 23.70 20.80 28.40 27.50 30.40 41.30 24.10 30.90 28.70 32.20 -- --2003 24.50 30.60 33.20 27.50 39.50 46.30 27.40 24.90 40.40 25.80 57.00 80.00 35.10 84.5 -6.62004 27.20 42.20 24.20 23.50 28.80 46.20 27.50 26.00 31.00 32.20 27.10 40.90 30.80 -52.5 -8.82005 27.70 38.20 50.60 36.70 29.70 38.10 25.60 31.50 28.50 19.70 25.50 43.90 30.30 -5.9 1.32006 33.10 24.80 35.80 44.40 27.10 27.90 24.00 28.40 47.10 20.90 37.90 48.6 16.2
Celery 2002 10.10 19.50 23.50 18.60 12.30 9.37 10.90 10.90 11.70 9.98 14.10 10.20 12.80 -- --2003 8.29 11.80 12.60 17.00 11.00 9.34 12.70 11.80 13.30 15.90 20.60 15.30 13.40 46.1 12.82004 20.80 24.40 13.90 15.60 15.00 13.80 11.60 9.25 11.20 14.60 18.10 13.40 14.80 -12.1 -15.22005 12.90 22.90 28.40 20.80 15.50 9.62 10.00 10.80 12.80 12.20 13.10 10.70 14.30 -27.6 4.82006 9.64 10.80 14.90 16.60 12.70 17.80 20.90 23.40 27.60 27.20 25.20 92.4 114.0
Corn, sweet 2002 23.80 22.90 25.20 17.70 17.20 18.60 24.50 20.90 21.80 22.10 16.80 16.50 19.20 -- --2003 27.70 24.00 18.90 14.90 16.50 16.90 20.00 19.60 19.70 22.90 27.30 33.70 19.30 62.5 -11.82004 30.30 20.90 20.30 17.50 17.30 14.40 19.40 22.60 23.70 32.20 36.20 21.20 20.80 32.6 10.82005 21.30 28.60 26.10 21.50 18.10 22.60 22.20 20.30 24.70 25.50 37.30 21.20 22.10 3.0 2.32006 36.50 35.00 33.70 27.20 16.20 23.00 23.50 19.70 22.70 21.70 19.10 -48.8 -1.9
Cucumbers 2002 -- -- 22.90 21.50 16.80 14.30 23.40 23.10 19.50 14.00 19.20 26.40 19.00 -- --2003 -- -- 22.20 21.50 20.70 16.60 23.10 20.00 24.80 13.90 13.30 19.90 19.90 -30.7 2.92004 28.10 22.20 30.30 23.30 14.50 18.20 22.30 28.10 30.10 28.00 18.70 -- 22.10 40.6 18.62005 20.20 17.20 32.60 29.30 27.90 26.90 15.80 23.70 21.40 21.90 34.70 64.80 22.90 85.6 -24.32006 20.90 31.90 44.10 28.70 21.50 24.30 19.30 26.50 22.60 30.90 30.10 -13.3 12.3
Head lettuce 2002 25.90 44.20 87.30 14.10 10.20 10.60 11.30 14.60 14.30 13.50 10.70 10.10 21.10 -- --2003 11.00 11.80 10.40 12.50 21.20 32.20 11.90 21.50 23.90 26.30 43.60 26.20 18.10 307.5 42.52004 16.00 19.70 10.50 14.80 10.50 13.30 10.70 17.10 15.20 24.10 14.10 13.60 16.90 -67.7 -25.02005 11.50 11.70 27.90 30.10 13.90 17.30 11.00 13.50 12.70 12.40 9.81 16.60 15.60 -30.4 -13.52006 10.50 12.10 19.10 22.30 33.70 11.80 12.20 20.70 16.30 11.80 13.30 35.6 32.3
Onions, 2002 8.89 7.95 6.12 15.90 17.30 17.00 16.00 12.40 9.01 8.86 9.02 10.20 12.10 -- -- dry bulb 2003 9.27 12.80 16.20 33.60 32.00 22.80 16.20 12.00 11.40 12.00 12.60 11.50 13.70 39.7 5.9
2004 13.10 12.20 11.60 19.90 19.30 17.20 16.30 11.90 10.30 7.87 7.77 7.35 10.50 -38.3 -2.82005 6.29 5.61 6.13 18.20 19.70 17.80 14.70 11.50 13.10 12.90 14.00 12.30 13.50 80.2 2.12006 11.70 10.70 9.89 9.81 13.40 17.10 20.30 15.40 13.60 12.20 12.20 -12.9 25.4
Snap beans 2002 58.70 53.80 42.10 41.80 35.50 34.80 52.50 59.70 70.30 51.60 54.60 62.30 47.60 -- --2003 75.30 61.40 38.60 66.80 45.00 45.10 43.80 61.30 58.20 49.10 41.70 48.40 49.30 -23.6 -10.52004 76.20 43.50 42.50 48.60 22.50 27.90 50.70 67.60 68.30 82.90 53.90 47.50 45.20 29.3 14.32005 71.40 77.80 85.30 60.70 55.00 38.10 59.10 72.80 64.90 40.40 66.10 67.80 52.60 22.6 5.52006 44.40 60.50 45.80 44.90 40.30 26.00 57.30 79.60 80.90 77.10 53.90 -18.5 10.7
Tomatoes 2002 38.20 28.00 41.70 34.30 29.20 32.70 28.30 25.60 23.50 28.20 43.90 53.20 31.60 -- --2003 50.90 31.70 55.60 30.00 23.70 45.70 36.60 40.00 33.00 31.00 31.80 32.10 37.40 -27.6 41.62004 24.70 32.30 41.00 44.20 32.20 21.10 22.50 35.80 37.30 70.80 119.00 -- 37.50 274.2 -12.82005 15.40 40.90 40.70 65.10 49.40 40.00 28.00 26.10 46.10 37.30 36.50 -- 41.50 -69.3 4.82006 79.20 57.60 31.50 46.90 31.10 32.00 27.00 36.10 88.20 52.30 31.10 -14.8 51.0
-- = Not available. 1/ 2006 prices are preliminary. One hundredweight (cwt) is equal to 100 pounds. The prices in this table can also be read as cents per pound. For longer historical price series, see the Vegetables and Melons Situation and Outlook Yearbook at: http://usda.mannlib.cornell.edu/MannUsda/viewDocumentInfo.do?documentID=1212
Source: USDA, National Agricultural Statistics Service, Agricultural Prices.
33Vegetables and Melons Outlook /VGS-318/December 14, 2006
Economic Research Service, USDA
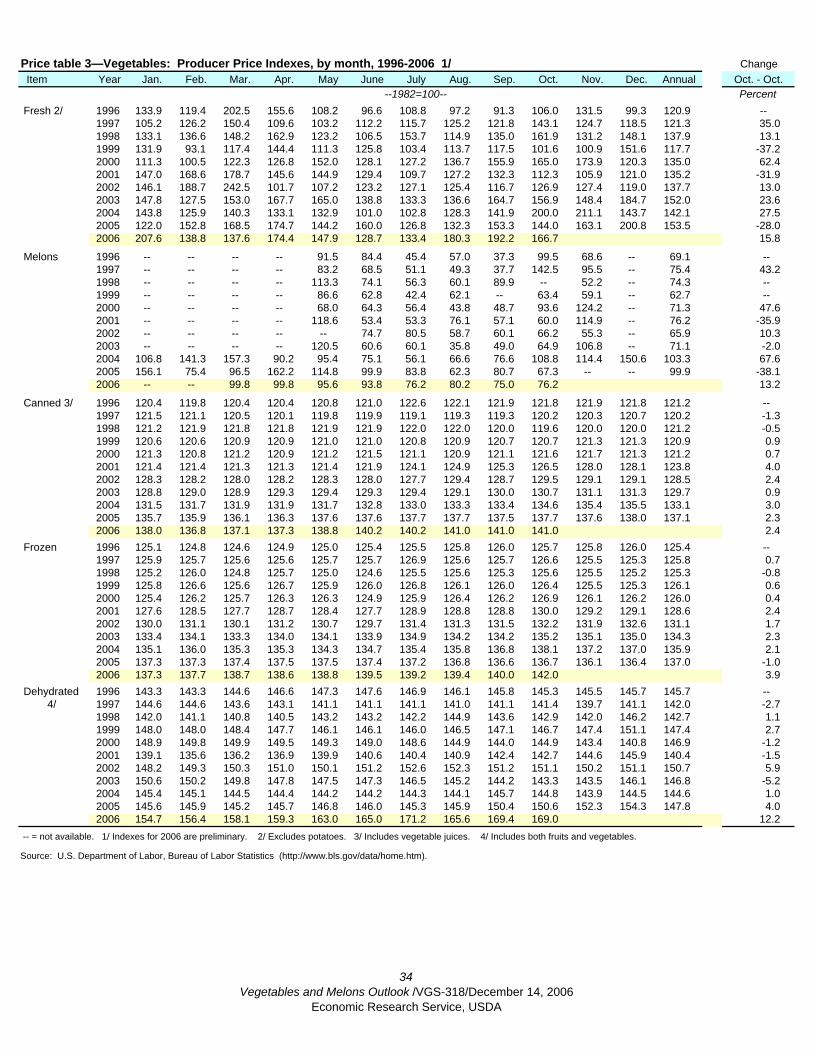
Price table 3—Vegetables: Producer Price Indexes, by month, 1996-2006 1/ Change Item Year Jan. Feb. Mar. Apr. May June July Aug. Sep. Oct. Nov. Dec. Annual Oct. - Oct.
--1982=100-- Percent Fresh 2/ 1996 133.9 119.4 202.5 155.6 108.2 96.6 108.8 97.2 91.3 106.0 131.5 99.3 120.9 --
1997 105.2 126.2 150.4 109.6 103.2 112.2 115.7 125.2 121.8 143.1 124.7 118.5 121.3 35.01998 133.1 136.6 148.2 162.9 123.2 106.5 153.7 114.9 135.0 161.9 131.2 148.1 137.9 13.11999 131.9 93.1 117.4 144.4 111.3 125.8 103.4 113.7 117.5 101.6 100.9 151.6 117.7 -37.22000 111.3 100.5 122.3 126.8 152.0 128.1 127.2 136.7 155.9 165.0 173.9 120.3 135.0 62.42001 147.0 168.6 178.7 145.6 144.9 129.4 109.7 127.2 132.3 112.3 105.9 121.0 135.2 -31.92002 146.1 188.7 242.5 101.7 107.2 123.2 127.1 125.4 116.7 126.9 127.4 119.0 137.7 13.02003 147.8 127.5 153.0 167.7 165.0 138.8 133.3 136.6 164.7 156.9 148.4 184.7 152.0 23.62004 143.8 125.9 140.3 133.1 132.9 101.0 102.8 128.3 141.9 200.0 211.1 143.7 142.1 27.52005 122.0 152.8 168.5 174.7 144.2 160.0 126.8 132.3 153.3 144.0 163.1 200.8 153.5 -28.02006 207.6 138.8 137.6 174.4 147.9 128.7 133.4 180.3 192.2 166.7 15.8
Melons 1996 -- -- -- -- 91.5 84.4 45.4 57.0 37.3 99.5 68.6 -- 69.1 --1997 -- -- -- -- 83.2 68.5 51.1 49.3 37.7 142.5 95.5 -- 75.4 43.21998 -- -- -- -- 113.3 74.1 56.3 60.1 89.9 -- 52.2 -- 74.3 --1999 -- -- -- -- 86.6 62.8 42.4 62.1 -- 63.4 59.1 -- 62.7 --2000 -- -- -- -- 68.0 64.3 56.4 43.8 48.7 93.6 124.2 -- 71.3 47.62001 -- -- -- -- 118.6 53.4 53.3 76.1 57.1 60.0 114.9 -- 76.2 -35.92002 -- -- -- -- -- 74.7 80.5 58.7 60.1 66.2 55.3 -- 65.9 10.32003 -- -- -- -- 120.5 60.6 60.1 35.8 49.0 64.9 106.8 -- 71.1 -2.02004 106.8 141.3 157.3 90.2 95.4 75.1 56.1 66.6 76.6 108.8 114.4 150.6 103.3 67.62005 156.1 75.4 96.5 162.2 114.8 99.9 83.8 62.3 80.7 67.3 -- -- 99.9 -38.12006 -- -- 99.8 99.8 95.6 93.8 76.2 80.2 75.0 76.2 13.2
Canned 3/ 1996 120.4 119.8 120.4 120.4 120.8 121.0 122.6 122.1 121.9 121.8 121.9 121.8 121.2 --1997 121.5 121.1 120.5 120.1 119.8 119.9 119.1 119.3 119.3 120.2 120.3 120.7 120.2 -1.31998 121.2 121.9 121.8 121.8 121.9 121.9 122.0 122.0 120.0 119.6 120.0 120.0 121.2 -0.51999 120.6 120.6 120.9 120.9 121.0 121.0 120.8 120.9 120.7 120.7 121.3 121.3 120.9 0.92000 121.3 120.8 121.2 120.9 121.2 121.5 121.1 120.9 121.1 121.6 121.7 121.3 121.2 0.72001 121.4 121.4 121.3 121.3 121.4 121.9 124.1 124.9 125.3 126.5 128.0 128.1 123.8 4.02002 128.3 128.2 128.0 128.2 128.3 128.0 127.7 129.4 128.7 129.5 129.1 129.1 128.5 2.42003 128.8 129.0 128.9 129.3 129.4 129.3 129.4 129.1 130.0 130.7 131.1 131.3 129.7 0.92004 131.5 131.7 131.9 131.9 131.7 132.8 133.0 133.3 133.4 134.6 135.4 135.5 133.1 3.02005 135.7 135.9 136.1 136.3 137.6 137.6 137.7 137.7 137.5 137.7 137.6 138.0 137.1 2.32006 138.0 136.8 137.1 137.3 138.8 140.2 140.2 141.0 141.0 141.0 2.4
Frozen 1996 125.1 124.8 124.6 124.9 125.0 125.4 125.5 125.8 126.0 125.7 125.8 126.0 125.4 --1997 125.9 125.7 125.6 125.6 125.7 125.7 126.9 125.6 125.7 126.6 125.5 125.3 125.8 0.71998 125.2 126.0 124.8 125.7 125.0 124.6 125.5 125.6 125.3 125.6 125.5 125.2 125.3 -0.81999 125.8 126.6 125.6 126.7 125.9 126.0 126.8 126.1 126.0 126.4 125.5 125.3 126.1 0.62000 125.4 126.2 125.7 126.3 126.3 124.9 125.9 126.4 126.2 126.9 126.1 126.2 126.0 0.42001 127.6 128.5 127.7 128.7 128.4 127.7 128.9 128.8 128.8 130.0 129.2 129.1 128.6 2.42002 130.0 131.1 130.1 131.2 130.7 129.7 131.4 131.3 131.5 132.2 131.9 132.6 131.1 1.72003 133.4 134.1 133.3 134.0 134.1 133.9 134.9 134.2 134.2 135.2 135.1 135.0 134.3 2.32004 135.1 136.0 135.3 135.3 134.3 134.7 135.4 135.8 136.8 138.1 137.2 137.0 135.9 2.12005 137.3 137.3 137.4 137.5 137.5 137.4 137.2 136.8 136.6 136.7 136.1 136.4 137.0 -1.02006 137.3 137.7 138.7 138.6 138.8 139.5 139.2 139.4 140.0 142.0 3.9
Dehydrated 1996 143.3 143.3 144.6 146.6 147.3 147.6 146.9 146.1 145.8 145.3 145.5 145.7 145.7 -- 4/ 1997 144.6 144.6 143.6 143.1 141.1 141.1 141.1 141.0 141.1 141.4 139.7 141.1 142.0 -2.7
1998 142.0 141.1 140.8 140.5 143.2 143.2 142.2 144.9 143.6 142.9 142.0 146.2 142.7 1.11999 148.0 148.0 148.4 147.7 146.1 146.1 146.0 146.5 147.1 146.7 147.4 151.1 147.4 2.72000 148.9 149.8 149.9 149.5 149.3 149.0 148.6 144.9 144.0 144.9 143.4 140.8 146.9 -1.22001 139.1 135.6 136.2 136.9 139.9 140.6 140.4 140.9 142.4 142.7 144.6 145.9 140.4 -1.52002 148.2 149.3 150.3 151.0 150.1 151.2 152.6 152.3 151.2 151.1 150.2 151.1 150.7 5.92003 150.6 150.2 149.8 147.8 147.5 147.3 146.5 145.2 144.2 143.3 143.5 146.1 146.8 -5.22004 145.4 145.1 144.5 144.4 144.2 144.2 144.3 144.1 145.7 144.8 143.9 144.5 144.6 1.02005 145.6 145.9 145.2 145.7 146.8 146.0 145.3 145.9 150.4 150.6 152.3 154.3 147.8 4.02006 154.7 156.4 158.1 159.3 163.0 165.0 171.2 165.6 169.4 169.0 12.2
-- = not available. 1/ Indexes for 2006 are preliminary. 2/ Excludes potatoes. 3/ Includes vegetable juices. 4/ Includes both fruits and vegetables.
Source: U.S. Department of Labor, Bureau of Labor Statistics (http://www.bls.gov/data/home.htm).
34Vegetables and Melons Outlook /VGS-318/December 14, 2006
Economic Research Service, USDA
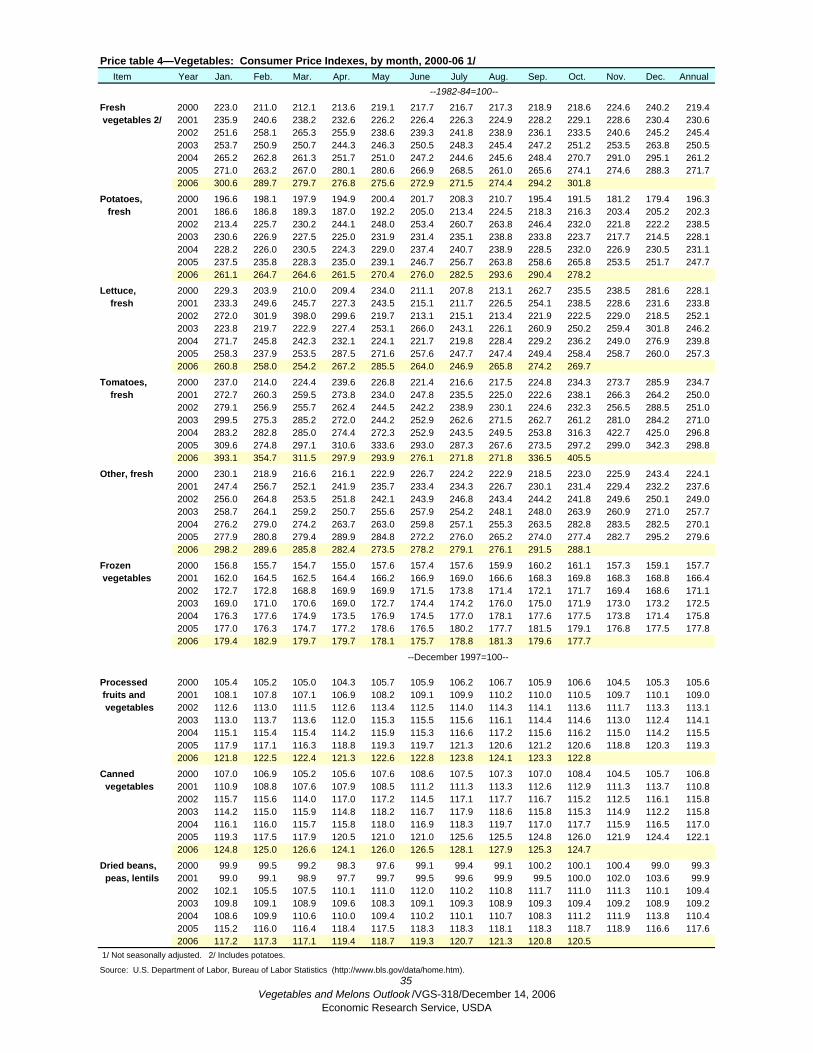
Price table 4—Vegetables: Consumer Price Indexes, by month, 2000-06 1/ Item Year Jan. Feb. Mar. Apr. May June July Aug. Sep. Oct. Nov. Dec. Annual
--1982-84=100--
Fresh 2000 223.0 211.0 212.1 213.6 219.1 217.7 216.7 217.3 218.9 218.6 224.6 240.2 219.4 vegetables 2/ 2001 235.9 240.6 238.2 232.6 226.2 226.4 226.3 224.9 228.2 229.1 228.6 230.4 230.6
2002 251.6 258.1 265.3 255.9 238.6 239.3 241.8 238.9 236.1 233.5 240.6 245.2 245.42003 253.7 250.9 250.7 244.3 246.3 250.5 248.3 245.4 247.2 251.2 253.5 263.8 250.52004 265.2 262.8 261.3 251.7 251.0 247.2 244.6 245.6 248.4 270.7 291.0 295.1 261.22005 271.0 263.2 267.0 280.1 280.6 266.9 268.5 261.0 265.6 274.1 274.6 288.3 271.72006 300.6 289.7 279.7 276.8 275.6 272.9 271.5 274.4 294.2 301.8
Potatoes, 2000 196.6 198.1 197.9 194.9 200.4 201.7 208.3 210.7 195.4 191.5 181.2 179.4 196.3 fresh 2001 186.6 186.8 189.3 187.0 192.2 205.0 213.4 224.5 218.3 216.3 203.4 205.2 202.3
2002 213.4 225.7 230.2 244.1 248.0 253.4 260.7 263.8 246.4 232.0 221.8 222.2 238.52003 230.6 226.9 227.5 225.0 231.9 231.4 235.1 238.8 233.8 223.7 217.7 214.5 228.12004 228.2 226.0 230.5 224.3 229.0 237.4 240.7 238.9 228.5 232.0 226.9 230.5 231.12005 237.5 235.8 228.3 235.0 239.1 246.7 256.7 263.8 258.6 265.8 253.5 251.7 247.72006 261.1 264.7 264.6 261.5 270.4 276.0 282.5 293.6 290.4 278.2
Lettuce, 2000 229.3 203.9 210.0 209.4 234.0 211.1 207.8 213.1 262.7 235.5 238.5 281.6 228.1 fresh 2001 233.3 249.6 245.7 227.3 243.5 215.1 211.7 226.5 254.1 238.5 228.6 231.6 233.8
2002 272.0 301.9 398.0 299.6 219.7 213.1 215.1 213.4 221.9 222.5 229.0 218.5 252.12003 223.8 219.7 222.9 227.4 253.1 266.0 243.1 226.1 260.9 250.2 259.4 301.8 246.22004 271.7 245.8 242.3 232.1 224.1 221.7 219.8 228.4 229.2 236.2 249.0 276.9 239.82005 258.3 237.9 253.5 287.5 271.6 257.6 247.7 247.4 249.4 258.4 258.7 260.0 257.32006 260.8 258.0 254.2 267.2 285.5 264.0 246.9 265.8 274.2 269.7
Tomatoes, 2000 237.0 214.0 224.4 239.6 226.8 221.4 216.6 217.5 224.8 234.3 273.7 285.9 234.7 fresh 2001 272.7 260.3 259.5 273.8 234.0 247.8 235.5 225.0 222.6 238.1 266.3 264.2 250.0
2002 279.1 256.9 255.7 262.4 244.5 242.2 238.9 230.1 224.6 232.3 256.5 288.5 251.02003 299.5 275.3 285.2 272.0 244.2 252.9 262.6 271.5 262.7 261.2 281.0 284.2 271.02004 283.2 282.8 285.0 274.4 272.3 252.9 243.5 249.5 253.8 316.3 422.7 425.0 296.82005 309.6 274.8 297.1 310.6 333.6 293.0 287.3 267.6 273.5 297.2 299.0 342.3 298.82006 393.1 354.7 311.5 297.9 293.9 276.1 271.8 271.8 336.5 405.5
Other, fresh 2000 230.1 218.9 216.6 216.1 222.9 226.7 224.2 222.9 218.5 223.0 225.9 243.4 224.12001 247.4 256.7 252.1 241.9 235.7 233.4 234.3 226.7 230.1 231.4 229.4 232.2 237.62002 256.0 264.8 253.5 251.8 242.1 243.9 246.8 243.4 244.2 241.8 249.6 250.1 249.02003 258.7 264.1 259.2 250.7 255.6 257.9 254.2 248.1 248.0 263.9 260.9 271.0 257.72004 276.2 279.0 274.2 263.7 263.0 259.8 257.1 255.3 263.5 282.8 283.5 282.5 270.12005 277.9 280.8 279.4 289.9 284.8 272.2 276.0 265.2 274.0 277.4 282.7 295.2 279.62006 298.2 289.6 285.8 282.4 273.5 278.2 279.1 276.1 291.5 288.1
Frozen 2000 156.8 155.7 154.7 155.0 157.6 157.4 157.6 159.9 160.2 161.1 157.3 159.1 157.7 vegetables 2001 162.0 164.5 162.5 164.4 166.2 166.9 169.0 166.6 168.3 169.8 168.3 168.8 166.4
2002 172.7 172.8 168.8 169.9 169.9 171.5 173.8 171.4 172.1 171.7 169.4 168.6 171.12003 169.0 171.0 170.6 169.0 172.7 174.4 174.2 176.0 175.0 171.9 173.0 173.2 172.52004 176.3 177.6 174.9 173.5 176.9 174.5 177.0 178.1 177.6 177.5 173.8 171.4 175.82005 177.0 176.3 174.7 177.2 178.6 176.5 180.2 177.7 181.5 179.1 176.8 177.5 177.82006 179.4 182.9 179.7 179.7 178.1 175.7 178.8 181.3 179.6 177.7
--December 1997=100--
Processed 2000 105.4 105.2 105.0 104.3 105.7 105.9 106.2 106.7 105.9 106.6 104.5 105.3 105.6 fruits and 2001 108.1 107.8 107.1 106.9 108.2 109.1 109.9 110.2 110.0 110.5 109.7 110.1 109.0 vegetables 2002 112.6 113.0 111.5 112.6 113.4 112.5 114.0 114.3 114.1 113.6 111.7 113.3 113.1
2003 113.0 113.7 113.6 112.0 115.3 115.5 115.6 116.1 114.4 114.6 113.0 112.4 114.12004 115.1 115.4 115.4 114.2 115.9 115.3 116.6 117.2 115.6 116.2 115.0 114.2 115.52005 117.9 117.1 116.3 118.8 119.3 119.7 121.3 120.6 121.2 120.6 118.8 120.3 119.32006 121.8 122.5 122.4 121.3 122.6 122.8 123.8 124.1 123.3 122.8
Canned 2000 107.0 106.9 105.2 105.6 107.6 108.6 107.5 107.3 107.0 108.4 104.5 105.7 106.8 vegetables 2001 110.9 108.8 107.6 107.9 108.5 111.2 111.3 113.3 112.6 112.9 111.3 113.7 110.8
2002 115.7 115.6 114.0 117.0 117.2 114.5 117.1 117.7 116.7 115.2 112.5 116.1 115.82003 114.2 115.0 115.9 114.8 118.2 116.7 117.9 118.6 115.8 115.3 114.9 112.2 115.82004 116.1 116.0 115.7 115.8 118.0 116.9 118.3 119.7 117.0 117.7 115.9 116.5 117.02005 119.3 117.5 117.9 120.5 121.0 121.0 125.6 125.5 124.8 126.0 121.9 124.4 122.12006 124.8 125.0 126.6 124.1 126.0 126.5 128.1 127.9 125.3 124.7
Dried beans, 2000 99.9 99.5 99.2 98.3 97.6 99.1 99.4 99.1 100.2 100.1 100.4 99.0 99.3 peas, lentils 2001 99.0 99.1 98.9 97.7 99.7 99.5 99.6 99.9 99.5 100.0 102.0 103.6 99.9
2002 102.1 105.5 107.5 110.1 111.0 112.0 110.2 110.8 111.7 111.0 111.3 110.1 109.42003 109.8 109.1 108.9 109.6 108.3 109.1 109.3 108.9 109.3 109.4 109.2 108.9 109.22004 108.6 109.9 110.6 110.0 109.4 110.2 110.1 110.7 108.3 111.2 111.9 113.8 110.42005 115.2 116.0 116.4 118.4 117.5 118.3 118.3 118.1 118.3 118.7 118.9 116.6 117.62006 117.2 117.3 117.1 119.4 118.7 119.3 120.7 121.3 120.8 120.5
1/ Not seasonally adjusted. 2/ Includes potatoes.
Source: U.S. Department of Labor, Bureau of Labor Statistics (http://www.bls.gov/data/home.htm).35
Vegetables and Melons Outlook /VGS-318/December 14, 2006Economic Research Service, USDA

Price table 5—Fresh-market vegetables: U.S. average retail prices, by month, 1997-2006 Change
Item Year Jan. Feb. Mar. Apr. May June July Aug. Sep. Oct. Nov. Dec. Annual Oct.- Oct.--Cents/lb.-- Percent
Potatoes, 1997 33.5 33.1 33.0 33.5 33.8 34.5 36.7 38.8 38.8 37.4 36.6 37.0 35.6 --white 1998 36.2 36.2 36.8 36.9 38.1 39.0 39.2 38.2 37.6 37.9 37.0 37.5 37.6 1.3
1999 38.1 38.2 38.4 38.0 38.8 39.1 41.1 42.9 41.3 39.3 38.4 39.5 39.4 3.72000 39.2 40.1 39.3 38.8 37.9 37.6 39.0 40.0 37.4 36.7 35.1 34.7 38.0 -6.62001 35.5 34.8 35.6 36.2 36.3 38.8 40.9 43.9 42.2 41.8 41.0 41.0 39.0 13.92002 42.6 44.7 46.5 49.3 50.8 51.7 54.9 55.9 51.1 49.2 47.3 47.9 49.3 17.72003 48.3 47.2 46.3 46.6 46.6 46.2 46.4 46.4 44.4 44.1 43.8 43.9 45.9 -10.42004 45.7 44.6 45.9 46.1 43.5 46.2 47.1 46.4 44.6 45.0 44.3 44.9 45.4 2.02005 45.8 44.8 44.0 45.0 45.2 45.5 47.7 49.1 48.2 50.5 49.9 49.8 47.1 12.22006 50.4 51.7 51.7 52.2 53.3 54.1 55.6 57.2 56.3 54.5 7.9
Broccoli 1997 109.8 115.6 103.2 92.2 88.6 92.1 96.8 90.5 90.3 104.0 100.3 92.6 98.0 --1998 137.9 106.6 112.2 111.4 123.8 108.7 107.6 103.0 101.4 104.0 101.6 97.4 109.6 0.01999 112.3 99.9 99.0 101.2 95.2 94.4 99.3 96.2 105.2 102.8 100.1 100.4 100.5 -1.22000 118.2 98.9 106.9 101.3 117.4 123.6 113.9 112.0 105.2 108.0 108.5 151.8 113.8 5.12001 98.7 97.8 108.3 95.4 99.9 100.5 98.1 97.8 96.9 101.1 89.7 97.3 98.5 -6.42002 137.4 168.1 114.7 120.4 103.6 109.3 111.9 113.5 124.7 107.3 116.5 105.2 119.4 6.12003 112.2 110.1 119.9 113.9 115.1 112.7 113.3 109.3 130.3 135.8 131.2 135.6 120.0 26.62004 131.9 121.6 112.5 102.2 110.7 106.0 106.9 106.7 120.8 139.9 133.5 141.4 119.5 3.02005 123.5 134.6 131.8 148.9 129.9 130.7 144.2 132.0 135.2 119.6 128.8 122.9 131.8 -14.52006 135.5 149.3 135.8 136.7 137.3 143.2 151.1 152.1 168.9 140.9 17.8
Lettuce, 1997 65.1 59.4 61.4 66.6 59.8 59.3 64.9 69.4 73.7 82.3 101.0 69.9 69.4 --iceberg 1998 107.2 64.3 69.5 83.7 87.7 71.1 69.2 68.6 71.0 75.7 76.5 63.5 75.7 -8.0
1999 64.9 65.8 77.4 75.3 69.1 65.2 62.7 65.2 62.3 66.9 67.7 66.8 67.4 -11.62000 74.8 65.0 67.1 65.0 80.3 68.6 65.6 67.3 89.7 77.2 77.4 85.1 73.6 15.42001 73.6 84.7 89.5 76.7 87.0 72.2 66.3 78.4 89.7 81.1 73.4 78.8 79.3 5.12002 100.3 106.1 154.2 114.7 72.0 67.5 67.4 68.9 70.2 68.7 75.4 68.0 86.1 -15.32003 73.4 68.2 65.5 72.3 79.5 83.2 80.8 70.9 89.8 85.8 92.7 125.5 82.3 24.92004 87.6 80.5 81.3 80.1 71.0 75.1 73.7 80.8 77.1 83.0 84.9 82.3 79.8 -3.32005 81.7 73.0 82.9 100.4 92.6 89.5 88.5 85.5 84.8 92.6 87.3 85.4 87.0 11.62006 87.4 79.4 81.5 86.9 96.7 84.8 78.3 86.4 95.3 87.3 -5.7
Tomatoes, 1997 121.3 131.4 165.4 134.8 117.5 130.0 114.1 113.0 109.1 116.2 137.0 161.7 129.3 -- field grown 1998 145.2 135.6 151.5 139.8 147.2 139.3 151.5 131.2 124.1 157.3 168.9 179.8 147.6 35.4
1999 190.4 147.6 139.5 129.8 128.4 130.4 128.7 123.2 127.2 127.9 130.0 140.5 137.0 -18.72000 144.3 128.6 136.4 148.7 136.6 131.8 128.2 126.2 131.9 138.7 150.3 156.7 138.2 8.42001 141.4 131.3 133.6 143.3 124.3 135.6 125.7 118.5 116.8 126.7 146.8 140.4 132.0 -8.72002 145.1 129.8 129.2 131.9 133.2 129.9 124.3 118.1 115.8 123.6 143.0 165.5 132.5 -2.42003 171.1 156.5 161.9 155.5 140.1 139.8 146.0 151.3 143.8 143.6 148.0 153.3 150.9 16.22004 147.2 151.0 152.9 151.9 151.0 133.1 125.3 131.2 132.1 171.5 233.7 246.7 160.6 19.42005 166.0 142.8 154.8 171.0 191.1 165.5 160.7 141.6 142.9 154.7 157.4 184.8 161.1 -9.82006 216.2 191.0 164.9 157.3 154.3 145.7 147.9 148.8 190.8 218.8 41.4
Lettuce, 2006 134.1 140.5 138.3 147.6 147.6 132.0 123.7 135.9 143.0 141.0 -- romaine 1/
Peppers, 2005 -- -- -- -- -- -- -- -- -- 192.7 -- -- -- -- sweet 2/ 2006 -- -- -- -- 163.8 169.5 176.8 171.3 171.0 208.0 7.9
Cabbage 2/ 2006 -- -- -- -- -- -- -- 56.1 60.0 58.5
-- = not available. 1/ Romaine data was first reported by BLS in January 2006. 2/ Reported by BLS as statistically valid data are available.
Source: U.S. Department of Labor, Bureau of Labor Statistics (http://www.bls.gov/data/home.htm).
36Vegetables and Melons Outlook /VGS-318/December 14, 2006
Economic Research Service, USDA

Price table 6—Representative wholesale prices for selected fresh-market vegetables and melons in Chicago, 2005-06 Shipping Shipping 2005 2006
Commodity point 1/ container July 1 Aug. 1 Sep. 1 Oct. 3 Nov. 1 Dec. 5 Jan. 3 Feb. 1 Mar. 1 Apr. 3 May 1 June 1 July 1 Aug. 1 Sep. 1 Oct. 2 Nov. 1 Dec. 1
Artichokes CA Carton, 24s 21.75 15.00 27.00 23.00 21.00 18.00 33.00 27.00 23.00 29.00 33.00 32.00 25.00 28.00 40.00 47.00 41.00 44.50Beans, round green, machine-pick FL, GA, MI Bushel cartons 18.50 24.00 29.00 24.00 21.00 45.50 15.00 19.00 20.00 25.00 14.50 12.75 11.50 11.50 19.00 25.50 17.00 14.50Beets, medium TX, IL, CA 25 lb sacks/filmbags 9.00 8.50 8.50 8.00 7.50 7.50 7.50 8.00 10.00 10.00 14.00 13.00 10.50 10.50 7.75 12.50 8.25 8.00Bok choy, baby CA, FL 30 lb cartons 13.00 13.00 13.00 11.00 21.00 12.00 12.00 12.00 11.00 11.00 12.00 12.50 12.50 13.00 13.00 12.00 11.00 13.00Brussels sprouts CA, MX 25 lb cartons 42.00 29.00 16.00 22.00 19.00 23.00 16.50 17.00 17.00 25.50 27.00 -- -- 47.00 44.00 28.50 19.00 19.00Cabbage, round-green, medium NY, GA 50 lb cartons 10.75 8.00 10.25 11.00 13.00 10.50 12.00 8.75 8.75 9.50 8.25 9.50 8.00 6.50 9.00 8.50 11.25 10.25Chinese cabbage (Napa) CA 30 lb cartons 16.00 13.00 14.50 13.00 12.00 12.50 12.00 11.00 14.50 14.50 12.00 16.00 18.00 18.00 15.00 14.00 12.00 12.00Carrots, baby peeled CA Carton, 24-1 lb filmbag 17.25 16.50 17.00 17.00 17.00 15.75 16.50 16.00 16.25 14.50 16.00 16.50 16.50 16.50 16.50 17.25 17.00 16.00Eggplant, medium FL, GA, MX 1 1/9 bushel cartons 12.00 11.50 9.50 11.00 11.00 14.00 16.00 9.50 13.00 17.00 16.00 13.00 14.50 18.25 9.50 15.00 9.50 11.50Garlic, white colossal CA, MX 30 lb cartons 38.00 39.00 39.00 39.00 40.00 38.00 40.00 38.00 37.50 37.50 37.50 37.50 38.00 38.00 38.00 37.00 39.00 37.00Greens, kale CA Carton, 24s 11.75 9.25 11.50 11.50 10.50 12.00 11.50 11.50 11.50 11.50 12.00 12.00 12.00 12.00 10.50 12.00 12.00 12.00Greens, kohlrabi CA, TX, IL Carton, 12s/24s 24.00 18.00 18.00 28.00 15.00 19.50 19.00 19.50 18.50 18.50 20.50 18.00 12.00 12.00 12.00 15.50 -- 24.00Greens, turnip tops GA, IL Carton, 24s 9.50 9.25 12.00 10.00 9.50 10.00 9.75 9.75 9.50 9.75 9.75 9.75 9.25 9.25 9.50 10.75 10.25 10.25Greens, mustard CA Carton, 24s 9.50 9.25 12.00 10.00 9.50 10.00 9.75 9.75 9.50 9.75 9.75 9.75 9.25 9.25 9.50 10.75 10.25 10.25Greens, collards GA, CA Carton, 24s 11.00 9.25 12.00 10.00 9.50 10.00 9.75 9.75 9.50 9.75 9.75 9.75 9.25 9.25 9.50 10.75 10.25 10.25Leeks CA, IL, MX Carton, bunched 12s 26.00 17.00 17.50 21.00 22.50 20.50 24.50 18.00 14.00 19.00 17.00 17.00 15.00 15.50 14.50 14.00 14.00 14.00Lettuce, Boston CA Carton, 24s 9.50 9.50 10.00 10.00 10.00 10.00 11.00 9.50 11.00 11.00 19.00 10.00 11.00 13.50 19.00 17.00 13.00 12.75Lettuce, Romaine CA Carton, 24s 12.25 12.50 12.50 11.00 11.50 12.00 12.50 10.50 13.00 13.50 28.50 13.50 13.00 19.00 19.00 19.00 13.50 13.00Mushrooms, button, large PA 10 lb carton 14.25 14.25 14.25 14.25 14.25 15.00 15.00 15.00 15.00 15.00 14.50 15.00 15.00 15.00 15.00 15.00 15.00 15.00Mushrooms, shiitake PA 5 lb carton 21.00 21.00 21.00 21.00 21.00 21.00 21.00 21.00 21.00 21.00 21.00 21.00 21.00 21.00 21.00 21.00 21.00 21.00Mushrooms, oyster PA 5 lb carton 15.50 15.50 15.50 15.50 15.50 15.50 15.50 15.50 15.50 15.50 15.50 15.50 15.50 15.50 15.50 15.50 15.50 15.50Mushrooms, cremini, medium PA 10 lb carton 14.00 14.00 14.00 14.00 14.00 12.50 12.50 12.50 12.50 12.50 12.75 12.50 12.50 12.50 12.50 12.50 12.50 12.50Mushrooms, portobellas, lrg PA 5 lb carton 11.00 11.00 11.00 11.00 11.00 11.00 10.00 10.00 10.00 10.00 10.00 10.00 10.00 10.00 10.00 10.00 10.00 10.00Okra, small-medium FL, MX, TN 1/2 bushel carton 18.00 15.00 15.00 11.50 27.00 29.00 20.00 27.00 19.00 9.50 15.50 14.00 16.00 24.00 22.00 20.00 24.00 20.00Onions, green CA, MX Carton, bunched 48s 10.50 12.75 14.00 10.25 12.00 12.25 12.50 10.50 9.50 13.00 10.50 10.50 13.50 21.00 23.00 31.00 13.00 12.50Parsley, curly CA Cartons, bunched 60s 16.00 15.00 16.00 14.00 14.00 20.50 16.00 13.00 12.00 13.00 13.00 21.00 19.00 17.00 20.00 17.00 26.00 26.00Peas, snow CA, GU 10 lb carton 19.35 26.00 10.00 13.50 11.00 13.00 10.00 10.75 10.00 12.50 19.00 19.50 32.00 32.00 10.00 28.00 16.00 16.50Peas, sugar snap CA, GU 10 lb carton 21.00 17.00 24.00 16.00 12.50 13.00 20.00 11.00 10.00 14.00 20.00 10.00 38.50 35.00 20.00 24.00 16.00 16.00Peppers, green bell, large FL, CA 1 1/9 bushel carton 13.00 8.00 8.50 14.00 24.50 17.00 23.00 8.50 12.50 9.00 -- 8.00 18.50 12.50 25.00 14.50 12.00 9.50Peppers, jalapeno, medium FL, GA, MI 1/2 & 5/9 bushel crates 7.25 9.50 8.00 8.00 9.00 10.00 19.00 18.00 16.00 16.00 -- 11.00 8.50 8.50 8.50 8.50 11.00 15.00Radishes FL, MI Carton, 30-6oz filmbag 8.50 8.00 7.75 6.75 7.75 13.00 14.00 8.75 9.00 7.50 7.50 7.50 8.00 8.00 8.00 7.50 8.00 8.25Spinach CA Cartons, bunched 24s 11.50 17.00 14.50 14.00 11.50 10.50 16.00 12.50 13.00 14.50 12.00 12.50 13.00 15.00 17.00 -- 13.00 14.00Squash, zucchini, medium FL, NJ, MI 1/2 & 5/9 bushel crates 5.00 7.00 10.25 7.00 8.00 11.00 10.00 14.50 9.00 11.50 6.00 12.00 7.00 8.00 8.50 10.00 12.25 8.50Squash, yellow straightneck, med. FL, NJ, MI 1/2 & 5/9 bushel crates 6.00 8.00 12.00 6.50 10.00 30.50 13.00 15.00 16.50 13.50 6.00 8.75 7.50 8.00 8.00 10.00 8.25 8.25Sweet potatoes, US #1, Beauregrd LA 40 lb carton 16.50 16.00 18.50 17.75 17.00 18.50 18.00 17.75 17.75 17.00 17.00 18.75 19.25 19.25 20.00 20.00 18.50 18.50Tomatoes, mature green, lrg, 6x6 FL, CA, MX 25 lb carton 12.50 7.50 9.50 15.00 12.50 24.50 36.00 14.50 17.00 9.00 12.00 10.00 11.00 9.50 16.00 31.50 8.25 9.00Tomatoes, vine ripe, large, 6x6 MX, CA, FL 25 lb carton 15.00 11.00 10.50 17.00 15.00 25.00 33.00 13.00 12.75 10.50 0.00 11.50 11.00 9.50 17.00 34.00 14.50 11.00Tomatoes, greenhse, v. ripe, md/lrg CD, NL, MX 5 kg carton (on vine) 9.50 11.50 9.00 11.00 12.50 10.25 12.00 17.00 13.00 13.00 8.00 10.50 7.00 6.00 12.50 20.50 11.50 10.00Tomatoes, cherry FL, CA, MX Flats, 12 1-pint buckets 13.50 9.00 11.50 9.50 20.00 16.00 24.00 12.50 11.00 9.00 13.00 12.50 13.00 13.50 13.00 26.00 9.75 11.50Tomatoes, plum-type, med/lrg FL, CA, MX 25 lb carton 18.00 11.00 10.00 14.50 15.50 20.50 19.50 21.50 9.50 14.00 26.00 11.00 12.75 11.00 21.00 39.50 18.50 12.50Turnips, purple top, medium-large CA, IL 25 lb filmbags 11.00 8.50 8.50 8.50 9.50 9.00 8.50 10.00 10.00 10.00 9.50 9.50 8.00 9.25 9.25 10.50 9.00 8.00Cantaloups CA, CR, MX 1/2 carton 15s 13.50 9.50 11.50 11.25 13.50 20.00 13.00 14.00 12.50 15.50 9.50 17.50 11.50 14.00 13.50 11.00 16.50 24.00Honeydews CA, HD, CR 2/3 cartons 6s 19.00 10.50 8.25 8.50 10.50 9.25 10.00 12.50 10.75 10.50 7.50 11.50 11.50 10.50 10.50 8.50 8.50 10.25Watermelon, various red CA, TX, MX Carton 3s or 4s, per lb 0.36 0.26 0.28 0.30 0.31 0.38 0.39 0.40 0.33 0.32 0.31 0.27 0.30 0.29 0.29 0.30 0.35 0.30Watermelon, red seedless CA, MX Carton 4s or 5s, per lb 0.36 0.27 0.29 0.31 0.35 0.39 0.42 0.45 0.33 0.34 0.31 0.27 0.30 0.36 0.31 0.34 0.41 0.33 -- = Not available. 1/ Major shipping points by commodity into the Chicago Wholesale Market. CA=California, FL=Florida, TX=Texas, MI=Michigan, IL=Illinois, NY=New York, NJ= New Jersey, GA=Georgia, PA=Pennsylvania, LA = Louisiana, MX=Mexico, CR=Costa Rica, HD=Honduras, GU=Guatemala, CD=Canada, NL-Netherlands.
Source: USDA, Agricultural Marketing Service, Fruit & Vegetable Market News, FV Market News Portal, http://marketnews.usda.gov/portal/fv
37Vegetables and Melons Outlook /VGS-318/December 14, 2006
Economic Research Service, USDA

Price table 7—Canned vegetables: Quarterly wholesale price trends, 1997-2006 1/ Year & Sweet corn 2/ Snap beans 3/ Green peas 4/ Carrots 5/ Beets 6/ Tomato paste 7/
quarter 24/300 6/10 24/300 6/10 24/300 6/10 24/300 6/10 24/300 6/10 55-drum 6/10-- $/case -- $/lb $/case
1997 I 7.38 11.75 7.08 9.67 9.05 14.46 7.79 10.46 7.63 11.50 0.30 17.17 II 7.00 10.83 6.67 8.75 8.88 13.75 7.75 10.46 7.83 11.50 0.30 15.13 III 7.05 11.08 6.75 8.75 8.58 13.63 7.67 10.50 8.00 11.08 0.30 15.42 IV 7.17 10.38 7.00 9.84 8.88 13.00 7.88 10.50 7.88 10.33 0.31 16.25
Average 7.15 11.01 6.88 9.25 8.85 13.71 7.77 10.48 7.84 11.10 0.30 15.99
1998 I 7.21 10.63 7.05 8.63 8.13 11.25 7.84 11.00 7.92 10.58 0.33 16.42 II 7.38 10.88 7.13 9.75 8.50 10.88 7.88 11.13 7.88 10.75 0.33 16.92 III 7.25 10.75 7.21 9.96 8.21 12.58 7.25 10.58 7.25 10.92 0.38 19.00 IV 7.25 10.75 7.21 9.96 8.38 12.75 7.25 10.50 7.25 11.00 0.45 21.00
Average 7.27 10.75 7.15 9.58 8.31 11.87 7.56 10.80 7.58 10.81 0.37 18.34
1999 I 7.25 10.75 7.50 10.38 8.80 13.30 7.33 10.67 7.42 11.00 0.45 21.00 II 7.33 10.63 7.50 10.38 8.71 13.21 7.79 11.29 8.09 11.83 0.46 21.00 III 7.50 10.63 7.50 10.38 8.75 13.58 7.88 11.38 8.09 12.00 0.46 21.00 IV 7.63 12.34 7.46 10.92 8.75 13.58 7.88 11.13 8.04 11.75 0.35 20.29
Average 7.43 11.09 7.49 10.52 8.75 13.42 7.72 11.12 7.91 11.65 0.43 20.82
2000 I 7.75 13.84 7.50 11.67 8.75 14.79 7.88 10.88 8.21 11.75 0.34 19.63 II 7.84 15.00 7.50 11.92 8.84 16.33 7.88 10.88 8.38 11.38 0.34 20.04 III 7.71 15.00 7.25 12.00 8.79 16.00 7.96 11.13 8.46 11.38 0.32 19.50 IV 7.63 15.09 7.38 11.17 8.75 16.13 7.75 11.01 8.50 11.75 0.32 19.00
Average 7.73 14.73 7.41 11.69 8.78 15.81 7.87 10.97 8.39 11.57 0.33 19.54
2001 I 7.25 14.75 7.25 10.25 8.63 15.46 7.75 10.88 7.75 11.75 0.31 17.88 II 7.25 14.75 7.25 10.25 8.63 15.25 7.75 10.88 7.75 11.75 0.31 17.88 III 7.67 14.92 7.67 10.42 8.96 15.42 7.92 11.05 7.92 11.75 0.32 17.88 IV 8.25 15.25 8.25 12.55 9.00 15.42 8.33 11.25 8.42 11.83 0.32 17.88
Average 7.61 14.92 7.61 10.87 8.81 15.39 7.94 11.02 7.96 11.77 0.32 17.88
2002 I 9.00 15.75 9.00 14.59 9.00 15.25 9.00 12.00 9.00 12.00 0.32 17.63 II 8.33 15.08 8.33 12.05 8.75 15.08 9.00 12.00 9.00 12.00 0.31 17.80 III 8.00 14.75 8.00 10.88 8.63 15.00 9.00 11.50 9.00 12.00 0.31 18.50 IV 8.00 14.67 8.00 11.05 8.88 15.09 8.75 11.50 9.00 12.00 0.31 20.38
Average 8.33 15.06 8.33 12.14 8.82 15.11 8.94 11.75 9.00 12.00 0.31 18.58
2003 I 8.00 14.00 8.00 11.13 9.00 15.42 8.63 11.50 9.00 12.00 0.32 18.46 II 8.00 14.00 8.00 11.38 9.00 15.50 8.71 11.50 9.00 12.00 0.30 19.46 III 8.00 14.00 8.00 11.75 9.00 16.00 8.63 11.50 9.00 12.00 0.29 17.63 IV 8.00 14.13 8.00 12.38 9.00 16.00 8.63 11.50 9.00 12.00 0.29 17.63
Average 8.00 14.03 8.00 11.66 9.00 15.73 8.65 11.50 9.00 12.00 0.30 18.30
2004 I 8.17 14.80 8.17 14.38 9.17 16.00 8.63 11.50 9.00 12.00 0.29 18.67 II 8.42 15.46 8.33 15.92 9.13 15.75 8.75 11.50 9.00 13.00 0.30 20.25 III 8.50 15.63 8.33 16.17 9.00 15.59 9.00 11.50 9.00 14.00 0.30 20.25 IV 8.42 15.29 8.46 15.84 8.92 15.54 9.00 11.75 8.50 15.00 0.30 20.25
Average 8.38 15.30 8.32 15.58 9.06 15.72 8.85 11.56 8.88 13.50 0.30 19.86
2005 I 8.58 14.04 8.54 13.54 8.96 15.67 9.00 11.75 8.83 14.58 0.30 20.25 II 8.75 13.58 8.63 13.25 9.13 15.42 9.00 11.75 9.00 14.17 0.30 20.17 III 8.75 13.42 8.80 12.96 9.13 15.33 8.88 12.00 9.00 13.92 0.30 20.00 IV 8.50 13.25 8.50 13.25 9.13 15.25 8.75 11.75 9.00 13.63 0.31 20.50
Average 8.65 13.57 8.62 13.25 9.09 15.42 8.91 11.81 8.96 14.08 0.30 20.23
2006 I p 8.63 12.25 8.88 12.13 9.25 15.46 8.88 12.00 9.05 12.75 0.36 21.75 II p 8.63 12.25 8.74 12.13 9.17 15.50 8.88 12.00 9.03 12.25 0.37 23.25 III p 8.38 11.75 8.45 12.00 8.71 15.50 8.88 12.00 8.50 11.88 0.38 23.50 IV f 8.38 11.78 8.45 12.00 9.07 15.50 8.88 12.00 8.45 11.89 0.43 24.50
Average 8.51 12.01 8.63 12.07 9.05 15.49 8.88 12.00 8.76 12.19 0.39 23.25
p = Preliminary. f = ERS forecast. 1/ Some prices calculated as averages of quoted ranges. 2/ Whole kernel corn, Midwest. 3/ 4-sieve cut, Midwest. 4/ 4-sieve, Midwest. 5/ Medium sliced, Midwest. 6/ Medium sliced, Midwest. 7/ 26-percent solids for 6/10 and 31 percent for 55-gallon drum, California.
Source: American Institute of Food Distribution, Price Trends.
38Vegetables and Melons Outlook/VGS-318/December 14, 2006
Economic Research Service, USDA

Price table 8—Frozen vegetables: Quarterly wholesale price trends, 1997-2006 1/ Year and Sweet corn 2/ Snap beans 3/ Green peas 4/ Cauliflower 4/ Broccoli 6/ Spinach 7/quarter 12/16 12/2.5 12/16 12/2 12/16 12/2.5 12/16 12/2 24/10 12/2 24/10 12/3
--$ per case--
1997 I 6.90 0.50 6.88 0.48 7.10 0.51 9.20 0.65 10.23 0.68 7.98 0.42 II 6.90 0.50 6.83 0.47 7.10 0.50 9.20 0.65 9.93 0.69 8.30 0.42 III 6.90 0.50 6.83 0.47 7.10 0.49 9.20 0.65 9.93 0.69 8.30 0.42 IV 6.83 0.47 6.83 0.47 6.90 0.48 9.20 0.65 9.93 0.69 8.30 0.42
Average 6.88 0.49 6.84 0.47 7.05 0.50 9.20 0.65 10.01 0.69 8.22 0.42
1998 I 6.83 0.46 6.83 0.47 6.90 0.47 9.20 0.65 10.08 0.70 8.30 0.42 II 6.83 0.45 6.83 0.47 6.90 0.46 9.20 0.65 10.15 0.70 8.30 0.42 III 6.83 0.44 6.83 0.45 6.75 0.45 9.20 0.65 10.15 0.70 8.30 0.42 IV 6.83 0.44 6.83 0.45 6.87 0.45 9.47 0.70 10.15 0.72 8.33 0.42
Average 6.83 0.45 6.83 0.46 6.86 0.46 9.27 0.66 10.13 0.71 8.31 0.42
1999 I 6.83 0.44 6.83 0.45 6.88 0.46 9.47 0.70 10.15 0.72 8.30 0.44 II 6.83 0.44 6.83 0.45 6.88 0.46 9.47 0.70 10.15 0.72 8.30 0.44 III 6.83 0.45 6.83 0.46 6.91 0.51 9.47 0.70 10.15 0.72 8.30 0.43 IV 6.83 0.45 6.83 0.47 6.93 0.54 9.47 0.70 10.15 0.72 8.30 0.43
Average 6.83 0.45 6.83 0.46 6.90 0.49 9.47 0.70 10.15 0.72 8.30 0.44
2000 I 6.83 0.48 6.83 0.47 6.93 0.54 9.47 0.70 10.15 0.72 8.30 0.43 II 6.83 0.48 6.83 0.47 6.93 0.54 9.47 0.70 10.15 0.72 8.30 0.43 III 6.83 0.47 6.83 0.47 6.93 0.54 9.47 0.70 10.15 0.72 8.30 0.43 IV 6.83 0.47 6.83 0.47 6.93 0.54 9.47 0.70 10.15 0.72 8.30 0.43Average 6.83 0.47 6.83 0.47 6.93 0.54 9.47 0.70 10.15 0.72 8.30 0.43
2001 I 6.83 0.46 6.83 0.47 6.93 0.53 9.47 0.70 10.15 0.72 8.30 0.43 II 6.83 0.46 6.84 0.47 6.88 0.53 9.47 0.70 10.15 0.72 8.30 0.43 III 6.88 0.49 6.85 0.47 6.88 0.55 9.50 0.72 10.15 0.72 8.30 0.45 IV 6.88 0.49 6.85 0.49 6.88 0.55 9.50 0.72 10.15 0.72 8.30 0.45
Average 6.86 0.47 6.84 0.48 6.89 0.54 9.49 0.71 10.15 0.72 8.30 0.44
2002 I 6.88 0.49 6.93 0.49 6.88 0.55 9.50 0.72 10.15 0.72 8.30 0.48 II 7.10 0.50 7.10 0.50 7.05 0.55 9.49 0.72 10.15 0.72 8.30 0.48 III 7.10 0.50 7.10 0.51 7.07 0.55 9.47 0.72 10.15 0.72 8.30 0.48 IV 7.10 0.51 7.10 0.54 7.10 0.55 9.47 0.72 10.15 0.72 8.30 0.48
Average 7.05 0.50 7.06 0.51 7.02 0.55 9.48 0.72 10.15 0.72 8.30 0.48
2003 I 7.10 0.55 7.10 0.54 7.10 0.55 9.47 0.72 10.15 0.72 8.30 0.48 II 7.10 0.55 7.10 0.54 7.10 0.55 9.47 0.72 10.15 0.72 8.30 0.48 III 7.10 0.55 7.10 0.54 7.10 0.55 9.47 0.72 10.15 0.72 8.30 0.48 IV 7.10 0.55 7.10 0.54 7.10 0.55 9.47 0.72 10.15 0.72 8.30 0.48
Average 7.10 0.55 7.10 0.54 7.10 0.55 9.47 0.72 10.15 0.72 8.30 0.48
2004 I 7.10 0.55 7.10 0.54 7.10 0.55 9.50 0.72 10.15 0.72 8.30 0.48 II 7.10 0.55 7.10 0.54 7.38 0.55 9.50 0.72 10.15 0.72 8.30 0.48 III 7.38 0.56 7.38 0.58 7.38 0.58 9.50 0.72 10.15 0.72 8.30 0.50 IV 7.30 0.54 7.33 0.58 7.28 0.57 9.50 0.72 10.15 0.72 8.30 0.50
Average 7.22 0.55 7.23 0.56 7.29 0.56 9.50 0.72 10.15 0.72 8.30 0.49
2005 I 7.30 0.54 7.33 0.58 7.28 0.57 9.47 0.72 10.15 0.72 8.30 0.50 II 7.30 0.54 7.33 0.58 7.28 0.57 9.47 0.72 10.15 0.72 8.30 0.50 III 7.30 0.54 7.30 0.56 7.30 0.56 9.47 0.72 10.15 0.72 8.30 0.50 IV 7.30 0.55 7.30 0.55 7.30 0.55 9.47 0.72 10.15 0.72 8.30 0.50
Average 7.30 0.54 7.31 0.57 7.29 0.56 9.47 0.72 10.15 0.72 8.30 0.50
2006 I p 7.10 0.50 7.25 0.56 7.23 0.52 9.47 0.72 10.15 0.72 8.32 0.52 II p 7.35 0.50 7.63 0.56 7.63 0.55 9.47 0.72 10.30 0.72 8.81 0.49 III p 7.55 0.50 7.63 0.55 7.50 0.55 9.47 0.72 10.38 0.73 8.75 0.49 IV f 7.58 0.50 7.50 0.55 7.20 0.54 9.47 0.72 10.38 0.73 8.50 0.49
Average 7.40 0.50 7.50 0.56 7.39 0.54 9.47 0.72 10.30 0.72 8.60 0.50
p = Preliminary. f = ERS forecast. 1/ Some prices calculated as averages of quoted ranges. 2/ Whole kernel (cut) corn, f.o.b. West Coast basis. 3/ Regular cut. 4/ Poly bags. 5/ Sliced, poly bags. 6/ Spears. 7/ Chopped. Source: American Institute of Food Distribution, Price Trends.
39Vegetables and Melons Outlook/VGS-318/December 14, 2006
Economic Research Service, USDA

Price table 9—Potatoes and pulses: Prices received by U.S. growers, by month, 1998-2006 1/ Season
Item Year Jan. Feb. Mar. Apr. May June July Aug. Sep. Oct. Nov. Dec. average --$/cwt--
Potatoes, 1998 5.41 5.88 6.41 6.27 6.46 6.13 5.78 5.38 5.08 4.55 5.02 5.29 5.56 all uses 1999 5.50 5.75 6.12 6.50 6.06 6.54 7.35 5.91 5.33 4.98 5.58 5.68 5.76
2000 5.56 5.78 6.14 6.49 6.28 5.97 6.58 5.32 4.79 4.39 4.50 4.93 5.082001 4.72 5.28 5.12 5.47 5.22 5.71 6.36 7.20 6.23 5.28 6.16 6.73 6.992002 7.34 7.33 8.24 8.01 8.59 9.38 10.59 7.39 6.29 5.53 6.24 6.62 6.672003 6.44 6.47 6.79 6.99 6.94 6.67 6.84 5.57 5.24 5.03 5.42 5.76 5.892004 5.70 5.87 6.09 6.62 6.47 6.47 6.44 5.60 5.23 4.61 4.89 5.28 5.662005 5.64 5.79 6.44 6.20 6.23 6.30 7.05 6.61 5.69 5.37 6.26 6.83 7.062006 7.07 7.44 8.21 7.97 8.05 8.60 11.02 7.95 6.35 5.97 6.43
Potatoes, 1998 5.76 6.81 7.54 6.83 7.31 7.23 6.94 6.73 6.62 5.75 5.77 5.41 6.94 table stock 1999 6.08 6.94 7.85 8.32 7.70 9.08 9.79 9.67 7.23 6.26 6.58 7.00 6.94
2000 6.21 6.62 6.74 6.61 7.30 7.40 8.81 8.15 5.90 4.66 4.16 4.77 5.272001 3.54 5.41 4.48 5.53 7.23 8.31 8.93 12.96 10.96 8.69 8.68 9.37 10.792002 10.49 11.63 13.19 12.17 14.69 16.28 16.70 15.31 11.52 8.34 8.62 8.60 9.592003 8.09 8.54 8.58 8.80 9.09 9.16 8.96 8.04 7.08 6.95 6.70 6.52 7.322004 6.26 6.68 7.20 7.82 7.76 9.04 9.07 7.87 6.97 5.09 4.89 5.56 6.752005 6.13 6.58 8.04 7.22 7.43 8.23 10.37 11.30 10.77 8.90 8.76 9.03 10.362006 9.16 10.91 12.42 10.62 11.68 12.92 15.36 14.60 10.35 9.38
Potatoes, 1998 5.07 5.26 5.24 5.48 5.97 5.58 5.04 4.83 4.55 4.31 4.61 5.22 4.86 processing 1999 5.11 4.94 5.14 5.30 5.32 5.30 5.28 4.43 4.59 4.67 5.04 4.95 4.99
2000 5.18 5.27 5.21 5.41 5.37 5.34 4.89 4.46 4.48 4.34 4.69 5.07 4.702001 4.95 5.15 5.10 5.19 5.10 4.96 5.24 4.43 4.56 4.47 4.89 5.15 5.052002 5.37 5.27 5.34 5.66 6.02 5.83 6.09 4.67 4.62 4.79 5.14 5.35 5.162003 5.38 5.32 5.28 5.33 5.59 5.60 5.39 4.69 4.64 4.52 4.85 5.31 5.102004 5.29 5.24 5.24 5.54 5.64 5.54 5.30 4.76 4.60 4.45 4.88 5.10 5.062005 5.29 5.30 5.37 5.47 5.68 5.51 5.45 4.92 4.65 4.66 4.89 5.51 5.392006 5.69 5.57 5.82 6.09 6.32 6.17 6.14 5.22 5.10 5.12
Dry edible 1998 21.10 21.20 20.20 20.80 20.80 20.90 21.30 19.60 19.00 19.40 20.30 19.90 19.00 beans 1999 19.70 18.30 17.00 16.60 19.90 18.90 18.50 18.00 18.00 17.10 17.20 16.10 16.40
2000 15.80 15.60 14.50 15.70 16.20 14.70 14.20 13.80 15.50 15.70 15.50 14.40 15.502001 15.10 15.30 14.90 15.60 16.90 16.40 16.80 17.40 18.40 19.20 22.70 21.70 22.102002 21.50 26.10 27.10 27.50 27.80 27.40 24.50 23.20 17.90 16.60 15.90 16.10 17.102003 16.40 19.20 15.90 18.70 19.10 16.60 17.20 18.00 17.60 17.60 19.10 17.40 18.402004 17.20 17.50 20.20 19.60 19.90 20.00 19.20 20.90 22.80 24.50 25.90 27.00 25.702005 27.20 27.80 26.60 28.70 31.10 27.70 25.40 21.40 18.00 18.80 18.00 18.10 18.502006 19.20 17.40 17.10 18.90 19.30 19.00 21.70 19.50 18.80 19.70 21.00
Green peas, 1998 8.00 8.00 8.00 7.95 7.75 7.75 7.70 6.85 6.15 6.00 6.19 6.31 6.48 whole-dry 1999 6.46 6.50 6.53 6.56 6.75 6.88 6.91 6.53 6.22 6.03 6.03 5.83 5.76 2/ 2000 5.79 5.78 5.78 5.69 5.68 5.59 5.41 5.25 5.13 5.20 5.38 5.50 5.95
2001 5.84 6.28 6.44 6.53 6.43 6.28 6.25 6.19 6.21 6.35 6.56 6.88 6.962002 7.04 7.06 7.13 7.40 7.25 7.25 7.25 7.13 7.38 7.68 7.91 8.33 9.082003 9.08 9.81 10.88 10.60 10.44 9.92 9.30 7.56 7.63 8.09 8.84 9.08 9.172004 9.56 9.94 10.50 10.56 10.88 8.43 7.38 6.45 6.41 6.66 6.93 6.69 6.412005 6.63 6.56 6.03 5.69 5.47 5.38 5.31 5.15 4.84 4.81 4.80 4.75 5.122006 4.97 5.31 5.50 6.00 6.25 6.25 6.25 6.33 6.72 6.90 7.23 7.83
Yellow peas, 1998 7.50 7.50 7.60 7.50 7.50 7.50 7.05 6.50 5.65 5.69 5.78 5.94 6.13 whole-dry 1999 6.00 6.06 6.35 6.19 6.38 6.30 6.50 6.75 6.34 6.25 6.33 6.29 6.05 2/ 2000 6.38 6.13 6.03 6.00 5.88 5.91 5.72 5.30 5.16 5.15 5.31 5.38 5.92
2001 5.81 6.31 6.44 6.38 6.40 6.25 6.25 6.19 6.17 6.25 6.56 6.79 7.022002 7.04 7.25 7.31 7.68 7.66 7.59 7.38 6.50 6.72 7.10 7.34 7.58 7.782003 7.42 7.94 8.03 8.50 8.75 8.67 8.44 6.63 6.43 6.75 7.53 7.75 7.902004 7.91 8.72 9.03 9.25 9.42 7.73 7.13 6.08 5.97 6.25 6.43 6.25 6.042005 6.00 6.00 5.73 5.56 5.59 5.55 5.25 5.15 4.66 4.63 4.63 4.63 4.852006 4.75 4.97 5.00 5.13 5.50 5.50 5.50 5.35 5.78 6.03 6.66 7.00
Lentils, 1998 11.40 12.00 11.60 11.10 10.75 11.00 12.00 11.30 10.15 10.70 10.81 10.94 11.21 regular 1999 10.92 11.25 11.55 11.38 11.69 11.90 11.94 12.15 12.13 12.28 13.05 13.17 12.54 (Brewer) 2000 12.88 12.45 12.13 12.31 12.73 12.81 12.81 11.75 11.19 11.03 10.97 10.88 10.44 2/ 2001 10.84 10.50 10.22 10.25 9.90 9.91 9.78 9.84 9.83 9.75 9.72 9.71 9.56
2002 9.44 9.06 9.03 9.75 9.59 9.44 9.40 9.50 10.75 12.85 13.81 14.25 14.302003 15.42 17.63 18.63 18.70 18.63 18.56 15.20 14.50 14.85 16.50 16.88 16.50 17.202004 17.13 19.00 20.90 21.25 20.38 15.80 14.19 13.25 14.38 15.56 15.95 15.38 14.402005 14.69 14.19 13.45 12.56 12.19 11.40 11.25 11.25 11.34 11.25 10.78 10.08 11.702006 10.38 10.31 10.25 10.72 10.75 10.94 10.94 12.30 13.06 13.75 14.13 14.50
-- = not available. 1/ Prices for 2006 are preliminary. 2/ Grower bids for U.S. no. 1 grade reported by the Bean Market News for Idaho & Washington.
Sources: USDA, National Agricultural Statistics Service, Agricultural Prices, and USDA, Agricultural Marketing Service, Bean Market News.
40Vegetables and Melons Outlook /VGS-318/December 14, 2006
Economic Research Service, USDA

Price table 10—U.S. fresh-market herbs: Selected monthly wholesale prices in San Francisco, CA, 2005-062005 2006 Change from prev. year
Herb Unit Sep. Oct. Nov. Sep. Oct. Nov. Sep. Oct. Nov. -- $/cwt -- --- Percent ---
Anise 24-ct crtn 13.50 13.50 -- 11.50 11.60 13.17 - 14.8 - 14.1 --Arrugula 12-ct ctns 7.75 7.75 7.75 8.06 8.25 7.69 4.0 6.5 - .8Basil 12-ct ctns 7.25 7.00 7.00 8.31 7.75 7.94 14.6 10.7 13.4Celeriac 12-ct ctns 15.50 15.06 14.25 15.25 15.25 15.25 - 1.6 1.3 7.0Chervil 12-ct flmbag 7.25 7.13 7.00 6.91 6.80 6.60 - 4.7 - 4.6 - 5.7Chives 12-ct flmbag 4.13 4.19 4.25 6.19 5.50 5.50 49.9 31.3 29.4Cilantro 60-ct ctns 12.38 12.75 -- 16.75 10.80 10.38 35.3 - 15.3 --Cipolinos 10-lb ctns 19.50 19.50 19.50 23.38 19.80 18.00 19.9 1.5 - 7.7Dill 12-ct ctns 7.00 7.00 7.00 9.50 9.60 7.81 35.7 37.1 11.6Dry Eschallot 5-lb sack 5.00 5.00 4.63 5.38 5.65 5.35 7.6 13.0 15.6Horseradish 50-lb sack 2.05 2.05 2.05 2.15 2.08 2.08 4.9 1.5 1.5Lemon grass Per lb-ctns 0.60 0.60 0.60 1.50 1.50 0.98 150.0 150.0 63.3Marjoram 12-ct flmbag 5.50 5.38 5.25 5.50 5.50 5.50 .0 2.2 4.8Oregano 12-ct flmbag 5.50 5.38 5.25 5.50 5.50 5.50 .0 2.2 4.8Rosemary 12-ct flmbag 5.50 5.38 5.25 5.50 5.50 5.50 .0 2.2 4.8Mint 12-ct ctns 7.25 7.06 7.00 8.00 8.00 7.50 10.3 13.3 7.1Sage 12-ct flmbag 5.50 5.38 5.25 5.50 5.50 5.50 .0 2.2 4.8Salsify 5-1kg flmbg 23.50 23.50 23.50 23.50 27.10 29.13 .0 15.3 24.0Savory 24-ct flmbag 5.50 5.50 5.50 5.50 5.50 5.50 .0 .0 .0Sorrel 12-ct flmbag 5.50 5.50 5.25 5.50 5.50 5.50 .0 .0 4.8Tarragon 12-ct flmbag 6.50 7.25 8.00 6.25 6.00 6.38 - 3.8 - 17.2 - 20.3Thyme 12-ct flmbag 5.50 5.50 5.50 5.50 5.50 5.50 .0 .0 .0Verdulaga 24-ct flmbag 8.00 6.50 6.00 8.25 8.25 8.25 3.1 26.9 37.5Watercress 12-ct ctns 7.25 7.44 8.00 10.50 10.50 10.50 44.8 41.1 31.3
-- = not available.
Source: Derived from data provided by USDA, Agricultural Marketing Service, FV Data Portal, http://marketnews.usda.gov/portal/fv
41Vegetables and Melons Outlook /VGS-318/December 14, 2006
Economic Research Service, USDA
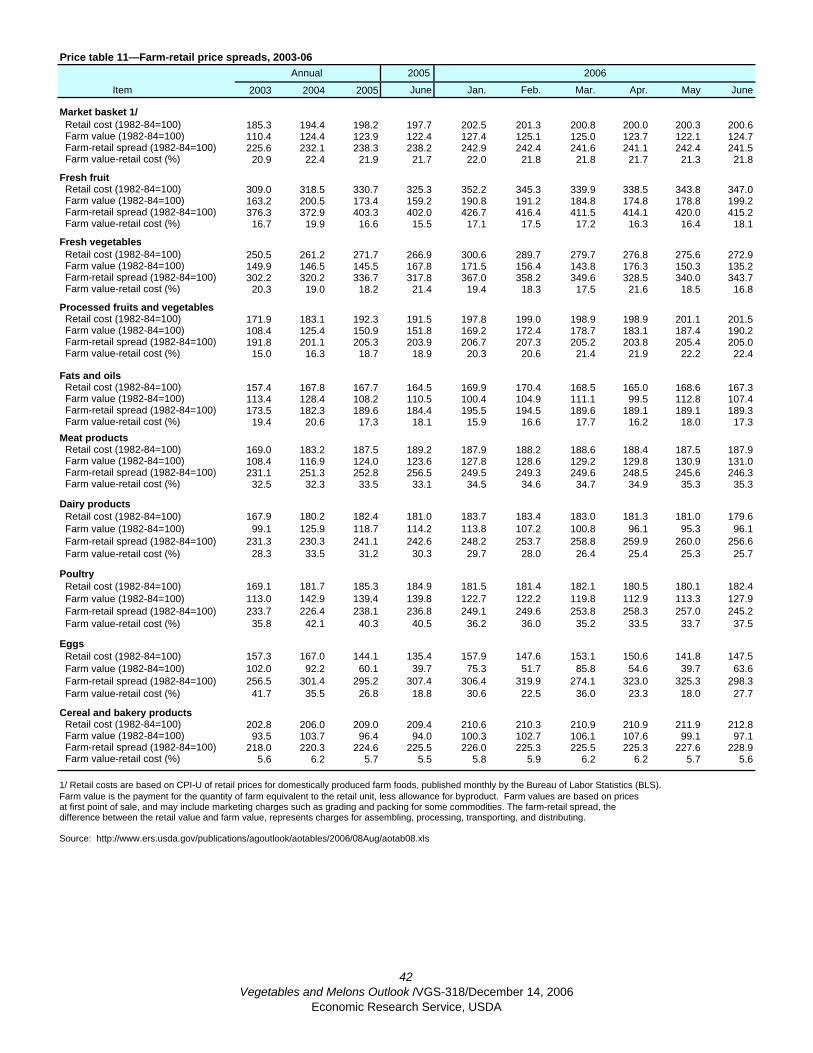
Price table 11—Farm-retail price spreads, 2003-06Annual 2005 2006
Item 2003 2004 2005 June Jan. Feb. Mar. Apr. May June
Market basket 1/ Retail cost (1982-84=100) 185.3 194.4 198.2 197.7 202.5 201.3 200.8 200.0 200.3 200.6 Farm value (1982-84=100) 110.4 124.4 123.9 122.4 127.4 125.1 125.0 123.7 122.1 124.7 Farm-retail spread (1982-84=100) 225.6 232.1 238.3 238.2 242.9 242.4 241.6 241.1 242.4 241.5 Farm value-retail cost (%) 20.9 22.4 21.9 21.7 22.0 21.8 21.8 21.7 21.3 21.8
Fresh fruit Retail cost (1982-84=100) 309.0 318.5 330.7 325.3 352.2 345.3 339.9 338.5 343.8 347.0 Farm value (1982-84=100) 163.2 200.5 173.4 159.2 190.8 191.2 184.8 174.8 178.8 199.2 Farm-retail spread (1982-84=100) 376.3 372.9 403.3 402.0 426.7 416.4 411.5 414.1 420.0 415.2 Farm value-retail cost (%) 16.7 19.9 16.6 15.5 17.1 17.5 17.2 16.3 16.4 18.1
Fresh vegetables Retail cost (1982-84=100) 250.5 261.2 271.7 266.9 300.6 289.7 279.7 276.8 275.6 272.9 Farm value (1982-84=100) 149.9 146.5 145.5 167.8 171.5 156.4 143.8 176.3 150.3 135.2 Farm-retail spread (1982-84=100) 302.2 320.2 336.7 317.8 367.0 358.2 349.6 328.5 340.0 343.7 Farm value-retail cost (%) 20.3 19.0 18.2 21.4 19.4 18.3 17.5 21.6 18.5 16.8
Processed fruits and vegetables Retail cost (1982-84=100) 171.9 183.1 192.3 191.5 197.8 199.0 198.9 198.9 201.1 201.5 Farm value (1982-84=100) 108.4 125.4 150.9 151.8 169.2 172.4 178.7 183.1 187.4 190.2 Farm-retail spread (1982-84=100) 191.8 201.1 205.3 203.9 206.7 207.3 205.2 203.8 205.4 205.0 Farm value-retail cost (%) 15.0 16.3 18.7 18.9 20.3 20.6 21.4 21.9 22.2 22.4
Fats and oils Retail cost (1982-84=100) 157.4 167.8 167.7 164.5 169.9 170.4 168.5 165.0 168.6 167.3 Farm value (1982-84=100) 113.4 128.4 108.2 110.5 100.4 104.9 111.1 99.5 112.8 107.4 Farm-retail spread (1982-84=100) 173.5 182.3 189.6 184.4 195.5 194.5 189.6 189.1 189.1 189.3 Farm value-retail cost (%) 19.4 20.6 17.3 18.1 15.9 16.6 17.7 16.2 18.0 17.3Meat products Retail cost (1982-84=100) 169.0 183.2 187.5 189.2 187.9 188.2 188.6 188.4 187.5 187.9 Farm value (1982-84=100) 108.4 116.9 124.0 123.6 127.8 128.6 129.2 129.8 130.9 131.0 Farm-retail spread (1982-84=100) 231.1 251.3 252.8 256.5 249.5 249.3 249.6 248.5 245.6 246.3 Farm value-retail cost (%) 32.5 32.3 33.5 33.1 34.5 34.6 34.7 34.9 35.3 35.3
Dairy products Retail cost (1982-84=100) 167.9 180.2 182.4 181.0 183.7 183.4 183.0 181.3 181.0 179.6 Farm value (1982-84=100) 99.1 125.9 118.7 114.2 113.8 107.2 100.8 96.1 95.3 96.1 Farm-retail spread (1982-84=100) 231.3 230.3 241.1 242.6 248.2 253.7 258.8 259.9 260.0 256.6 Farm value-retail cost (%) 28.3 33.5 31.2 30.3 29.7 28.0 26.4 25.4 25.3 25.7
Poultry Retail cost (1982-84=100) 169.1 181.7 185.3 184.9 181.5 181.4 182.1 180.5 180.1 182.4 Farm value (1982-84=100) 113.0 142.9 139.4 139.8 122.7 122.2 119.8 112.9 113.3 127.9 Farm-retail spread (1982-84=100) 233.7 226.4 238.1 236.8 249.1 249.6 253.8 258.3 257.0 245.2 Farm value-retail cost (%) 35.8 42.1 40.3 40.5 36.2 36.0 35.2 33.5 33.7 37.5
Eggs Retail cost (1982-84=100) 157.3 167.0 144.1 135.4 157.9 147.6 153.1 150.6 141.8 147.5 Farm value (1982-84=100) 102.0 92.2 60.1 39.7 75.3 51.7 85.8 54.6 39.7 63.6 Farm-retail spread (1982-84=100) 256.5 301.4 295.2 307.4 306.4 319.9 274.1 323.0 325.3 298.3 Farm value-retail cost (%) 41.7 35.5 26.8 18.8 30.6 22.5 36.0 23.3 18.0 27.7
Cereal and bakery products Retail cost (1982-84=100) 202.8 206.0 209.0 209.4 210.6 210.3 210.9 210.9 211.9 212.8 Farm value (1982-84=100) 93.5 103.7 96.4 94.0 100.3 102.7 106.1 107.6 99.1 97.1 Farm-retail spread (1982-84=100) 218.0 220.3 224.6 225.5 226.0 225.3 225.5 225.3 227.6 228.9 Farm value-retail cost (%) 5.6 6.2 5.7 5.5 5.8 5.9 6.2 6.2 5.7 5.6
1/ Retail costs are based on CPI-U of retail prices for domestically produced farm foods, published monthly by the Bureau of Labor Statistics (BLS).Farm value is the payment for the quantity of farm equivalent to the retail unit, less allowance for byproduct. Farm values are based on pricesat first point of sale, and may include marketing charges such as grading and packing for some commodities. The farm-retail spread, the difference between the retail value and farm value, represents charges for assembling, processing, transporting, and distributing.
Source: http://www.ers.usda.gov/publications/agoutlook/aotables/2006/08Aug/aotab08.xls
42Vegetables and Melons Outlook /VGS-318/December 14, 2006
Economic Research Service, USDA

Price table 12—U.S. tomato prices: Year, month, and level of record highs 1/Retail Farm
Item Year Price Year Price Cents/pound Cents/pound
Fresh tomatoes January 2006 216.20 1990 116.00 February 1990 236.10 1990 97.60 March 1990 176.50 1996 81.70 April 1996 186.70 2005 65.10 May 2005 191.10 1993 58.10 June 1991 167.20 1991 59.50 July 2005 160.70 1998 40.90 August 2003 151.30 2003 40.00 September 2006 190.80 2006 52.10 October 2004 171.50 2004 70.80 November 2004 233.70 2004 119.00 December 2004 246.70 2005 --
-- = not disclosed. 1/ Nominal dollar prices (unadjusted for inflation).
Source: U.S. Department of Labor, Bureau of Labor Statistics (http://www.bls.gov/data/home.htm) and USDA, National Agricultural Statistics Service, Agricultural Prices.
43Vegetables and Melons Outlook /VGS-318/December 14, 2006
Economic Research Service, USDA