AVG 9 Internet Securitydownload.avg.com/filedir/doc/AVG_Internet_Security/... · avg: • • ().). ...
Vegetable Crops Irrigation and Nitrogen Management
Tom Turini
University of California
Agriculture and Natural Resources
Vegetable Crops Advisor
Fresno County
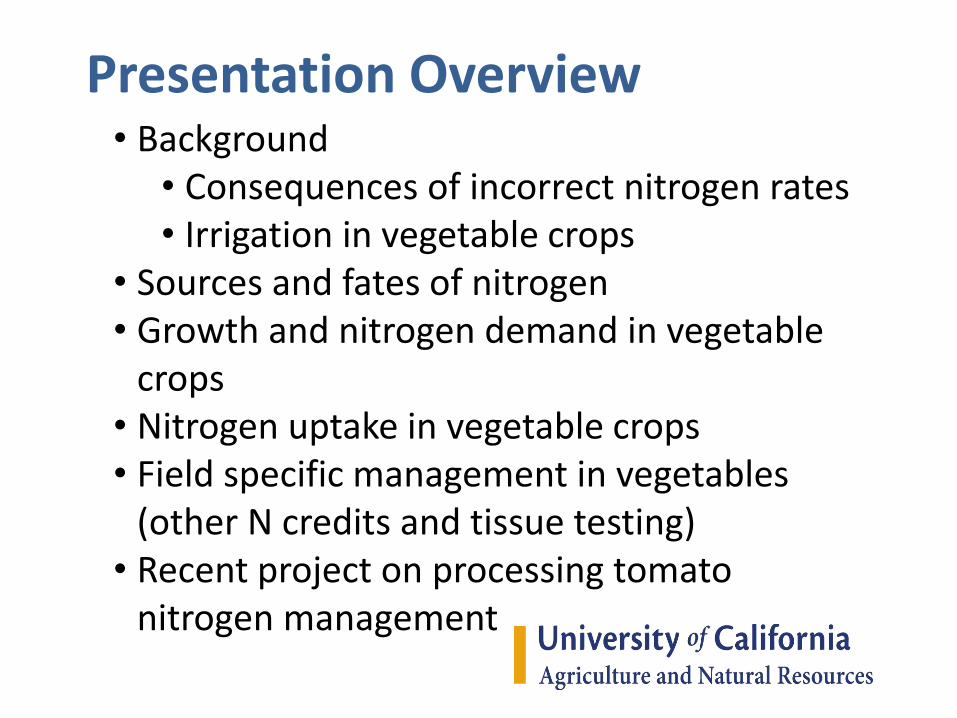
• Background• Consequences of incorrect nitrogen rates• Irrigation in vegetable crops
• Sources and fates of nitrogen• Growth and nitrogen demand in vegetable
crops• Nitrogen uptake in vegetable crops• Field specific management in vegetables
(other N credits and tissue testing)• Recent project on processing tomato
nitrogen management
Presentation Overview
• Background• Consequences of incorrect nitrogen rates• Irrigation in vegetable crops
• Sources and fates of nitrogen• Growth and nitrogen demand in vegetable
crops
Presentation Overview
Nitrogen Deficiency –Rare Commercially • Nitrogen is a major component of plants
(chlorophyll, amino acids – protein, genetic material)
• Deficiencies will decrease yield and may decrease quality.
• Symptoms: leaves become light green or yellow, decrease size of all plant structures including
fruit and leaves.
Overview• Basic principles
– Nitrogen cycle
– When and how much
– Consequences of incorrect rates
• Recent developments regarding Nitrogen
• Nitrogen plan worksheet
• Generalizations
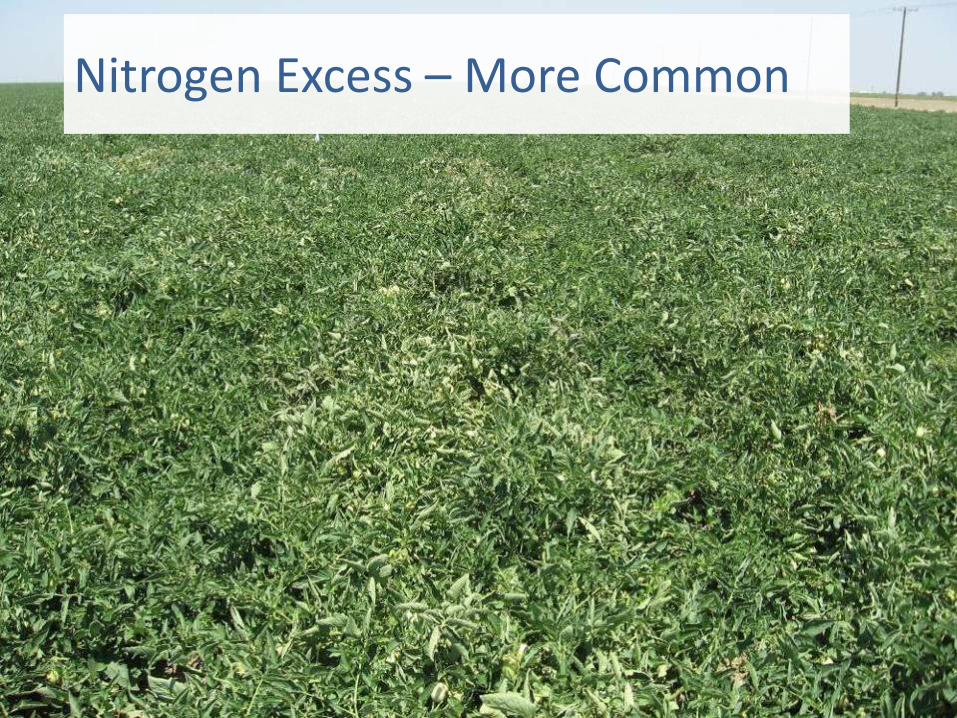
Nitrogen Excess – More Common
Overview• Basic principles
– Nitrogen cycle
– When and how much
– Consequences of incorrect rates
• Recent developments regarding Nitrogen
• Nitrogen plan worksheet
• Generalizations
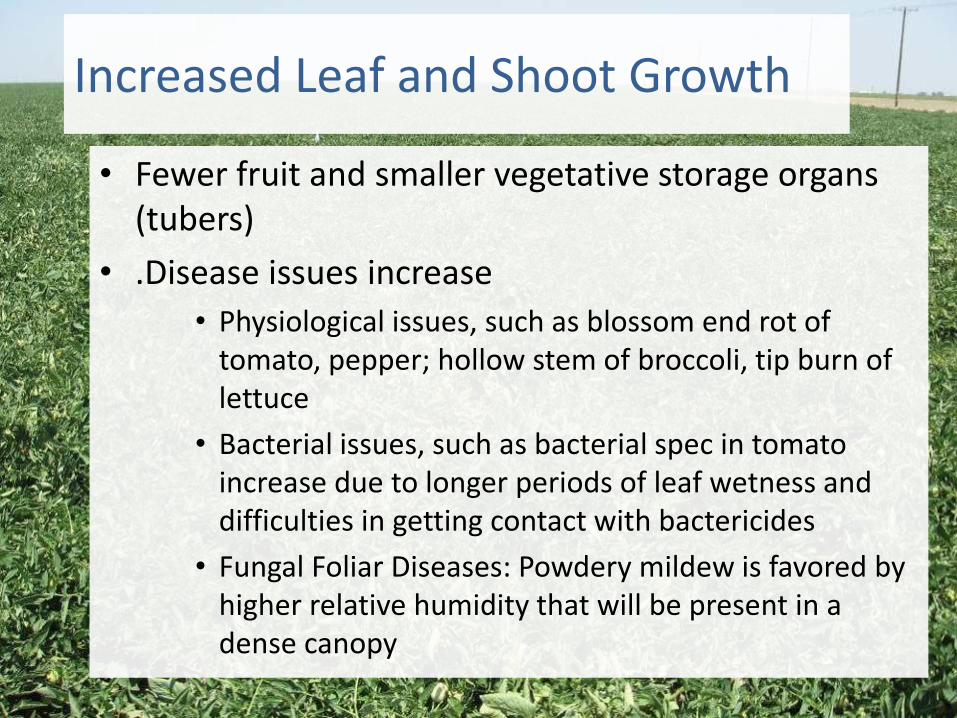
Increased Leaf and Shoot Growth
• Fewer fruit and smaller vegetative storage organs (tubers)
• .Disease issues increase
• Physiological issues, such as blossom end rot of tomato, pepper; hollow stem of broccoli, tip burn of lettuce
• Bacterial issues, such as bacterial spec in tomato increase due to longer periods of leaf wetness and difficulties in getting contact with bactericides
• Fungal Foliar Diseases: Powdery mildew is favored by higher relative humidity that will be present in a dense canopy
Overview• Basic principles
– Nitrogen cycle
– When and how much
– Consequences of incorrect rates
• Recent developments regarding Nitrogen
• Nitrogen plan worksheet
• Generalizations
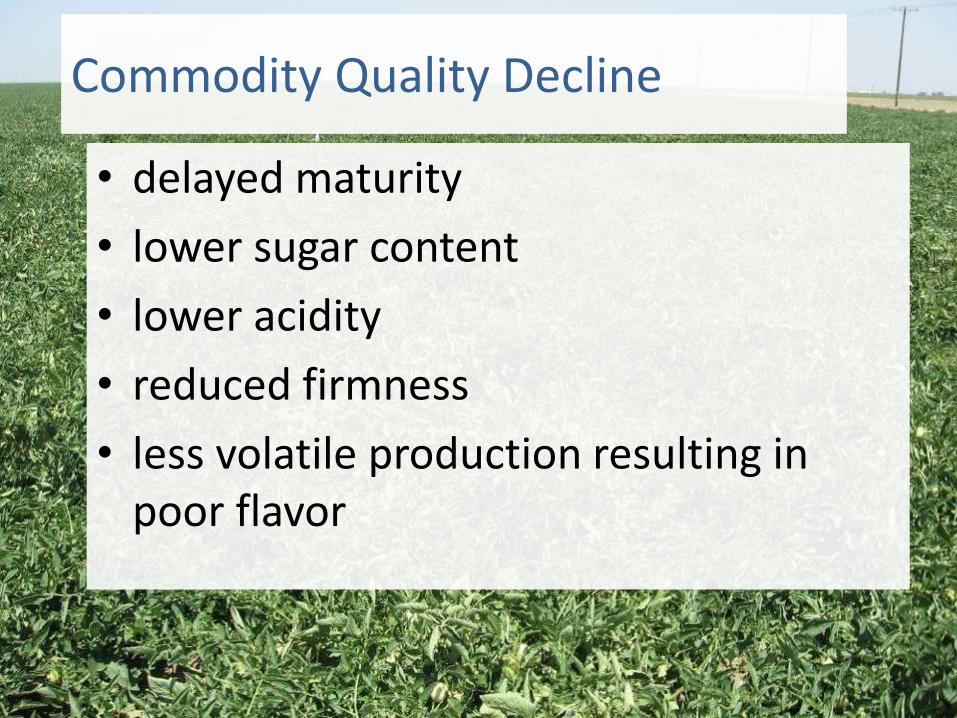
Commodity Quality Decline
• delayed maturity
• lower sugar content
• lower acidity
• reduced firmness
• less volatile production resulting in poor flavor
• Background• Consequences of incorrect nitrogen rates• Irrigation in vegetable crops
• Sources and fates of nitrogen• Growth and nitrogen demand in vegetable
crops
Presentation Overview
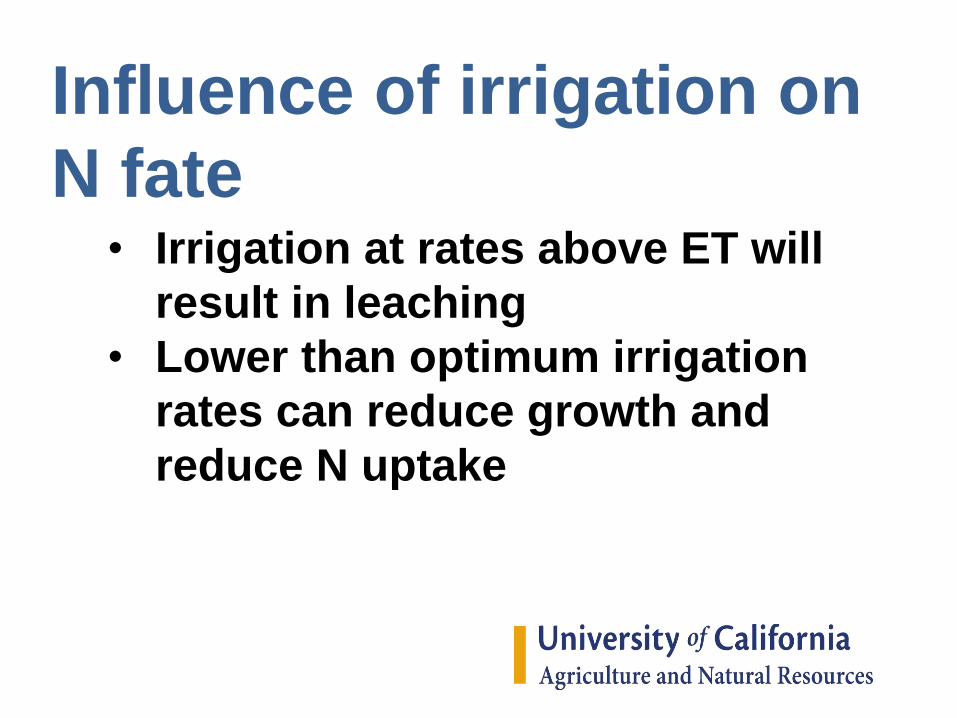
• Irrigation at rates above ET will
result in leaching
• Lower than optimum irrigation
rates can reduce growth and
reduce N uptake
Influence of irrigation on
N fate
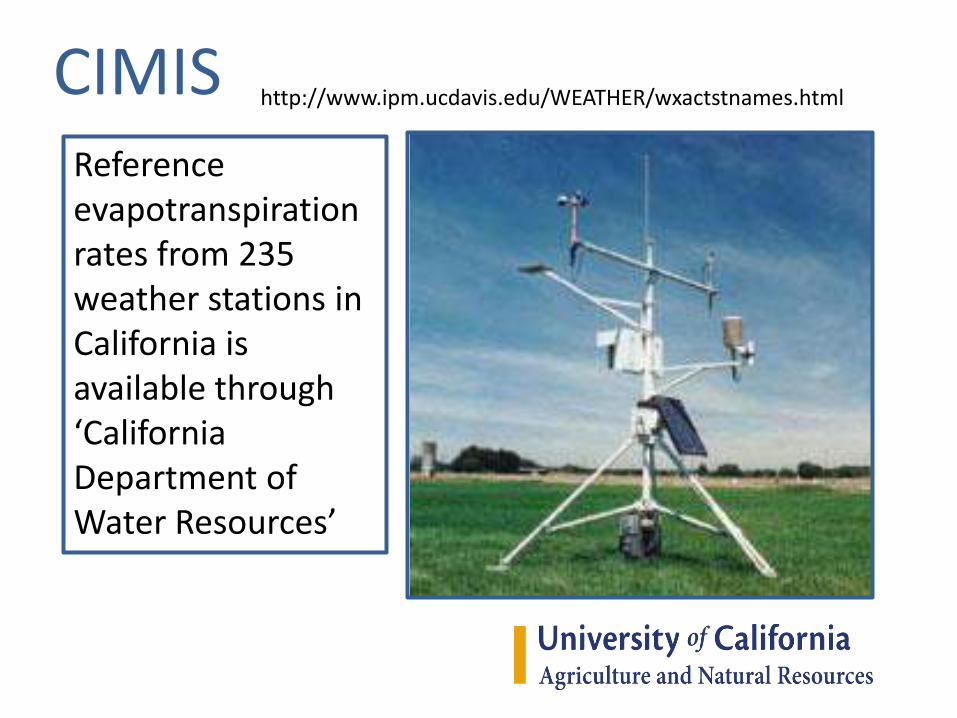
CIMISReference evapotranspiration rates from 235 weather stations in California is available through ‘California Department of Water Resources’
http://www.ipm.ucdavis.edu/WEATHER/wxactstnames.html
Canopy Coverage (%)
0 10 20 30 40 50 60 70 80 90 100
Cro
p C
oeff
icie
nt
0.0
0.1
0.2
0.3
0.4
0.5
0.6
0.7
0.8
0.9
1.0
1.1
1.2
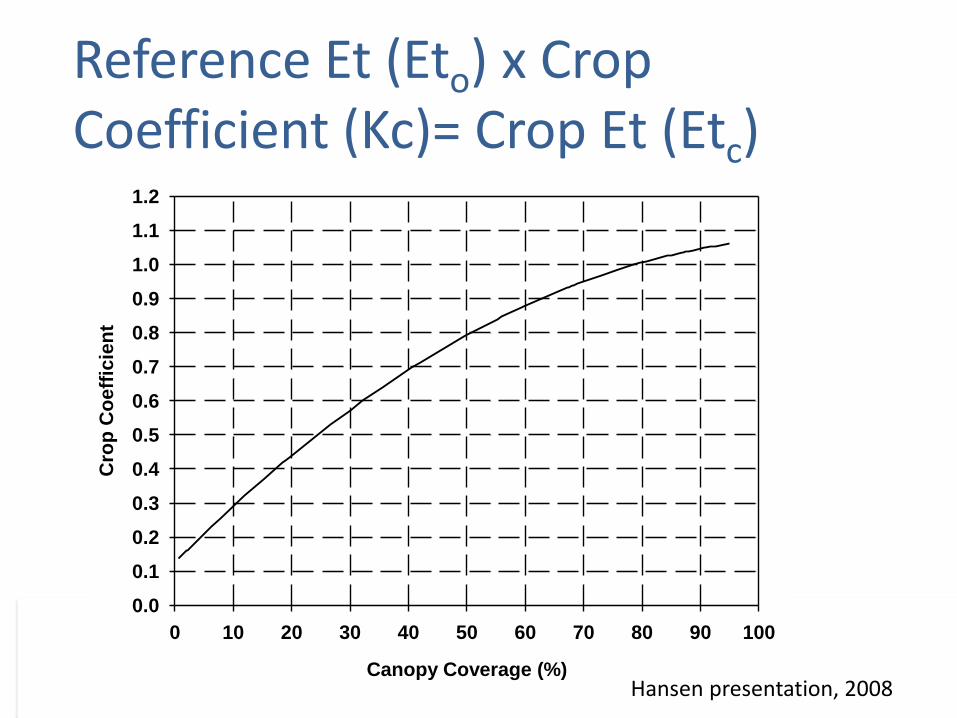
Reference Et (Eto) x Crop Coefficient (Kc)= Crop Et (Etc)
Hansen presentation, 2008
• Water stress during any growth
stage may reduce yield
• Earlier growth stages – more
sensitive to water stress
• Later growth stages – less
sensitive to water stress
Plant Growth Stage
Considerations
T. C. Hsiao, UC Davis
Deficit Irrigation
Irrigation rates are reduced during the last 60 days of the crop to levels below evapotranspiration may not reduce yields in processing tomatoes.
Deficit Irrigation Impact on Processing Tomato Yield and Quality
• Clay loam soil in a comercial Five Points-área field
• Over 3 years, irrigation quantities werereduced to a percentage of Etc durring the last60 days of the crop.
• Soil moisture levels were measured withnutron probes
• Tomato yield was measured with a mechanicalharvester and a scale-equipped trailer.
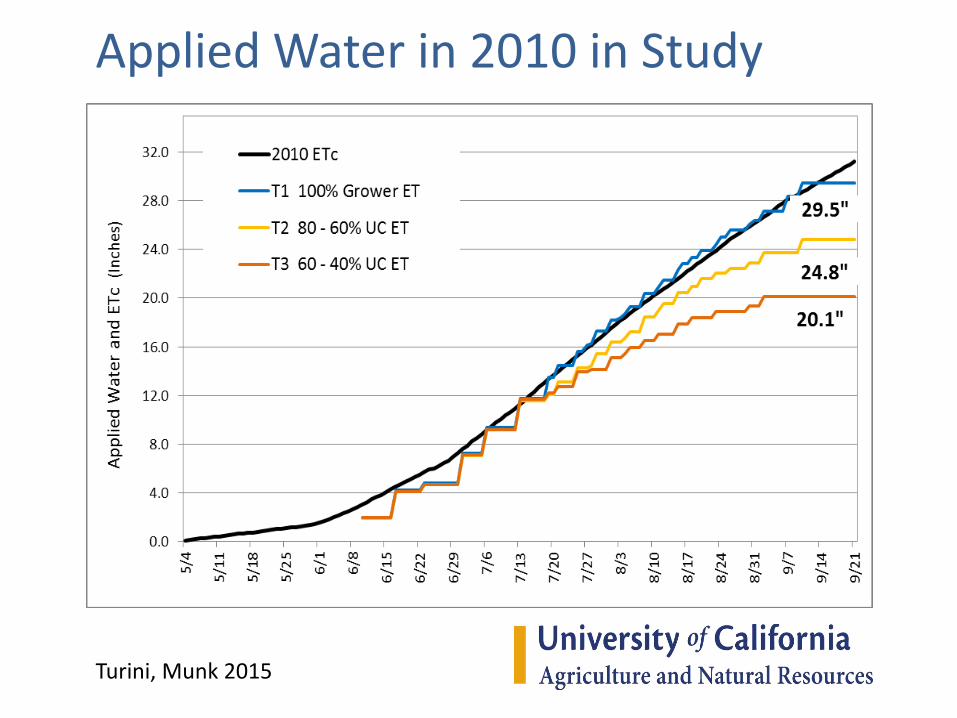
Applied Water in 2010 in Study
Turini, Munk 2015
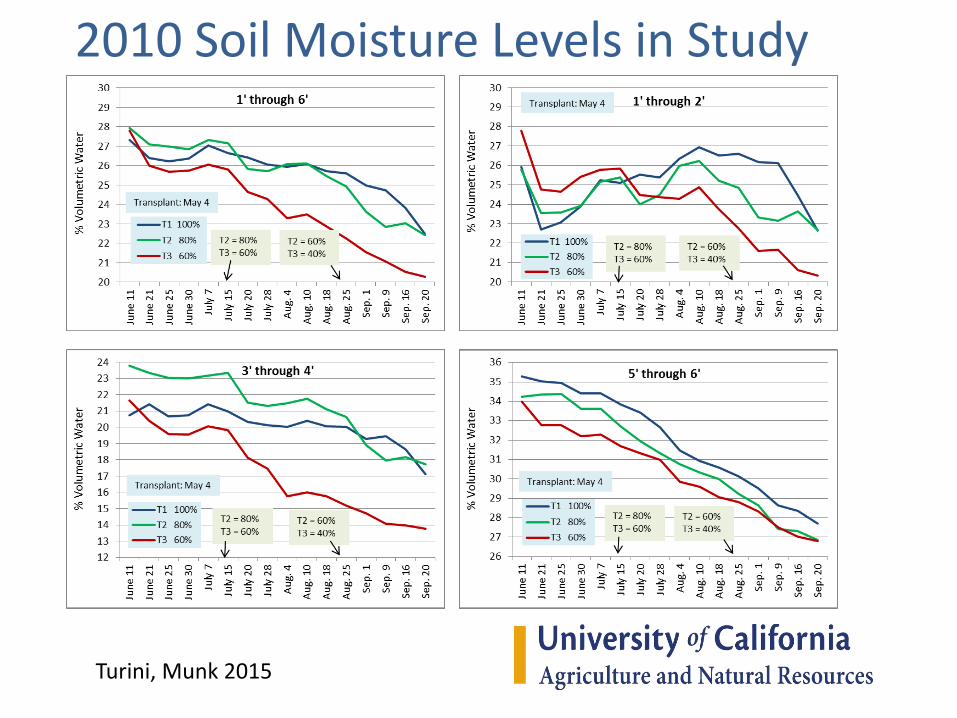
2010 Soil Moisture Levels in Study
Turini, Munk 2015
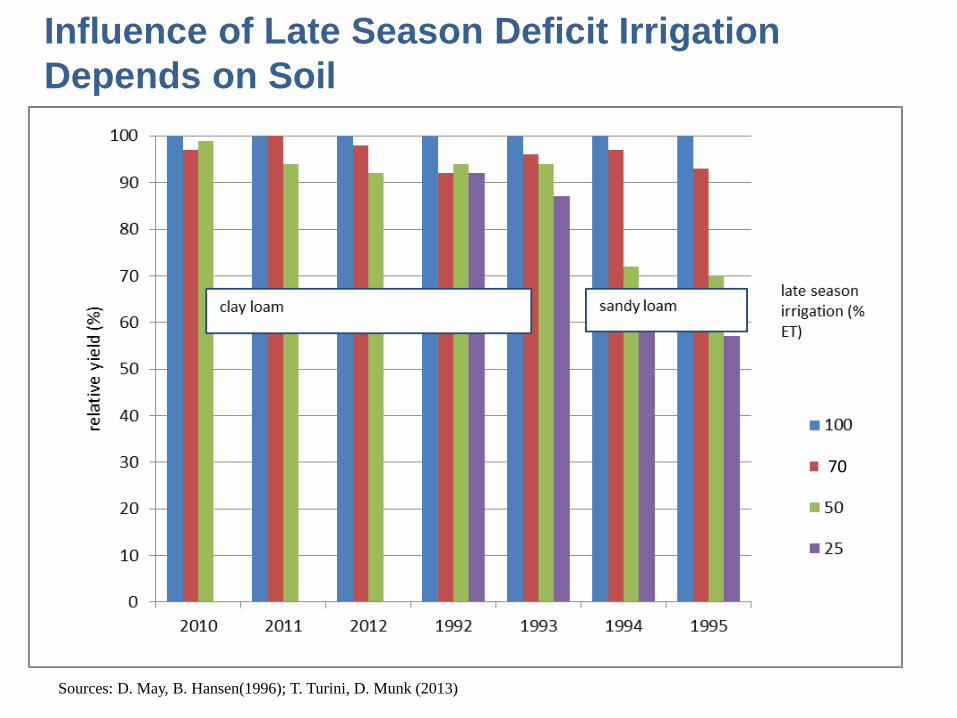
Sources: D. May, B. Hansen(1996); T. Turini, D. Munk (2013)
Influence of Late Season Deficit Irrigation
Depends on Soil
70
Deficit Irrigation
• No yield diferences were observed in thestudy conducted from 2010 to 2012 in theclay-loam soil.
• In 1994 and 1995 a similar study wasconducted in a sandy-loam and there was a 30 to 32% yield reduction at a 50 % deficit.
• Background• Consequences of incorrect nitrogen rates• Irrigation in vegetable crops
• Sources and fates of nitrogen• Growth and nitrogen demand in vegetable
crops
Presentation Overview
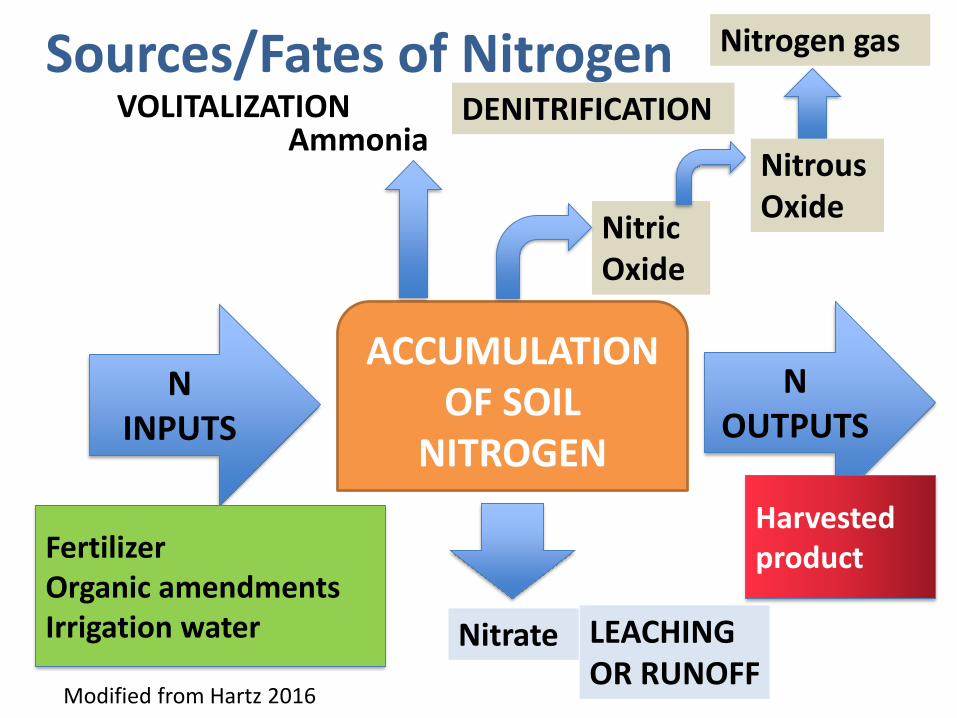
Sources/Fates of Nitrogen
ACCUMULATION OF SOIL
NITROGEN
N OUTPUTS
N INPUTS
Nitrate
Harvested productFertilizer
Organic amendmentsIrrigation water
AmmoniaNitrous Oxide
Nitric Oxide
VOLITALIZATION DENITRIFICATION
Nitrogen gas
LEACHING OR RUNOFF
Modified from Hartz 2016
• Background• Consequences of incorrect nitrogen rates• Irrigation in vegetable crops
• Sources and fates of nitrogen• Growth and nitrogen demand in vegetable
crops
Presentation Overview
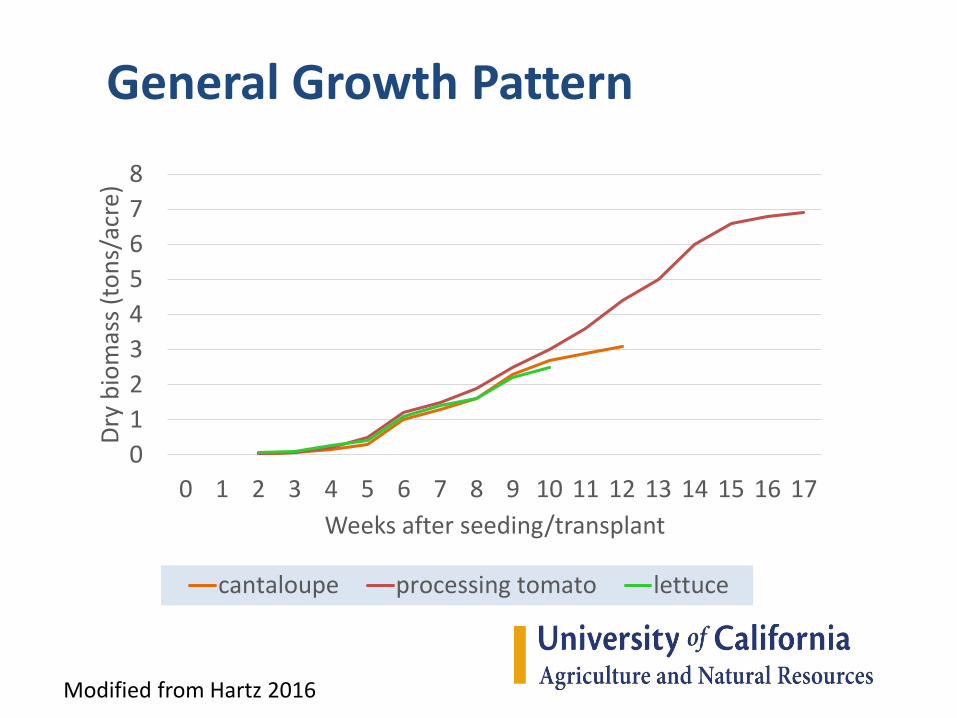
General Growth Pattern
0
1
2
3
4
5
6
7
8
0 1 2 3 4 5 6 7 8 9 10 11 12 13 14 15 16 17
Dry
bio
mas
s (t
on
s/ac
re)
Weeks after seeding/transplant
cantaloupe processing tomato lettuce
Modified from Hartz 2016
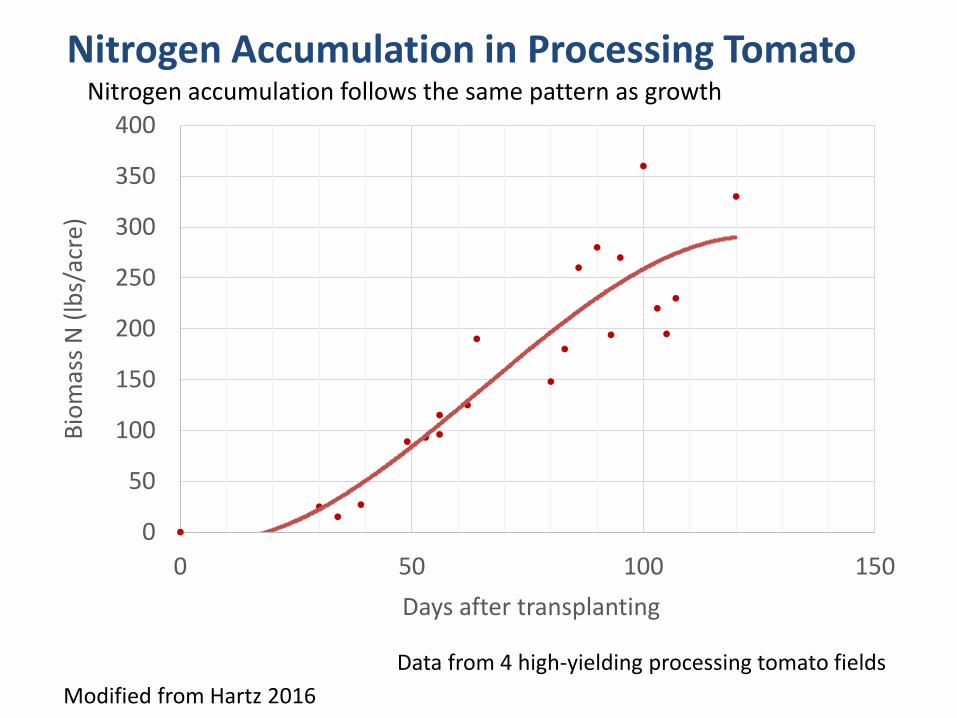
Nitrogen Accumulation in Processing Tomato
0
50
100
150
200
250
300
350
400
0 50 100 150
Bio
mas
s N
(lb
s/ac
re)
Days after transplanting
Nitrogen accumulation follows the same pattern as growth
Data from 4 high-yielding processing tomato fields
Modified from Hartz 2016
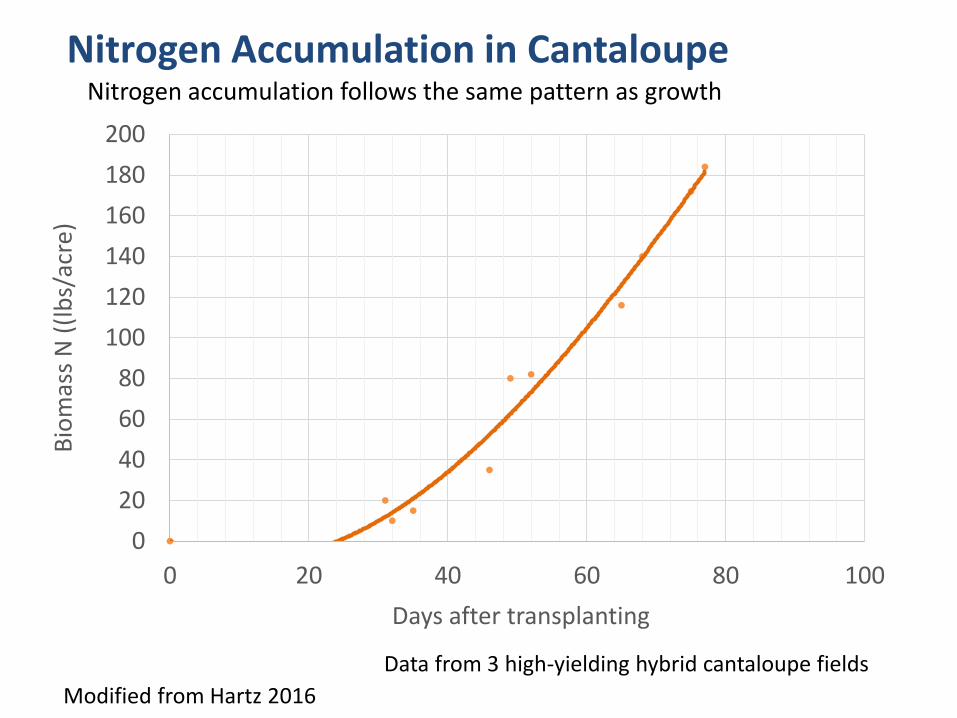
Nitrogen Accumulation in Cantaloupe
0
20
40
60
80
100
120
140
160
180
200
0 20 40 60 80 100
Bio
mas
s N
((l
bs/
acre
)
Days after transplanting
Nitrogen accumulation follows the same pattern as growth
Data from 3 high-yielding hybrid cantaloupe fields
Modified from Hartz 2016
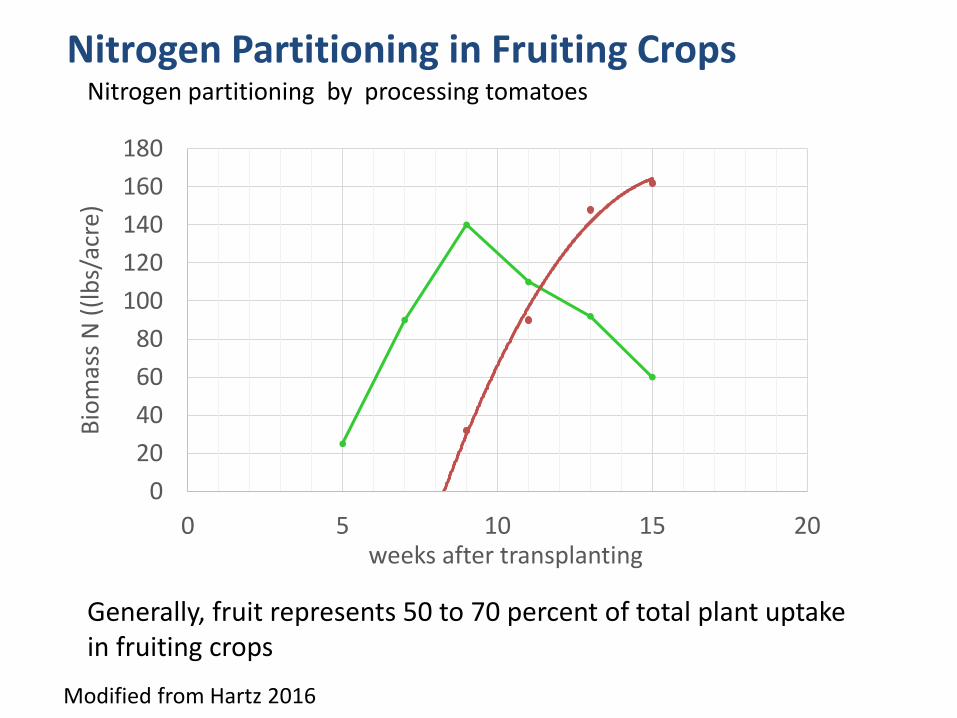
Nitrogen Partitioning in Fruiting Crops
0
20
40
60
80
100
120
140
160
180
0 5 10 15 20
Bio
mas
s N
((l
bs/
acre
)
weeks after transplanting
Nitrogen partitioning by processing tomatoes
Generally, fruit represents 50 to 70 percent of total plant uptake in fruiting crops
Modified from Hartz 2016
• Background• Consequences of incorrect nitrogen rates• Irrigation in vegetable crops
• Sources and fates of nitrogen• Growth and nitrogen demand in vegetable
crops• Nitrogen uptake in vegetable crops• Field specific management in vegetables
Presentation Overview
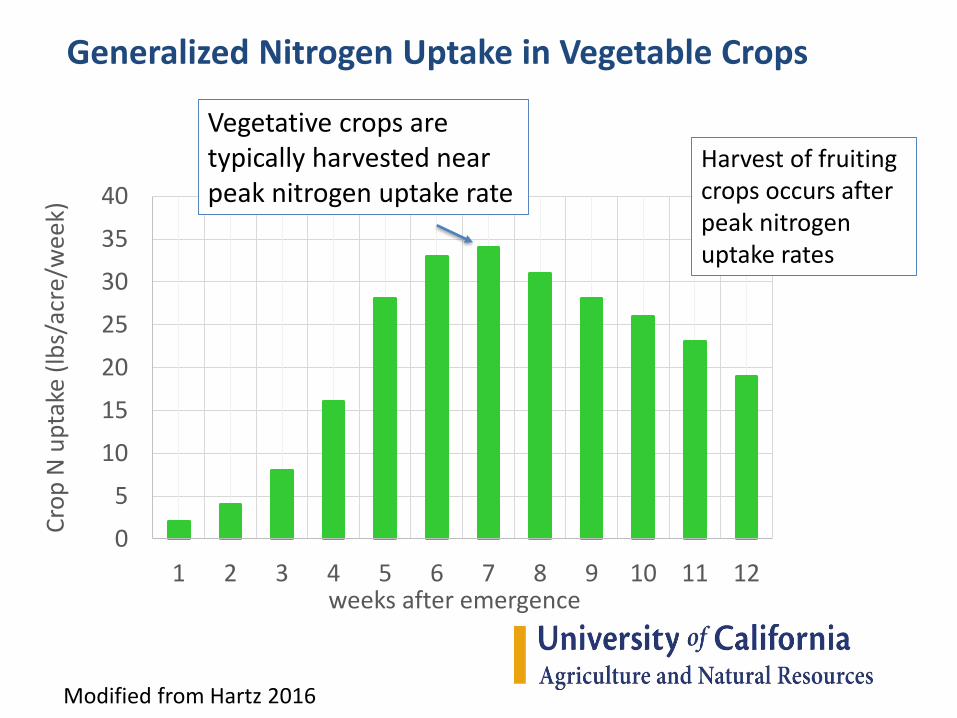
Generalized Nitrogen Uptake in Vegetable Crops
0
5
10
15
20
25
30
35
40
1 2 3 4 5 6 7 8 9 10 11 12
Cro
p N
up
take
(lb
s/ac
re/w
eek)
weeks after emergence
Harvest of fruiting crops occurs after peak nitrogen uptake rates
Vegetative crops are typically harvested near peak nitrogen uptake rate
Modified from Hartz 2016
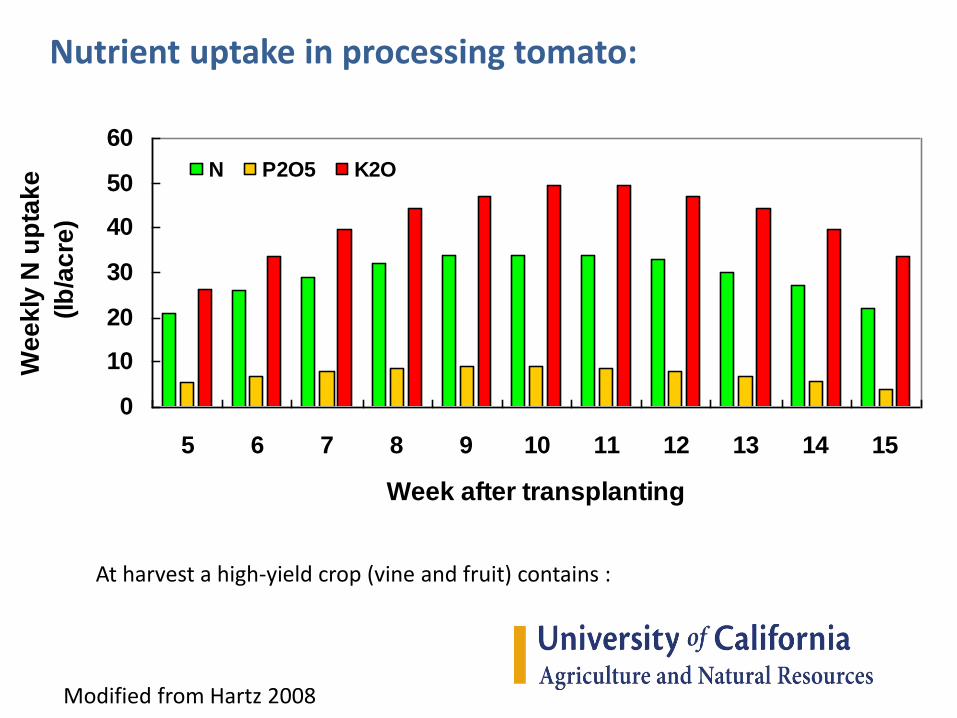
Nutrient uptake in processing tomato:
0
10
20
30
40
50
60
5 6 7 8 9 10 11 12 13 14 15
Week after transplanting
We
ek
ly N
up
tak
e
(lb
/ac
re)
N P2O5 K2O
At harvest a high-yield crop (vine and fruit) contains :
Modified from Hartz 2008
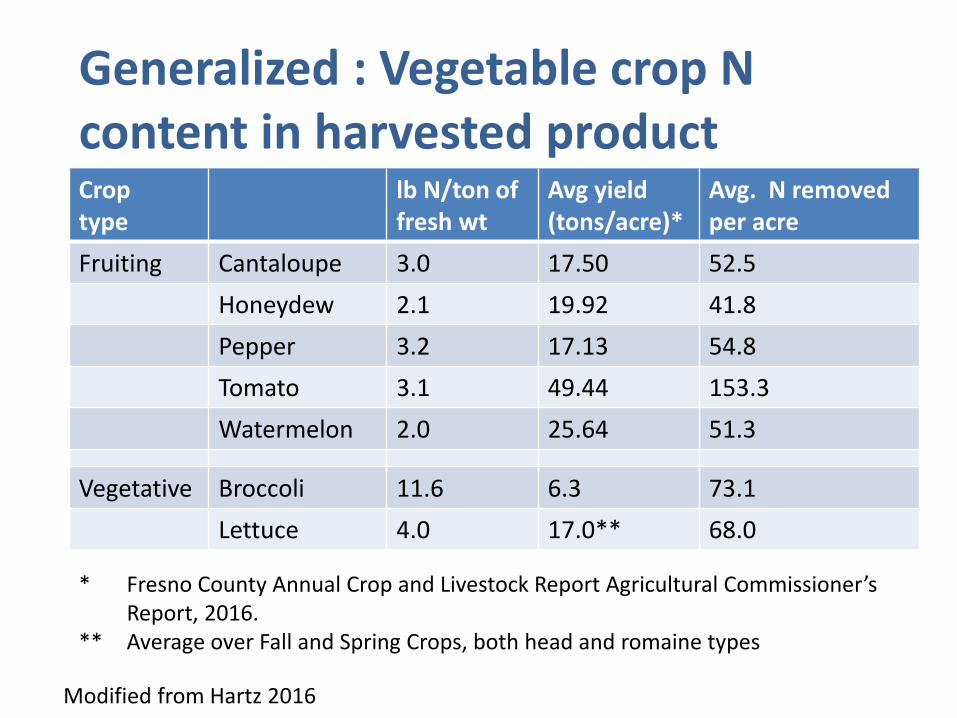
Generalized : Vegetable crop N content in harvested productCroptype
lb N/ton of fresh wt
Avg yield (tons/acre)*
Avg. N removed per acre
Fruiting Cantaloupe 3.0 17.50 52.5
Honeydew 2.1 19.92 41.8
Pepper 3.2 17.13 54.8
Tomato 3.1 49.44 153.3
Watermelon 2.0 25.64 51.3
Vegetative Broccoli 11.6 6.3 73.1
Lettuce 4.0 17.0** 68.0
* Fresno County Annual Crop and Livestock Report Agricultural Commissioner’s Report, 2016.
** Average over Fall and Spring Crops, both head and romaine types
Modified from Hartz 2016
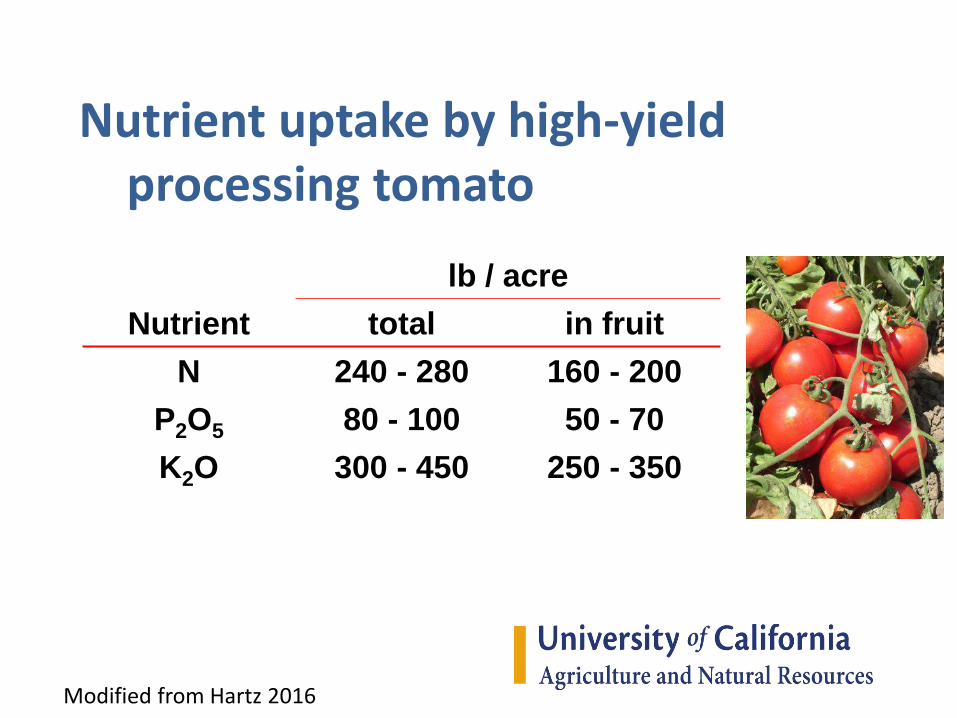
Nutrient uptake by high-yield processing tomato
lb / acre
Nutrient total in fruit
N 240 - 280 160 - 200
P2O5 80 - 100 50 - 70
K2O 300 - 450 250 - 350
Modified from Hartz 2016
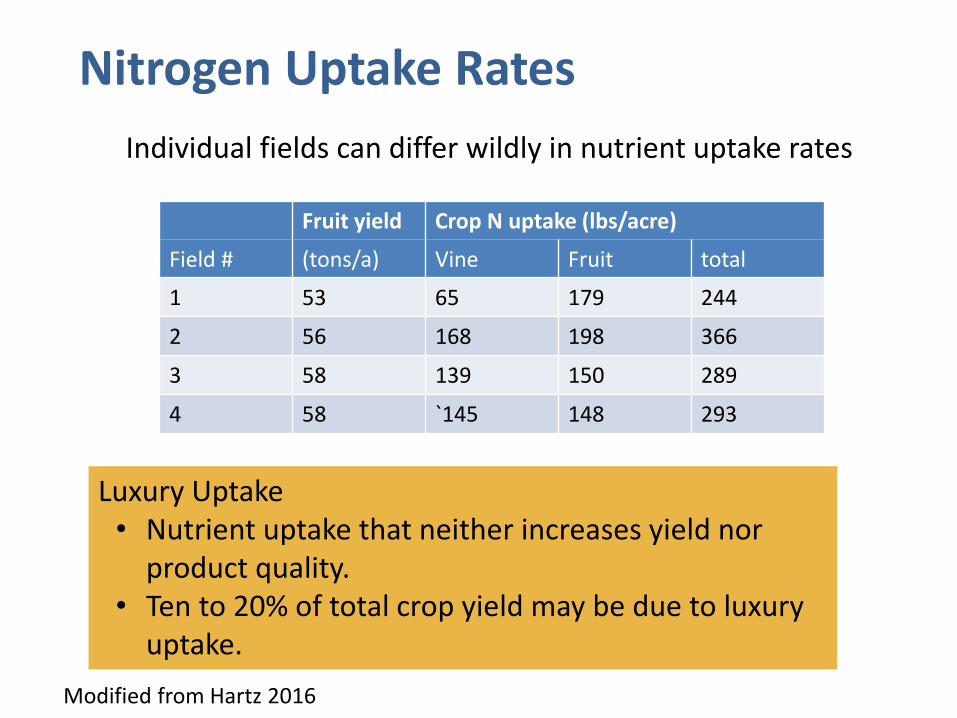
Nitrogen Uptake Rates
Individual fields can differ wildly in nutrient uptake rates
Fruit yield Crop N uptake (lbs/acre)
Field # (tons/a) Vine Fruit total
1 53 65 179 244
2 56 168 198 366
3 58 139 150 289
4 58 `145 148 293
Luxury Uptake• Nutrient uptake that neither increases yield nor
product quality.• Ten to 20% of total crop yield may be due to luxury
uptake.
Modified from Hartz 2016
• Background• Consequences of incorrect nitrogen rates• Irrigation in vegetable crops
• Sources and fates of nitrogen• Growth and nitrogen demand in vegetable
crops• Nitrogen uptake in vegetable crops• Field specific management in vegetables
(other N credits and tissue testing)
Presentation Overview
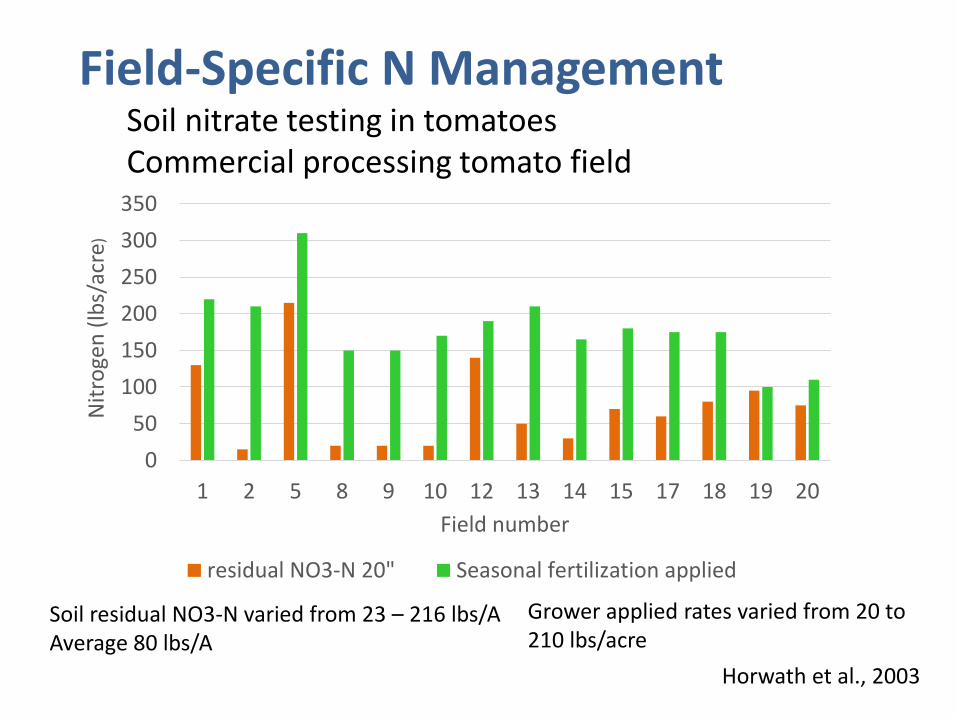
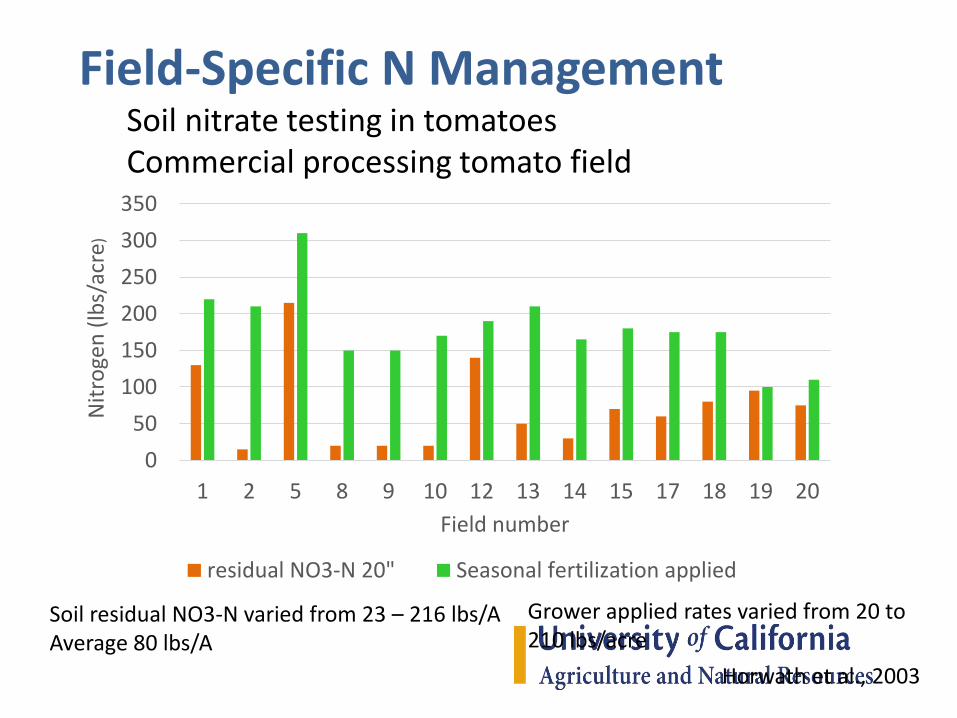
Field-Specific N ManagementSoil nitrate testing in tomatoes Commercial processing tomato field
0
50
100
150
200
250
300
350
1 2 5 8 9 10 12 13 14 15 17 18 19 20
Nit
roge
n (
lbs/
acre
)
Field number
residual NO3-N 20" Seasonal fertilization applied
Horwath et al., 2003
Soil residual NO3-N varied from 23 – 216 lbs/AAverage 80 lbs/A
Grower applied rates varied from 20 to 210 lbs/acre
Example of Nitrogen Balance based on these observations
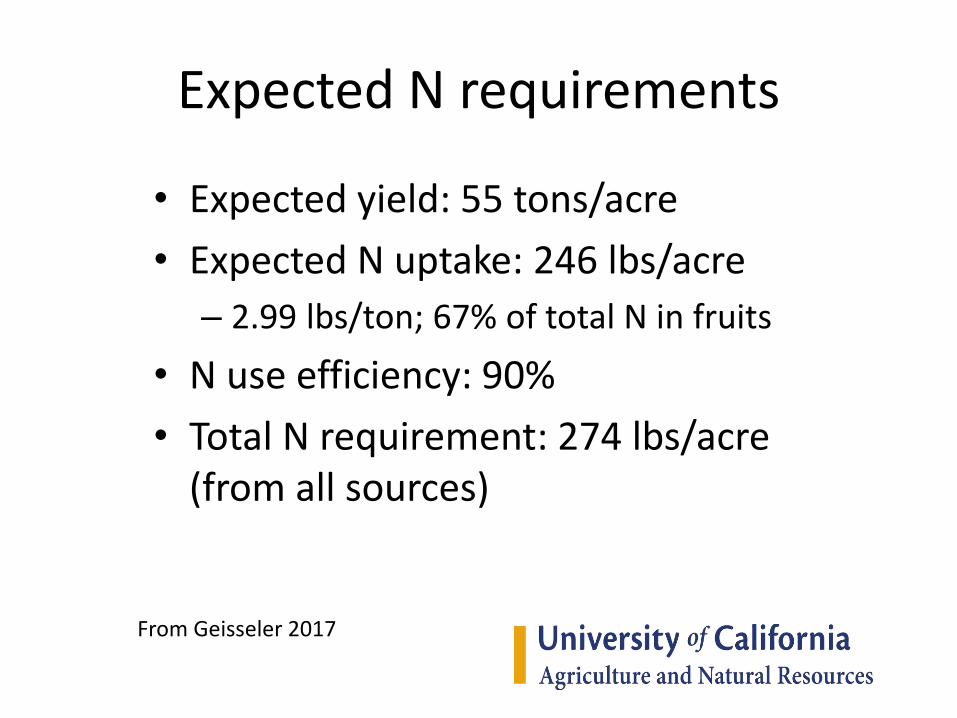
Expected N requirements
• Expected yield: 55 tons/acre
• Expected N uptake: 246 lbs/acre
– 2.99 lbs/ton; 67% of total N in fruits
• N use efficiency: 90%
• Total N requirement: 274 lbs/acre (from all sources)
From Geisseler 2017
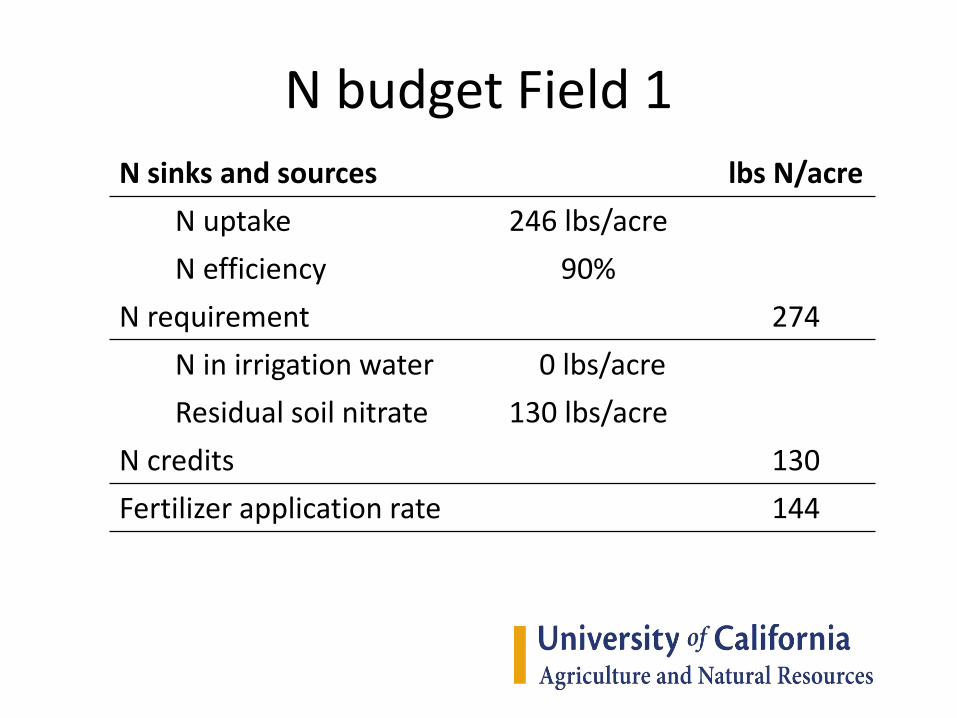
N budget Field 1
N sinks and sources lbs N/acre
N uptake 246 lbs/acre
N efficiency 90%
N requirement 274
N in irrigation water 0 lbs/acre
Residual soil nitrate 130 lbs/acre
N credits 130
Fertilizer application rate 144

Field-Specific N ManagementSoil nitrate testing in tomatoes Commercial processing tomato field
0
50
100
150
200
250
300
350
1 2 5 8 9 10 12 13 14 15 17 18 19 20
Nit
roge
n (
lbs/
acre
)
Field number
residual NO3-N 20" Seasonal fertilization applied
Horwath et al., 2003
Soil residual NO3-N varied from 23 – 216 lbs/AAverage 80 lbs/A
Grower applied rates varied from 20 to 210 lbs/acre
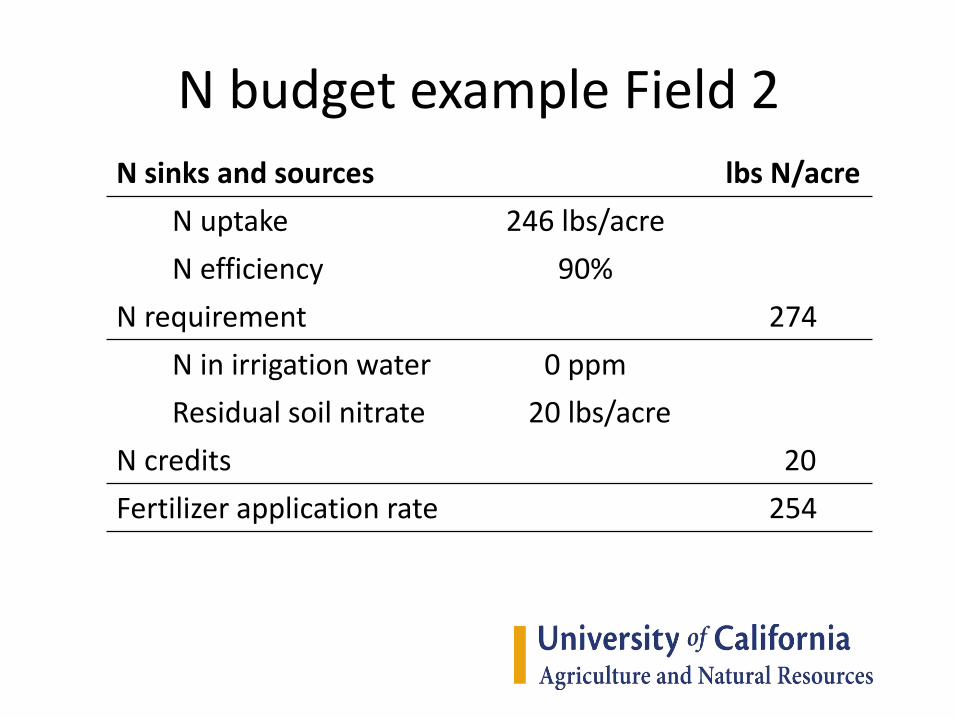
N budget example Field 2
N sinks and sources lbs N/acre
N uptake 246 lbs/acre
N efficiency 90%
N requirement 274
N in irrigation water 0 ppm
Residual soil nitrate 20 lbs/acre
N credits 20
Fertilizer application rate 254

Field-Specific N ManagementSoil nitrate testing in tomatoes Commercial processing tomato field
0
50
100
150
200
250
300
350
1 2 5 8 9 10 12 13 14 15 17 18 19 20
Nit
roge
n (
lbs/
acre
)
Field number
residual NO3-N 20" Seasonal fertilization applied
Horwath et al., 2003
Soil residual NO3-N varied from 23 – 216 lbs/AAverage 80 lbs/A
Grower applied rates varied from 20 to 210 lbs/acre

N budget Field 3
N sinks and sources lbs N/acre
N uptake 246 lbs/acre
N efficiency 90%
N requirement 274
N in irrigation water 0 lbs/acre
Residual soil nitrate 210 lbs/acre
N credits 210
Fertilizer application rate 64
Field-Specific N ManagementSoil nitrate testing in tomatoes Commercial processing tomato field
0
50
100
150
200
250
300
350
1 2 5 8 9 10 12 13 14 15 17 18 19 20
Nit
roge
n (
lbs/
acre
)
Field number
residual NO3-N 20" Seasonal fertilization applied
Horwath et al., 2003
Soil residual NO3-N varied from 23 – 216 lbs/AAverage 80 lbs/A
Grower applied rates varied from 20 to 210 lbs/acre
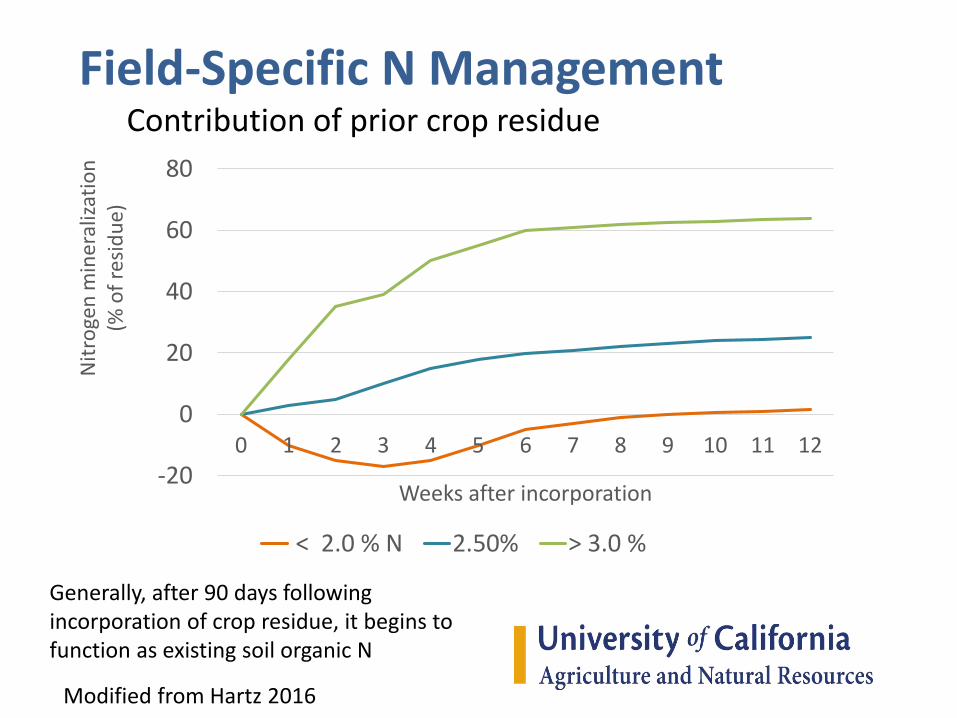
Field-Specific N ManagementContribution of prior crop residue
-20
0
20
40
60
80
0 1 2 3 4 5 6 7 8 9 10 11 12
Nit
roge
n m
iner
aliz
atio
n
(% o
f re
sid
ue)
Weeks after incorporation
< 2.0 % N 2.50% > 3.0 %
Generally, after 90 days following incorporation of crop residue, it begins to function as existing soil organic N
Modified from Hartz 2016
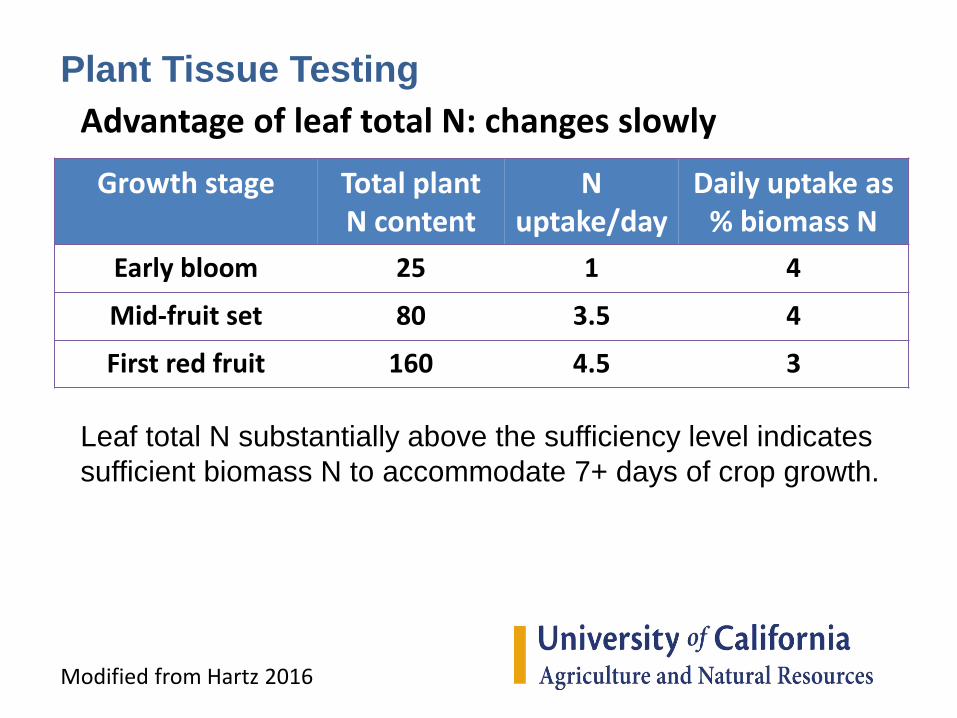
Plant Tissue Testing
Growth stage Total plant N content
N uptake/day
Daily uptake as % biomass N
Early bloom 25 1 4
Mid-fruit set 80 3.5 4
First red fruit 160 4.5 3
Leaf total N substantially above the sufficiency level indicates
sufficient biomass N to accommodate 7+ days of crop growth.
Advantage of leaf total N: changes slowly
Modified from Hartz 2016
0
1
2
3
4
5
6
7
0 500 1000 1500 2000
Leaf
to
tal N
(%
)
Growing degree days
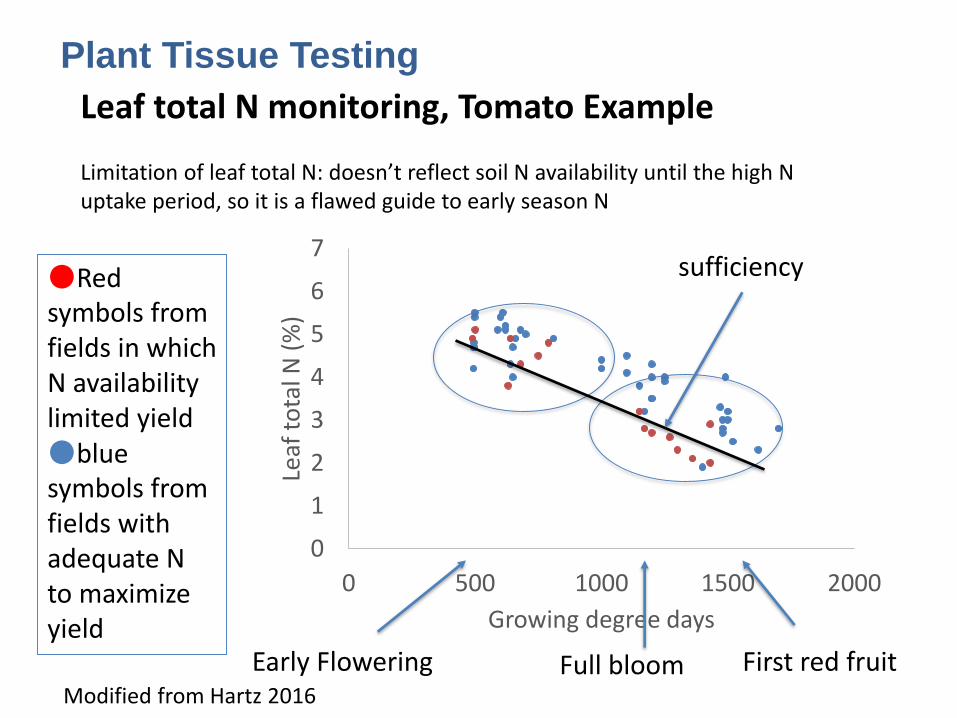
Plant Tissue Testing
Leaf total N monitoring, Tomato Example
●Red symbols from fields in which N availability limited yield●blue symbols from fields with adequate N to maximize yield
Early Flowering First red fruitFull bloom
sufficiency
Limitation of leaf total N: doesn’t reflect soil N availability until the high N uptake period, so it is a flawed guide to early season N
Modified from Hartz 2016
• Background• Consequences of incorrect nitrogen rates• Irrigation in vegetable crops
• Sources and fates of nitrogen• Growth and nitrogen demand in vegetable
crops• Nitrogen uptake in vegetable crops• Field specific management in vegetables
(other N credits and tissue testing)• Recent project on processing tomato
nitrogen management
Presentation Overview
Statewide 2016-17 Site Specific Nitrogen Management Study in Processing Tomatoes
Led by Daniel Geisseler (UC Davis Nutrient
Management Specialist)
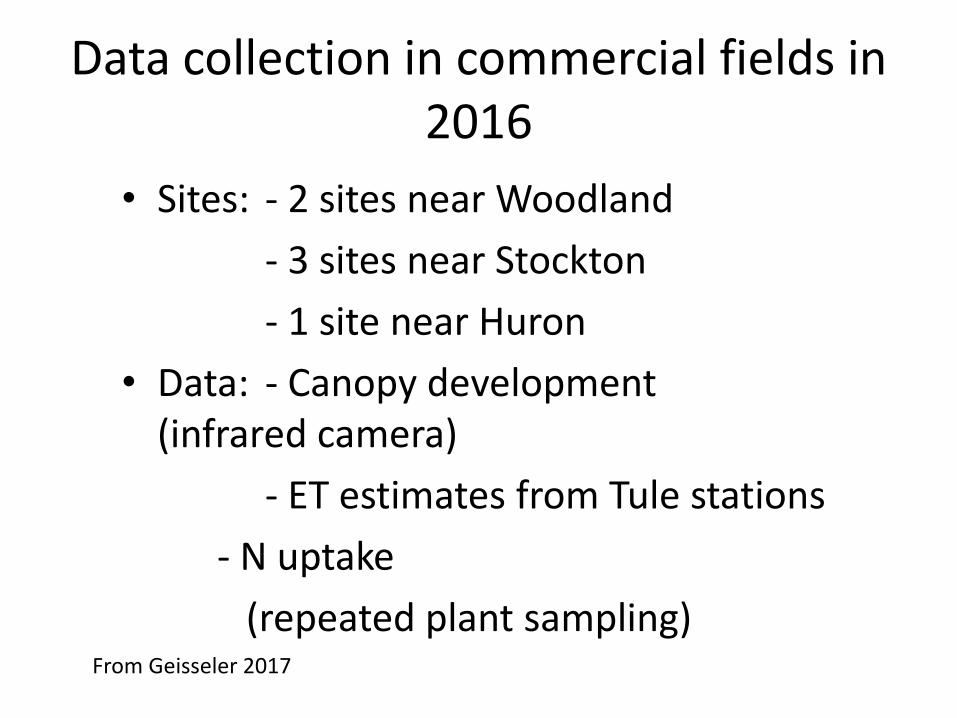
Data collection in commercial fields in 2016
• Sites: - 2 sites near Woodland
- 3 sites near Stockton
- 1 site near Huron
• Data: - Canopy development (infrared camera)
- ET estimates from Tule stations
- N uptake
(repeated plant sampling)From Geisseler 2017
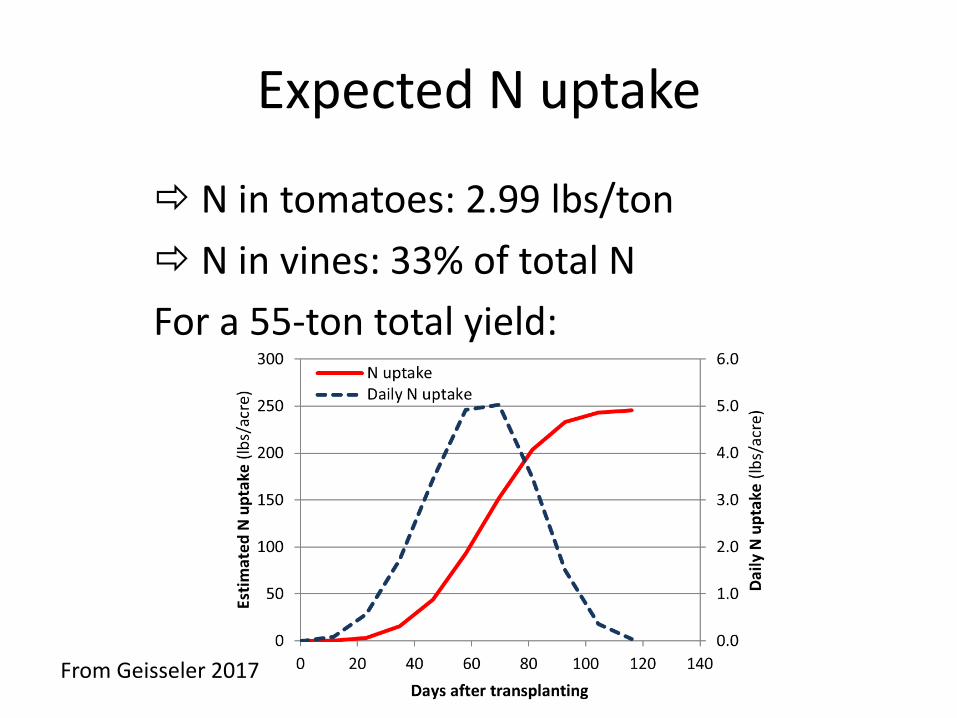
Expected N uptake
N in tomatoes: 2.99 lbs/ton
N in vines: 33% of total N
For a 55-ton total yield:
From Geisseler 2017
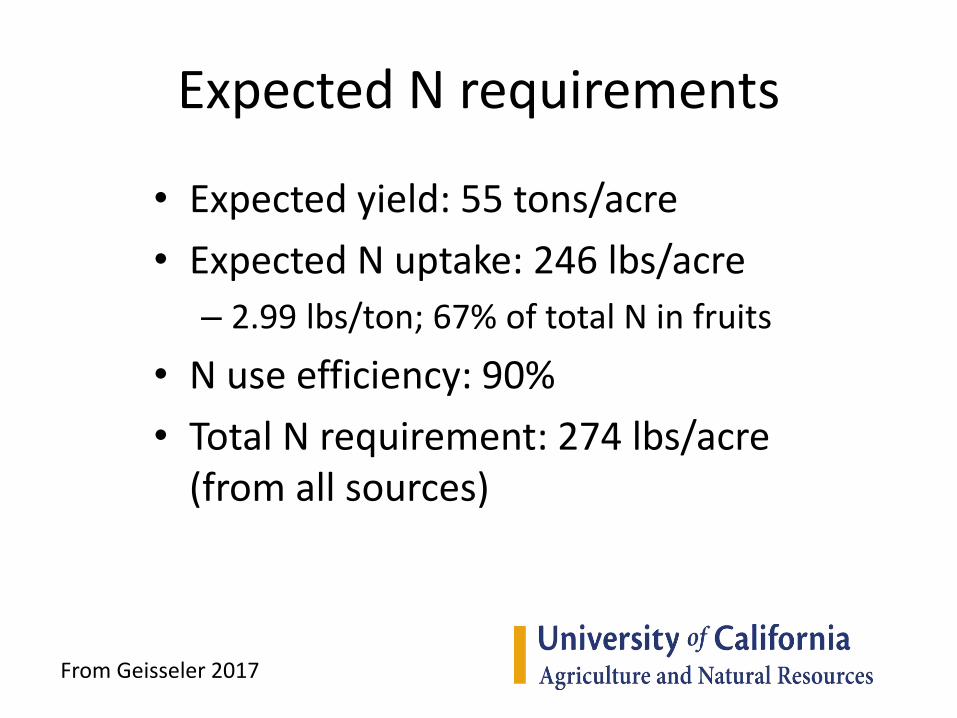
Expected N requirements
• Expected yield: 55 tons/acre
• Expected N uptake: 246 lbs/acre
– 2.99 lbs/ton; 67% of total N in fruits
• N use efficiency: 90%
• Total N requirement: 274 lbs/acre (from all sources)
From Geisseler 2017
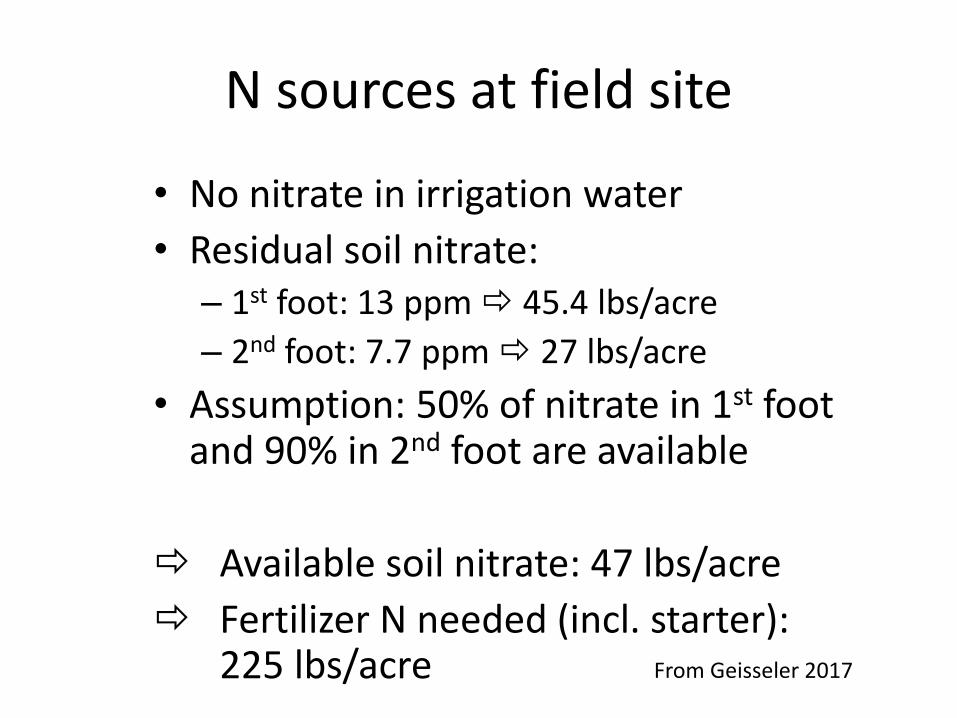
N sources at field site
• No nitrate in irrigation water
• Residual soil nitrate:– 1st foot: 13 ppm 45.4 lbs/acre
– 2nd foot: 7.7 ppm 27 lbs/acre
• Assumption: 50% of nitrate in 1st foot and 90% in 2nd foot are available
Available soil nitrate: 47 lbs/acre
Fertilizer N needed (incl. starter): 225 lbs/acre From Geisseler 2017
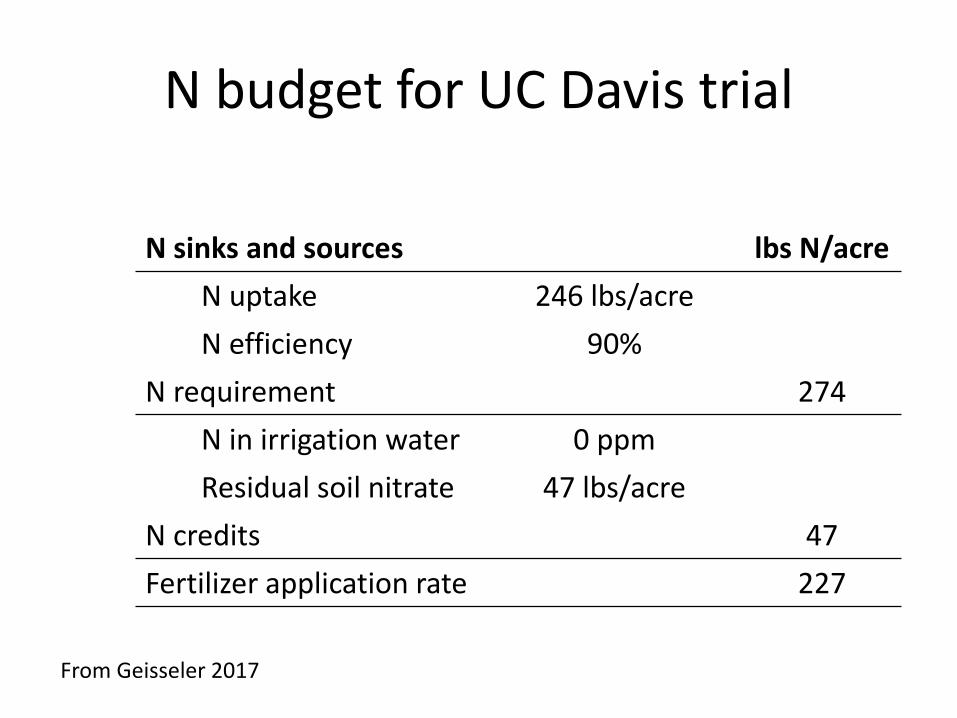
N budget for UC Davis trial
N sinks and sources lbs N/acre
N uptake 246 lbs/acre
N efficiency 90%
N requirement 274
N in irrigation water 0 ppm
Residual soil nitrate 47 lbs/acre
N credits 47
Fertilizer application rate 227
From Geisseler 2017
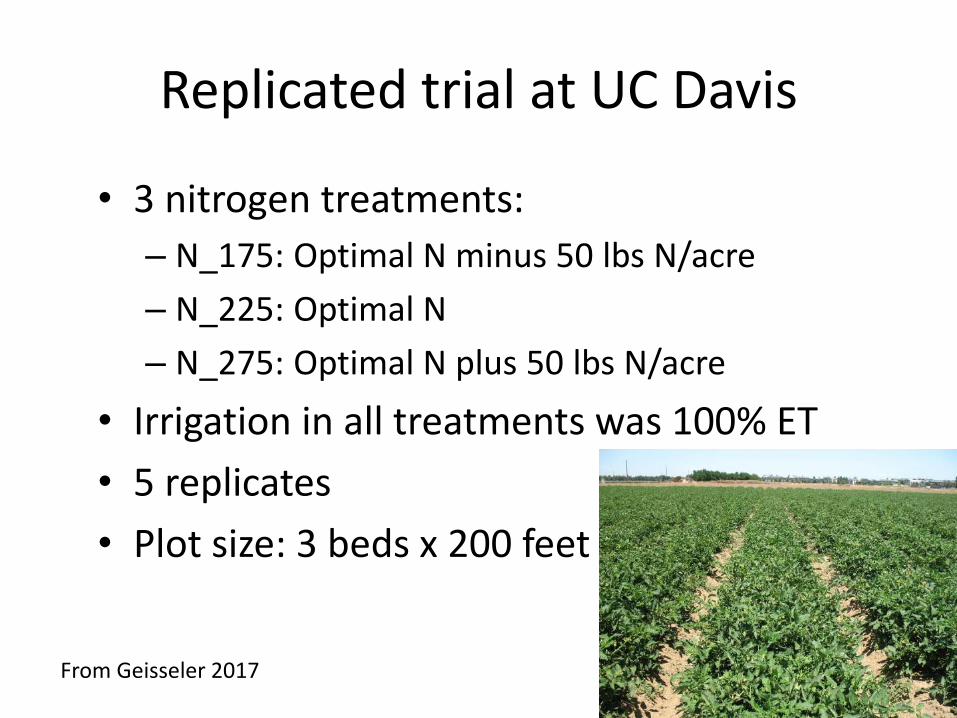
Replicated trial at UC Davis
• 3 nitrogen treatments:
– N_175: Optimal N minus 50 lbs N/acre
– N_225: Optimal N
– N_275: Optimal N plus 50 lbs N/acre
• Irrigation in all treatments was 100% ET
• 5 replicates
• Plot size: 3 beds x 200 feet
From Geisseler 2017
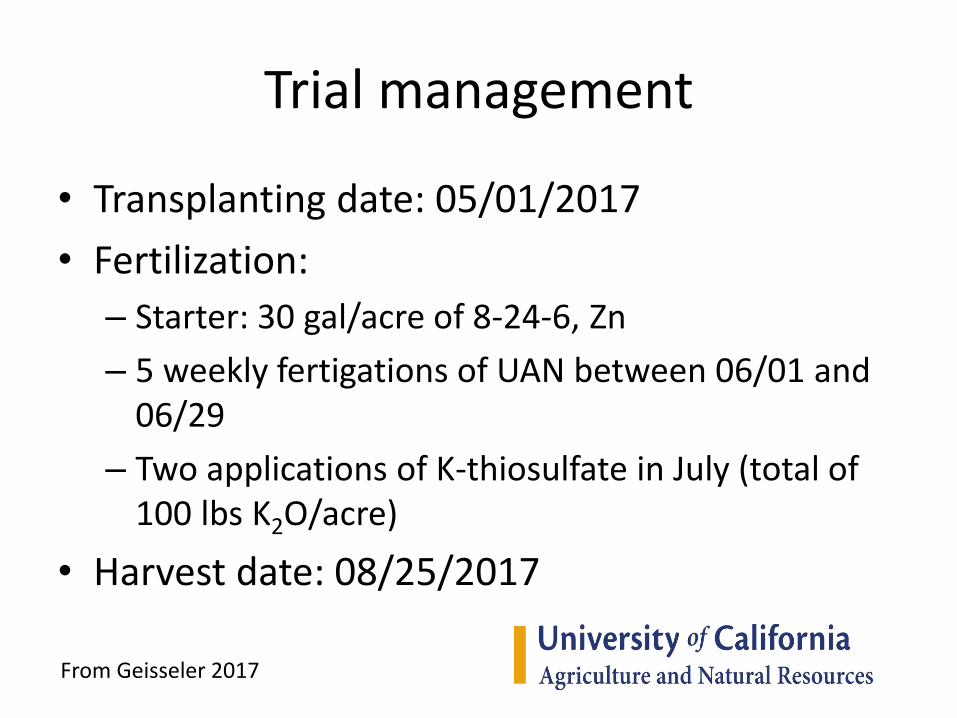
Trial management
• Transplanting date: 05/01/2017
• Fertilization:
– Starter: 30 gal/acre of 8-24-6, Zn
– 5 weekly fertigations of UAN between 06/01 and 06/29
– Two applications of K-thiosulfate in July (total of 100 lbs K2O/acre)
• Harvest date: 08/25/2017
From Geisseler 2017
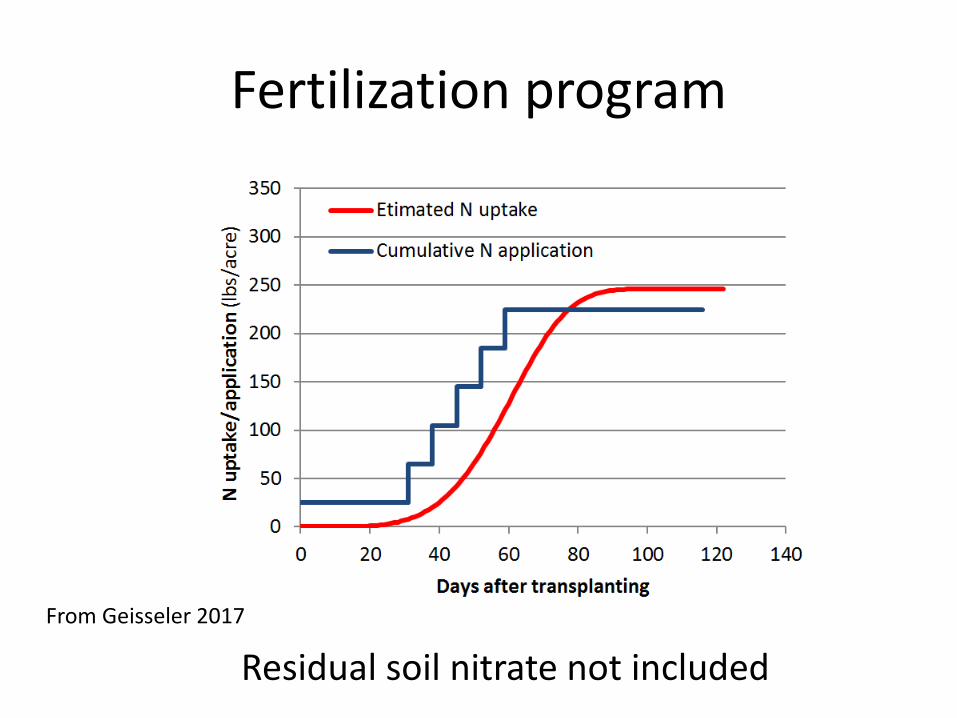
Fertilization program
Residual soil nitrate not included
From Geisseler 2017
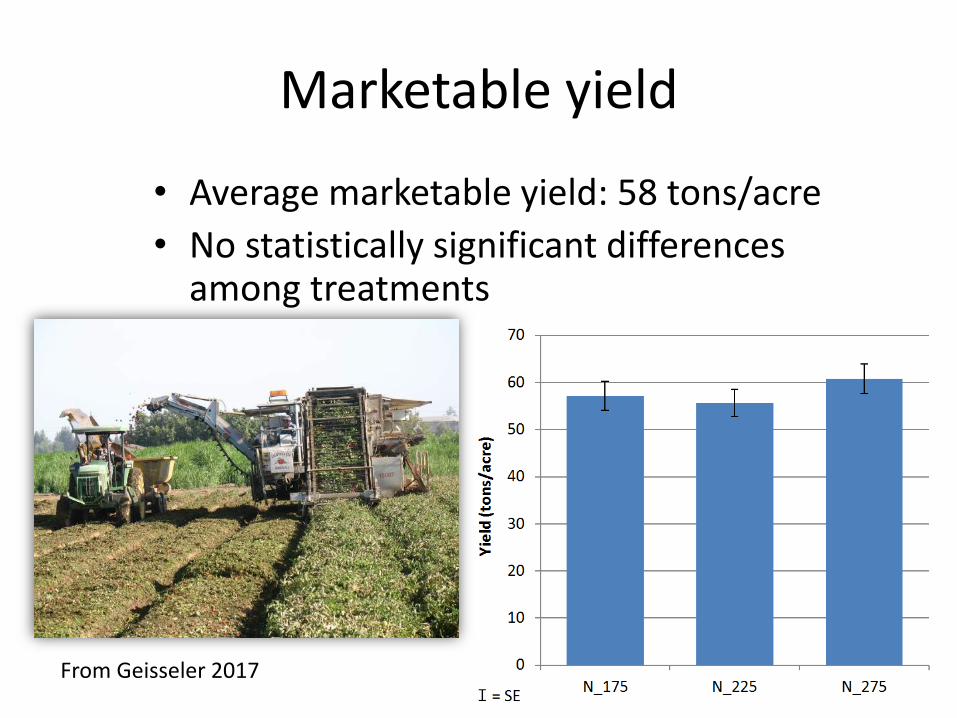
Marketable yield
• Average marketable yield: 58 tons/acre
• No statistically significant differences among treatments
From Geisseler 2017
Why are there no treatment effects?
• We may have overestimated N uptake
• We did not account for N mineralization during the growing season
From Geisseler 2017
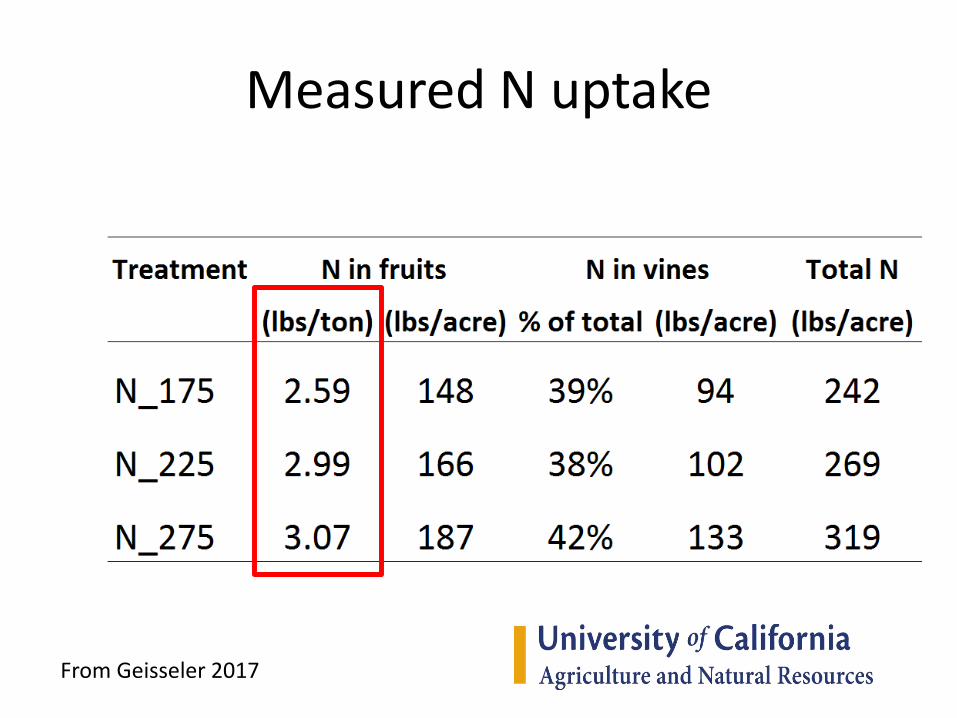
Measured N uptake
From Geisseler 2017
Conclusions
• At common N application rates, plants take up more N than needed (luxury consumption)
• Root access to nitrate above the drip line is a rough estimate
• Even in soils with a low soil organic matter content, N mineralization during the season contributes to N supply
From Geisseler 2017

• Background• Consequences of incorrect nitrogen rates• Irrigation in vegetable crops
• Sources and fates of nitrogen• Growth and nitrogen demand in vegetable
crops• Nitrogen uptake in vegetable crops• Field specific management in vegetables
(other N credits and tissue testing)• Recent project on processing tomato
nitrogen management
Presentation Overview
Acknowledgements • Tim Hartz (developed much of the material
presented)
• Daniel Geisseler (leading a current study on Nitrogen Management in tomato)
• CDFA Fertilizer Research and Education Program (FREP)
• California Tomato Research Institute (CTRI)
• UC ANR California Institute for Water Resources
• Growers


![INSmallFarmsConf-BusStartUp [Read-Only] · PDF fileLabor / Mechanization Today’s Goals ... Fresh Market Vegetable Farm • $10,000 to $20,000 per acre rule of thumb for capitalization](https://static.fdocuments.in/doc/165x107/5ab7c23a7f8b9ad5338bf6bc/insmallfarmsconf-busstartup-read-only-mechanization-todays-goals-fresh.jpg)