Vastalux Energy Berhad - bimbinvestment.com.my · Development Co Ltd (Parkson Development) and...
12
Market Insight Friday, 22 July, 2016 16795/03/2013(031743) www.bisonline.com.my www.bimbsec.com.my BIMB Securities| 1 Major Highlights Local & Global Economic News Sime Darby to launch RM280m Elmina Valley Phase 3 KL118 Tower Project Ongoing - UEM Group Petronas Awards Exploration Block SK-410B Perodua’s market share may rise to 37% Malindo Air inks new partnership with Qatar Airways Parkson suspects forgery in legal proceedings against subsidiaries in China Ringgit closes lower against USD Business confidence in Malaysia stabilises but nervousness remains US jobless claims hit 3 month low; factory activity weakens Strong US home sales, low layoffs highlight economy's strength ECB keeps door open to easing after holding rates steady S’pore and Hong Kong take steps to remove conflict of interest Bursa Malaysia Bursa Malaysia Close Change +/- Change % FBMKLCI 1,657.54 -12.07 -0.72 FBMEMAS 11,597.55 -80.88 -0.69 FBM100 11,295.64 -78.23 -0.69 FBMEMAS Shariah 12,190.29 -70.98 -0.58 FBM Hijrah Shariah 13,644.34 -82.32 -0.60 Volume (mn) 1,812.37 -119.94 -6.21 Value (RMmn) 1,701.70 62.63 3.82 FBMKLCI YTD Chg -2.07 Scoreboard Close Change +/- Change % Gainers 203 -232 -53.33 Losers 648 281 76.57 Unchanged 301 -68 -18.43 Regional Indices Close Change +/- Change % YTD Change (%) DJIA 18,517.23 -77.80 -0.42 6.27 NASDAQ 5,073.90 -16.03 -0.31 1.33 S&P 500 2,165.17 -7.85 -0.36 5.93 FTSE 100 6,699.89 -29.10 -0.43 7.33 Nikkei 225 16,810.22 128.33 0.77 -11.68 HSI 22,000.49 118.01 0.54 0.39 SHCOMP 3,039.01 11.11 0.37 -14.13 KOSPI 2,012.22 -3.24 -0.16 2.60 TWSE 9,056.56 48.88 0.54 8.62 STI 2,940.48 -5.26 -0.18 2.00 JCI 5,216.97 -25.85 -0.49 13.59 SET 1,502.70 -7.33 -0.49 16.67 PSEi 8,102.30 50.33 0.63 16.54 Market Valuation (PER) FY16 FY17 5Y Average FBMKLCI 16.97 15.82 15.71 SHCOMP 13.96 12.35 11.08 HSI 12.22 11.04 11.05 JCI 16.92 14.66 15.23 SET 16.25 14.22 13.71 STI 13.43 12.88 13.91 PSEi 20.68 18.72 17.40 The Research Team [email protected] 03-26131735 Sector Indices Close Change +/- Change % Industrial 3,144.05 -9.54 -0.30 Consumer 611.33 -1.98 -0.32 Industrial Products 141.62 -0.45 -0.32 Construction 285.55 -1.56 -0.54 Finance 14,149.76 -122.81 -0.86 Property 1,161.35 -5.35 -0.46 Plantation 7,583.10 -17.97 -0.24 Technology 22.04 -0.14 -0.63 KLCI Futures Contracts Jul-16 Aug-16 High 1,672.50 1,666.50 Low 1,651.00 1,646.00 Last 1,652.50 1,647.50 Volume 5,955.00 532.00 Commodities (Most Recent Close) Close Change +/- (+/- %) % Brent Crude (USD/bbl) 46.20 -0.97 -2.06 WTI Crude (USD/bbl) 44.75 -0.08 -0.18 Gold (USD/ounce) 1,331.21 1.72 0.13 CPO (RM/MT) 2,353.00 6.00 0.26 SMR 20 (sen/kg) 515.00 6.00 1.18 Latex (sen/kg) 431.00 5.00 1.17 Soybean Oil 31.60 0.35 1.12 Forex (per USD1) Close Change +/- Change % MYR 4.0398 0.0285 0.71 JPY 105.8200 -1.0700 -1.00 EUR 0.9069 -0.0010 -0.11 SGD 1.3555 -0.0010 -0.07 KLCI Performance KLCI Year-End Target: 1,729 points 1500 1550 1600 1650 1700 1750 1800 1850 1900 Mar-15 Apr-15 May-15 Jun-15 Jul-15 Aug-15 Sep-15 Oct-15 Nov-15 Dec-15 Jan-16 Feb-16 Mar-16 Apr-16 May-16 Jun-16
-
Upload
phungtuong -
Category
Documents
-
view
225 -
download
0
Transcript of Vastalux Energy Berhad - bimbinvestment.com.my · Development Co Ltd (Parkson Development) and...

Market Insight
Friday, 22 July, 2016
16795/03/2013(031743) www.bisonline.com.my
www.bimbsec.com.my BIMB Securities| 1
Major Highlights Local & Global Economic News
Sime Darby to launch RM280m Elmina Valley Phase 3
KL118 Tower Project Ongoing - UEM Group
Petronas Awards Exploration Block SK-410B
Perodua’s market share may rise to 37%
Malindo Air inks new partnership with Qatar Airways
Parkson suspects forgery in legal proceedings against
subsidiaries in China
Ringgit closes lower against USD
Business confidence in Malaysia stabilises but nervousness
remains
US jobless claims hit 3 month low; factory activity weakens
Strong US home sales, low layoffs highlight economy's
strength
ECB keeps door open to easing after holding rates steady
S’pore and Hong Kong take steps to remove conflict of
interest
Bursa Malaysia
Bursa Malaysia Close Change +/- Change % FBMKLCI 1,657.54 -12.07 -0.72 FBMEMAS 11,597.55 -80.88 -0.69 FBM100 11,295.64 -78.23 -0.69 FBMEMAS Shariah 12,190.29 -70.98 -0.58 FBM Hijrah Shariah 13,644.34 -82.32 -0.60 Volume (mn) 1,812.37 -119.94 -6.21 Value (RMmn) 1,701.70 62.63 3.82 FBMKLCI YTD Chg -2.07 Scoreboard
Close Change +/- Change % Gainers 203 -232 -53.33 Losers 648 281 76.57 Unchanged 301 -68 -18.43 Regional Indices
Close
Change +/- Change %
YTD Change
(%) DJIA 18,517.23 -77.80 -0.42 6.27 NASDAQ 5,073.90 -16.03 -0.31 1.33 S&P 500 2,165.17 -7.85 -0.36 5.93 FTSE 100 6,699.89 -29.10 -0.43 7.33 Nikkei 225 16,810.22 128.33 0.77 -11.68 HSI 22,000.49 118.01 0.54 0.39 SHCOMP 3,039.01 11.11 0.37 -14.13 KOSPI 2,012.22 -3.24 -0.16 2.60 TWSE 9,056.56 48.88 0.54 8.62 STI 2,940.48 -5.26 -0.18 2.00 JCI 5,216.97 -25.85 -0.49 13.59 SET 1,502.70 -7.33 -0.49 16.67 PSEi 8,102.30 50.33 0.63 16.54 Market Valuation (PER) FY16 FY17 5Y Average FBMKLCI 16.97 15.82 15.71 SHCOMP 13.96 12.35 11.08 HSI 12.22 11.04 11.05 JCI 16.92 14.66 15.23 SET 16.25 14.22 13.71 STI 13.43 12.88 13.91 PSEi 20.68 18.72 17.40 The Research Team [email protected] 03-26131735
Sector Indices
Close Change +/- Change % Industrial 3,144.05 -9.54 -0.30 Consumer 611.33 -1.98 -0.32 Industrial Products 141.62 -0.45 -0.32 Construction 285.55 -1.56 -0.54 Finance 14,149.76 -122.81 -0.86 Property 1,161.35 -5.35 -0.46 Plantation 7,583.10 -17.97 -0.24 Technology 22.04 -0.14 -0.63 KLCI Futures
Contracts Jul-16 Aug-16 High 1,672.50 1,666.50 Low 1,651.00 1,646.00 Last 1,652.50 1,647.50 Volume 5,955.00 532.00 Commodities (Most Recent Close)
Close Change +/- (+/- %) % Brent Crude (USD/bbl) 46.20 -0.97 -2.06 WTI Crude (USD/bbl) 44.75 -0.08 -0.18 Gold (USD/ounce) 1,331.21 1.72 0.13 CPO (RM/MT) 2,353.00 6.00 0.26 SMR 20 (sen/kg) 515.00 6.00 1.18 Latex (sen/kg) 431.00 5.00 1.17 Soybean Oil 31.60 0.35 1.12 Forex
(per USD1) Close Change +/- Change % MYR 4.0398 0.0285 0.71 JPY 105.8200 -1.0700 -1.00 EUR 0.9069 -0.0010 -0.11 SGD 1.3555 -0.0010 -0.07
KLCI Performance
KLCI Year-End Target: 1,729 points
1500
1550
1600
1650
1700
1750
1800
1850
1900
Mar
-15
Ap
r-15
May
-15
Jun
-15
Jul-
15
Au
g-15
Sep
-15
Oct
-15
No
v-15
Dec
-15
Jan
-16
Feb
-16
Mar
-16
Ap
r-16
May
-16
Jun
-16

www.bimbsec.com.my | 2
Market Insight
Major Rates
KLIBOR 3-mth 3.40% KLIBOR 6-mth 3.54% KLIBOR 12-mth 3.62% 5-yr MGS 3.20% 10-yr MGS 3.63%
Active Stock
Close Change+/- (+/- %)
Sanichi Technology 0.15 -0.03 -17.14
Hiap Teck 0.29 -0.01 -1.72
Borneo Oil 0.19 -0.01 -2.63
XOX 0.16 -0.01 -6.06 Airasia X 0.38 -0.02 -3.85
Top Gainers
Close Change+/- (+/- %)
Panasonic 35.02 0.72 2.10
Chin Teck Plantations 7.80 0.34 4.56 Sam Engineering & Equipment
7.93 0.31 4.07
BAT 54.76 0.26 0.48
Pharmaniaga 5.78 0.13 2.30
Top Losers
Close Change+/- (+/- %)
Genting 8.68 -0.35 -3.88
Nestle 79.60 -0.30 -0.38 Hong Leong Financial Group
15.46 -0.20 -1.28
Kesm Industries 6.13 -0.15 -2.39
Huat Lai 4.16 -0.14 -3.26
Daily Participation
Participation
(%) Bought (RMm)
Sold (RMm)
Net (RMm)
Local Inst 57.7 1,013.6 951.0 62.6
Local Retail 18.7 324.4 310.7 13.7
Foreign 23.6 363.8 440.1 -76.3
Total 100.0 1,701.8 1,701.8 0.0

www.bimbsec.com.my | 3
Market Insight
LOCAL CORPORATE NEWS Sime Darby to launch RM280m Elmina Valley Phase 3 Sime Darby Propertywill be launching Phase 3 of its Elmina Valley homes, worth RM280m in gross development value, at the City of Elmina on Saturday (July 23). Phase 3 is expected to follow the success of the first 2 phases, which saw over 90% take-up within the first 2 days of launching earlier this year. We are pleased to launch Phase 3 of the Elmina Valley development. We are confident of Elmina Valley Phase 3 repeating the success of Elmina Valley Phase 1 and Phase 2, where both phases recorded over 90% take-up within two days of their respective official launches. (Source: Reuters) KL118 Tower Project Ongoing - UEM Group The KL118 skyscraper project, also known as Menara Warisan, is ongoing. The company have started it and now it's in the finalisation of design stage. The original plan is to complete by 2020, but it's too early to say whether the company are going to be able to be on schedule because there are some detailings going on. But the company am sure the team would do their best to meet the deadline. (Source: StarBiz) Petronas Awards Exploration Block SK-410B Petronas has awarded a Production Sharing Contract (PSC) to PTTEP HK Offshore Ltd (PTTEP), KUFPEC Malaysia (SK-410B) Ltd (KUFPEC) and Petronas Carigali SB for the exploration of Block SK410B. Under the terms of the PSC, which was signed here today, PTTEP will operate the block with a participating interest of 42.5%, KUFPEC (42.5%) and Petronas Carigali (15 %). Yesterday signing not only marks Petronas' first PSC award in 2016 but also welcomes PTTEP for their first operatorship in Malaysia. (Source: StarBiz) Perodua’s market share may rise to 37% Perusahaan Otomobil Kedua SB (Perodua) market share is poised to rise to 37% from the current 35.5%, underpinned by the launch of the new Bezza, as well as the expected softness of the TIV this year. Perodua expected to maintain its total sales this year at 216,000 based on demand for the new sedan. There is a possibility that the company market share may go up further to 37% due to the softness of local TIV which has been revised downwards. (Source: StarBiz) Malindo Air inks new partnership with Qatar Airways Malindo Air has inked a bilateral interline agreement with Qatar Airways to offer passengers seamless travel and greater connectivity when travelling between Asean and more than 100 destinations in Qatar Airways’ network. The partnership allows Qatar Airways passengers to tap into Malindo Air’s growing short-haul regional network that currently serves 36 cities in 13 countries, including 13 major airports in Malaysia. Passengers travelling from cities such as Langkawi, Penang, Kota Kinabalu, Johor Bahru and Kuching can easily book interline itineraries containing sectors that included one of Qatar Airways’ thrice-daily flights departing from KLIA, thereby seamlessly connecting themselves to more than 100 onwards destinations within the Qatar Airways global network. (Source: StarBiz) Parkson suspects forgery in legal proceedings against subsidiaries in China Two subsidiaries of Hong Kong-listed Parkson Retail Group Ltd, which is 54.67%-owned by Parkson, have cited forgery as grounds to seek a review of legal proceedings against them. The wholly-owned subsidiaries — Changshou Parkson Retail Development Co Ltd (Parkson Development) and Parkson Investment Holdings Co Ltd (Parkson Investment) — along with 3 other parties are being sued by China Construction Bank Corp. Parkson Development is being sued solely on the grounds that it the confirmatory party to the notice of charge over receivables. Parkson Development has inspected the photocopy of the receivable charge notice provided by the bank to the court and suspects that the seal of Parkson Development imprinted on it was a forgery. (Source: Bernama)

www.bimbsec.com.my | 4
Market Insight
LOCAL AND GLOBAL ECONOMIC NEWS Ringgit closes lower against USD The weaker trend of emerging Asian currencies, coupled with the firm USD, pushed the ringgit to end lower against the greenback Thursday. The local unit was quoted at 4.0380/0430 versus the USD from 4.0240/0300 on Wednesday. The ringgit would continue its bearish tone against a firm USD due to loss of support amid negative market sentiment. (Source: Bernama) Business confidence in Malaysia stabilises but nervousness remains An early indication of how uncertainty will affect OECD economies, with business confidence subdued despite an improving outlook in the Asia-Pacific region. Business confidence had stabilised somewhat in Malaysia over the last 3 months, after a tough end to 2015. This had been led by much stronger sentiment in China, where the sense of crisis that dominated the second half of 2015 had now faded. (Source: Bernama) US jobless claims hit 3 month low; factory activity weakens The number of Americans filing for unemployment benefits unexpectedly fell last week, hitting a 3 month low as the labor market continues to gather momentum. Initial claims for state unemployment benefits slipped 1,000 to a seasonally adjusted 253,000 for the week ended July 16, the lowest reading since April. Claims for the prior week were unrevised. Claims are near the 43-year low of 248,000 touched in mid-April. Claims have now been below 300,000, a threshold associated with a healthy labor market, for 72 straight weeks, the longest stretch since 1973. Claims tend to be volatile around this time of the year when automobile manufacturers normally idle assembly lines for retooling. Some, however, often keep production running, which can throw (Source: StarBiz) Strong US home sales, low layoffs highlight economy's strength US home resales hit their highest level in nearly 9-1/2 years in June as low interest rates lured first-time buyers into the market and the number of Americans filing for unemployment benefits fell last week, underscoring the economy's strength. Although another report on Thursday showed factory activity in the mid-Atlantic region contracted this month, a surge in new orders and shipments suggested the setback was likely temporary. Existing home sales increased 1.1% to an annual rate of 5.57m units last month, the highest level since February 2007. (Source: Reuters) ECB keeps door open to easing after holding rates steady The European Central Bank kept interest rates unchanged on Thursday but left the door open to more policy stimulus, highlighting great" uncertainty and abundant risks to the economic outlook. Signalling a readiness to act, ECB President Mario Draghi argued that Britain's decision to leave the EU and weak emerging market growth both dampen the euro zone's own outlook, leaving the balance of risks tilted firmly to the downside and possibly requiring action. But Draghi also noted that growth and inflation were both moving along the path projected in June so more evidence, including fresh staff projections in September, were needed before any decision. (Source: Reuters) S’pore and Hong Kong take steps to remove conflict of interest Hong Kong and Singapore are taking steps to curb the regulatory powers of their local bourses to remove a perceived conflict of interest and improve the quality of listed companies. In Hong Kong and Singapore local exchanges act as front-line regulators, meaning they police the same companies that pay their revenues and shareholder dividends. This conflicting role has led SGX and HKEX open to the trading of companies that later got embroiled in several accounting scandals. To address the issue SGX and HKEX have unveiled radical shake-ups. (Source: Reuters)
www.bimbsec.com.my | 5
Market Insight
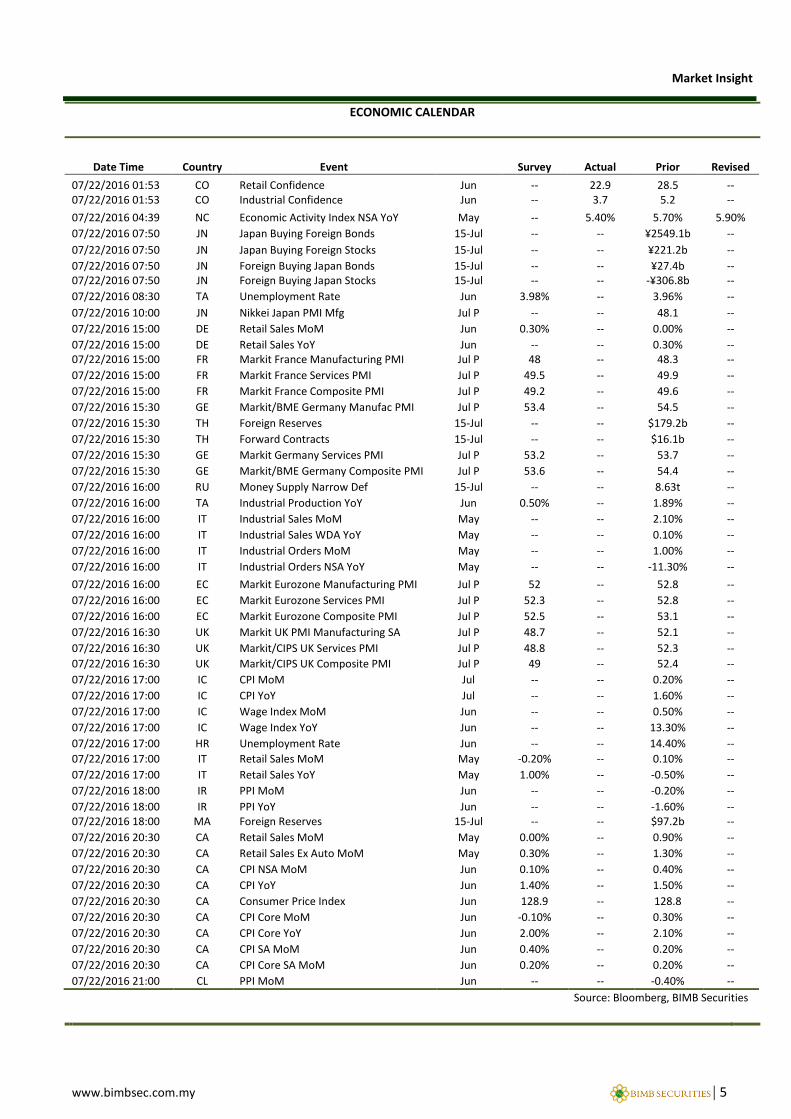
ECONOMIC CALENDAR
Date Time Country Event Survey Actual Prior Revised
07/22/2016 01:53 CO Retail Confidence Jun -- 22.9 28.5 -- 07/22/2016 01:53 CO Industrial Confidence Jun -- 3.7 5.2 --
07/22/2016 04:39 NC Economic Activity Index NSA YoY May -- 5.40% 5.70% 5.90%
07/22/2016 07:50 JN Japan Buying Foreign Bonds 15-Jul -- -- ¥2549.1b --
07/22/2016 07:50 JN Japan Buying Foreign Stocks 15-Jul -- -- ¥221.2b --
07/22/2016 07:50 JN Foreign Buying Japan Bonds 15-Jul -- -- ¥27.4b -- 07/22/2016 07:50 JN Foreign Buying Japan Stocks 15-Jul -- -- -¥306.8b --
07/22/2016 08:30 TA Unemployment Rate Jun 3.98% -- 3.96% --
07/22/2016 10:00 JN Nikkei Japan PMI Mfg Jul P -- -- 48.1 --
07/22/2016 15:00 DE Retail Sales MoM Jun 0.30% -- 0.00% --
07/22/2016 15:00 DE Retail Sales YoY Jun -- -- 0.30% -- 07/22/2016 15:00 FR Markit France Manufacturing PMI Jul P 48 -- 48.3 --
07/22/2016 15:00 FR Markit France Services PMI Jul P 49.5 -- 49.9 --
07/22/2016 15:00 FR Markit France Composite PMI Jul P 49.2 -- 49.6 --
07/22/2016 15:30 GE Markit/BME Germany Manufac PMI Jul P 53.4 -- 54.5 --
07/22/2016 15:30 TH Foreign Reserves 15-Jul -- -- $179.2b --
07/22/2016 15:30 TH Forward Contracts 15-Jul -- -- $16.1b --
07/22/2016 15:30 GE Markit Germany Services PMI Jul P 53.2 -- 53.7 --
07/22/2016 15:30 GE Markit/BME Germany Composite PMI Jul P 53.6 -- 54.4 --
07/22/2016 16:00 RU Money Supply Narrow Def 15-Jul -- -- 8.63t --
07/22/2016 16:00 TA Industrial Production YoY Jun 0.50% -- 1.89% --
07/22/2016 16:00 IT Industrial Sales MoM May -- -- 2.10% --
07/22/2016 16:00 IT Industrial Sales WDA YoY May -- -- 0.10% --
07/22/2016 16:00 IT Industrial Orders MoM May -- -- 1.00% --
07/22/2016 16:00 IT Industrial Orders NSA YoY May -- -- -11.30% --
07/22/2016 16:00 EC Markit Eurozone Manufacturing PMI Jul P 52 -- 52.8 --
07/22/2016 16:00 EC Markit Eurozone Services PMI Jul P 52.3 -- 52.8 --
07/22/2016 16:00 EC Markit Eurozone Composite PMI Jul P 52.5 -- 53.1 --
07/22/2016 16:30 UK Markit UK PMI Manufacturing SA Jul P 48.7 -- 52.1 --
07/22/2016 16:30 UK Markit/CIPS UK Services PMI Jul P 48.8 -- 52.3 --
07/22/2016 16:30 UK Markit/CIPS UK Composite PMI Jul P 49 -- 52.4 --
07/22/2016 17:00 IC CPI MoM Jul -- -- 0.20% --
07/22/2016 17:00 IC CPI YoY Jul -- -- 1.60% --
07/22/2016 17:00 IC Wage Index MoM Jun -- -- 0.50% --
07/22/2016 17:00 IC Wage Index YoY Jun -- -- 13.30% --
07/22/2016 17:00 HR Unemployment Rate Jun -- -- 14.40% --
07/22/2016 17:00 IT Retail Sales MoM May -0.20% -- 0.10% --
07/22/2016 17:00 IT Retail Sales YoY May 1.00% -- -0.50% --
07/22/2016 18:00 IR PPI MoM Jun -- -- -0.20% --
07/22/2016 18:00 IR PPI YoY Jun -- -- -1.60% -- 07/22/2016 18:00 MA Foreign Reserves 15-Jul -- -- $97.2b --
07/22/2016 20:30 CA Retail Sales MoM May 0.00% -- 0.90% --
07/22/2016 20:30 CA Retail Sales Ex Auto MoM May 0.30% -- 1.30% --
07/22/2016 20:30 CA CPI NSA MoM Jun 0.10% -- 0.40% --
07/22/2016 20:30 CA CPI YoY Jun 1.40% -- 1.50% --
07/22/2016 20:30 CA Consumer Price Index Jun 128.9 -- 128.8 --
07/22/2016 20:30 CA CPI Core MoM Jun -0.10% -- 0.30% --
07/22/2016 20:30 CA CPI Core YoY Jun 2.00% -- 2.10% --
07/22/2016 20:30 CA CPI SA MoM Jun 0.40% -- 0.20% --
07/22/2016 20:30 CA CPI Core SA MoM Jun 0.20% -- 0.20% --
07/22/2016 21:00 CL PPI MoM Jun -- -- -0.40% --
Source: Bloomberg, BIMB Securities

www.bimbsec.com.my | 6
Market Insight
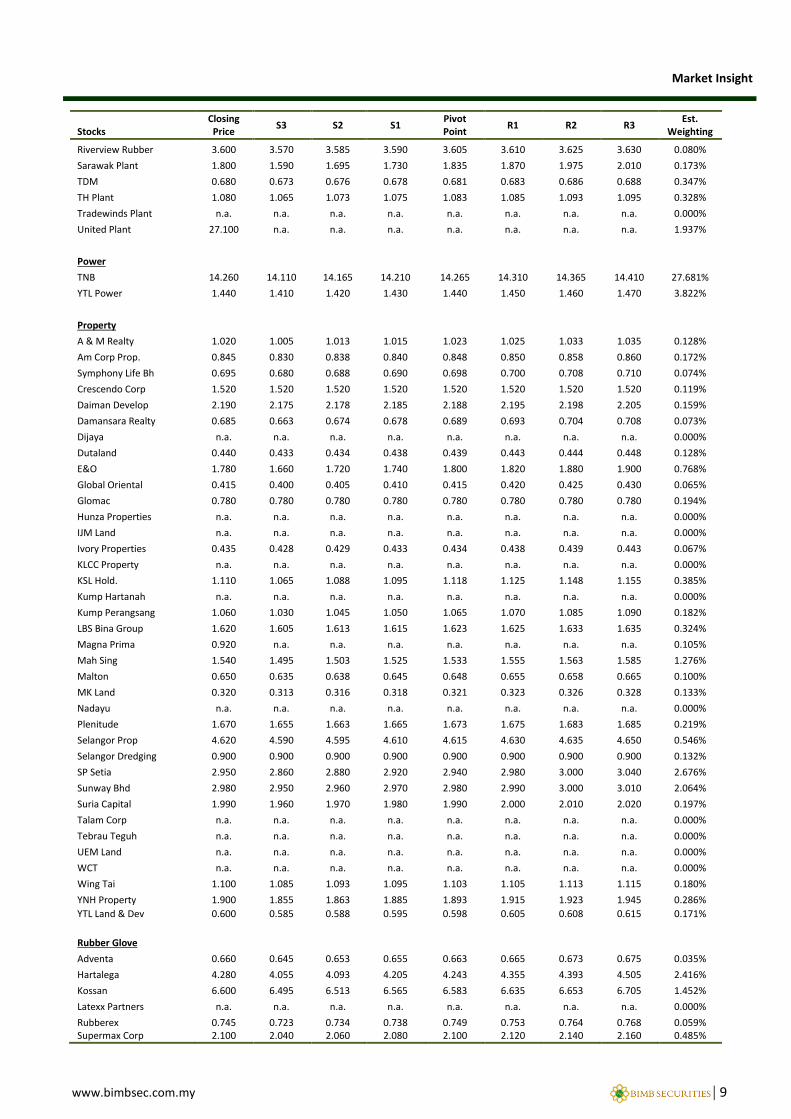
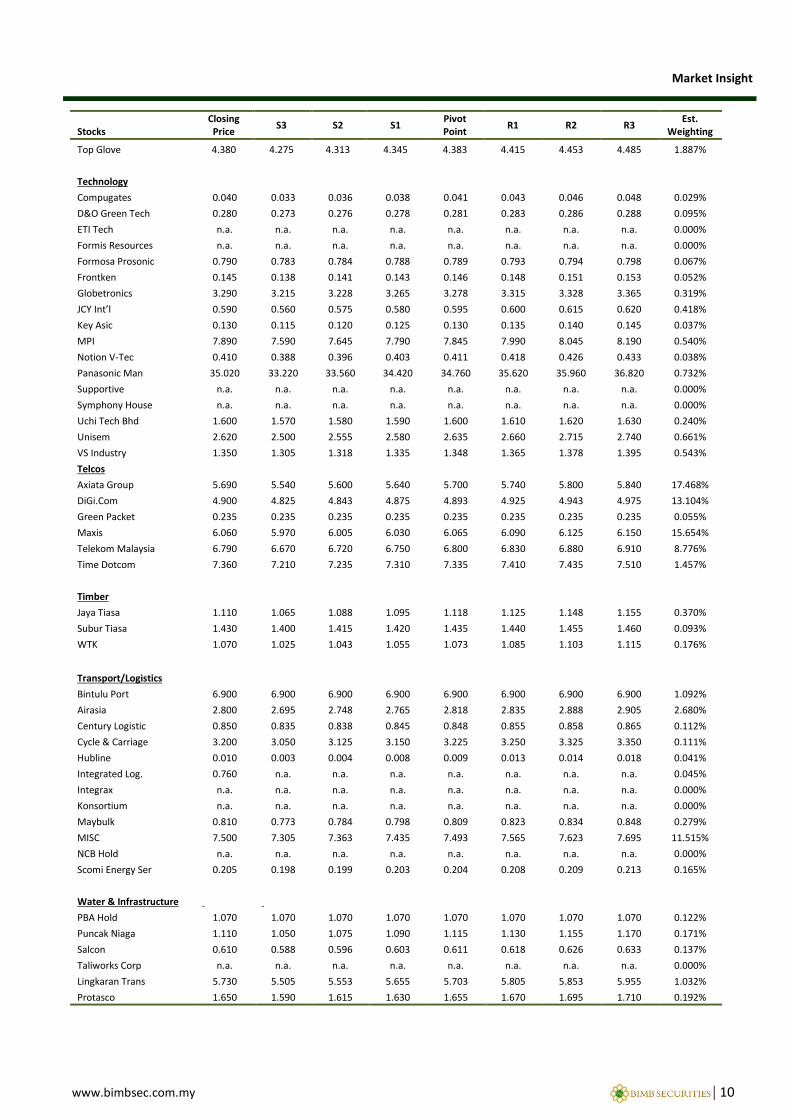
PIVOT POINT ANALYSIS
Stocks Closing
Price S3 S2 S1
Pivot Point
R1 R2 R3 Est.
Weighting.
FBMKLCI Index 1657.54 1647.87 1652.70 1654.32 1659.15 1660.77 1665.60 1667.22 n.a.
FBM Hijrah Shariah 13644.34 13561.95 13592.61 13616.88 13647.54 13671.81 13702.47 13726.74 n.a.
Autos
APM Automotive 3.560 3.545 3.553 3.555 3.563 3.565 3.573 3.575 0.239%
Delloyd Ventures n.a. n.a. n.a. n.a. n.a. n.a. n.a. n.a. 0.000%
MBM Resources 2.310 2.265 2.283 2.295 2.313 2.325 2.343 2.355 0.31%
Tan Chong 1.940 1.925 1.928 1.935 1.938 1.945 1.948 1.955 0.436%
UMW 5.700 5.460 5.530 5.620 5.690 5.780 5.850 5.940 2.290%
Building Materials Ann Joo Resource 1.280 1.175 1.228 1.245 1.298 1.315 1.368 1.385 0.220%
Alum Co of Malay 0.805 0.805 0.805 0.805 0.805 0.805 0.805 0.805 0.037%
Choo Bee Metal 1.400 1.400 1.400 1.400 1.400 1.400 1.400 1.400 0.052%
CSC Steel 1.300 1.255 1.273 1.285 1.303 1.315 1.333 1.345 0.165%
Eksons Corp 1.030 n.a. n.a. n.a. n.a. n.a. n.a. n.a. 0.057%
Engtex Group 1.190 1.160 1.175 1.180 1.195 1.200 1.215 1.220 0.124%
Goh Ban Huat 1.390 1.360 1.375 1.380 1.395 1.400 1.415 1.420 0.089%
Hiap Teck 0.285 0.255 0.268 0.275 0.288 0.295 0.308 0.315 0.070%
Jaks Resources 0.935 0.920 0.928 0.930 0.938 0.940 0.948 0.950 0.141%
Java 0.100 n.a. n.a. n.a. n.a. n.a. n.a. n.a. 0.006%
Kim Hin Ind 1.710 1.710 1.710 1.710 1.710 1.710 1.710 1.710 0.082%
Kinsteel 0.070 0.063 0.066 0.068 0.071 0.073 0.076 0.078 0.025%
Lafarge M Cement 8.290 8.080 8.145 8.220 8.285 8.360 8.425 8.500 2.423%
Lion Corp 0.020 0.013 0.016 0.018 0.021 0.023 0.026 0.028 0.009%
Lion Industries 0.315 0.308 0.309 0.313 0.314 0.318 0.319 0.323 0.075%
Malaysia Smelting 2.820 2.820 2.820 2.820 2.820 2.820 2.820 2.820 0.097%
Masteel 0.520 0.490 0.505 0.510 0.525 0.530 0.545 0.550 0.044%
Melewar Ind 0.335 0.320 0.328 0.330 0.338 0.340 0.348 0.350 0.026%
MTD ACPI 0.275 0.275 0.275 0.275 0.275 0.275 0.275 0.275 0.022% Pantech 0.580 0.565 0.573 0.575 0.583 0.585 0.593 0.595 0.122%
Perwaja 0.115 0.100 0.108 0.110 0.118 0.120 0.128 0.130 0.022%
Press Metal 4.170 3.975 4.008 4.105 4.138 4.235 4.268 4.365 1.871%
Southern Steel 0.975 0.953 0.956 0.968 0.971 0.983 0.986 0.998 0.141%
Tasek 14.700 14.520 14.610 14.640 14.730 14.760 14.850 14.880 0.613%
Tong Herr 1.960 1.945 1.953 1.955 1.963 1.965 1.973 1.975 0.084%
Conglomerates
Cahya Mata Sarawak 3.700 3.565 3.628 3.655 3.718 3.745 3.808 3.835 1.367% Lion Diversified 0.045 n.a. n.a. n.a. n.a. n.a. n.a. n.a. 0.022%
Hap Seng Cons 7.730 7.565 7.603 7.675 7.713 7.785 7.823 7.895 6.517%
MMC 2.100 2.010 2.035 2.070 2.095 2.130 2.155 2.190 2.20%
Sime Darby 7.600 7.405 7.463 7.535 7.593 7.665 7.723 7.795 16.539%
YTL Corp 1.640 1.580 1.595 1.620 1.635 1.660 1.675 1.700 5.877%
Construction
AZRB 0.655 0.633 0.641 0.648 0.656 0.663 0.671 0.678 0.109%
Ekovest 1.590 1.545 1.563 1.575 1.593 1.605 1.623 1.635 0.468%
Fajar Baru 0.550 0.535 0.543 0.545 0.553 0.555 0.563 0.565 0.068%
Favelle Favco 2.540 2.510 2.525 2.530 2.545 2.550 2.565 2.570 0.193%
Gamuda 4.820 4.730 4.770 4.790 4.830 4.850 4.890 4.910 4.009%
Hock Seng Lee 1.780 1.690 1.705 1.750 1.765 1.810 1.825 1.870 0.336%
IJM Corp 3.440 3.365 3.383 3.415 3.433 3.465 3.483 3.515 4.259%
Kimlun 1.830 1.785 1.798 1.815 1.828 1.845 1.858 1.875 0.189%
KKB Engineer 1.650 1.560 1.590 1.620 1.650 1.680 1.710 1.740 0.146%
MRCB 1.180 1.150 1.160 1.170 1.180 1.190 1.200 1.210 0.766%

www.bimbsec.com.my | 7
Market Insight
Stocks Closing Price
S3 S2 S1 Pivot Point
R1 R2 R3 Est.
Weighting
Mudajaya 1.230 1.155 1.183 1.205 1.233 1.255 1.283 1.305 0.23%
Muhibbah 2.290 2.260 2.270 2.280 2.290 2.300 2.310 2.320 0.38%
Naim Hold 1.930 1.780 1.840 1.880 1.940 1.980 2.040 2.080 0.16%
Sunway Hldgs 2.980 2.950 2.960 2.970 2.980 2.990 3.000 3.010 2.064%
TRC Synergy 0.395 0.373 0.379 0.388 0.394 0.403 0.409 0.418 0.065% TSR Capital Bhd 0.500 n.a. n.a. n.a. n.a. n.a. n.a. n.a. 0.030%
Zelan 0.160 0.145 0.153 0.155 0.163 0.165 0.173 0.175 0.046%
Consumer/Retail
Aeon Co (M) 2.670 2.640 2.645 2.660 2.665 2.680 2.685 2.700 1.289%
Ajinomoto 13.700 13.640 13.670 13.680 13.710 13.720 13.750 13.760 0.286%
Apollo Food 5.800 5.800 5.800 5.800 5.800 5.800 5.800 5.800 0.160%
Bonia 0.605 0.590 0.593 0.600 0.603 0.610 0.613 0.620 0.168%
CI Holdings 2.630 2.555 2.593 2.605 2.643 2.655 2.693 2.705 0.147%
Cocoaland 2.000 1.940 1.965 1.980 2.005 2.020 2.045 2.060 0.157%
Dutch Lady 61.800 61.650 61.675 61.750 61.775 61.850 61.875 61.950 1.360%
Guan Chong 0.905 0.898 0.901 0.903 0.906 0.908 0.911 0.913 0.149%
Hai-O Ent 2.900 2.870 2.885 2.890 2.905 2.910 2.925 2.930 0.193%
Hovid 0.395 0.380 0.388 0.390 0.398 0.400 0.408 0.410 0.111%
Hup seng Inds 1.330 1.330 1.330 1.330 1.330 1.330 1.330 1.330 0.366%
K-Star Sports 0.080 0.065 0.070 0.075 0.080 0.085 0.090 0.095 0.007%
Multi Sports n.a. n.a. n.a. n.a. n.a. n.a. n.a. n.a. 0.000%
Padini 2.600 2.495 2.523 2.565 2.593 2.635 2.663 2.705 0.588%
Parkson Holdings 0.815 0.800 0.803 0.810 0.813 0.820 0.823 0.830 0.292%
Pelikan International 0.750 0.720 0.725 0.740 0.745 0.760 0.765 0.780 0.141%
Poh Kong 0.500 0.493 0.496 0.498 0.501 0.503 0.506 0.508 0.071%
QL Resources 4.400 4.340 4.350 4.380 4.390 4.420 4.430 4.460 1.889%
Silver Bird n.a. n.a. n.a. n.a. n.a. n.a. n.a. n.a. 0.000%
Three-A Resource 1.370 1.355 1.358 1.365 1.368 1.375 1.378 1.385 0.185%
Xingquan Int’l 0.180 0.165 0.173 0.175 0.183 0.185 0.193 0.195 0.037%
Yee Lee Corp 2.300 2.270 2.285 2.290 2.305 2.310 2.325 2.330 0.149%
Zhulian 1.370 1.355 1.358 1.365 1.368 1.375 1.378 1.385 0.217%
Education
HELP Int’l n.a. n.a. n.a. n.a. n.a. n.a. n.a. n.a. 0.000%
Masterskill n.a. n.a. n.a. n.a. n.a. n.a. n.a. n.a. 0.000%
SEG Int’l 1.190 1.190 1.190 1.190 1.190 1.190 1.190 1.190 0.295%
Finance
BIMB Hold. 3.980 3.950 3.965 3.970 3.985 3.990 4.005 4.010 2.175%
Syarikat Takaful 3.970 3.925 3.948 3.955 3.978 3.985 4.008 4.015 1.120%
Healthcare
Apex Healthcare 3.750 3.750 3.750 3.750 3.750 3.750 3.750 3.750 0.151%
CCM Duopharma 2.050 1.990 2.020 2.030 2.060 2.070 2.100 2.110 0.197%
KPJ Healthcare 4.310 4.190 4.210 4.270 4.290 4.350 4.370 4.430 1.547%
Faber Group n.a. n.a. n.a. n.a. n.a. n.a. n.a. n.a. 0.000%
Manufacturing
CBIP 1.990 1.975 1.983 1.985 1.993 1.995 2.003 2.005 0.359%
Chin Well 1.410 1.350 1.375 1.390 1.415 1.430 1.455 1.470 0.145%
Daibochi Plastic 2.090 2.060 2.070 2.080 2.090 2.100 2.110 2.120 0.196%
Evergreen Fibre 1.010 0.965 0.988 0.995 1.018 1.025 1.048 1.055 0.294%
George Kent 2.020 1.930 1.970 1.990 2.030 2.050 2.090 2.110 0.209%
Guh Holdings 0.815 0.808 0.811 0.813 0.816 0.818 0.821 0.823 0.074%
Hil Industries 0.710 0.703 0.706 0.708 0.711 0.713 0.716 0.718 0.068%
Hong Leong Ind 8.520 8.340 8.385 8.460 8.505 8.580 8.625 8.700 0.936%

www.bimbsec.com.my | 8
Market Insight
Stocks Closing Price
S3 S2 S1 Pivot Point
R1 R2 R3 Est.
Weighting
KYM Hldgs Bhd 0.405 n.a. n.a. n.a. n.a. n.a. n.a. n.a. 0.021%
MWE Hold 1.290 1.260 1.265 1.280 1.285 1.300 1.305 1.320 0.102%
Muda Hold 2.100 2.070 2.075 2.090 2.095 2.110 2.115 2.130 0.220%
NTPM Hold. 0.880 0.865 0.868 0.875 0.878 0.885 0.888 0.895 0.340%
Nylex Malaysia 0.530 0.530 0.530 0.530 0.530 0.530 0.530 0.530 0.035%
Perstima 6.130 6.085 6.103 6.115 6.133 6.145 6.163 6.175 0.209%
Scientex 12.640 12.340 12.420 12.540 12.620 12.740 12.820 12.940 1.002%
Sino Hua-an 0.025 n.a. n.a. n.a. n.a. n.a. n.a. n.a. 0.010%
SLP Resources 3.030 2.925 2.978 2.995 3.048 3.065 3.118 3.135 0.258%
Wellcall 2.020 1.990 2.005 2.010 2.025 2.030 2.045 2.050 0.230%
Media
Media Chinese 0.725 0.718 0.721 0.723 0.726 0.728 0.731 0.733 0.421%
Star Publication 2.580 2.565 2.573 2.575 2.583 2.585 2.593 2.595 0.655%
Utusan Melayu 0.480 0.473 0.474 0.478 0.479 0.483 0.484 0.488 0.018%
Oil & Gas
Alam Maritim 0.325 0.310 0.318 0.320 0.328 0.330 0.338 0.340 0.103%
Daya Materials 0.070 0.063 0.066 0.068 0.071 0.073 0.076 0.078 0.045%
Dayang Ent. 1.050 1.020 1.030 1.040 1.050 1.060 1.070 1.080 0.317%
Deleum 1.080 1.050 1.065 1.070 1.085 1.090 1.105 1.110 0.149%
Dialog group 1.520 1.490 1.505 1.510 1.525 1.530 1.545 1.550 2.754%
ESSO Malaysia 3.740 3.680 3.700 3.720 3.740 3.760 3.780 3.800 0.347%
KNM Group 0.400 0.385 0.393 0.395 0.403 0.405 0.413 0.415 0.293%
MMHE 1.070 1.040 1.055 1.060 1.075 1.080 1.095 1.100 0.589%
Perisai Petroleum 0.225 0.210 0.218 0.220 0.228 0.230 0.238 0.240 0.095%
Petra Energy 1.250 1.220 1.225 1.240 1.245 1.260 1.265 1.280 0.138%
Pet Chem 6.600 6.465 6.503 6.555 6.593 6.645 6.683 6.735 18.161%
Pet Dag 23.380 23.050 23.195 23.270 23.415 23.490 23.635 23.710 7.989%
Pet Gas 22.260 21.750 21.855 22.090 22.195 22.430 22.535 22.770 15.150%
Ramunia Hold 0.085 0.070 0.075 0.080 0.085 0.090 0.095 0.100 0.033%
SAAG Cons. n.a. n.a. n.a. n.a. n.a. n.a. n.a. n.a. 0.000%
Sapurakencana 1.410 1.365 1.383 1.395 1.413 1.425 1.443 1.455 2.906%
Scomi Eng 0.225 0.225 0.225 0.225 0.225 0.225 0.225 0.225 0.026%
Scomi Group 0.160 0.153 0.154 0.158 0.159 0.163 0.164 0.168 0.105%
Shell Refining 3.060 2.940 2.995 3.020 3.075 3.100 3.155 3.180 0.316%
Tanjung Offshore 0.300 0.270 0.275 0.290 0.295 0.310 0.315 0.330 0.039%
Wah Seong 0.745 0.715 0.730 0.735 0.750 0.755 0.770 0.775 0.198%
Petra Perdana n.a. n.a. n.a. n.a. n.a. n.a. n.a. n.a. 0.000%
Plantation
Batu Kawan 18.000 17.880 17.900 17.960 17.980 18.040 18.060 18.120 2.510%
BLD Plantation 8.510 n.a. n.a. n.a. n.a. n.a. n.a. n.a. 0.274%
Cepat Wawasan 0.660 0.630 0.640 0.650 0.660 0.670 0.680 0.690 0.070%
Genting Plant 10.600 10.450 10.475 10.550 10.575 10.650 10.675 10.750 2.885%
Golden Land 0.545 0.538 0.541 0.543 0.546 0.548 0.551 0.553 0.041%
Gopeng 1.420 n.a. n.a. n.a. n.a. n.a. n.a. n.a. 0.088%
Hap Seng Plant 2.400 2.370 2.385 2.390 2.405 2.410 2.425 2.430 0.660%
IJM Plant. 3.330 3.240 3.255 3.300 3.315 3.360 3.375 3.420 1.009%
Inch Ken Kajang 0.700 0.700 0.700 0.700 0.700 0.700 0.700 0.700 0.097%
IOI 4.300 4.210 4.240 4.270 4.300 4.330 4.360 4.390 9.300%
Keck Seng Malay 4.780 4.750 4.765 4.770 4.785 4.790 4.805 4.810 0.591%
Kim Loong 3.260 3.245 3.253 3.255 3.263 3.265 3.273 3.275 0.349%
Kretam Holdings 0.560 0.530 0.540 0.550 0.560 0.570 0.580 0.590 0.379%
KLK 23.140 22.810 22.915 23.030 23.135 23.250 23.355 23.470 8.476%
Kulim Malaysia 4.060 n.a. n.a. n.a. n.a. n.a. n.a. n.a. 1.794%
Rimbunan Sawit 0.475 0.468 0.471 0.473 0.476 0.478 0.481 0.483 0.232%
www.bimbsec.com.my | 9
Market Insight
Stocks Closing Price
S3 S2 S1 Pivot Point
R1 R2 R3 Est.
Weighting
Riverview Rubber 3.600 3.570 3.585 3.590 3.605 3.610 3.625 3.630 0.080%
Sarawak Plant 1.800 1.590 1.695 1.730 1.835 1.870 1.975 2.010 0.173%
TDM 0.680 0.673 0.676 0.678 0.681 0.683 0.686 0.688 0.347%
TH Plant 1.080 1.065 1.073 1.075 1.083 1.085 1.093 1.095 0.328%
Tradewinds Plant n.a. n.a. n.a. n.a. n.a. n.a. n.a. n.a. 0.000%
United Plant 27.100 n.a. n.a. n.a. n.a. n.a. n.a. n.a. 1.937%
Power
TNB 14.260 14.110 14.165 14.210 14.265 14.310 14.365 14.410 27.681%
YTL Power 1.440 1.410 1.420 1.430 1.440 1.450 1.460 1.470 3.822%
Property
A & M Realty 1.020 1.005 1.013 1.015 1.023 1.025 1.033 1.035 0.128%
Am Corp Prop. 0.845 0.830 0.838 0.840 0.848 0.850 0.858 0.860 0.172%
Symphony Life Bh 0.695 0.680 0.688 0.690 0.698 0.700 0.708 0.710 0.074%
Crescendo Corp 1.520 1.520 1.520 1.520 1.520 1.520 1.520 1.520 0.119%
Daiman Develop 2.190 2.175 2.178 2.185 2.188 2.195 2.198 2.205 0.159%
Damansara Realty 0.685 0.663 0.674 0.678 0.689 0.693 0.704 0.708 0.073%
Dijaya n.a. n.a. n.a. n.a. n.a. n.a. n.a. n.a. 0.000%
Dutaland 0.440 0.433 0.434 0.438 0.439 0.443 0.444 0.448 0.128%
E&O 1.780 1.660 1.720 1.740 1.800 1.820 1.880 1.900 0.768%
Global Oriental 0.415 0.400 0.405 0.410 0.415 0.420 0.425 0.430 0.065%
Glomac 0.780 0.780 0.780 0.780 0.780 0.780 0.780 0.780 0.194%
Hunza Properties n.a. n.a. n.a. n.a. n.a. n.a. n.a. n.a. 0.000%
IJM Land n.a. n.a. n.a. n.a. n.a. n.a. n.a. n.a. 0.000%
Ivory Properties 0.435 0.428 0.429 0.433 0.434 0.438 0.439 0.443 0.067%
KLCC Property n.a. n.a. n.a. n.a. n.a. n.a. n.a. n.a. 0.000%
KSL Hold. 1.110 1.065 1.088 1.095 1.118 1.125 1.148 1.155 0.385%
Kump Hartanah n.a. n.a. n.a. n.a. n.a. n.a. n.a. n.a. 0.000%
Kump Perangsang 1.060 1.030 1.045 1.050 1.065 1.070 1.085 1.090 0.182%
LBS Bina Group 1.620 1.605 1.613 1.615 1.623 1.625 1.633 1.635 0.324%
Magna Prima 0.920 n.a. n.a. n.a. n.a. n.a. n.a. n.a. 0.105%
Mah Sing 1.540 1.495 1.503 1.525 1.533 1.555 1.563 1.585 1.276%
Malton 0.650 0.635 0.638 0.645 0.648 0.655 0.658 0.665 0.100%
MK Land 0.320 0.313 0.316 0.318 0.321 0.323 0.326 0.328 0.133%
Nadayu n.a. n.a. n.a. n.a. n.a. n.a. n.a. n.a. 0.000%
Plenitude 1.670 1.655 1.663 1.665 1.673 1.675 1.683 1.685 0.219%
Selangor Prop 4.620 4.590 4.595 4.610 4.615 4.630 4.635 4.650 0.546%
Selangor Dredging 0.900 0.900 0.900 0.900 0.900 0.900 0.900 0.900 0.132%
SP Setia 2.950 2.860 2.880 2.920 2.940 2.980 3.000 3.040 2.676%
Sunway Bhd 2.980 2.950 2.960 2.970 2.980 2.990 3.000 3.010 2.064%
Suria Capital 1.990 1.960 1.970 1.980 1.990 2.000 2.010 2.020 0.197%
Talam Corp n.a. n.a. n.a. n.a. n.a. n.a. n.a. n.a. 0.000%
Tebrau Teguh n.a. n.a. n.a. n.a. n.a. n.a. n.a. n.a. 0.000%
UEM Land n.a. n.a. n.a. n.a. n.a. n.a. n.a. n.a. 0.000%
WCT n.a. n.a. n.a. n.a. n.a. n.a. n.a. n.a. 0.000%
Wing Tai 1.100 1.085 1.093 1.095 1.103 1.105 1.113 1.115 0.180%
YNH Property 1.900 1.855 1.863 1.885 1.893 1.915 1.923 1.945 0.286%
YTL Land & Dev 0.600 0.585 0.588 0.595 0.598 0.605 0.608 0.615 0.171%
Rubber Glove
Adventa 0.660 0.645 0.653 0.655 0.663 0.665 0.673 0.675 0.035%
Hartalega 4.280 4.055 4.093 4.205 4.243 4.355 4.393 4.505 2.416%
Kossan 6.600 6.495 6.513 6.565 6.583 6.635 6.653 6.705 1.452%
Latexx Partners n.a. n.a. n.a. n.a. n.a. n.a. n.a. n.a. 0.000%
Rubberex 0.745 0.723 0.734 0.738 0.749 0.753 0.764 0.768 0.059% Supermax Corp 2.100 2.040 2.060 2.080 2.100 2.120 2.140 2.160 0.485%
www.bimbsec.com.my | 10
Market Insight
Stocks Closing Price
S3 S2 S1 Pivot Point
R1 R2 R3 Est.
Weighting
Top Glove 4.380 4.275 4.313 4.345 4.383 4.415 4.453 4.485 1.887%
Technology
Compugates 0.040 0.033 0.036 0.038 0.041 0.043 0.046 0.048 0.029%
D&O Green Tech 0.280 0.273 0.276 0.278 0.281 0.283 0.286 0.288 0.095%
ETI Tech n.a. n.a. n.a. n.a. n.a. n.a. n.a. n.a. 0.000%
Formis Resources n.a. n.a. n.a. n.a. n.a. n.a. n.a. n.a. 0.000%
Formosa Prosonic 0.790 0.783 0.784 0.788 0.789 0.793 0.794 0.798 0.067%
Frontken 0.145 0.138 0.141 0.143 0.146 0.148 0.151 0.153 0.052%
Globetronics 3.290 3.215 3.228 3.265 3.278 3.315 3.328 3.365 0.319%
JCY Int’l 0.590 0.560 0.575 0.580 0.595 0.600 0.615 0.620 0.418%
Key Asic 0.130 0.115 0.120 0.125 0.130 0.135 0.140 0.145 0.037%
MPI 7.890 7.590 7.645 7.790 7.845 7.990 8.045 8.190 0.540%
Notion V-Tec 0.410 0.388 0.396 0.403 0.411 0.418 0.426 0.433 0.038%
Panasonic Man 35.020 33.220 33.560 34.420 34.760 35.620 35.960 36.820 0.732%
Supportive n.a. n.a. n.a. n.a. n.a. n.a. n.a. n.a. 0.000%
Symphony House n.a. n.a. n.a. n.a. n.a. n.a. n.a. n.a. 0.000%
Uchi Tech Bhd 1.600 1.570 1.580 1.590 1.600 1.610 1.620 1.630 0.240%
Unisem 2.620 2.500 2.555 2.580 2.635 2.660 2.715 2.740 0.661%
VS Industry 1.350 1.305 1.318 1.335 1.348 1.365 1.378 1.395 0.543%
Telcos
Axiata Group 5.690 5.540 5.600 5.640 5.700 5.740 5.800 5.840 17.468%
DiGi.Com 4.900 4.825 4.843 4.875 4.893 4.925 4.943 4.975 13.104%
Green Packet 0.235 0.235 0.235 0.235 0.235 0.235 0.235 0.235 0.055%
Maxis 6.060 5.970 6.005 6.030 6.065 6.090 6.125 6.150 15.654%
Telekom Malaysia 6.790 6.670 6.720 6.750 6.800 6.830 6.880 6.910 8.776%
Time Dotcom 7.360 7.210 7.235 7.310 7.335 7.410 7.435 7.510 1.457%
Timber
Jaya Tiasa 1.110 1.065 1.088 1.095 1.118 1.125 1.148 1.155 0.370%
Subur Tiasa 1.430 1.400 1.415 1.420 1.435 1.440 1.455 1.460 0.093%
WTK 1.070 1.025 1.043 1.055 1.073 1.085 1.103 1.115 0.176%
Transport/Logistics
Bintulu Port 6.900 6.900 6.900 6.900 6.900 6.900 6.900 6.900 1.092%
Airasia 2.800 2.695 2.748 2.765 2.818 2.835 2.888 2.905 2.680%
Century Logistic 0.850 0.835 0.838 0.845 0.848 0.855 0.858 0.865 0.112%
Cycle & Carriage 3.200 3.050 3.125 3.150 3.225 3.250 3.325 3.350 0.111%
Hubline 0.010 0.003 0.004 0.008 0.009 0.013 0.014 0.018 0.041%
Integrated Log. 0.760 n.a. n.a. n.a. n.a. n.a. n.a. n.a. 0.045%
Integrax n.a. n.a. n.a. n.a. n.a. n.a. n.a. n.a. 0.000%
Konsortium n.a. n.a. n.a. n.a. n.a. n.a. n.a. n.a. 0.000%
Maybulk 0.810 0.773 0.784 0.798 0.809 0.823 0.834 0.848 0.279%
MISC 7.500 7.305 7.363 7.435 7.493 7.565 7.623 7.695 11.515%
NCB Hold n.a. n.a. n.a. n.a. n.a. n.a. n.a. n.a. 0.000%
Scomi Energy Ser 0.205 0.198 0.199 0.203 0.204 0.208 0.209 0.213 0.165%
Water & Infrastructure
PBA Hold 1.070 1.070 1.070 1.070 1.070 1.070 1.070 1.070 0.122%
Puncak Niaga 1.110 1.050 1.075 1.090 1.115 1.130 1.155 1.170 0.171%
Salcon 0.610 0.588 0.596 0.603 0.611 0.618 0.626 0.633 0.137%
Taliworks Corp n.a. n.a. n.a. n.a. n.a. n.a. n.a. n.a. 0.000%
Lingkaran Trans 5.730 5.505 5.553 5.655 5.703 5.805 5.853 5.955 1.032%
Protasco 1.650 1.590 1.615 1.630 1.655 1.670 1.695 1.710 0.192%

www.bimbsec.com.my | 11
Market Insight
Note: R = Resistance S = Support Est. Weight = Based on FBMah Mkt. Cap
Stocks Closing Price
S3 S2 S1 Pivot Point
R1 R2 R3 Est.
Weighting
Ancom 0.345 0.345 0.345 0.345 0.345 0.345 0.345 0.345 0.026% Asia File bhd 4.060 3.925 3.963 4.015 4.053 4.105 4.143 4.195 0.268%
Boustead Heavy 1.510 n.a. n.a. n.a. n.a. n.a. n.a. n.a. 0.129%
Eden Inc 0.220 0.213 0.214 0.218 0.219 0.223 0.224 0.228 0.024%
Fima Corp 2.220 n.a. n.a. n.a. n.a. n.a. n.a. n.a. 0.184%
Kumpulan FIMA 1.860 1.830 1.845 1.850 1.865 1.870 1.885 1.890 0.178%
KUB Malaysia 0.400 0.378 0.386 0.393 0.401 0.408 0.416 0.423 0.077%
Pie Industrial 2.300 2.135 2.168 2.245 2.278 2.355 2.388 2.465 0.304%
Southern Acids 3.900 n.a. n.a. n.a. n.a. n.a. n.a. n.a. 0.184%
Mega First 1.830 1.770 1.800 1.810 1.840 1.850 1.880 1.890 0.240%
Coastal Contract 1.480 1.465 1.473 1.475 1.483 1.485 1.493 1.495 0.270%
Time Engineering n.a. n.a. n.a. n.a. n.a. n.a. n.a. n.a. 0.000%
Sealink Int'l 0.215 n.a. n.a. n.a. n.a. n.a. n.a. n.a. 0.037%
Shin Yang 0.335 0.335 0.335 0.335 0.335 0.335 0.335 0.335 0.138%
Jobstreet Corp n.a. n.a. n.a. n.a. n.a. n.a. n.a. n.a. 0.000%
Myeg Services 1.790 1.730 1.760 1.770 1.800 1.810 1.840 1.850 1.480%
Pos Malaysia 2.790 2.640 2.715 2.740 2.815 2.840 2.915 2.940 0.515%
Picorp 0.140 0.125 0.130 0.135 0.140 0.145 0.150 0.155 0.032%
Lion Forest 0.560 0.553 0.556 0.558 0.561 0.563 0.566 0.568 0.044%
Ancom 0.345 0.345 0.345 0.345 0.345 0.345 0.345 0.345 0.026%
www.bimbsec.com.my | 12
Market Insight
DEFINITION OF RATINGS BIMB Securities uses the following rating system: STOCK RECOMMENDATION BUY Total return (price appreciation plus dividend yield) is expected to exceed 10% in the next 12 months. TRADING BUY Share price may exceed 15% over the next 3 months, however longer-term outlook remains uncertain. HOLD Share price may fall within the range of +/- 10% over the next 12 months TAKE PROFIT Target price has been attained. Fundamentals remain intact. Look to accumulate at lower levels. TRADING SELL Share price may fall by more than 15% in the next 3 months. SELL Share price may fall by more than 10% over the next 12 months. NOT RATED Stock is not within regular research coverage. SECTOR RECOMMENDATION OVERWEIGHT The Industry as defined by the analyst’s coverage universe, is expected to outperform the relevant primary market
index over the next 12 months NEUTRAL The Industry as defined by the analyst’s coverage universe, is expected to perform in line with the relevant primary
market index over the next 12 months UNDERWEIGHT The Industry as defined by the analyst’s coverage universe, is expected to underperform the relevant primary
market index over the next 12 months Applicability of ratings The respective analyst maintains a coverage universe of stocks, the list of which may be adjusted according to needs. Investment ratings are only applicable to the stocks which form part of the coverage universe. Reports on companies which are not part of the coverage do not carry investment ratings as we do not actively follow developments in these companies. Disclaimer The investments discussed or recommended in this report may not be suitable for all investors. This report has been prepared for information purposes only and is not an offer to sell or a solicitation to buy any securities. The directors and employees of BIMB Securities Sdn Bhd may from time to time have a position in or either the securities mentioned herein. Members of the BIMB Group and their affiliates may provide services to any company and affiliates of such companies whose securities are mentioned herein. The information herein was obtained or derived from sources that we believe are reliable, but while all reasonable care has been taken to ensure that stated facts are accurate and opinions fair and reasonable, we do not represent that it is accurate or complete and it should not be relied upon as such. No liability can be accepted for any loss that may arise from the use of this report. All opinions and estimates included in this report constitute our judgements as of this date and are subject to change without notice. BIMB Securities Sdn Bhd accepts no liability for any direct, indirect or consequential loss arising from use of this report.
Published by
BIMB SECURITIES SB (290163-X) A Participating Organisation of Bursa Malaysia Securities Berhad Level 32, Menara Multi Purpose, Capital Square, No. 8 Jalan Munshi Abdullah, 50100 Kuala Lumpur Tel: 03-2613 1600 Fax: 03-2613 1799 Thong Pak Leng http://www.bimbsec.com.my
The investments discussed or recommended in this report may not be suitable for all investors. This report has been prepared for information purposes only and is not an offer to sell or a solicitation to buy any securities. The directors and employees of BIMB Securities Sdn Bhd may from time to time have a position in or with the securities mentioned herein. Members of the BIMB Group and their affiliates may provide services to any company and affiliates of such companies whose securities are mentioned herein. The information herein was obtained or derived from sources that we believe are reliable, but while all reasonable care has been taken to ensure that stated facts are accurate and opinions fair and reasonable, we do not represent that it is accurate or complete and it should not be relied upon as such. No liability can be accepted for any loss that may arise from the use of this report. All opin-ions and estimates included in this report constitute our judgement as of this date and are subject to change without notice..
The investments discussed or recommended in this report may not be suitable for all investors. This report has been prepared for information purposes only and is not an offer to sell or a solicitation to buy any securities. The directors and employees of BIMB Securities Sdn Bhd may from time to time have a position in or with the securities mentioned herein. Members of the BIMB Group and their affiliates may provide services to any company and affiliates of such companies whose securities are mentioned herein. The information herein was obtained or derived from sources that we believe are reliable, but while all reasonable care has been taken to ensure that stated facts are accurate and opinions fair and reasonable, we do not represent that it is accurate or complete and it should not be relied upon as such. No liability can be accepted for any loss that may arise from the use of this report. All opin-ions and estimates included in this report constitute our judgement as of this date and are subject to change without notice..
The investments discussed or recommended in this report may not be suitable for all investors. This report has been prepared for information purposes only and is not an offer to sell or a solicitation to buy any securities. The directors and employees of BIMB Securities Sdn Bhd may from time to time have a position in or with the securities mentioned herein. Members of the BIMB Group and their affiliates may provide services to any company and affiliates of such companies whose securities are mentioned herein. The information herein was obtained or derived from sources that we believe are reliable, but while all reasonable care has been taken to ensure that stated facts are accurate and opinions fair and reasonable, we do not represent that it is accurate or complete and it should not be relied upon as such. No liability can be accepted for any loss that may arise from the use of this report. All opin-ions and estimates included in this report constitute our judgement as of this date and are subject to change without notice..