VAST MM: Multimedia Browser for Presentation Video · VAST MM: Multimedia Browser for Presentation...
8
VAST MM: Multimedia Browser for Presentation Video Alexander Haubold Department of Computer Science Columbia University New York, NY 10027 [email protected] John R. Kender Department of Computer Science Columbia University New York, NY 10027 [email protected] ABSTRACT In the domain of candidly captured student presentation videos, we examine and evaluate approaches for multi-modal analysis and indexing of audio and video. We apply visual segmentation techniques on unedited video to determine likely changes of topics. Speaker segmentation methods are employed to determine individual student appearances, which are linked to extracted headshots to create a visual speaker index. Videos are augmented with time-aligned filtered keywords and phrases from highly inaccurate speech transcripts. Our experimental user interface, the VAST MM Browser (Video Audio Structure Text Multi Media Browser), combines streaming videos, visual, and textual indices for browsing and searching. We evaluate the UI and methods in a large engineering design course. We report on observations and statistics collected over 4 semesters and 598 student participants. Results suggest that our video indexing and retrieval approach is effective, and that our continuous improvements are reflecting in an increase in precision and recall of user study tasks. Categories and Subject Descriptors H.3.7 [Information Storage and Retrieval]: Digital Libraries – dissemination, H.5.1 [Information Interfaces and Presentation]: Multimedia Information Systems – evaluation/methodology, H.5.2: User Interfaces – graphical user interfaces (GUI), I.2.10 [Artificial Intelligence]: Vision and Scene Understanding – video analysis. General Terms Measurement, Design, Experimentation, Human Factors, Verification. Keywords Presentation video, video library, speaker segmentation, visual segmentation, text augmentation, transcript analysis, automatic speech recognition, speaker index, streaming video. Figure 1: Video summary for presentation video. Indices include thumbnails, speaker and visual segmentation cues, keywords/phrases, and a visual speaker list. 1. INTRODUCTION Video is a versatile medium, whose role in the classroom beyond lecture recordings has not yet been explored. Similar to recorded lectures, their value as study tools is very promising. They can be effectively used to record team interaction, student performance during presentations, or project work progress over the duration of a term. Video libraries of presentation videos over several semesters present a novel approach of archiving student work, which can serve as supplemental material for future students. One of the reasons for the reluctant acceptance of this medium for such classroom use is the significant time commitment required for the production of such video. In addition to equipment and camera operator expenses, the amount of time necessary for post- production and dissemination present a burden for instructors and staff. Even when recorded video does not undergo additional editing and is made available in its raw format, means of finding information quickly do not exist without additional manual labor. If a class is sufficiently large such that several hours of video are collected over a term, indices into these videos are necessary to facilitate search and retrieval. Permission to make digital or hard copies of all or part of this work for personal or classroom use is granted without fee provided that copies are not made or distributed for profit or commercial advantage and that copies bear this notice and the full citation on the first page. To copy otherwise, or republish, to post on servers or to redistribute to lists, requires prior specific permission and/or a fee. CIVR ’07, July 9-11, 2007, Amsterdam, The Netherlands. Copyright 2007 ACM 978-1-59593-733-9/07/0007…$5.00.
Transcript of VAST MM: Multimedia Browser for Presentation Video · VAST MM: Multimedia Browser for Presentation...
VAST MM: Multimedia Browser for Presentation Video Alexander Haubold
Department of Computer Science Columbia University New York, NY 10027
John R. Kender Department of Computer Science
Columbia University New York, NY 10027
ABSTRACT In the domain of candidly captured student presentation videos, we examine and evaluate approaches for multi-modal analysis and indexing of audio and video. We apply visual segmentation techniques on unedited video to determine likely changes of topics. Speaker segmentation methods are employed to determine individual student appearances, which are linked to extracted headshots to create a visual speaker index. Videos are augmented with time-aligned filtered keywords and phrases from highly inaccurate speech transcripts. Our experimental user interface, the VAST MM Browser (Video Audio Structure Text Multi Media Browser), combines streaming videos, visual, and textual indices for browsing and searching. We evaluate the UI and methods in a large engineering design course. We report on observations and statistics collected over 4 semesters and 598 student participants. Results suggest that our video indexing and retrieval approach is effective, and that our continuous improvements are reflecting in an increase in precision and recall of user study tasks.
Categories and Subject Descriptors H.3.7 [Information Storage and Retrieval]: Digital Libraries – dissemination, H.5.1 [Information Interfaces and Presentation]: Multimedia Information Systems – evaluation/methodology, H.5.2: User Interfaces – graphical user interfaces (GUI), I.2.10 [Artificial Intelligence]: Vision and Scene Understanding – video analysis.
General Terms Measurement, Design, Experimentation, Human Factors, Verification.
Keywords Presentation video, video library, speaker segmentation, visual segmentation, text augmentation, transcript analysis, automatic speech recognition, speaker index, streaming video.
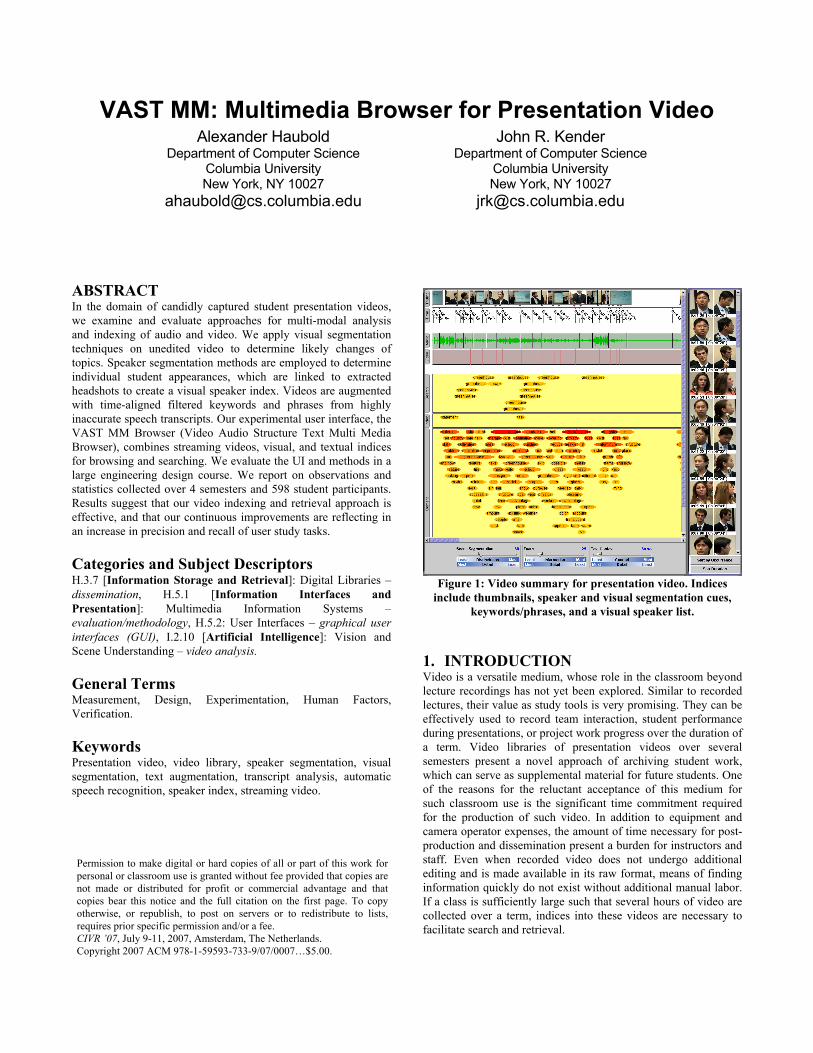
Figure 1: Video summary for presentation video. Indices include thumbnails, speaker and visual segmentation cues,
keywords/phrases, and a visual speaker list.
1. INTRODUCTION Video is a versatile medium, whose role in the classroom beyond lecture recordings has not yet been explored. Similar to recorded lectures, their value as study tools is very promising. They can be effectively used to record team interaction, student performance during presentations, or project work progress over the duration of a term. Video libraries of presentation videos over several semesters present a novel approach of archiving student work, which can serve as supplemental material for future students. One of the reasons for the reluctant acceptance of this medium for such classroom use is the significant time commitment required for the production of such video. In addition to equipment and camera operator expenses, the amount of time necessary for post-production and dissemination present a burden for instructors and staff. Even when recorded video does not undergo additional editing and is made available in its raw format, means of finding information quickly do not exist without additional manual labor. If a class is sufficiently large such that several hours of video are collected over a term, indices into these videos are necessary to facilitate search and retrieval.
Permission to make digital or hard copies of all or part of this work for personal or classroom use is granted without fee provided that copies are not made or distributed for profit or commercial advantage and that copies bear this notice and the full citation on the first page. To copy otherwise, or republish, to post on servers or to redistribute to lists, requires prior specific permission and/or a fee. CIVR ’07, July 9-11, 2007, Amsterdam, The Netherlands. Copyright 2007 ACM 978-1-59593-733-9/07/0007…$5.00.

Figure 2: Split panorama view of lecture/presentation room: (left) View of classroom audience, (middle) View of classroom
audience and “stage”, (right) View of stage. Presentation videos capture presentations in the style of the middle and right views at various zoom levels. During Q&A sessions, the camera sometimes pans to the audience.
Instructional videos have received much attention, and were investigated in passive [1] and invasive environments [2]. Structuring and indexing of content is performed using visual cues [1,3] and textual cues within [4], and across [5] lectures. Professional presentation videos by single speakers in controlled environments have also been considered [6]. Lecture videos exhibit a good structure with respect to an outside organization, such as course textbooks or syllabi, but it varies across lectures [5]. Surveillance videos have no structure, but simple kinds of events tend to repeat [11]. Presentation videos are midway: they tend to have events of larger granularity like lectures, but they repeat like surveillance. Techniques used for segmentation have to be midway, too.
In this paper, we focus on student presentation videos in a large university-level engineering course with more than 150 students per semester. Students work in teams of 4-8 on a variety of projects, and hold two presentations per term summarizing their progress (Figure 2). The preliminary design presentation serves the purpose of providing feedback to students on their project and their individual presentation skills. The final presentation is mainly used for archival and use in subsequent terms. Using our automatic video indexing tools, we make available all presentations to students in the course (Figure 1). Students use the tool at the beginning of the semester to perform background research on previous projects, and after the midterm to evaluate themselves and their peers. Towards the end of a term, we perform supervised and unsupervised user studies on the effectiveness on newly developed or modified features.
Characteristic of these videos is their low-quality production, which for their limited use neither requires nor merits elaborate setup or post-editing. Lighting and acoustics of the classroom remain unmodified, and thus exhibit significant variation between recordings. A separate microphone is set up to better capture presentations; however, variations in quality occur with varying student speaking skills, volume, etc.
Indices and user interface for presentation videos must be sensitive to their intended use. Next to visual cues, like presentation slides and spoken content, the student is the main focus in these videos. Instructors are interested to locate individual students’ appearance, and students look to investigate their own and their peers’ performance. Therefore, useful indices include visual summaries of scenes, words and phrases indicative of content, and means of locating speakers. Visual segmentation
Figure 3: Flowchart of presentation video analysis. Three
modalities are highlighted: text (yellow, top), audio (green, middle), and visual.
is performed by combining two methods that determine scene changes, one for abrupt and one for gradually changing content. Speaker segmentation determines individual student appearances, and is the foundation for extracting headshots for the visual speaker index. Automatic transcripts are generated without speaker or language models due to the significant additional burden such an endeavor would present. Instead we apply approaches for filtering the highly inaccurate transcripts to produce relevant keywords and phrases [7]. An outline of the analysis is presented in Figure 3.
The paper is structured as follows: in section 2 we present our approach to visual segmentation. Section 3 outlines speaker segmentation and our experimental visual speaker index. In section 4 we discuss our multimedia browser interface, followed by our extensive user study and results in section 6.
2. VISUAL SEGMENTATION Unedited presentation videos do not feature production cues, such as scene cuts or fades, which are usually used to define visual segmentation. Unlike professional presentations, students presentations are held in classrooms, where presenters and

audience inevitably appear in the same camera shots. Cues for visual segmentation of such noisy video data should be sensitive to the recording environment. It is neither sufficient to rely on only one cue, nor is it appropriate to pre-define the characteristics of a shot. We therefore apply methods that generate a visual segmentation, and in the user interface allow the user to select the granularity.
When presentations make use of electronic slides and the camera captures their content, slide changes are used as a cue to indicate an interesting visual change. Abrupt visual activity of this kind is similar to scene cuts in edited video. We use a windowed approach that detects significant visual change V in the immediate neighborhood of a point P in the video. We divide a video frame into a 10x10 grid and compute consecutive frame differences using pixel intensity change between sub-regions of two frames. Intensity change is defined by a threshold value of 30 (out of 255) beyond which the difference contributes a unit amount. Only up to 10% of absolute visual change in a sub-region contributes to the global aggregate measure of difference between two frames. We impose this sub-region measure to attenuate the absolute contribution of visual activity in small regions. Using this approach, the global intensity change is clipped at 10% of the maximum amount of change that can occur between two frames, e.g. a complete change of color. Significant visual change is detected between two video frames (point P) when their value deviates significantly from the visual change prior to or after P. We define:
Vleft: Visual activity in the set { V(Pleft-2sec), …, V(Pleft) }
Vright: Visual activity in the set { V(Pright), …, V(Pright+2sec) }
Significant visual change is detected when:
)()()max()()()max( rightrightleftleft VPVVVPVV µµ −<∧−<
Our second method of detecting interesting visual events is based on gradually changing content in the video, such as camera pans, zooms, entering and/or leaving of a person with respect to the camera view. We employ a windowed approach to comparing histogram differences between more distant frames, in our case 4 seconds apart. We have determined experimentally that a color histogram with 2 bits per color resulting in 64 bins is sufficient in capturing visually significant events. Due to the pair-wise comparison of distant frames, a change in visual content is determined by a significant drop in the similarity measured between the left and right windows. Such a point characterizes the start of calm visual activity after a sequence of motion.
In a final step, visual activity from both methods is combined to produce an aggregate set of visual events. Using a windowed approach, gradual and abrupt changes are merged. If activity from both is recorded in close vicinity (e.g. 4 seconds), the temporal location of abrupt change is preferred. Both measures of visual change are accompanied by activity intensity values, which are used as a tunable parameter in the user interface.
3. VISUAL SPEAKER INDEX Next to presentation content, students and their performance are the main focus in student presentation videos. The duration of an individual student’s appearance is relatively short and ranges from 5 seconds to 5 minutes. A typical 80-minute presentation video contains about 60 student appearances, a large number of
Figure 4: Four versions of speaker indices in order of search and retrieval performance. Left to right: (1) Large head/shoulder shot and profile shot, (2) Small head shot, (3) Large head/shoulder shot, (4) Small headshot and profile shot. Performance is measured by
duration and completion rate for a user study search task.

Figure 5: User study task for search and retrieval of a presenter. Given the visual cue of the person, students must find the
appearance in a set of videos.
Table 1: User study results for visual speaker index in order of decreasing performance. Duration measures only successful
completions.
Large Head / Shoulder & Profile
Large Head
Small Head
Small Head / Shoulder & Profile
Completion 97% 91% 97% 91%
Duration (sec) 86.72 115.22 128.80 155.65
Participants 31 35 30 33
which are repetitions. A common task for users of video summaries is to locate the appearance of a particular individual, whether by name or visual cues. Instructors may be interested in searching for a student in order to review their presentation performance, while students are interested in finding their own appearance or that of peers. An effective index into these videos must accommodate the intended use of searching for presenters. In the absence of manually annotated names, a visual index of speaker faces is a viable alternative.
3.1 Selecting visual cues We rely on automatic speaker segmentation [7] to create a list of individual speakers. We first extract mel frequency cepstral coefficients (MFCC0 - MFCC12) from the audio track, and then determine change in speakers by applying the Bayesian Information Criterion (BIC). We then manually extract regions from video keyframes, which best portrait the individual presenters, and apply contrast normalization to adjust the highly varying lighting conditions in the recorded video. In our experimental iteration of including a visual index of faces, we chose to manually prepare the data set. The results from our user studies will eventually drive an automatic method of extracting the desired visual data. We intend on using low-level motion detection in a sequence of frames to localize potential speakers, and applying face detection in those areas to extract speaker faces. Preliminary experimentation offered reasonably effective results, and combined with prior work in this area [9,10], an automatic generation of visual speaker indices is feasible.
3.2 Evaluation We have designed four slightly different versions of a visual speaker index (Figure 4). In order of search and retrieval performance, they are: (1) large (75x75 pixel) head/shoulder and profile shots, (2) large head/shoulder shot, (3) small (50x50 pixel) headshot, and (4) small head/shoulder and profile shots. As part of our user study, we have measured the effect of each configuration. Students were presented with the task of locating an unfamiliar face in a set of videos (Figure 5), each with a visual
speaker index as pictured in Figure 6. The 129 participants from four sections of our course were randomly assigned one of the four speaker indices. In order to guarantee that the student pictured in the task did not appear in the participant’s course section, we vary the task material by section. Effectiveness of each speaker index configuration is measured by the duration and completion rate of the task. Completion rate describes the number of tasks completed versus the total number of tasks. A task is not successfully completed, if the participant is unable to find the expected content in the video and skips the question, or advertently/inadvertently completes the task too quickly, suggesting that they did not properly read the question. Results from this task are presented in Table 1. The highest performance is exhibited by the speaker index with the most visual detail, namely large head/shoulder and profile shots. The success of this configuration cannot, however, be correlated to the use of a head/shoulder shot for the user study task, because the second highest performance for search and retrieval is evidenced by the small headshot, followed by the large headshot. Overall, using the best configuration, students required 87 seconds on average to accurately locate a face with a 97% completion rate, followed by 115 seconds for the next best configuration. This experiment suggests that higher resolution is helpful for fast search and retrieval, but further studies are necessary to evaluate the effect of including several face shots.
4. USER INTERFACE Our user interface includes various visual summarization tools, means for searching the video library, and a streaming video player to play back full contents. The present interface features a list for selecting videos, which can potentially be changed to a tree-like directory structure for scalability. Figure 6 provides a screenshot of the complete VAST MM Browser (Video Audio Structure Text MultiMedia Browser). Selected videos expand to a full summary, which includes thumbnails, timeline, speaker and visual segmentation, and keyword and key phrase graphs. These summarization UIs are ordered vertically to present different modalities and content is time-aligned horizontally to preserve the contextual relationships. Thumbnails enlarge to full-size images when the mouse cursor is moved over, and disappear when the mouse is moved away from them.
4.1 Keyword and key phrase indices Keywords and phrases are represented by horizontal blips, whose background color and vertical position denotes their importance. Words and phrases with stronger meaning are colored red and are located closer to top. Importance is measured by several factors, the linear combination of which is intended to emphasize unique and descriptive text [13]:
• Meaning and descriptiveness of a phrase increases with the number of words;

Figure 6: User Interface featuring video summaries in the multi-modal domain. The video summary is displayed as a collection of horizontal tracks, each representing a different modality: thumbnail images, time line, speaker segmentation, visual segmentation,
search phrases, topic phrases, and content phrases. Three parameters of the summary can be tuned: (1) scene segmentation (coarse versus fine), (2) zoom (overview versus detail), and (3) text context (highlight repetitive phrases within a time interval).
Streaming video and a keyframe player are available as well, but are not emphasized in the user interface. (Note: in this iteration of the user study, the search phrase track was not available)
• The more noun senses a phrase has, the more descriptive it is of an object;
• Verb senses are weighted less than noun senses;
• Distance from the root sense in WordNet helps to determine how uniquely descriptive a phrase is;
• Overall number of senses is inversely proportional to uniqueness.
We have experimented with various measures and weightings of semantic ranking, including those in previous work [12]. While no formal optimization exists for our measure, we have determined through user studies that qualitative responses to summarization tasks have increased with the introduction of this semantic ranking method in addition to filtering of raw transcripts, compared to earlier studies [7].
Filtered and ranked transcript phrases are time-aligned in a separate step during creation of video summaries, because many commercial speech-to-text transcription software packages surprisingly do not provide timestamps [8].
Searching video content is presently limited to automatic speech transcripts, which limits the accuracy of the corpus to that of the speech recognition system. We provide two corpora of text for
searching: Using key phrases, a search is performed only on filtered text, which decreases the amount of available information, but increases accuracy. Inversely, a search in the original transcripts increases information, but decreases accuracy.
We provide a slider, “Text Context”, which creates a temporal context between phrases by combining repeated usage of similar text. Words and phrases are initially displayed as horizontal blips. With increasing text context, similar words are grouped temporally, and blips expand horizontally to mark the duration over which the represented text is used in the video. At the same time, the amount of detail in the text graph decreases. The extent to which controls are used depends on the user. We recognize that some users are able to maintain a reasonable overview with a large amount of displayed data, while others prefer to work with smaller amounts.
4.2 Video indices Three controls are included for the user to customize the summaries. “Scene Segmentation” varies the granularity of visual segmentation, which also drives the number of displayed summary thumbnails. A lower value decreases distinctiveness of scenes, but increases detail. “Zoom” allows the user to vary the duration of the video summary visible per unit screen space. A lower value decreases the duration of video summary and amount

of information visible on the screen, but increases the level of detail. Higher values are preferred for obtaining a superficial overview of video content, while a lower value is more useful for exploring sections of the video, for example short presentations.
4.3 Facial Index We include an experimental visual speaker user interface in lieu of cumbersome annotation of student names. Since the number of speaker per video is naturally limited, this interface scales well with increasing library size. While the headshots are presently extracted manually from the underlying speaker segmentation, existing research shows that automatic extraction is feasible [9,10]. Selection of speakers in the list advances the video summary to the appropriate appearance.
4.4 Streaming Video A streaming video player is provided to view original content in full audio and video. Due to technical limitations of the Java Media Framework (JMF), we have implemented a complete MPEG1 video player and streaming server in Java, which does not reply on system codecs or libraries. Alternatively for fast video skimming, a key frame player is available to pace through key frames derived from video segmentation. Our tool, the VAST MultiMedia Browser, is publicly available at the following URL: http://www.aquaphoenix.com/research/vastmm.
5. USER STUDY We periodically administer user studies in our large engineering design course to evaluate the usefulness of our tools, and to collect data suggesting areas of improvement. Task-based experiments measure the effects of various UI components, focusing on duration, completion, and accuracy of student responses. Students are also required to complete a survey from which we gather their opinions. For the time of the semester during which user studies are administered, we add an additional component to the user interface which displays tasks and if necessary collects input. We have collected data over a two-year period (4 consecutive semesters) from 598 participants. Adjustments and improvements to the video browser are made after each term, taking into account results from our user studies and suggestions from surveys.
User studies with measurable effects are not trivial, in particular in a multi-modal domain. We have designed a set of 5-7 tasks related to search and summarization of video content, which students must complete. These tasks are comparable to typical queries that students may perform given a set of videos containing many presentations:
1. Find your own appearance in the video. 2. Locate the portion of the video in which your team
discusses topic XYZ. 3. Find the beginning of your team’s presentation. 4. Find the presentation on subject XYZ (titled ABC). 5. Using the available keywords for the presentation
located between TIME1 and TIME2, summarize the project’s goals as best as possible.
The user study is carried out in our lab environment during class with 10-15 students at a time, while the remaining students work on their projects. We note that the lab is fairly noisy and not comparable to an office or study room environment. External
distractions occur frequently, and add to the casual environment in which students tend to work in teams.
After a short introduction and training session on using the video browser, each student begins the user study at their own leisure. Once started, search and retrieval tasks appear in the interface, and students can use any of the available features to complete the tasks. Because our course is separated into 4-5 sections without interaction between sections, students are familiar only with the presentation content in their own section. To simulate a realistic environment, a student’s tasks related to search and retrieval of unfamiliar content always target another course section. While students complete user study tasks using the video browser and its retrieval features, all actions are logged with time stamps.
Completed tasks are measured by their accuracy – for search-related tasks students must find and mark the answer on a timeline; summarization tasks are measured by the quality of the worded response. Tasks that are explicitly skipped count as incomplete, for example when a student is unable to locate an answer. Tasks answered in too short of a time period, which occurs when students intentionally or unintentionally skim through the user study, are ignored altogether.
We define several criteria for evaluation although many others are possible. Completion rate denotes the number of tasks completed properly. A lower value indicates that tasks were skipped often, whether due to frustration of not finding the answer, or advertently/inadvertently skipping tasks. Accuracy measures the temporal distance between a user’s selection and the correct answer for tasks related to searching. Finally, we measure the temporal duration of a task adjusted by the time required to load a video summary. This adjustment is necessary, because the user study is carried out in various environments and network bandwidth is not constant.
We have observed very positive developments with the continuous improvements to our video browser. Overall task completion rates have improved from 81% to 92% over 3 semesters. For the most characteristic search task of locating an unfamiliar presentation in a set of several videos, the completion rate has improved from 53% to 73%. Accuracy, too, has increased overall, but we note an interesting “trust” effect. In the absence of a text search feature, which is particularly useful when locating unfamiliar material, students apply more care in locating the correct response in the entire set of videos, which requires more time but increases accuracy. Surprisingly, if a text search engine is used, accuracy drops significantly from 4 to 229 seconds, while completion increases from 53% for 73%. Analysis shows that the average is due to a number of outliers with high off-target answers, while the remaining 80% of students still mark the correct answer within an error margin of 4 seconds. We believe that the high off-target responses are due to students trusting the search results, which correctly narrow the search domain to one video, but do not identify the approximate location of the results. If the exact answer cannot be found, the next best answer is to select a random location in the video. In a newer iteration of the tool, we have included a feature by which search terms are highlighted in their matching locations in the video (Figures 1 and 6). Detailed results for user study tasks are presented in Table 2.
Our approach of filtering inaccurate speech transcripts and prioritizing key words and phrases in the interface has proven to

Table 2: Comparison of various user study tasks over 3 semesters. Measures include completion, duration (in seconds), and accuracy (in seconds). Results in these tables are only for those user studies with video availability (those without are explained in
section 5) Entries marked with (*, **, and ***) are analyzed in detail in section 5. 2a: All Tasks
Measure Fall 2005 Spring 2006 Fall 2006
Completion 0.81 0.83 0.92
Duration 120.11 126.66 100.22
2b: Find material related to own presentation (Tasks 1, 2, 3)
Measure Fall 2005 Spring 2006 Fall 2006
Completion 0.82 0.85 0.94
Duration 83.75 75.69 61.94
Accuracy 42.63 25.28 20.69
2c: Find the presentation on subject XYZ (titled ABC)
Measure Fall 2005 Spring 2006 Fall 2006
Completion 0.53 0.52 0.73
Duration 431.69 357.35 301.5
Accuracy 64.04 3.76 229.43 (*)
2d: Summarize presentation X given available keywords.
Measure Fall 2005 Spring 2006 Fall 2006
Completion 0.93 0.94 0.985
Duration 47.74 92.89 74.22 (**)
Accuracy (***) (***) (***)
be a successful summarization tool. During the first three user studies, we have tested presentation summarization by providing a multiple-choice task. In our most recent iteration, students were required to articulate a response using only the available keywords. The quality of answers suggests that the selection of words and phrases is sufficient for forming a general idea about the content of a project, but no quantitative measure has been derived yet.
Analysis of time required to fulfill tasks shows an overall decrease with an average of 100 seconds per search or summarization task. Search tasks for unfamiliar content by far outweigh all other tasks with an average of 5 minutes. However, we should note that the correct response for a question of this type is found in a window of 5-10 seconds from video footage with duration 23,380 seconds (6.5 hours). For summarization tasks we
Table 3: Comparison of video browser usage for user study in two environments: In Class (supervised) and At Home (unsupervised). While completion is approximately equal, the means of task completion differ greatly, exhibited by twice the task
duration for home users. (duration is adjusted for loading time of video summaries). Highlighted are actions with significant differences. Preparation time, usage of streaming video versus keyframes, and usage of UI controls exhibit large variations. Non-standard use of keyframes, UI controls, and text search appears to be very effective (as shown by completion rate and duration),
but does seem to require some instruction (preparation time).
Differences of “At Home” to “In Class”
Category Action / Event In Class At Home
Absolute Ratio Participants 78 51 Preparation Time (sec) 946.97 343.73 -603.24 0.36 Completion Rate of Questions 0.92 0.88 -0.04
Task related
Average Adjusted Duration of a task (sec) 100.22 195.60 +95.38 1.95 Loading Time of videos and summaries (average time per task) 9.85 22.64 +12.79 2.30 Video Summaries Videos and summaries loaded (average number per task) 1.32 1.53 +0.21 1.16
Text Search Video Search (average number per task) 1.79 0.99 -0.80 0.55 Streaming Video events (average number per task) 1.91 7.61 +5.70 3.98 Streaming Video Streaming Video time (average time per task) 10.78 24.38 +13.60 2.26 Show Keyframes (average number per task) 47.22 34.48 -12.74 0.73 Show Keyframes (average time per task) 21.72 36.21 +14.49 1.67 Keyframe Player Slideshow events (average number per task) 9.15 5.15 -4.00 0.56
Keyframe
Keyframe Player Slideshow (average time per task) 7.75 2.12 -5.63 0.27 Visual Segmentation Refinement (average time per task) 2.94 1.77 -1.17 0.60 Zoom Refinement (average time per task) 8.36 3.22 -5.14 0.39
UI Controls
Text Context refinement (average time per task) 8.72 6.34 -2.38 0.73

observed only a nominal increase in duration, which is due to the shift from multiple choice to freeform responses.
For three consecutive semesters (469 participants) we have measured the effect of making available the actual video as part of the video summaries. Half of the participants had access to the video, while the other half was unable to view video or listen to the audio track. The video player features rudimentary media controls, such as play/pause and a slider for skipping to other parts of the video. Surprisingly we have found that for tasks of search and summarization, availability of video was counterproductive. With similar accuracy and completion of tasks, students with access to video required 50% more time to complete their assigned tasks. We believe that with access to video, students get “stuck” watching extraneous material without making effective use of summarization tools.
In our latest iteration we have evaluated the effect of environment among other variables. Half the class was required to complete the user study in class under supervision, while the other half was assigned to finish the user study at home. An on-line tutorial replaced in-class instructions for home users. Statistics of usage vary greatly between the two groups, while completion rate was marginally better for in-class students (4%). On average, home users only took one third as much time to become acquainted with the video browser, and required twice as much time to complete tasks. They used significantly more streaming video and less of the key frame features. In part this discrepancy can be explained by the difference of introduction to the video tool. Table 3 outlines a more detailed comparison between the home and classroom settings.
In general, we can conclude that our methods of video analysis and our tools for searching and visualization are effective for information retrieval in video libraries. User studies have helped identify shortcomings and strong points, and addressing them in subsequent improved versions resulted in improvements in search and retrieval. As a multi-modal domain, video summaries require analysis and UI tools for various modalities. Our selection and enhancement of visual, speech, text cues and their UI components indicate that our automated analysis of video are effective for increasing accuracy and completion, and decreasing duration of search and summarization tasks.
6. CONCLUSION We have presented approaches for segmentation and indexing of presentation video. Methods of analysis and design of user interfaces were successfully evaluated in user studies with 598 students over four semesters. Performance of tasks related to video search and retrieval has increased with the introduction of improved methods. In future work, we will be further analyzing visual speaker indices and their automatic creation.
7. REFERENCES [1] Mukhopadhyay, S., and Smith, B. Passive capture and
structuring of lectures. In Proc. of the ACM International Conference on Multimedia (MM ’99) (Orlando, FL, Oct. 30 – Nov. 5, 1999). ACM Press, New York, NY, 1999, 477-487.
[2] Abowd, G.D., Atkeson, C.G., Feinstein, A., Hmelo, C., Kooper, R., Long, S., Sawhnet, N., and Tani, M. Teaching and Learning as Multimedia Authoring: The Classroom 2000
Project. In Proc. of the ACM International Conference on Multimedia (MM ’00) (Los Angeles, CA, Oct. 30 – Nov. 3, 2000). ACM Press, New York, NY, 2000, 187-198.
[3] Haubold, A., and Kender, J.R. Analysis and Interface for Instructional Video. In Proc. of the IEEE International Conference on Multimedia & Expo (ICME ’03) (Baltimore, MD, July 6-9, 2003). IEEE Press, New York, NY, 2003, 704-708.
[4] Lin, M., Nunamaker, J.F., Chau, M., and Chen, H. Segmentation of Lecture Videos based on Text: A Method Combining Multiple Linguistic Features. In Proc. of the 37th Hawaii International Conference on System Sciences (HICCS ’04) (Big Island, HI, January 5-8, 2004). IEEE Computer Society Press, New York, NY, 2004, 3-11.
[5] Haubold, A., and Kender, J.R. Analysis and Visualization of Index Words from Audio Transcripts of Instructional Videos. In Proc. of the IEEE International Workshop on Multimedia Content-based Analysis and Retrieval (MCBAR ’04) (Miami, FL, December 15, 2004). IEEE Press, New York, NY, 2004, 570-573.
[6] He, L., Sanocki, E., Gupta, A., and Grudin, J. Auto-summarization of audio-video presentations. In Proc. of the ACM International Conference on Multimedia (MM ’99) (Orlando, FL, October 30 – November 5, 1999). ACM Press, New York, NY, 1999, 489-498.
[7] Haubold, A., and Kender, J.R. Augmented segmentation and visualization for presentation videos. In Proc. of the ACM International Conference on Multimedia (MM ’05) (Singapore, November 6-11, 2005). ACM Press, New York, NY, 2005,51-60.
[8] Haubold, A., and Kender, J.R. Alignment of Speech to Highly Imperfect Text Transcriptions. To appear in Proc. of the IEEE International Conference on Multimedia & Expo (ICME ’07) (Beijing, China, July 2-5, 2007).
[9] Wang, H.L., and Chang, S.F. A Highly Efficient System for Automatic Face Region Detection in MPEG Video. In IEEE Transactions on Circuits and Systems for Video Technology, Vol. 7, No. 4 (August 1997), 615-628.
[10] Cutler, R., and Davis, L. Look who’s talking: speaker detection using video and audio correlation. In Proc. of the IEEE International Conference on Multimedia & Expo (ICME ’00) (New York, NY, July 30 – August 2, 2000). IEEE Press, New York, NY, 2000,1589-1592.
[11] Ivanov, Y., Stauffer, C., Bobick, A., Grimson, W.E.L. Video Surveillance of Interactions. In Proc. of the IEEE Workshop on Visual Surveillance (VS ’99) (Fort Collins, CO, June 26, 1999). IEEE Press, New York, NY, 1999, 82-89.
[12] Haubold, A., Natsev, A., Naphade, M.R. Semantic Multimedia Retrieval Using Lexical Query Expansion and Model-based Reranking. In Proc. of the IEEE International Conference on Multimedia & Expo (ICME ’06) (Toronto, Canada, July 9-12, 2006). IEEE Press, New York, NY, 2005, 1761-1764.
[13] Haubold, A., and Kender, J.R. Selection and Ranking of Text from Highly Imperfect Transcripts for Retrieval of Video Content. To appear in Proc. of SIGIR 2007 (Amsterdam, The Netherlands, July 23-27, 2007).