Vascular Laboratory Fundamentals - Duke University · Vascular Laboratory Fundamentals Robert...
86
Vascular Laboratory Fundamentals Robert Mitchell MD, RPVI Duke University Medical Center 5/2/08
Transcript of Vascular Laboratory Fundamentals - Duke University · Vascular Laboratory Fundamentals Robert...

Vascular Laboratory Fundamentals
Robert Mitchell MD, RPVIDuke University Medical Center
5/2/08

Goals of Lecture
• Understand basic ultrasound principles• Understand normal and abnormal arterial
hemodynamics and waveforms• Understand the goals of the Carotid
Examination• Understand the various tests for evaluation
of peripheral arterial disease

700 am QUIZ

• a) SMA-post prandial
• b) Celiac Artery• c) SFA• d) ICA
Which healthy artery
exhibits this waveform?

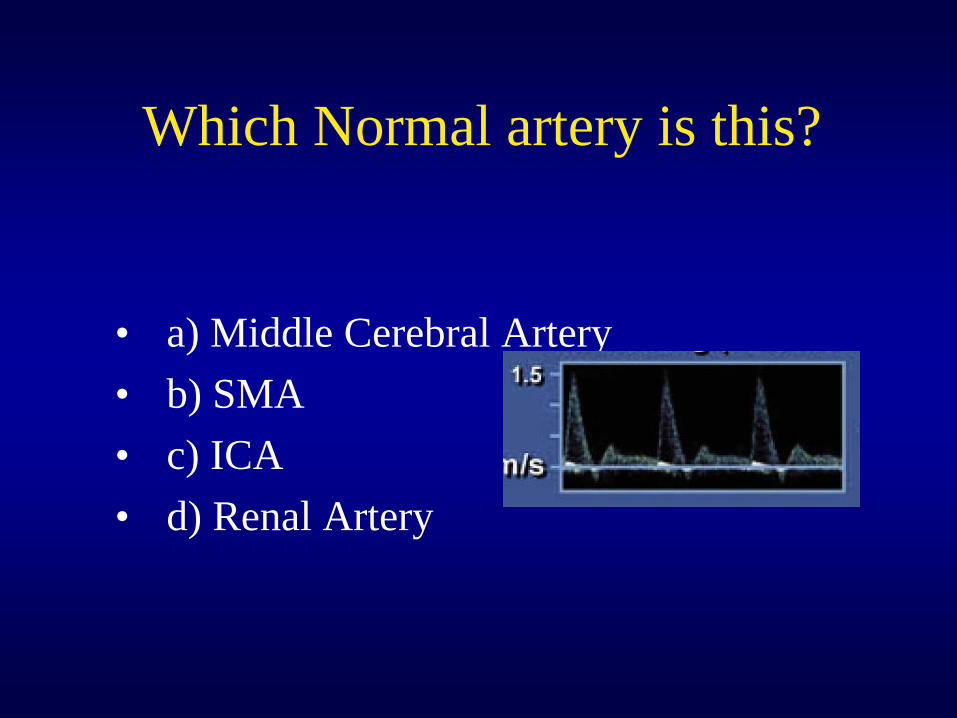
Which Normal artery is this?
• a) Middle Cerebral Artery• b) SMA• c) ICA• d) Renal Artery

What is going on?

ECA or ICA?

What is the diagnosis?
• a) normal CCA• b) ipsilateral ICA occlusion• c) ipsilateral ECA stenosis• contralateral occluded ICA

What can you infer ?
• a) bilateral SFA disease• b) severe Aortic stenosis• c) Aortic aneurysm• d) severe aorto-illiac disease

For a AAA US study, what frequency probe is best suited?
• a)Linear 4 MgHtz• b)Linear 8 MgHtz• c)Curvilinear 8 MgHtz• d)Curvilinear 2 MgHtz

Is the Vertebral artery flowing retrograde or antegrade?

Ultrasound Principles
• Ultrasound transducer generates sound waves in discrete pulses
• Reflected waves are received by the transducer at various times and allow for positioning of the tissue interface
• The strength and timing of the returning waves allow for the formation of a grayscale (B mode) image

Ultrasound frequency and penetration
Low frequency- better tissue penetration but poor resolution
Higher frequency- better tissue resolution but poor penetration

For a AAA US study, what frequency probe is best suited?
• a)Linear 4 MgHtz• b)Linear 8 MgHtz• c)Curvilinear 8 MgHtz• d)Curvilinear 2 MgHtz

Duplex Imaging
• Gray scale image utilized to facilitate placement of Doppler sample volume
• Transducer generally perpendicular to the vessel
• Doppler assessment made with angle between insonation beam and vessel wall adjusted to 45 to 60 degrees

Doppler Shift is Used to Determine Velocity of Blood
• Blood flow is detected by processing echo signals scattered from RBC.
• RBCs are moving: SHIFT HAPPENS• Doppler equation:
f received – f sent = 2fsent v flow cosø/c

Ø: Doppler angle X axis: time in s
Flow direction: above/below baselinerelative to transducer
f shift=velocity
Each pixel corresponds to a specific f shift/velocity at specific time
Pixel’s brightness:number of RBCs causing that f shift

Angle of Insonation

Angle of Insonation
Correct angle and cursor Incorrect angle and cursor
f received – f sent = 2fsent v flow cosø/c

Impact of Insonation Angle on Velocity Assessment
• Strength of signal diminishes at shallow angles
• Error up to 20% occurs with angles greater than 70 degrees
• Angle of 60 degrees is standard and practical

Waveform Analysis
• Turbulence: assessed by spectral broadening and color aliasing/mosaic
• Stenosis: determined by elevated velocities
• Post stenosis: suggested by dampened upstroke and diminished velocities

Doppler Waveform
Low resistance
Acceleration
Flow disturbance

Low Resistance Waveform

High Resistance Waveform

HIGH RESISTANCE
LOW RESISTANCE
Flow reversal:Pressure in peripheral vessels> aortic pressure
Peripheral arteriesECA
ICA,MCA, Celiac ArteryRenals,SMA(post prandial) and diseased vessels

Atherosclerosis leads to PAD

Turbulence and Stenosis

What causes turbulence and spectral broadening?

• a) SMA-post prandial
• b) Celiac Artery• c) SFA• d) ICA
Which healthy artery
exhibits this waveform?
Which Normal artery is this?
• a) Middle Cerebral Artery• b) SMA• c) ICA• d) Renal Artery

Aortic StenosisMain feature is delay in arterial upstroke.
Examine arterial ratios.Peak systolic velocity alone may underestimate stenosis.

High Cardiac Output
High cardiac output Sickle cell anemia
Normal
Peak systolic velocity alone may overestimate stenosis.

Carotid Imaging: Anatomy, Scanning and Use
in Practice

Essential Principles
Details of the wall are best seen with the beam perpendicular to the wall
Insonation angle should be 60 degrees with respect to the wall (flow jet)
Pay attention to the shape of the waveform

Carotid Imaging
• ANATOMY• CRITERIA FOR DETERMINING
STENOSIS• PLAQUE MORPHOLGY• INTIMAL MEDIAL THICKNESS

Carotid Ultrasound Imaging
• Provides detail of the vessels in the neck, and can indicate proximal and distal disease.
• Performed in the setting of bruit, TIA, post procedure and potentially risk assessment.
• Accessible, noninvasive evaluation.

Carotid Exam Performance• Optimize gray scale image• Pay attention to spectral waveform• Use consistent Doppler angle/ 5 MHZ• Use color Doppler as a guide• Compare right and left sides• Institution specific diagnostic criteria• Pay attention to the clinical context

Everything you need to know about carotids in one slide

Anatomy of Carotid Imaging
• Extracranial (cervical) arteries• Common carotid artery• Internal carotid artery• External carotid artery• Vertebral artery• Brachiocephalic/ proximal subclavian artery

Cerebral Circulation
©2004 UpToDate® • www.uptodate.com • Contact UsFigure 1.
Internal Carotid
External Carotid
Vertebral
Common Carotid
Subclavian
(Inominate)
Internal Mammary
Thyrocervical Trunk
Superior ThyroidAscending Pharyngeal

• B-mode image and color Doppler are used to locate arteries and facilitate placement of pulsed Doppler sample volume.
• Severity of disease is determined by spectral analysis of the pulsed Doppler signal.
Components of Carotid Ultrasound Spectral Analysis

Carotid Bifurcation
The bulb extends from the CCA into the ICA.

Carotid Bifurcation

CCA Waveform: Combination of ICA and ECA waveform

Velocity Criteria to Grade ICA Stenosis
Stenosis ICA PSV (cm.sec)
Lumen Narrowing
ICA EDV cm/sec
ICA/CCA PSV
0 <125 - <40 <2
1-49 <125 + <40 <2
50-69 >125 + 40-100 2-4
>70 >230 + >100 >4
Subtotal Occlusion Widely variable ++ Widely variable Widely variable
Total Occlusion 0 - 0 0
Society of Radiologists Consensus Panel 2002
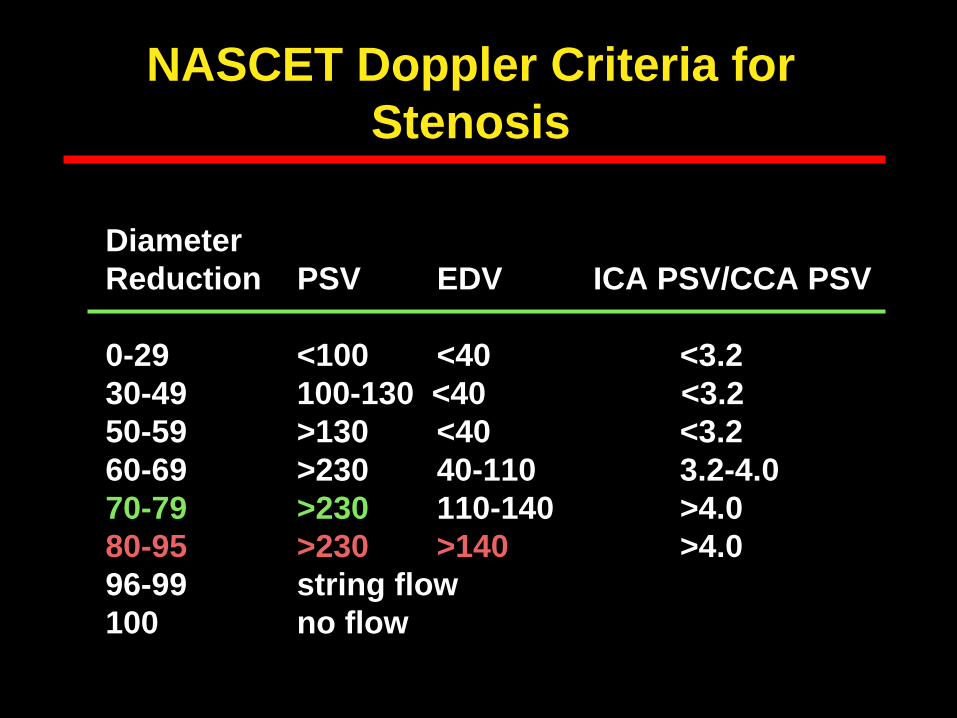
NASCET Doppler Criteria for Stenosis
Diameter Reduction PSV EDV ICA PSV/CCA PSV
0-29 <100 <40 <3.230-49 100-130 <40 <3.250-59 >130 <40 <3.260-69 >230 40-110 3.2-4.070-79 >230 110-140 >4.080-95 >230 >140 >4.096-99 string flow100 no flow

ICA Stenosis

Temporal Tap: Distinguishing ICA and ECA

ECA or ICA?

Calcification:Detection of ICA stenosis

Calcification: Detection of ICA stenosis

Distal ICA Occlusion

What is the diagnosis?
• a) normal CCA• b) ipsilateral ICA occlusion• c) ipsilateral ECA stenosis• contralateral occluded ICA

Proximal ICA Occlusion

Proximal ICA Occlusion
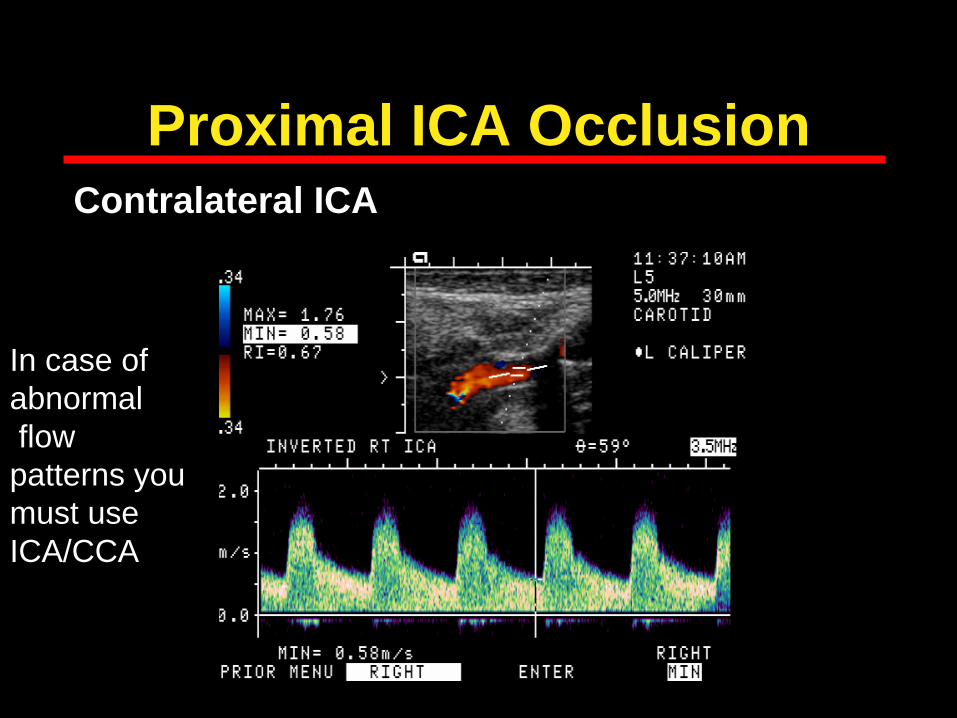
Proximal ICA OcclusionContralateral ICA
In case of abnormalflow patterns you must use ICA/CCA

Subtotal Occlusion

Velocity Criteria to Grade ICA Stenosis
Stenosis ICA PSV (cm.sec)
Lumen Narrowing
ICA EDV cm/sec
ICA/CCA PSV
0 <125 - <40 <2
1-49 <125 + <40 <2
50-69 >125 + 40-100 2-4
>70 >230 + >100 >4
Subtotal Occlusion Widely variable ++ Widely variable Widely variable
Total Occlusion 0 - 0 0

Low Cardiac OutputSharp upstroke, diminished amplitude.Peak systolic velocity alone may underestimate stenosis.

Plaque characteristics on ultrasound
• Echogenicity: Hypoechoic similar to blood, hyperechoic similar to adventitia
• Calcification• Surface characteristics: Smooth,
irregular, ulcerated• Correlations with systemic and
local risk


Irregular Surface

Ulcerated Plaque

Echolucent PlaquePotentially vulnerable plaque

Pitfalls of Carotid Duplex Imaging
• Misidentification of a pulsatile vein for the internal carotid artery
• Tortuous vessels• Near total occlusion• Calcification• Spot Doppler assessment• Misidentification of external carotid artery
with significant lesion as ICA

Vertebral Artery

Vertebral Artery Stenosis

Vertebral Artery Occlusion

VERTEBRAL ARTERYProbe

A
B

Lower Extremity Evaluation
• ABI• SDP’s• Arterial Duplex

Lower Extremity Arterial Anatomy
AortoiliacAortoiliac
FemoroFemoro-- PoplitealPopliteal
InfraInfra--poplitealpopliteal


SDP/PVR to Detect and Localize Disease
• Sensitivity 73%/ Specificity 80% for SFA stenoses
• Sensitivity 85%/ Specificity 53% forSFA plus popliteal stenoses
o Sensitivity 59%/ Specificity 86%for iliac or CFA stenoses
Moneta, J Moneta, J VascVasc SurgSurg, 1993, 1993

Diabetic with Non-Compressible Vessels
Must get TBI

Essential Components of the Study
Doppler signal is essential

Essential Components of the Study
PVR

Interpretation of PVR
Arterial Duplex-Indications
1. Claudication2. Leg pain3. Abnormal Physiologic study4. Ulcers5. Revascularization follow-up
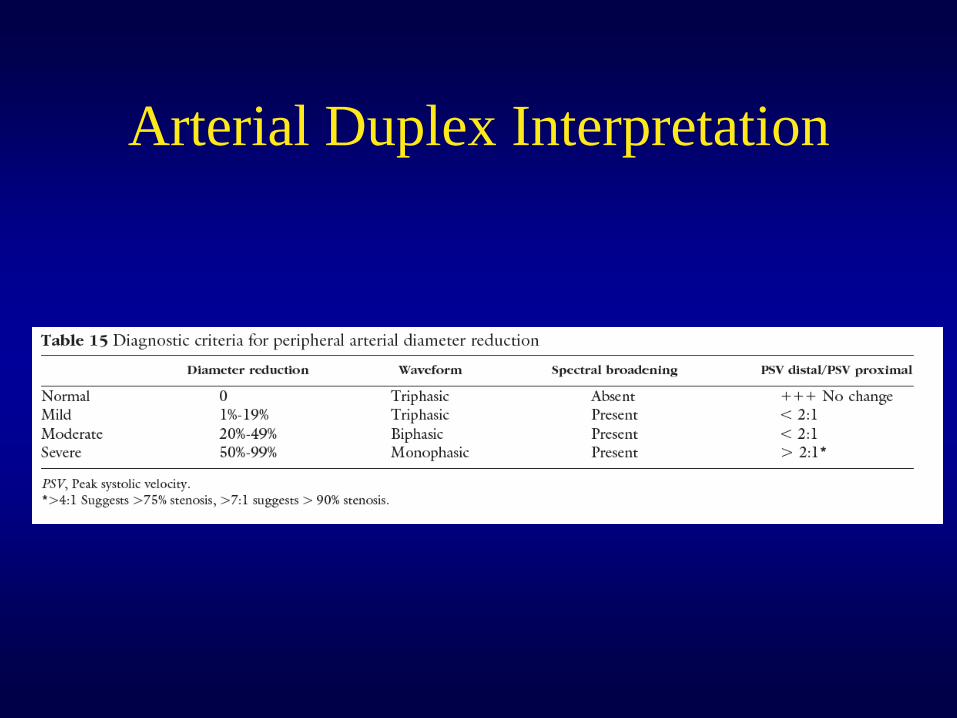
Arterial Duplex Interpretation

1. SFA-normal tri-phasic waveform 2. Turbulent Flow becomes evident at tri-furcation(tibioperoneal trunk)
3. PTA exhibits monophasic waveformstripling of velocities-->75% stenosis
4. Occlusion is confirmed-no flow is evident in the PTA
Lower Extremity Arterial Duplex

C
What are we looking at? What causes this type of wave form?

LONGITUDINAL TRANSVERSE
PSEUDOANEURYSM NECK
A B
C
Common Femoral Artery Pseudoaneurysm - F Type

The End
Remember, think like a physiologist and you will rarely be wrong