Various groups have prepared reports of icing events, and each has ...
47
AN UPDATED EXAMINATION OF AVIATION ACCIDENTS ASSOCIATED WITH TURBULENCE, WIND SHEAR AND THUNDERSTORM Prepared by Joni K. Evans Analytical Mechanics Associates, Inc. Hampton, VA December 1, 2014 AMA Report Number 14-14 (please contact Contracts: [email protected]) NASA Prime Contract No. BPA #NNL12AA09C Task Order 12.002.14.00.E403.B https://ntrs.nasa.gov/search.jsp?R=20160005906 2018-02-11T21:57:06+00:00Z
Transcript of Various groups have prepared reports of icing events, and each has ...

AN UPDATED EXAMINATION OF
AVIATION ACCIDENTS ASSOCIATED WITH
TURBULENCE, WIND SHEAR AND
THUNDERSTORM
Prepared by
Joni K. Evans
Analytical Mechanics Associates, Inc.
Hampton, VA
December 1, 2014
AMA Report Number 14-14 (please contact Contracts: [email protected])
NASA Prime Contract No. BPA #NNL12AA09C
Task Order 12.002.14.00.E403.B
https://ntrs.nasa.gov/search.jsp?R=20160005906 2018-02-11T21:57:06+00:00Z

2
Introduction
One of the technical challenges within the Atmospheric Environment Safety Technologies
(AEST) Project of the Aviation Safety Program was to “improve and expand remote sensing and
mitigation of hazardous atmospheric environments and phenomena”1. In 2012, the author
performed an analysis comparing various characteristics of accidents associated with different
types of atmospheric hazard environments2. This document reports an update to that analysis
which was done in preparation for presenting these findings at the 2015 annual meeting of the
Transportation Research Board. Specifically, an additional three years of data were available,
and a time-trend analysis was added.
This update maintains the taxonomy of atmospheric hazards that was developed for the original
study, with the following categories:
1. Wake Turbulence (WAKE): Wake turbulence is a by-product of lift and is present behind
every aircraft in flight. Once the aircraft is airborne, two counter rotating cylindrical vortices
are created, which are hazardous to any trailing aircraft. This is particularly true during take-
off, initial climb, final approach and landing, when the high angle of attack at which the
aircraft operates maximizes the formation of strong vortices.
2. Mountain wave turbulence (MTN): Mountain wave turbulence occurs when air flows are
forced to rise up the windward side of a mountain barrier, then as a result of certain
atmospheric conditions, sink down the leeward side. This perturbation develops into a series
of waves which may extend for hundreds of miles.
3. Clear air turbulence (CAT): Clear air turbulence typically occurs in cloud-free regions at
higher altitude, widely separated from mountains, and often is associated with wind shear,
particularly between the core of a jet stream and the surrounding air.
4. Cloud Turbulence (CLD): This turbulence phenomenon occurs in cloud covered regions
without the requirements of convection or precipitation reaching the ground.
5. Convective turbulence (CONV): An air mass which absorbs heat from the earth’s surface
will rise. As the air rises, it cools, and eventually the cooler air mass descends. This cycle of
rising and falling air is known as convection. Convective turbulence occurs within, or in
close proximity to, convective storms, particularly thunderstorms, which result in strong
updrafts and downdrafts.
6. Thunderstorm, with no turbulence (TRW): This hazard category is restricted to
thunderstorms, with or without microbursts or wind shear, but with no mention of turbulence.
1 Atmospheric Environment Safety Technologies (AEST) Project Plan. October 1, 2010 (Updated on October 21,
2011) 2 An Examination of Aviation Accidents Associated with Turbulence, Wind Shear and Thunderstorm. NASA CR-
2013-217989; May 2013.

3
7. Low Altitude Wind Shear, Microburst or Turbulence (LWT): This category consists of wind
shear, microbursts or turbulence occurring at low altitude, with no mention of thunderstorms.
This report examines the historical aviation accidents from 1987-2011, using the National
Transportation Safety Board (NTSB) Aviation Accident and Incident Data System. All US-based
accidents with a cause or factor of turbulence, thunderstorm, wind shear or microburst were
assigned to only one of the seven categories defined above, and this report summarizes the
differences between the categories in terms of factors such as flight operations category, aircraft
engine type, the accident’s geographic location and time of year, degree of injury to aircraft
occupants, aircraft damage, age and certification of the pilot and the phase of flight at the time
the flight encountered severe weather. All percentages shown in tables or charts are based on the
totals for the particular category listed above. Sixteen accidents for which the accident report did
not provide sufficient detail to classify the type of turbulence with confidence were eliminated
from the analysis.
Methods
The National Transportation Safety Board is an independent Federal agency that investigates
every civil aviation accident in the United States and significant accidents in the other modes of
transportation, conducts special investigations and safety studies, and issues safety
recommendations to prevent future accidents. The information the NTSB investigators collect
during their investigations of these aviation events resides in the NTSB Aviation Accident and
Incident Data System. A copy of this database in Microsoft Access format was obtained from the
Aviation Safety Information Analysis and Sharing (ASIAS) department of the FAA’s Office of
Aviation Safety3 in September 2014. At that point in time, the NTSB investigation was not
complete for a substantial number of 2013 accidents, particularly those which occurred toward
the end of the year. For this reason, all work on the database was restricted to 1987-2012, which
was primarily an update of two years beyond the previous working version of the data. In
addition, many of the 2012 accidents affected by turbulence and other types of weather did not
have final reports, so this update was restricted to 1987-2011.
The NTSB database includes events involving a wide variety of aircraft (airplanes, helicopters,
hot air balloons, gliders, ultralight, etc.) with operations conducted under various Federal
Aviation Regulations (Part 91: General Aviation, Part 121: Commercial Air Carriers, Part 129:
Foreign Air Carriers, Part 135: Commuters and On-Demand Air Taxis, Part 137: Agricultural
Operations, etc.).
3 http://www.asias.faa.gov/portal/page/portal/asias_pages/asias_home/

4
The NTSB considers each event to be either an accident or an incident, under the following
definitions:4
Accident - an occurrence associated with the operation of an aircraft, which takes place
between the time any person boards the aircraft with the intention of flight and all
such persons have disembarked, and in which any person suffers death or serious
injury, or in which the aircraft receives substantial damage
Incident - an occurrence other than an accident, associated with the operation of an aircraft,
which affects or could affect the safety of operations
Any injury or aircraft damage which occurs when there was no intent for flight (high speed taxi
tests, movement of the aircraft around the airfield, maintenance run-ups, etc) is, by definition, an
incident.
All recorded accidents involving commercially built fixed-wing airplanes operating under FAR
Part 121, Part 135 or Part 91 were included in these working datasets, regardless of whether the
investigation is in a preliminary stage or finalized, and whether or not the event occurred within
the United States. Amateur built or experimental aircraft were excluded, as were helicopters,
ultra light aircraft, gliders and balloons.
For every accident, the NTSB records a series of occurrence codes (e.g., In Flight Encounter
with Weather, Loss of Control – In Flight, Hard Landing, etc.) and the associated phase of flight.
They also record causes, factors and findings associated with each occurrence. Causes are
actions or events that lead directly to the accident, while factors are actions or events that
contributed to the accident. Each accident can have multiple causes and multiple factors5.
Findings are actions or events that occurred in conjunction with the accident, but no
determination was made that they contributed to the accident. For example, the aircraft might
have flown in the area of a thunderstorm with lightning, but the lightning had no impact on the
flight or the accident, so lightning is recorded as a finding. Similarly, the pre-flight weather
briefing might have included turbulence, icing and low ceiling, but if there was no indication that
the flight actually encountered turbulence, it would be considered only a finding.
Accidents were selected for inclusion in this study if turbulence, thunderstorm, wind shear or
microburst was considered either a cause or a factor (but not a finding) in the accident report.
The main interest in this analysis with regards to thunderstorms is the effect of turbulence and
other types of wind. Eight accidents in which the primary occurrence was a lightning strike or
hail damage were excluded, despite the obvious connection to thunderstorm activity. These
would be considered part of a separate category, based on the taxonomy described above.
Similarly, accidents resulting from jet blast and propeller/rotor wash have been excluded, despite
being included in the definition for wake turbulence from the Aeronautical Information Manual
(AIM)6: "A phenomena resulting from the passage of an aircraft through the atmosphere. The
term includes vortices, thrust stream turbulence, jet blast, jet wash, propeller wash, and rotor
4 National Transportation Safety Board, “Government Information Locator Service (GILS): Aviation Accident
Synopses”’ http://ntsb.gov/Info/gils/gilssyn.htm 5 https://asafe.larc.nasa.gov/DOC/definitions.html 6 http://www.faa.gov/air_traffic/publications/ATpubs/AIM/aim.pdf; page PCG-W1.

5
wash both on the ground and in the air." This study is interested in the more focused definition of
“off the ground” wake turbulence that was provided in the introduction.
In order to describe the types of aircraft which were involved in these accidents, the specific
aircraft make and model (and in many cases, aircraft series) was determined for each accident.
For the vast majority of events, this information could be easily found in the data record. For
some events it was necessary to consult the FAA’s aircraft registry database, and to assume that
the correct aircraft registration number was recorded in the data system. All aircraft in the data
system for the chosen time period (1987-2011) were divided into groups based on some
combination of engine type, aircraft use, aircraft size and aircraft complexity. The aircraft
categories are as follows, and a list of the particular aircraft models (sometimes including series
information) within each category can be found in Appendix A.
Wide Body Jet Airliners
Narrow Body Jet Airliners
Regional Jets
Medium Sized Business Jets
Small Business Jets (maximum takeoff weight <= 12,500 lbs)
Large Turbo-props (maximum takeoff weight >= 32,000 lbs and more than 30 seats)
Medium Turbo-props (12,500< maximum takeoff weight <32,000 lbs or 15-30 seats)
Small Turbo-props (maximum takeoff weight <12,500 lbs and less than 15 seats)
Heavier multiple reciprocating engines (maximum takeoff weight >15,000 lbs)
Lighter multiple reciprocating engines (maximum takeoff weight < 15,000 lbs)
Single reciprocating engine, retractable landing gear
Single reciprocating engine, fixed landing gear
Light Sport Aircraft (Rotax Engines)

6
Results and Discussion
Nine hundred ninety accidents were considered in this analysis; these were all affected by some
sort of turbulence, thunderstorm, wind shear or microburst, or a combination thereof. In this
report, these weather conditions will be referred to collectively as “Atmospheric Hazards.” Each
accident was assigned to only one hazard category. Figure 1 shows the distribution of these
hazards. Seventy of these flights (7.1%) encountered wake turbulence, eighty-one (8.2%) were
affected by mountain wave turbulence, one hundred twenty-eight (12.9%) encountered clear air
turbulence, one hundred (10.1%) were classified as turbulence in clouds, one hundred eighty-six
(18.8%) were affected by convective turbulence, one hundred eighty-five (18.7%) encountered
thunderstorms with no mention of turbulence, and two hundred forty (24.2%) were affected by
low altitude wind shear, turbulence or microburst with no mention of thunderstorm.
Figure 1. Distribution of Atmospheric Hazard Categories.
Flight Operations Category
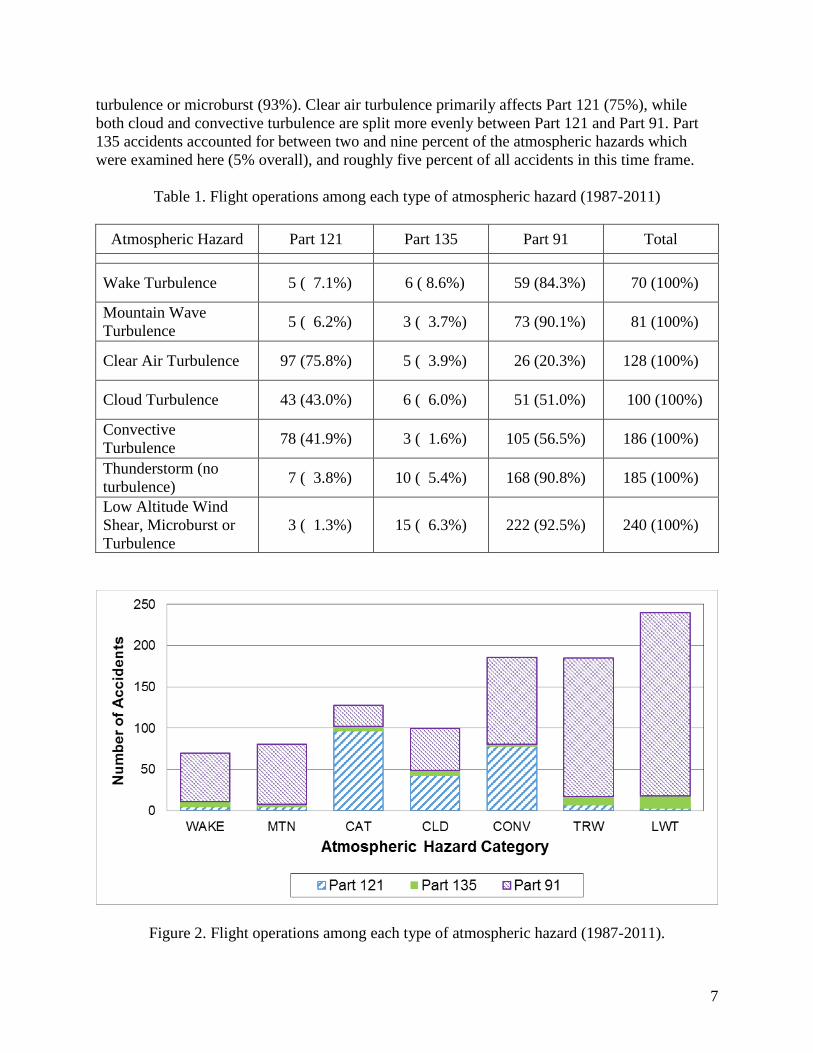
Table 1 and Figure 2 show how these events were distributed among flight operations. Although
wake turbulence is caused primarily by large jets7, its effects are felt most among Part 91 flights
(84%). Similarly, Part 91 flights account for nearly all accidents attributed to mountain wave
turbulence (90%), thunderstorms with no turbulence (91%) and low altitude wind shear,
7 Nelson, R.C., “The Trailing Vortex Wake Hazard: Beyond the Takeoff and Landing Corridors.” American Institute
of Aeronautics and Astronautics. 2004-5171.
7
turbulence or microburst (93%). Clear air turbulence primarily affects Part 121 (75%), while
both cloud and convective turbulence are split more evenly between Part 121 and Part 91. Part
135 accidents accounted for between two and nine percent of the atmospheric hazards which
were examined here (5% overall), and roughly five percent of all accidents in this time frame.
Table 1. Flight operations among each type of atmospheric hazard (1987-2011)
Atmospheric Hazard Part 121 Part 135 Part 91 Total
Wake Turbulence 5 ( 7.1%) 6 ( 8.6%) 59 (84.3%) 70 (100%)
Mountain Wave
Turbulence 5 ( 6.2%) 3 ( 3.7%) 73 (90.1%) 81 (100%)
Clear Air Turbulence 97 (75.8%) 5 ( 3.9%) 26 (20.3%) 128 (100%)
Cloud Turbulence 43 (43.0%) 6 ( 6.0%) 51 (51.0%) 100 (100%)
Convective
Turbulence 78 (41.9%) 3 ( 1.6%) 105 (56.5%) 186 (100%)
Thunderstorm (no
turbulence) 7 ( 3.8%) 10 ( 5.4%) 168 (90.8%) 185 (100%)
Low Altitude Wind
Shear, Microburst or
Turbulence
3 ( 1.3%) 15 ( 6.3%) 222 (92.5%) 240 (100%)
Figure 2. Flight operations among each type of atmospheric hazard (1987-2011).

8
Yearly Trends
Figures 3 and 4 show the trend in the number of accidents affected by each these atmospheric
hazards across time. In order to adjust the annual counts for the change in flight hours from year
to year, a weighting factor was created by dividing the average total flight hours (see Appendix
B) by the total flight hours for each year. That weighting factor was then multiplied by the
number of accidents in that year to create an adjusted count. These are denoted in Figures 3 and
4 by circles of different colors. Due to the often large variation in the number of accidents from
one year to the next, a three-year moving average was calculated, and these numbers are
represented by the solid line. A simple linear regression was also fit to the adjusted counts in
order to assess whether each type of hazard is increasing/decreasing or stable.
The number of accidents affected by wake turbulence (p=0.0015), thunderstorm (p=0.003) and
low altitude wind shear, microburst or turbulence (p=0.005) has, in general, decreased over these
25 years, while the number of mountain wave accidents has been stable.
Figure 3. Adjusted number of specific atmospheric hazard accidents by year (1987-2011).
9
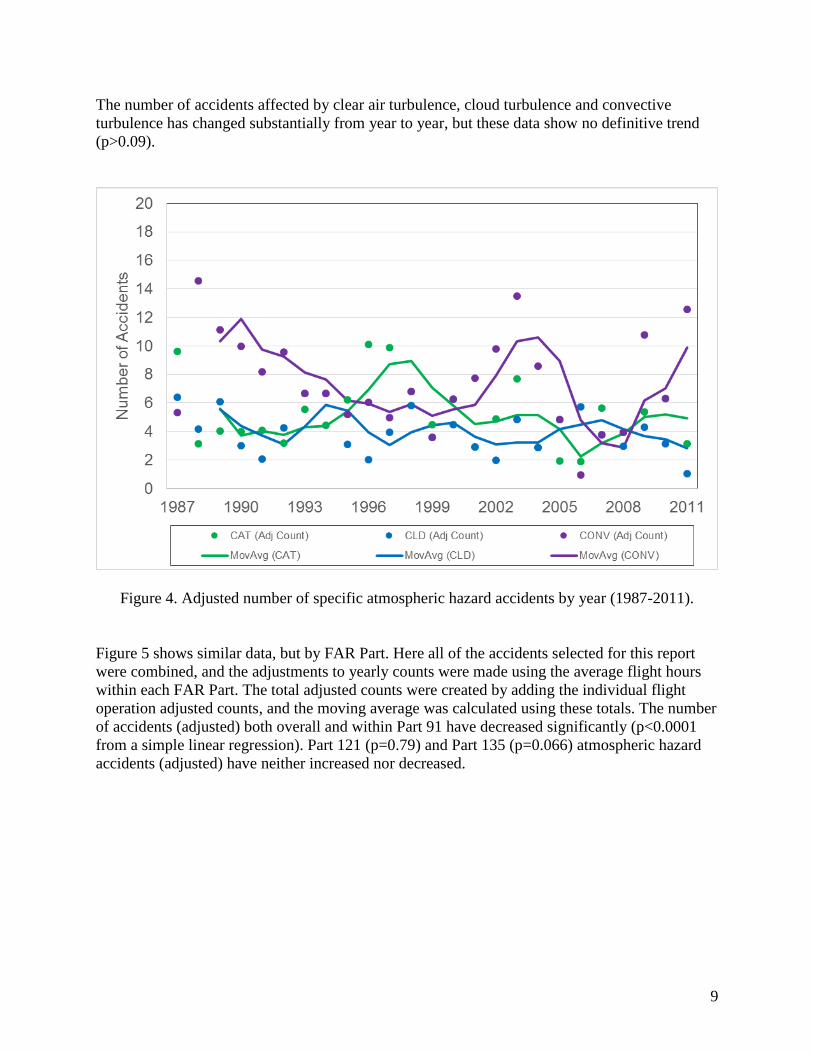
The number of accidents affected by clear air turbulence, cloud turbulence and convective
turbulence has changed substantially from year to year, but these data show no definitive trend
(p>0.09).
Figure 4. Adjusted number of specific atmospheric hazard accidents by year (1987-2011).
Figure 5 shows similar data, but by FAR Part. Here all of the accidents selected for this report
were combined, and the adjustments to yearly counts were made using the average flight hours
within each FAR Part. The total adjusted counts were created by adding the individual flight
operation adjusted counts, and the moving average was calculated using these totals. The number
of accidents (adjusted) both overall and within Part 91 have decreased significantly (p<0.0001
from a simple linear regression). Part 121 (p=0.79) and Part 135 (p=0.066) atmospheric hazard
accidents (adjusted) have neither increased nor decreased.

10
Figure 5. Adjusted number of all atmospheric hazard accidents by year and FAR Part (1987-
2011).

11
Time of Year
Figure 6 shows the monthly trend for each type of atmospheric hazard. Thunderstorms and
convective turbulence follow the same general pattern, peaking in July. Turbulence in clouds
shows a lack of pattern, with peaks in April, July and September. Mountain wave turbulence
peaks in December, January, and May. Wake turbulence has a substantial peak in September and
a big dip in April. Clear air turbulence peaks in April, and is lowest in August. Low altitude wind
shear, microburst and turbulence tends to follow a similar pattern to thunderstorm, but the
difference between the low months (December and January) and high months (May and July) is
not as great.
Figure 6. Month of Accident among each type of atmospheric hazard (1987-2011).
12
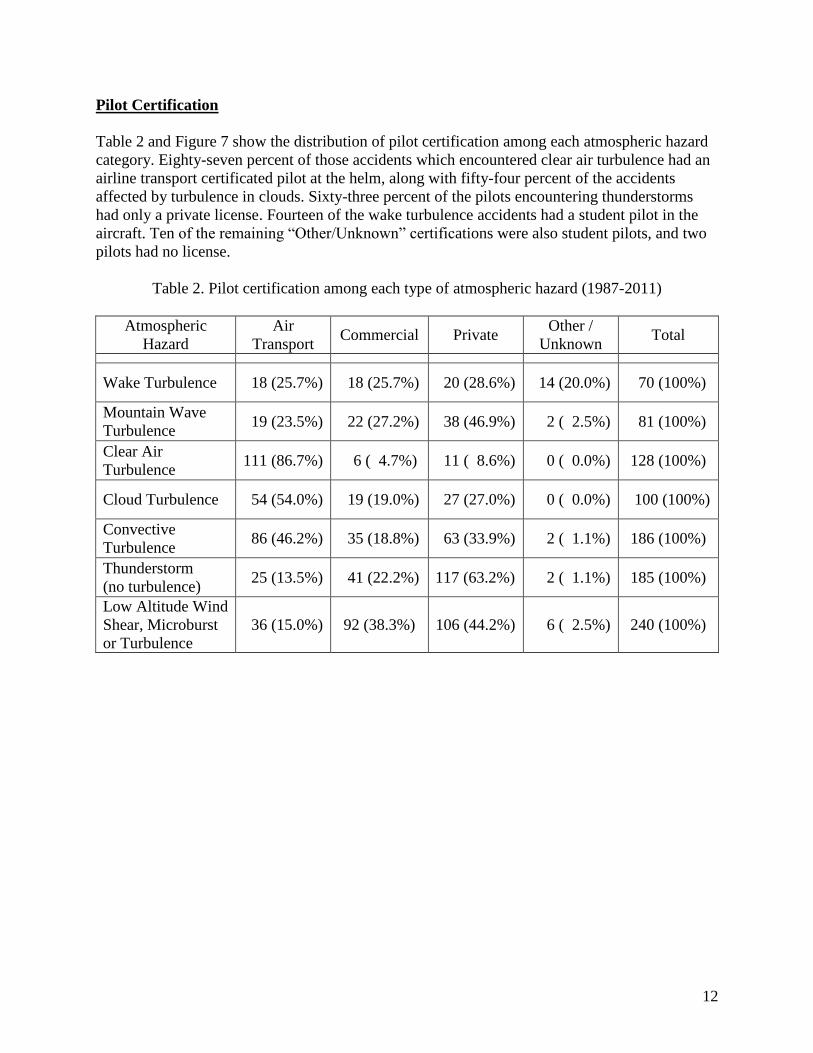
Pilot Certification
Table 2 and Figure 7 show the distribution of pilot certification among each atmospheric hazard
category. Eighty-seven percent of those accidents which encountered clear air turbulence had an
airline transport certificated pilot at the helm, along with fifty-four percent of the accidents
affected by turbulence in clouds. Sixty-three percent of the pilots encountering thunderstorms
had only a private license. Fourteen of the wake turbulence accidents had a student pilot in the
aircraft. Ten of the remaining “Other/Unknown” certifications were also student pilots, and two
pilots had no license.
Table 2. Pilot certification among each type of atmospheric hazard (1987-2011)
Atmospheric
Hazard
Air
Transport Commercial Private
Other /
Unknown Total
Wake Turbulence 18 (25.7%) 18 (25.7%) 20 (28.6%) 14 (20.0%) 70 (100%)
Mountain Wave
Turbulence 19 (23.5%) 22 (27.2%) 38 (46.9%) 2 ( 2.5%) 81 (100%)
Clear Air
Turbulence 111 (86.7%) 6 ( 4.7%) 11 ( 8.6%) 0 ( 0.0%) 128 (100%)
Cloud Turbulence 54 (54.0%) 19 (19.0%) 27 (27.0%) 0 ( 0.0%) 100 (100%)
Convective
Turbulence 86 (46.2%) 35 (18.8%) 63 (33.9%) 2 ( 1.1%) 186 (100%)
Thunderstorm
(no turbulence) 25 (13.5%) 41 (22.2%) 117 (63.2%) 2 ( 1.1%) 185 (100%)
Low Altitude Wind
Shear, Microburst
or Turbulence
36 (15.0%) 92 (38.3%) 106 (44.2%) 6 ( 2.5%) 240 (100%)

13
Figure 7. Pilot Certification among each type of atmospheric hazard (1987-2011).

14
Pilot Age
Figure 8 shows the percentage of accidents in each hazard category for ten groupings of pilot
age. Not surprisingly, most of the pilots in accidents encountering clear air turbulence,
turbulence in clouds and convective turbulence tend to be between forty-five and sixty years.
According to the FAA, most active pilots are between the ages of 40 and 60. For every weather
category except thunderstorm and low altitude wind shear, microburst or turbulence, the top
three age groups were somewhere between forty and sixty years. However, fifteen percent of the
accidents encountering thunderstorms were piloted by someone aged sixty-five or older; this was
the largest percentage associated with any age grouping for that hazard. The age distribution
among low altitude wind shear, microburst or turbulence was nearly uniform (with every age
grouping representing 7-12%).
Figure 8. Pilot Age among each type of atmospheric hazard (1987-2011).
15
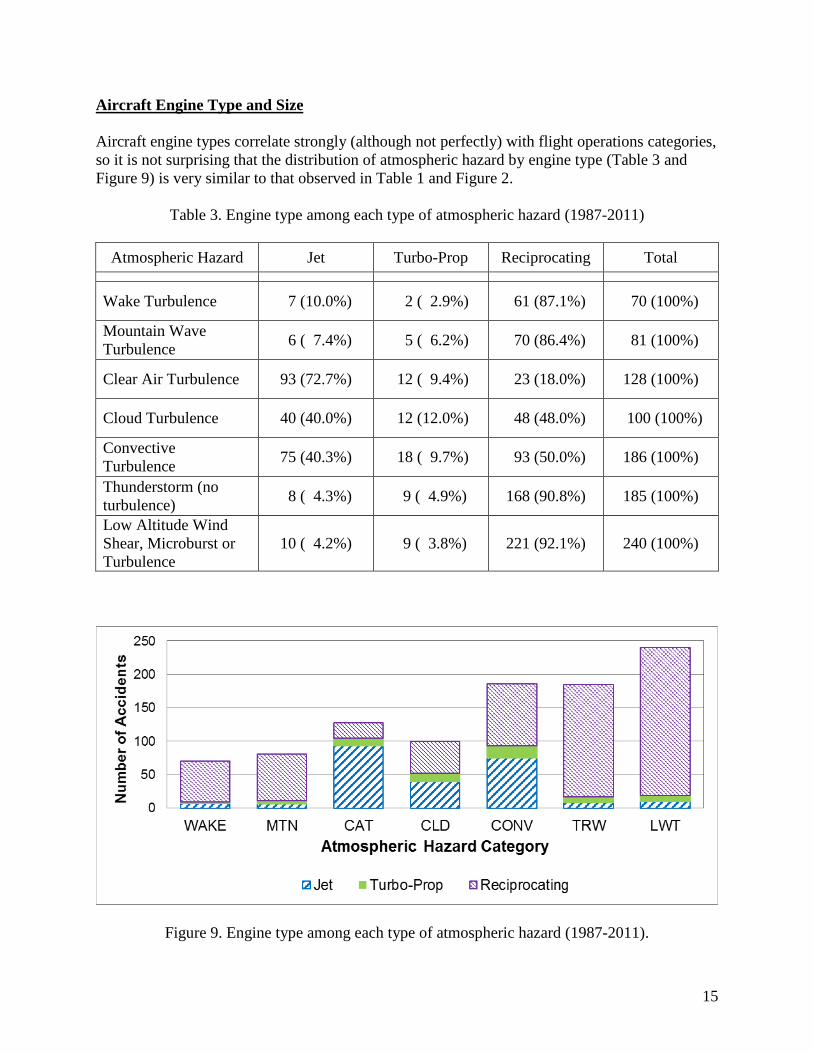
Aircraft Engine Type and Size
Aircraft engine types correlate strongly (although not perfectly) with flight operations categories,
so it is not surprising that the distribution of atmospheric hazard by engine type (Table 3 and
Figure 9) is very similar to that observed in Table 1 and Figure 2.
Table 3. Engine type among each type of atmospheric hazard (1987-2011)
Atmospheric Hazard Jet Turbo-Prop Reciprocating Total
Wake Turbulence 7 (10.0%) 2 ( 2.9%) 61 (87.1%) 70 (100%)
Mountain Wave
Turbulence 6 ( 7.4%) 5 ( 6.2%) 70 (86.4%) 81 (100%)
Clear Air Turbulence 93 (72.7%) 12 ( 9.4%) 23 (18.0%) 128 (100%)
Cloud Turbulence 40 (40.0%) 12 (12.0%) 48 (48.0%) 100 (100%)
Convective
Turbulence 75 (40.3%) 18 ( 9.7%) 93 (50.0%) 186 (100%)
Thunderstorm (no
turbulence) 8 ( 4.3%) 9 ( 4.9%) 168 (90.8%) 185 (100%)
Low Altitude Wind
Shear, Microburst or
Turbulence
10 ( 4.2%) 9 ( 3.8%) 221 (92.1%) 240 (100%)
Figure 9. Engine type among each type of atmospheric hazard (1987-2011).

16
Among jet aircraft (Table 4), eighty percent of the low altitude events involved business jets. In
all other categories of atmospheric hazard accidents, between fifty-three and sixty-eight percent
of the jet aircraft were narrow-body jets.
Table 4. Aircraft Size (jet engines) among each type of atmospheric hazard (1987-2011)
Atmospheric
Hazard Wide-Body Narrow-Body Regional Business Total
Wake Turbulence 0 ( 0.0%) 4 (57.1%) 0 ( 0.0%) 3 (42.9%) 7 (100%)
Mountain Wave
Turbulence 0 ( 0.0%) 4 (67.7%) 0 ( 0.0%) 2 (33.3%) 6 (100%)
Clear Air
Turbulence 31 (33.3%) 50 (53.8%) 9 ( 9.7%) 3 ( 3.2%) 93 (100%)
Cloud Turbulence 9 (22.5%) 25 (62.5%) 4 (10.0%) 2 ( 5.0%) 40 (100%)
Convective
Turbulence 17 (22.7%) 48 (64.0%) 7 ( 9.3%) 3 ( 4.0%) 75 (100%)
Thunderstorm (no
turbulence) 2 (25.0%) 5 (62.5%) 0 ( 0.0%) 1 (12.5%) 8 (100%)
Low Altitude
Wind Shear,
Microburst or
Turbulence
0 ( 0.0%) 2 (20.0%) 0 ( 0.0%) 8 (80.0%) 10 (100%)
Among turbo-props (Table 5), fifty percent of the CAT accidents were in large aircraft
(maximum takeoff weight >= 32,000 lbs and more than 30 seats). For every other category of
atmospheric hazard, at least half of the turbo-prop accidents involved small aircraft (maximum
takeoff weight <12,500 lbs and less than 15 seats).
Single-engine, retractable gear aircraft comprise the largest percentage (43%-46%) of piston-
engine aircraft in clear air, cloud and convective turbulence (Table 6). In all other categories, the
largest group was single-engine fixed gear aircraft.

17
Table 5. Aircraft Size (turbo-prop engines) among each type of atmospheric hazard
(1987-2011)
Atmospheric Hazard Large Medium Small Total
Wake Turbulence 1 (50.0%) 0 ( 0.0%) 1 (50.0%) 2 (100%)
Mountain Wave
Turbulence 1 (20.0%) 1 (20.0%) 3 (60.0%) 5 (100%)
Clear Air Turbulence 6 (50.0%) 3 ( 25.0%) 3 (25.0%) 12 (100%)
Cloud Turbulence 5 (41.7%) 0 ( 0.0%) 7 (58.3%) 12 (100%)
Convective
Turbulence 4 (22.2%) 5 (27.8%) 9 (50.0%) 18 (100%)
Thunderstorm (no
turbulence) 0 ( 0.0%) 2 (22.2%) 7 (77.8%) 9 (100%)
Low Altitude Wind
Shear, Microburst or
Turbulence
0 ( 0.0%) 3 (33.3%) 6 (66.7%) 9 (100%)
Table 6. Aircraft Size (reciprocating engines) among each type of atmospheric hazard
(1987-2011)
Atmospheric Hazard Single Engine,
Fixed Gear
Single Engine,
Retractable
Gear
Multiple
Engine Total
Wake Turbulence 44 (72.1%) 7 (11.5%) 10 (16.4%) 61 (100%)
Mountain Wave
Turbulence 34 (48.6%) 25 (35.7%) 11 (15.7%) 70 (100%)
Clear Air Turbulence 9 (39.1%) 10 (43.5%) 4 (17.4%) 23 (100%)
Cloud Turbulence 15 (31.3%) 22 (45.8%) 11 (22.9%) 48 (100%)
Convective
Turbulence 33 (35.5%) 42 (45.2%) 18 (19.4%) 93 (100%)
Thunderstorm (no
turbulence) 70 (41.7%) 55 (32.7%) 43 (25.6%) 168 (100%)
Low Altitude Wind
Shear, Microburst or
Turbulence
147 (66.5%) 56 (25.3%) 18 ( 8.1%) 221 (100%)

18
Figure 10 shows the distribution of all engine-size combinations for each type of atmospheric
hazard.
Figure 10. Aircraft engine/size grouping for each type of atmospheric hazard (1987-2011).

19
Phase of Flight
Figure 11 shows the phase of flight at the time the aircraft encountered each type of atmospheric
hazard. All types except wake turbulence and low altitude wind shear, turbulence or microburst
are most likely to occur during cruise flight. Wake turbulence is most likely during approach or
landing, and by definition, low altitude wind shear, turbulence or microburst is most likely
during approach, landing or takeoff.
Figure 11. Phase of flight at time of each type of atmospheric hazard (1987-2011).
20
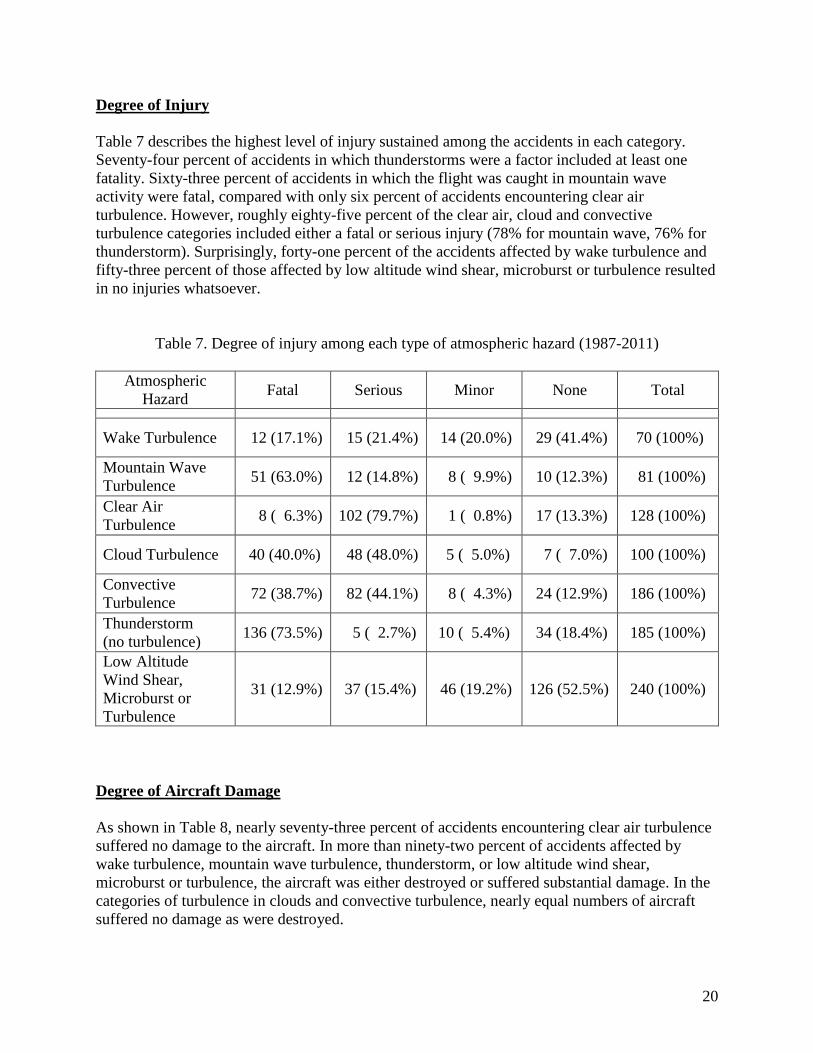
Degree of Injury
Table 7 describes the highest level of injury sustained among the accidents in each category.
Seventy-four percent of accidents in which thunderstorms were a factor included at least one
fatality. Sixty-three percent of accidents in which the flight was caught in mountain wave
activity were fatal, compared with only six percent of accidents encountering clear air
turbulence. However, roughly eighty-five percent of the clear air, cloud and convective
turbulence categories included either a fatal or serious injury (78% for mountain wave, 76% for
thunderstorm). Surprisingly, forty-one percent of the accidents affected by wake turbulence and
fifty-three percent of those affected by low altitude wind shear, microburst or turbulence resulted
in no injuries whatsoever.
Table 7. Degree of injury among each type of atmospheric hazard (1987-2011)
Atmospheric
Hazard Fatal Serious Minor None Total
Wake Turbulence 12 (17.1%) 15 (21.4%) 14 (20.0%) 29 (41.4%) 70 (100%)
Mountain Wave
Turbulence 51 (63.0%) 12 (14.8%) 8 ( 9.9%) 10 (12.3%) 81 (100%)
Clear Air
Turbulence 8 ( 6.3%) 102 (79.7%) 1 ( 0.8%) 17 (13.3%) 128 (100%)
Cloud Turbulence 40 (40.0%) 48 (48.0%) 5 ( 5.0%) 7 ( 7.0%) 100 (100%)
Convective
Turbulence 72 (38.7%) 82 (44.1%) 8 ( 4.3%) 24 (12.9%) 186 (100%)
Thunderstorm
(no turbulence) 136 (73.5%) 5 ( 2.7%) 10 ( 5.4%) 34 (18.4%) 185 (100%)
Low Altitude
Wind Shear,
Microburst or
Turbulence
31 (12.9%) 37 (15.4%) 46 (19.2%) 126 (52.5%) 240 (100%)
Degree of Aircraft Damage
As shown in Table 8, nearly seventy-three percent of accidents encountering clear air turbulence
suffered no damage to the aircraft. In more than ninety-two percent of accidents affected by
wake turbulence, mountain wave turbulence, thunderstorm, or low altitude wind shear,
microburst or turbulence, the aircraft was either destroyed or suffered substantial damage. In the
categories of turbulence in clouds and convective turbulence, nearly equal numbers of aircraft
suffered no damage as were destroyed.

21
Table 8. Aircraft damage among each type of atmospheric hazard (1987-2011)
Atmospheric
Hazard Destroyed
Substantial
Damage
Minor
Damage No Damage Total
Wake Turbulence 20 (28.6%) 46 (65.7%) 1 ( 1.4%) 3 ( 4.3%) 70 (100%)
Mountain Wave
Turbulence 51 (63.0%) 24 (29.6%) 0 ( 0.0%) 6 ( 7.4%) 81 (100%)
Clear Air
Turbulence 8 ( 6.3%) 18 (14.1%) 9 ( 7.0%) 93 (72.7%) 128 (100%)
Cloud Turbulence 39 (39.0%) 15 (15.0%) 1 ( 1.0%) 45 (45.0%) 100 (100%)
Convective
Turbulence 70 (37.6%) 38 (20.4%) 7 ( 3.8%) 71 (38.2%) 186 (100%)
Thunderstorm
(no turbulence) 124 (67.0%) 60 (32.4%) 0 ( 0.0%) 1 ( 0.5%) 185 (100%)
Low Altitude
Wind Shear,
Microburst or
Turbulence
45 (18.8%) 195 (81.3%) 0 ( 0.0%) 0 ( 0.0%) 240 (100%)
Geographic Location
In order to examine the areas of the country more prone to specific types of atmospheric hazards,
the author created regions based on the location of the aircraft at the time of the accident. These
regions were defined as follows:
Northeast: Maine, New Hampshire, Vermont, Massachusetts, Rhode Island, Connecticut,
New York, New Jersey, Pennsylvania, Delaware, Maryland and the District of Columbia
Southeast: North Carolina, South Carolina, Georgia, Florida, Alabama, Mississippi,
Louisiana, Tennessee, Kentucky, Virginia and West Virginia
Great Lakes: Ohio, Indiana, Illinois, Michigan, Wisconsin and Minnesota
Plains: Iowa, Missouri, Arkansas, Oklahoma, Kansas, Nebraska, South Dakota and North
Dakota
Northwest: Montana, Wyoming, Idaho, Oregon and Washington
Southwest: California, Utah, Nevada, Arizona, Colorado, New Mexico and Texas
Alaska: Alaska
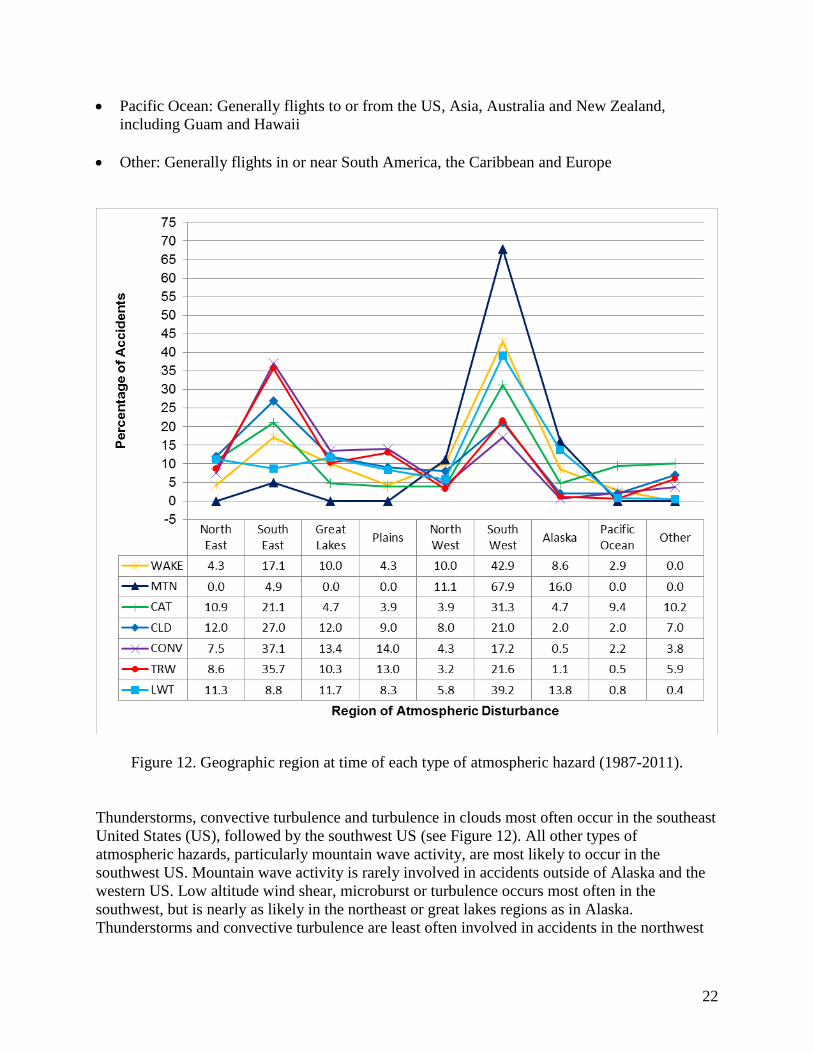
22
Pacific Ocean: Generally flights to or from the US, Asia, Australia and New Zealand,
including Guam and Hawaii
Other: Generally flights in or near South America, the Caribbean and Europe
Figure 12. Geographic region at time of each type of atmospheric hazard (1987-2011).
Thunderstorms, convective turbulence and turbulence in clouds most often occur in the southeast
United States (US), followed by the southwest US (see Figure 12). All other types of
atmospheric hazards, particularly mountain wave activity, are most likely to occur in the
southwest US. Mountain wave activity is rarely involved in accidents outside of Alaska and the
western US. Low altitude wind shear, microburst or turbulence occurs most often in the
southwest, but is nearly as likely in the northeast or great lakes regions as in Alaska.
Thunderstorms and convective turbulence are least often involved in accidents in the northwest

23
US, Alaska and the Pacific Ocean. Forty percent of wake turbulence occurs in the southwest,
compared with less than 20% in the southeast.
In order to further examine the location of accidents with a cause or factor of some type of
atmospheric hazard, Figure 13 shows the percentage of each type of atmospheric hazard in the
states which were defined as part of the southwest and southeast regions. In general, the states
with the most events are California, Colorado, Texas and Florida. The most wake turbulence is in
California, the most mountain wave activity is in California, Colorado and New Mexico, and the
most low altitude wind shear, microburst or turbulence is in California and Colorado. Clear air
turbulence was felt most often in Colorado, California and Florida, turbulence in clouds was
most often encountered in Florida and California, convective turbulence in Florida and
thunderstorms in Florida and Texas.
Figure 13. State nearest occurrence of each type of atmospheric hazard (1987-2011).

24
Summary
The purpose of this analysis was to compare the characteristics of accidents associated with
seven categories of atmospheric hazard (mostly turbulence, thunderstorm and wind shear). Nine
hundred ninety accidents from 1987-2011 were selected from the NTSB accident database. All
are considered US-based accidents, and were operating under FAR Part 121, 135 or 91 flight
rules at the time.
Wake turbulence accounted for seven percent of the accidents selected, and the number of wake
turbulence accidents has declined over the study period. Although most wake turbulence is
initiated by large jet aircraft, the resulting accidents are suffered mostly by single-engine, fixed
gear aircraft (63%) operating under FAR Part 91 (87%). The pilots’ certifications vary widely,
with twenty-eight percent airline transport rated pilots, twenty-six percent commercial, twenty-
nine percent private and twenty percent student pilots. The pilot ages also vary, with twenty-four
percent under age 40, fifty-one percent between 40 and 55, and the remaining twenty-four
percent over 55. Forty-three percent of wake turbulence occurred in July, September or
November, and all other months accounted for between three and nine percent of the events.
Seventy-three percent of wake turbulence accidents occur during approach or landing, which in
part explains why forty-one percent of the accidents result in no injury, even though ninety-four
percent result in at least substantial damage to the aircraft. Twenty-six percent of wake
turbulence accidents happen in California, and seven percent each in Colorado and Florida.
Fifty-nine percent of accidents related to mountain wave turbulence occurred in California
(33%), Colorado or New Mexico. Thirty-five percent of the accidents occurred during
December, January or May. Seventy-three percent of these accidents involved single piston-
engine aircraft and ninety percent of the aircraft were operating under Part 91 rules. Forty-seven
percent of the pilots had only a private license, and fifty-seven percent of the pilots were between
the ages of 40 and 60. Sixty-nine percent of the accidents occurred during either cruise or
maneuvering flight. Sixty-three percent of the mountain wave accidents resulted in a fatality and
sixty-three percent resulted in destruction of the aircraft. Eight percent of the accidents selected
for this report were affected by mountain wave turbulence.
Clear air turbulence represented thirteen percent of the atmospheric hazards in this analysis.
Seventy-six percent of these flights were Part 121 flights, eighty-seven percent of the pilots were
licensed for airline transport flight, and seventy-three percent of the aircraft were jets (mostly
narrow-body airliners). Seventy-two percent of the pilots were between 40 and 60 years of age.
Fourteen percent of the accidents took place in April, and all other months accounted for
between five and eleven percent of the accidents. Eighty-four percent of the encounters occurred
during cruise or descent. Eighty-six percent of the accidents resulted in at least a serious injury
but in seventy-three percent of the accidents there was no damage to the aircraft. Thirty-one
percent of these accidents encountered clear air turbulence in the southwest US and another
twenty-one percent in the southeast US.
Ten percent of the selected accidents involved turbulence in clouds. Forty-eight percent of that
turbulence was encountered in the southwest or southeast United States. Twelve percent of the
flights were in the northeast US, which was the highest percentage in that region of any type of

25
atmospheric hazard. Fifty-one percent of the flights were Part 91 and forty-eight percent of the
aircraft had reciprocating engines. Forty-five percent of the aircraft received no damage, but
either a serious or fatal injury was recorded in eighty-eight percent of the accidents. Fifty-four
percent of the pilots had airline transport licenses, and sixty-five percent of them were between
40 and 60 years of age. Seventy-six percent of the turbulence encounters were during cruise or
descent. Only two percent of these accidents occurred in December, with fifteen percent in April
and fourteen percent in September.
One hundred eighty-six accidents (19%) were caused in part by convective turbulence. Nearly
fifty-seven percent of those flights were operating under Part 91 regulations and forty-two
percent of the aircraft had a single reciprocating engine. Thirty-eight percent of the aircraft were
destroyed, and a serious or fatal injury occurred in eighty-three percent of the accidents. Forty-
six percent of the pilots were rated for airline transport, and fifty-five percent were between 45
and 60 years old. Seventy-eight percent of the accidents occurred from April through September
and seventy-seven percent occurred during cruise or descent. Thirty-seven percent of the
convective turbulence was encountered in the southeast US, with thirteen percent in Florida.
Nineteen percent of the accidents selected for this analysis encountered a thunderstorm but no
mention of turbulence was made in the accident report. The number of this type of accident
declined significantly during the last twenty-five years. One might expect these accidents to be
similar to those encountering convective turbulence, but the greatest similarities are in geography
and time of the year. Thirty-six percent occurred in the southeast (13% in Florida) and only six
percent of these accidents were outside the contiguous US, (similar to four percent of convective
turbulence). Fifty-three percent of the accidents occurred in June through August, and fifty-five
percent occurred during cruise flight. Ninety-one percent of these were in Part 91 flights (versus
56% for convective turbulence), and ninety-one percent (versus 50%) of the aircraft had
reciprocating engines. Sixty-three percent of the pilots had only a private license, and one-third
of them were aged 45-60. Seventy-four percent of the accidents included at least one fatality
(versus 39%), and the aircraft was destroyed sixty-seven percent of the time (versus 38%).
The largest category of atmospheric hazards was low altitude wind shear, microburst or
turbulence (with no mention of thunderstorm) at twenty-four percent of the total. The number of
these accident also declined significantly during the study period. By a slight margin it had the
largest percentage of Part 91 flights (93%) and of aircraft with reciprocating engines (92%).
Fifty-three percent of these accidents resulted in no injury (the largest percentage of all types),
but all resulted in at least substantial damage to the aircraft. Only fifteen percent of the pilots
were rated for airline transport. This category also shows the most uniformity in the distribution
of age (percentages in the ten groupings range from 7.1% to 11.8%). Twenty-eight percent of
these accidents occurred in May or July, and nearly one-quarter (23%) occurred in either
California or Colorado. Eighty-nine percent of the accidents occurred during takeoff, approach or
landing.
Each of these seven categories of atmospheric hazards has some characteristics in common with
other categories, and some characteristics that separate them. The category of atmospheric
hazards with the largest number of accidents was low altitude wind shear, microburst or
turbulence (with no mention of thunderstorm). Clear air turbulence is the most frequent category
26
among both Part 121 and jet aircraft, followed by cloud turbulence and convective turbulence.
Flight into thunderstorms (no turbulence) is the category most likely to result in both fatalities
and aircraft destruction, but 91% of those accidents were in Part 91 flights. Overall the number
of accidents involving these atmospheric hazards has decreased significantly since 1987. This is
due in large part to the number of Part 91 accidents, and the fact that accidents due to wake
turbulence, thunderstorms and low altitude wind shear, microburst or turbulence, all of which are
predominantly seen in Part 91, declined significantly over the study period. No decline or
increase was seen in the Part 121 or Part 135 accidents involving these hazards.

27
Appendix A
List of Specific Aircraft Make and Model Within Each Aircraft Group

28
Wide-Body Jet Airliner Narrow Body Jet Airliner
Airbus A300 A318
A310 A319
A330 A320
A340 A321
Boeing 747 707
767 717
777 727
787 737
757
Lockheed L-1011 TRISTAR
McDonnell-Douglas DC-8
DC-9
DC-10
MD-11
MD-80
MD-90
British Aerospace BAE-146
British Aircraft Corporation BAC One-Eleven

29
Regional Jet
Canadair-Bombardier CRJ-100
CRJ-200
CRJ-700
CRJ-900
CRJ-5000
Embraer ERJ-135
ERJ-140
ERJ-145
ERJ-170
ERJ-190
Fairchild DO-328 (series 300)
Fokker F-100
F-28
Medium Business Jet
Aero Commander Jet Commander 1121
Aerospatiale Corvette
Bombardier Challenger
BD-100
Cessna CE-560
Citation II
Citation III
Citation Sovereign
Citation X
Dassault Falcon 10-100
Falcon 20-200
Falcon 50
Falcon 900
Falcon 2000
Hamburger Flugzeugbau 320

30
Medium Business Jet (continued)
Gulfstream GA-1159
Gulfstream II
Gulfstream III
Gulfstream IV
Gulfstream V
Beech Hawker-800
HS-BAE Systems 125-HAWKER
Raytheon 125-HAWKER
BeechJet 400
Rockwell Sabreliner
Israel Aircraft Industries Astra
Gulfstream G150
Gulfstream G200
Westwind
Learjet 24
25
31
35
36
45
55
60
Lockheed Jetstar
Mitsubishi 300

31
Small Business Jet
Cessna Citation I
CitationJet
Mustang
T-37 (military)
Eclipse 500
Embraer EMB-500
Learjet 23
Morane Saulnier MS-760
Raytheon 390
Large Turbo-prop
ATR 42
72
Convair CV-580
CV-600
CV-640
De Havilland Dash 7
Dash 8
Fokker F-27
HS-BAE Systems BAE-ATP
Lockheed L-188
L-382
NAMC YS-11

32
Medium Turbo-prop
Aerospatiale NORD-262
Air Tractor 602
802
Beech/Raytheon BE-100
BE-200
BE-300
99
1900
2000
CASA 212
De Havilland DHC-6
Douglas DC-3 (Turbo conversion)
Embraer EMB-110
EMB-120
Fairchild DO-228
DO-328 (series 100)
Fairchild-Swearingen SA-226
SA-227
Metro
GAF-ASTA Nomad
Grumman 73-T
Gulfstream Gulfstream I
Jetstream-BAE Systems 31
41
Rockwell OV-10
Saab 340
Short Brothers 3-60
SC.7 Skyvan
33
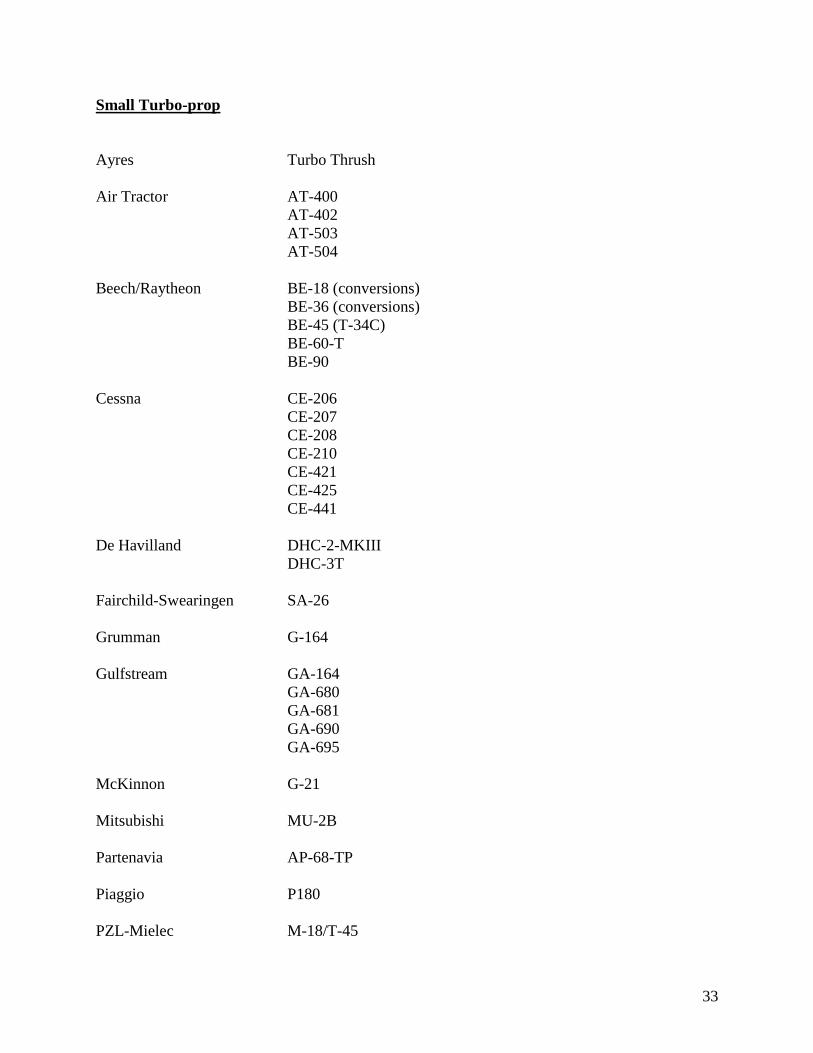
Small Turbo-prop
Ayres Turbo Thrush
Air Tractor AT-400
AT-402
AT-503
AT-504
Beech/Raytheon BE-18 (conversions)
BE-36 (conversions)
BE-45 (T-34C)
BE-60-T
BE-90
Cessna CE-206
CE-207
CE-208
CE-210
CE-421
CE-425
CE-441
De Havilland DHC-2-MKIII
DHC-3T
Fairchild-Swearingen SA-26
Grumman G-164
Gulfstream GA-164
GA-680
GA-681
GA-690
GA-695
McKinnon G-21
Mitsubishi MU-2B
Partenavia AP-68-TP
Piaggio P180
PZL-Mielec M-18/T-45

34
Small Turbo-prop (continued)
Pilatus PC-6
PC-7
PC-12
Piper PA-31T
PA-42
PA-46-310TP, PA-46-350TP, PA-46-500TP
Quest Kodiak
Reims F406
SIAI Marchetti SF-260-TP
Socata TBM-700

35
Heavier Multi-Engine (Reciprocating)
Boeing B-17
B-307
Convair CV-240
CV-340
CV-440
Curtiss C-46
De Havilland DHC-4
Douglas DC-3
DC-4
DC-6
DC-7
Fairchild C-119
C-123
Grumman C-1
HU-16
S-2F
Lockheed L-1049
L-1649
L-18
L-49
P-38
Martin B26

36
Lighter Multi-Engine (Reciprocating)
Beagle 206
Beech BE-18
BE-50, BE-55, BE-56, BE-58
BE-60, BE-65, BE-70, BE-76, BE-95
Beriev BE-103
Britten-Norman Islander
Tri-Islander
Defender
Stout Bushmaster 2000
Camair 480
Cessna CE-303, CE-310, CE-320
CE-335, CE-336, CE-337, CE-340
CE-401, CE-402, CE-404
CE-411, CE-414, CE-421
T-50 (Military)
Champion Lancer
De Havilland DHC-90
Dornier DO-28
Grumman 21, 44, 73
Gulfstream GA-7,
GA-500, GA-520, GA-560
GA-680, GA-685
GA-700, GA-720
Lockheed L-12
Navion D-16
Piper PA-23
PA-30, PA-30A, PA-30B
PA-31, PA-34, PA-39
PA-44, PA-60
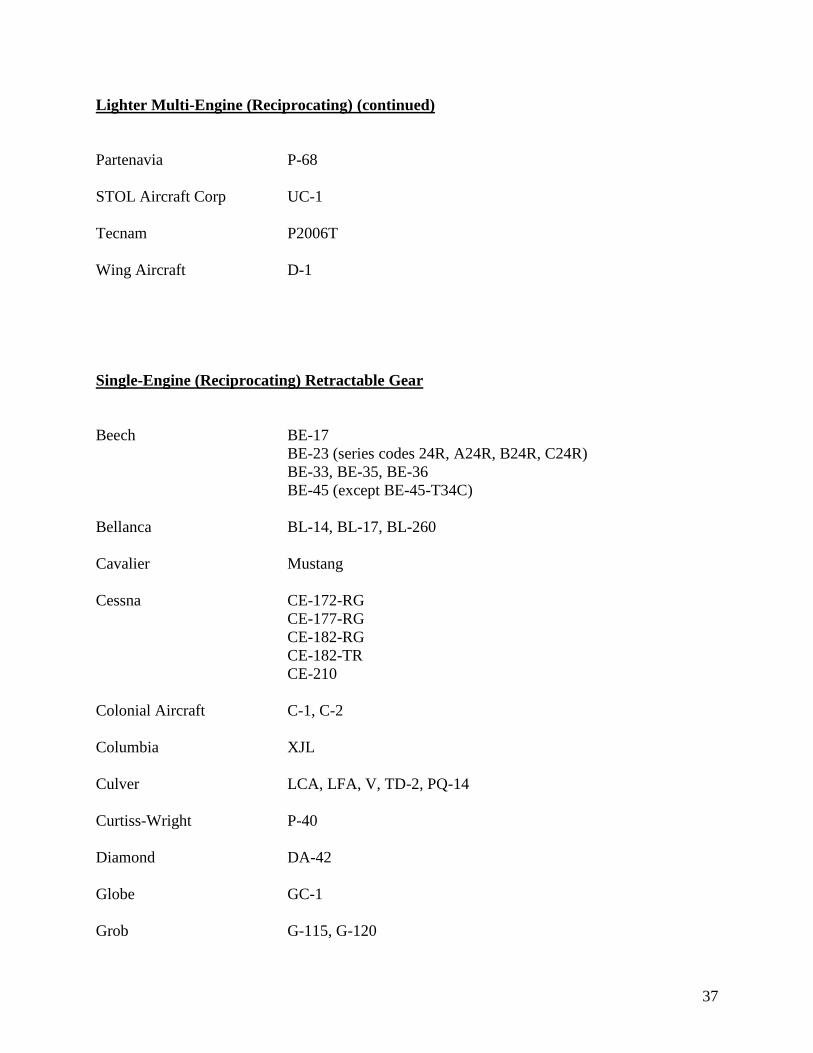
37
Lighter Multi-Engine (Reciprocating) (continued)
Partenavia P-68
STOL Aircraft Corp UC-1
Tecnam P2006T
Wing Aircraft D-1
Single-Engine (Reciprocating) Retractable Gear
Beech BE-17
BE-23 (series codes 24R, A24R, B24R, C24R)
BE-33, BE-35, BE-36
BE-45 (except BE-45-T34C)
Bellanca BL-14, BL-17, BL-260
Cavalier Mustang
Cessna CE-172-RG
CE-177-RG
CE-182-RG
CE-182-TR
CE-210
Colonial Aircraft C-1, C-2
Columbia XJL
Culver LCA, LFA, V, TD-2, PQ-14
Curtiss-Wright P-40
Diamond DA-42
Globe GC-1
Grob G-115, G-120

38
Single-Engine (Reciprocating) Retractable Gear (continued)
Grumman Avenger
Gulfstream GA-112, GA-114
Lake LA-4
Meyers Aero Commander 200
MAC-145
Mooney M-18, M-20, M-22
North American AT-6
SNJ-2, SNJ-4, SNJ-5, SNJ-6
Harvard
Navion NAV-1, NAV-4
NAV-A, NAV-B, NAV-D
NAV-G, NAV-H, NAV-L
Piper PA-24, PA-28R, PA-28RT
PA-32S-300
PA-32R, PA-46
Raytheon Commander 114
Reims FR-182
SIAI Marchetti S-205
SF-260
FN-333
Socata TB-20
Spartan 7W
STOL Aircraft RC-3
Thurston Teal TSC-1A
Yakovlev Yak-3

39
Single-Engine (Reciprocating) Fixed Gear
Aero Mercantil Gavilan 358
Air Tractor AT-301
AT-400, AT-401
AT-501, AT-502
AMD Alarus-2000
American Legend AL-11
AL-3
Avions Robin R-2160
Arctic S1A, S1B
Aeronca AR-7, BL-7, AR-11, AR-15
AR-50, AR-65
AR-C3, AR-K, AR-L3
Bubeck-Irving
Aviat A-1
Ayres Thrush
Bellanca BL-7, BL-8, BL-11
BL-DW1
Beech BE-19, BE-23, BE-77
Boeing B-75
Call Aircraft A-2, A-3, A-9
Centaur Longren
Cessna CE-120, CE-140, CE-145, CE-150, CE-152
CE-165, CE-170, CE-172, CE-175, CE-177
CE-180, CE-182, CE-185, CE-188
CE-190, CE-195,
CE-205, CE-206, CE-207, CE-305
Champion Champ-7, Champ-8

40
Single-Engine (Reciprocating) Fixed Gear (continued)
Cirrus SR-20, SR-22
Columbia 350
Commonwealth Skyranger, Sportster
Convair – General Dynamics BT-13, BT-15, CV-L13
Cub Crafters CC-18
Culver Dart-G
DeHavilland DHC-1, DHC-2, DHC-3, DHC-60, DHC-82, U-6
Diamond DA-20, DA-40
Dornier DO-27
Eagle DW-1
ERCO Alon-415
Ercoupe-415
Forney-415
Emigh Trojan
Extra EA
Fairchild F-24, M-62
PT-19, PT-23, PT-26
Fieseler Fi-156
Fleet Model 16
Found FBA-2
Funk Model B
Great Lakes 2T1
Grumman G-164

41
Single-Engine (Reciprocating) Fixed Gear (continued)
Gulfstream GA-AA, GA-AG
Helio H-250, H-295, H-391, H-395
H-700, H-800
Helton Lark-95
Howard DGA-15
Lancair LC-40, LC-41, LC-42
Liberty XL-2
Lockheed L-402
Luscombe LL-8, LL-11
Phantom
Maule M-4, M-5, M-6, M-7, M-8
MX-7, MT-7, MXT-7
MBB BO-209
Meyers OTW
Monocoupe D-145
Morane-Saulnier MS-880, MS-893, MS-894
Mooney M-10
Moravan Zlin-242
Mudry CAP-10
Naval Aircraft Factory N3N-3
New Standard D-25
Noordyun UC-64
OMF Symphony

42
Single-Engine (Reciprocating) Fixed Gear (continued)
Pilatus PC-6-350
Piper L-21, L-4
PA-11, PA-12, PA-14, PA-15, PA-16
PA-17, PA-18, PA-19
PA-20, PA-22, PA-25, PA-28
PA-32, PA-36, PA-38
PA-J2, PA-J3, PA-J3C, PA-J3F, PA-J3L, PA-J4, PA-J5
Pitts S-1, S-2
Porterfield CP-35, CP-50, CP-55, CP-65, FP-65, LP-65
PZL-Mielec M-18, M-104, M-150, M-160, AN-2
Quartz Mountain 11E
Rawdon T-1
Rearwin Cloudster
Reims FA-150, FR-172
Rose Parakeet
Ryan ST-A, ST-3
Socata TB-9, TB-10, TB-200, MS-Ralleye
Stinson AT-19, SR-7, SR-8, SR-10,
SR-V77, SR-JR, SR-L5, SR-108
Stampe SV-4
Sukhoi SU-26, SU-29
Taylorcraft 15A, 19, 20, 21, 22
BC, BF, BL
DC, DF, DL
Tecnam P-2002
Timm N2T

43
Single-Engine (Reciprocating) Fixed Gear (continued)
Varga 2150A, 2180
Volaircraft Aero Commander 100
WACO AGC, AQC, ARE, ASO, ATO, AVN
BSO, CRG, CUC, GXE, HRE, QCF
RNF, SRE, UBF, UIC, UKC, UKS, UPF
VKS, YKS, YMF, YPF, ZPF
Weatherly 201, 620
XtremeAir GMBH Sbach-342
Zenair CH-2000

44
Light Sport Aircraft
Aero Ltd. AT-4
Aeropro Eurofox
Aerosport Ikarus
Aerospool WT-9 (Dynamic)
AMD CH-601 (Zodiac)
Arion Lightning
Aveko VL-3
B&F Technik FK-9
Bush Caddy LSA
Cessna CE-162
Colyaer Freedom
Cub Crafters CC-11
Czech Aircraft Works Mermaid
Parrot
Sport Cruiser
PiperSport
Diamond DV-20
Dova DV-1
Evektor Sportstar
Fantasy Air Allegro 2000
Flight Design CT
FPNA A-22
Gryf Aircraft MD-3

45
Light Sport Aircraft (continued)
Higher Class Aviation Sport Hornet
Indus Thorp T-211
Iniziative Sky Arrow 600
Jabiru J-170, J-230, J-250
Jihlavan KP-5
M-Squared Breese II
Moravan/Zlin Savage
Paradise P1
Quicksilver GT-500
Rans S-7LS
Remos G3, GX
Skykits Savannah
SportAir Stingsport
Sting S-3
Tecnam P-92, P-2004

46
Appendix B
Flight Hours per Year for Parts 121, 135 and 91
(Taken from https://www.ntsb.gov/data/aviation_stats.html)

47
Part 121 Part 135 Part 91 Total
1987 10,620,750 4,603,000 26,972,000 42,195,750
1988 11,140,548 4,724,689 27,446,000 43,311,237
1989 11,274,543 5,260,555 27,920,000 44,455,098
1990 12,150,116 4,590,760 28,510,000 45,250,876
1991 11,780,610 4,532,581 27,678,000 43,991,191
1992 12,359,715 5,179,349 24,780,000 42,319,064
1993 12,706,206 4,962,347 22,796,000 40,464,553
1994 13,124,315 5,249,129 22,235,000 40,608,444
1995 13,505,257 5,113,866 24,906,000 43,525,123
1996 13,746,112 5,976,755 24,881,000 44,603,867
1997 15,838,109 4,080,764 25,591,000 45,509,873
1998 16,816,555 4,155,670 25,518,000 46,490,225
1999 17,555,208 3,546,731 29,246,000 50,347,939
2000 18,299,257 4,299,535 27,838,000 50,436,792
2001 17,814,191 3,297,432 25,431,000 46,542,623
2002 17,290,198 3,184,559 25,545,000 46,019,757
2003 17,467,700 3,246,206 25,998,000 46,711,906
2004 18,882,503 3,540,218 24,888,000 47,310,721
2005 19,390,029 4,114,775 23,168,000 46,672,804
2006 19,263,209 4,043,495 23,963,000 47,269,704
2007 19,637,322 4,324,701 23,819,000 47,781,023
2008 19,126,766 3,704,939 22,805,000 45,636,705
2009 17,626,832 3,373,545 20,862,000 41,862,377
2010 17,750,986 3,427,648 21,688,000 42,866,634
2011 17,962,965 3,659,432 21,424,600 43,046,997
Average 15,725,200 4,247,707 25,036,344 45,009,251