Variation of structural vibration characteristics versus ...
32
1 Variation of structural vibration characteristics versus non-uniform temperature distribution Yong Xia a, , You-Lin Xu a , Ze-Long Wei a , Hong-Ping Zhu b , and Xiao-Qing Zhou c a Department of Civil and Structural Engineering, The Hong Kong Polytechnic University, Hung Hom, Kowloon, Hong Kong, China b School of Civil Engineering & Mechanics, Huazhong University of Science & Technology, Wuhan, Hubei, 430074, China c College of Civil Engineering, Shenzhen University, Shenzhen, Guangdong, China Abstract In vibration-based condition assessment exercises, it is necessary to discriminate the variation of structural properties due to environmental changes from those caused by structural damage. Some efforts have been made to correlate the structural vibration characteristics and the air temperature or temperatures at the structural surface. As the temperature of an entire structure is generally non-uniformly distributed, using the air temperature or surface temperatures alone may not sufficiently capture the relation between the structural responses and temperatures. The present paper aims to investigate the variation of the structural vibration characteristics versus the non-uniform temperature field of the structure. Thermodynamic models are employed to estimate the temperature at different components of the structure at different time. As the material mechanical properties are temperature dependent, the structure can be regarded as a composite structure consisting of elements with different Young’s moduli. Consequently the natural frequencies of the structure can be calculated with the finite Corresponding author. Tel.: +852 2766 6066; fax: +852 2334 6389. E-mail address: [email protected] (Dr. Yong Xia) This is the Pre-Published Version.
Transcript of Variation of structural vibration characteristics versus ...

1
Variation of structural vibration characteristics versus non-uniform
temperature distribution
Yong Xiaa,, You-Lin Xua, Ze-Long Weia, Hong-Ping Zhub, and Xiao-Qing Zhouc
a Department of Civil and Structural Engineering, The Hong Kong Polytechnic
University, Hung Hom, Kowloon, Hong Kong, China
b School of Civil Engineering & Mechanics, Huazhong University of Science & Technology, Wuhan, Hubei, 430074, China
c College of Civil Engineering, Shenzhen University, Shenzhen, Guangdong, China
Abstract
In vibration-based condition assessment exercises, it is necessary to discriminate the
variation of structural properties due to environmental changes from those caused by
structural damage. Some efforts have been made to correlate the structural vibration
characteristics and the air temperature or temperatures at the structural surface. As the
temperature of an entire structure is generally non-uniformly distributed, using the air
temperature or surface temperatures alone may not sufficiently capture the relation
between the structural responses and temperatures. The present paper aims to
investigate the variation of the structural vibration characteristics versus the
non-uniform temperature field of the structure. Thermodynamic models are employed
to estimate the temperature at different components of the structure at different time.
As the material mechanical properties are temperature dependent, the structure can be
regarded as a composite structure consisting of elements with different Young’s moduli.
Consequently the natural frequencies of the structure can be calculated with the finite
Corresponding author. Tel.: +852 2766 6066; fax: +852 2334 6389. E-mail address: [email protected] (Dr. Yong Xia)
This is the Pre-Published Version.

2
element method. The procedures are repeated for different time and thus variation of
the frequencies with respect to time is obtained. A simply-supported RC slab was
constructed and used as a proof-of-concept example. The temperatures at different
points of the slab were recorded continuously in one day, together with a series of
forced modal testing to extract its modal properties. On the other hand, a finite element
model was established to conduct a transient thermal analysis and estimate the
temperature distribution of the slab, which shows a good agreement with the
measurement counterpart. The temperature data at all components and thermal
properties of the material were then inputted to the model to calculate the frequencies,
which also matched the measured frequencies very well. Moreover, a good linear
correlation between the natural frequencies measured and the structural temperatures
other than the air temperature or surface temperatures is observed. The present study
provides a new approach to quantify the environmental effect on the structural
vibration characteristics.
Keywords: Structural condition assessment; temperature effect; vibration
characteristics; thermodynamics; linear regression

3
1. Introduction
In structural condition monitoring assessment [1][2][3][4], a practical difficulty exists
because the structural responses vary with the changing environmental conditions,
particularly the temperature. Some studies have found that the changes in structural
responses due to temperature variation could be more significant than the changes due to
normal structural damage [5]. If the temperature effect is not fully understood, structural
condition cannot be evaluated reliably [6].
During the past 20 years, quite a few studies have been conducted to investigate the
environmental effect on structural vibration properties. Askegaard and Mossing [7]
studied a three-span RC footbridge and observed a 10% seasonal change in frequency
over a three-year period. Researchers from Los Alamos National Laboratory [8] found
that the first three natural frequencies of the Alamosa Canyon Bridge varied about 5%
during a 24 hours period as the temperature of the bridge deck changed by
approximately 22C. Peeters and De Roeck [9] continuously monitored the Z24-Bridge
for nearly a year and they reported that the frequencies decreased with the temperature
increase. Desjardines et al. [10] studied modal data and average girder temperature
collected over a six-month period in the Confederation Bridge. The first two modal
frequencies identified from the Bill Emerson Memorial Bridge [11] monotonically
decreased as the temperature went up in a linear way, while the mode shapes did not
experience a significant change. Ni et al. [12][13] investigated the effect of

4
temperature and wind speed on modal parameters in the Ting Kau Bridge in Hong
Kong using one-year monitoring data. Fu and DeWolf [14] found that the changes in
the frequencies of a two-span composite steel-girder bridge were due to changes in the
bridge bearings. Liu and DeWolf [15] found that the frequencies of a curved concrete
box bridge varied by a maximum of 6% in a peak to peak temperature range of 70F
(39C) during one year. Breccolotti et al. [16] numerically analysed the temperature
effect on a bridge through thermal analysis. Macdonald and Daniell [17] investigated
the variations of natural frequencies of the Second Severn Crossing cable-stayed
bridge due to wind, temperature and traffic loading. Nayeri et al. [18] monitored a
17-story steel frame building and it showed a strong correlation between the frequency
and air temperature while the frequency variations lagged behind the temperature
variations by a few hours. A chamber experiment which was conducted by Balmes et
al. [19] demonstrated that axial stresses due to different thermal expansion in members
cause the frequencies to change significantly. Xia et al. [20] have conducted
experiments on a continuous concrete slab for nearly two year. It was found that the
frequencies had a strong negative correlation with temperature and humidity, damping
ratios had a positive correlation, but no clear correlation of mode shapes with
temperature and humidity change could be observed.
In summary, it has been widely observed that natural frequencies of structures decrease
when temperature goes up. In addition, most of these researches focus on
establishment of the correlation between the temperatures measured on the structure

5
surface (or in air) and the structural responses. However, the temperature distribution
in a structure is generally non-uniform and time-dependent. For most of the
construction materials, it is generally accepted that an increase in temperature will
cause a decrease in Young’s modulus and shear modulus of the materials. Therefore,
the Young’s modulus throughout a structure with existence of temperature gradient is
not identical. Consequently the structural responses are associated with the temperature
distribution of the entire structure. Using the air temperature or surface temperatures
alone may not discover the realistic relation between the structural responses and
temperature sufficiently.
Under this concept, the present paper aims to quantify the temperature effect on the
vibration properties of a structure by investigating the temperature distribution of the
structure via a thermodynamic approach. First, the thermal field distribution of the
structure will be obtained through a transient heat analysis. Second, with the
temperature data at different members and the thermal properties of the structural
materials, the structural mechanical properties in each member are obtained. Then the
dynamic properties of the whole structure can be calculated. Finally, the relation
between the temperature distribution and structural dynamic properties will be
established quantitatively. The temperature data measured at some critical points at
different times will be employed to verify the thermodynamic models. The calculated
dynamic properties can also be compared with the measurement. A laboratory tested
RC slab will be used as a proof-of-concept example to demonstrate the whole
6
procedures.
2. Laboratory experiment
2.1. Description of the RC slab
A simply-supported RC slab was constructed for this study which measures 3200 mm
long, 800 mm wide, and 120 mm thick with 100 mm overhang at each end, as shown
in Fig. 1 and Fig. 2. Grade C30 concrete was selected in accordance with the design
code in People’s Republic of China [21]. Ф12 mm reinforcing bars at a 150 mm
interval were chosen for positive reinforcement with 15 mm cover and, Ф10 mm
reinforcing bars at a 200 mm interval were laid in the perpendicular direction.
Under the sunshine, the temperatures in the top surface and bottom surface of the slab
are assumed uniformly distributed in two horizontal directions, which implies the
temperature gradient exists along the thickness direction of the slab only. Therefore,
seven thermocouples were embedded into the slab at an interval of 20 mm along the
thickness direction (marked with T1 to T7 from the top to the bottom in Fig. 1) to
measure the temperature distribution in the direction. To mount the thermocouples in
position and measure the temperature of concrete, a plastic tube of 120 mm long was
drilled with 7 holes at an interval of 20 mm in one side and another 7 holes at identical

7
interval in the opposite side. The tube was placed vertically in the center of the slab
before pouring concrete. The seven thermocouples were then penetrated through the 7
pairs of holes of the pipe and embedded in the concrete, as illustrated in Fig. 1b. The
thermocouples were located in the center of the slab in plan, as shown in Fig. 1c. To
examine the temperature distribution along horizontal direction, thermocouples were
embedded in one corner to compare the temperature at the corner with the temperature
in the center. Due to limitation of channels, three thermocouples were installed at the
corner and placed at top of the slab, middle of the slab, and bottom of the slab
(T9~T11). An additional thermocouple (T8) was employed to measure the air
temperature. The figure also illustrates 14 points to install accelerometers to record the
vibration of the slab subject to impact from an instrumented hammer.
2.2. Procedures of the experiment
After the slab curing 28 days, modal tests were carried out. Seven accelerometers were
used to measure the vibration responses of the slab under impact from an instrumented
hammer. Two sets of measurement were required to extract the mode shapes at the 14
points. Modal data (frequencies, mode shapes and damping ratios) were extracted from
the frequency response functions with the Global Rational Fraction Polynomial method
[22], a standard modal identification technique.
The present study aims to investigate the variation the structural vibration

8
characteristics with respect to different temperatures. Sets of modal testing were
carried out hourly from 8:00 am to 22:00 pm on 11th Feb., 2009. At the same time,
structural temperatures were automatically recorded from the embedded thermocouples
every 2 minutes from 6:00 am on 11th Feb. to 6:00 am on 12th Feb., 2009. Due to space
limitation on campus, the slab could be exposed to sun irradiation in the morning only
and shaded by buildings in the afternoon, while this limitation does not affect the
analytical methods proposed in the paper.
A previous study on a slab has found that the mode shapes were not affected by the
temperature changes as the temperatures along the horizontal directions are uniformly
distributed [20]. Consequently only frequencies and damping ratios were extracted
from four accelerometers while the mode shapes haven’t been measured during the
day.
3. Temperature data
3.1. Variation of temperature in one day
The uniformly distributed 7 thermocouples captured the temperature along the
thickness of the slab. Fig. 2 shows the variations of the structural temperatures in 24
hours, together with the air temperature. It shows that temperature at the slab (T1 to T7)

9
increased from 9:00 am to 13:30 pm and decreased after that. The temperatures near
the top surface arose more significantly than the temperatures near the bottom surface,
as expected. As solar irradiation was blocked by the adjacent buildings, the
temperatures at T1 and T2 dropped down very fast in the afternoon while others
decreased slower, due to the property of thermal inertia. Fig. 3 compares the
temperatures measured at the center of the slab (T1, T4 and T7) with those measured at
the corner (T9~T11). It is noted that T1 and T9 are the temperatures at the top, T4 and
T10 are those in the middle, and T7 and T11 at the bottom. At most of the time, the
temperatures at the same height are very close. This verifies the assumption that only
temperature gradient exists along the thickness direction.
To exhibit the temperature distribution throughout the slab, the temperatures at
different height are plotted in Fig. 4. One can find that the temperature gradient along
the thickness direction is non-uniform and non-linear in the day time, when the
temperatures vary greatly. Consequently, stresses will be generated in the section even
the slab is simply-supported. When temperatures become stable, temperature gradient
along the thickness direction is rather linear.
3.2. Thermodynamic analysis
In practice, the temperature field of an entire structure is usually not available. A
thermodynamic model is used here to predict the temperature distribution throughout
10
the structure. Two different thermal boundary conditions will be adopted. The model
predictions will be compared with the measurement data.
A 3-D heat conductivity model is established in ANSYS [23] as shown in Fig. 5. There
are 6 identical elements in the thickness direction with height of 20 mm each. The
mesh is descretized for both thermal analysis and mechanics analysis. Element type
SOLID90 is employed for thermal analysis while SOLID65 is employed for mechanics
analysis, which will be described later. As we assume that the temperature is uniformly
distributed in the horizontal direction, temperature gradient occurs in the thickness
direction only.
In the literatures and practical exercises, some measured the structural surface
temperatures and some obtained air temperature only. In the present study, these two
cases and the corresponding thermal boundary conditions are considered. In the former
situation, the top surface temperature T1 and bottom surface temperature T7 measured
at different time are known and regarded as boundary conditions of the slab. Therefore,
the temperature of all the nodes at the top is set to T1 and the temperature of all the
nodes at the bottom is set to T7.
In the second case, the air temperature is given. To consider the heat exchange
condition between the slab and the surrounding environment, solar irradiation can be
measured in-situ or simulated from theoretical models as [24]

11
rid IIII (1)
where I, Id, Ii and Ir are the total solar irradiation, direct solar irradiation, diffuse solar
irradiation and reflected solar irradiation on a surface, respectively. The model takes
into account of the nature of solar irradiation, the geometric relation between the sun
and the earth, and the characteristics of the solar energy that reaches the surface of a
structure. Then the energy exchange between the surface elements of the slab and the air
can be expressed as [24]
ITThn
Tk as
(2)
where k is thermal conductivity, T is temperature, n is normal to the surface, h is the
heat transfer coefficient, sT is the surface temperature, aT is the ambient air
temperature, α is the absorptivity coefficient of the surface material, and I irradiation.
For the bottom elements of the slab, Eq. (2) is similarly applied except that I includes
the reflected solar irradiation only. The solar irradiation at the top surface and bottom
surface of the slab is then calculated and listed in Table 1. It is noted that in the
afternoon, the solar irradiation at the top surface includes the diffuse solar irradiation
only because the direct irradiation was blocked.
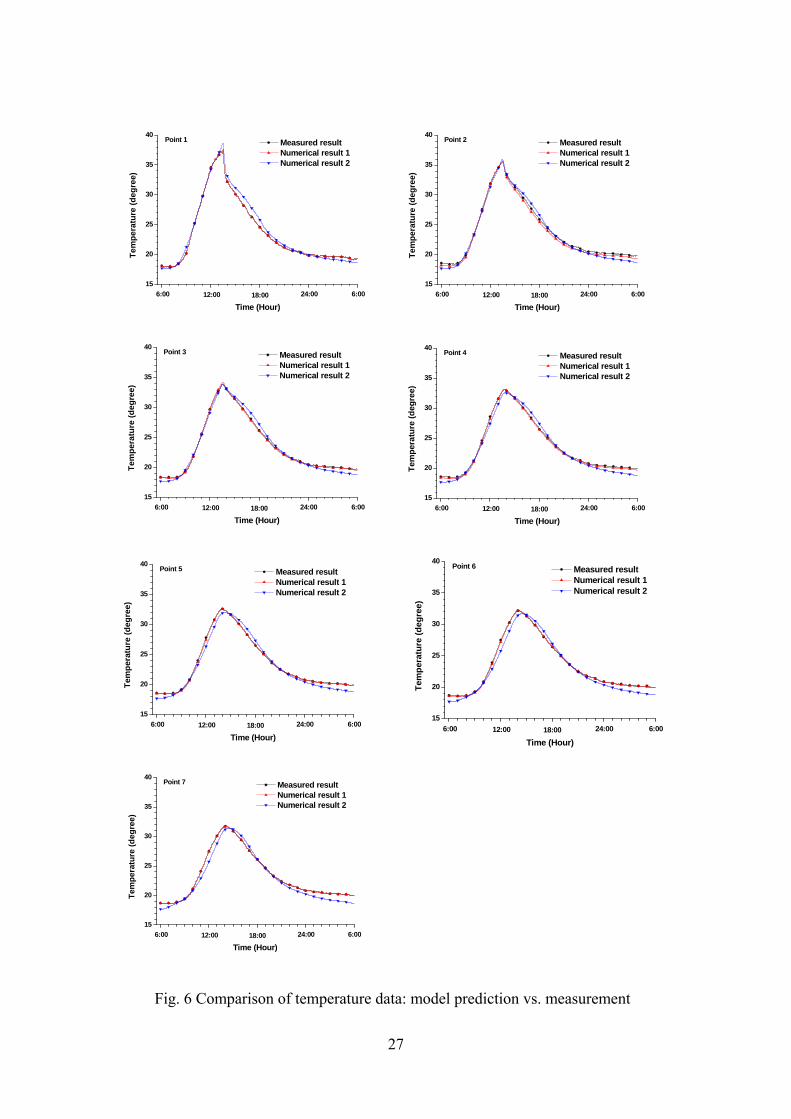
A transient thermal analysis is conducted to obtain the interior temperature at every
time step (2 minutes here). In this analysis, k = 1.74 W/(m·ºC), c = 920 J/(kg·ºC), h =
23 W/(m2·ºC) for the top surface and 8.7 W/(m2·ºC) for the bottom surface, and α = 0.7,
which are obtained from the Chinese code [25]. Density of the concrete was measured
as 2316.3 kg/m3. Fig. 6 compares the temperatures at different points along the

12
thickness direction of the slab using both cases of thermal boundary conditions with
the measurement counterparts. A very good agreement is found among the three sets of
data. This verifies that the numerical model and boundary conditions can be employed
to predict the temperature distribution of the slab. For simple structures like the slab
employed here, the thermodynamic model is accurate enough. For a practical structure
with complicated configuration, the boundary conditions can be more complicated.
This can be found in some works done in bridge engineering [26][27].
4. Vibration data
4.1. Modal properties of the slab
Typical measured mode shapes of the first four modes are shown in Fig. 7. Modes 1, 2
and 4 are bending modes and mode 3 is a torsional one. In addition, a set of modal
testing was implemented hourly from 8:00 am to 22:00 pm on 11th Feb., 2009 to
extract the frequencies and damping ratios.
4.2. Variation of frequency and damping ratio versus temperature change
Fig. 8 illustrates the variation of the measured first natural frequency with respect to
the temperatures measured from the thermocouples. It clearly shows that the frequency
of the structure decreases when temperature goes up before noon while the frequency

13
increases as temperature drops down in the afternoon, as observed by many researchers.
Variation of the higher modes will be presented later (Fig. 10). However, temperature
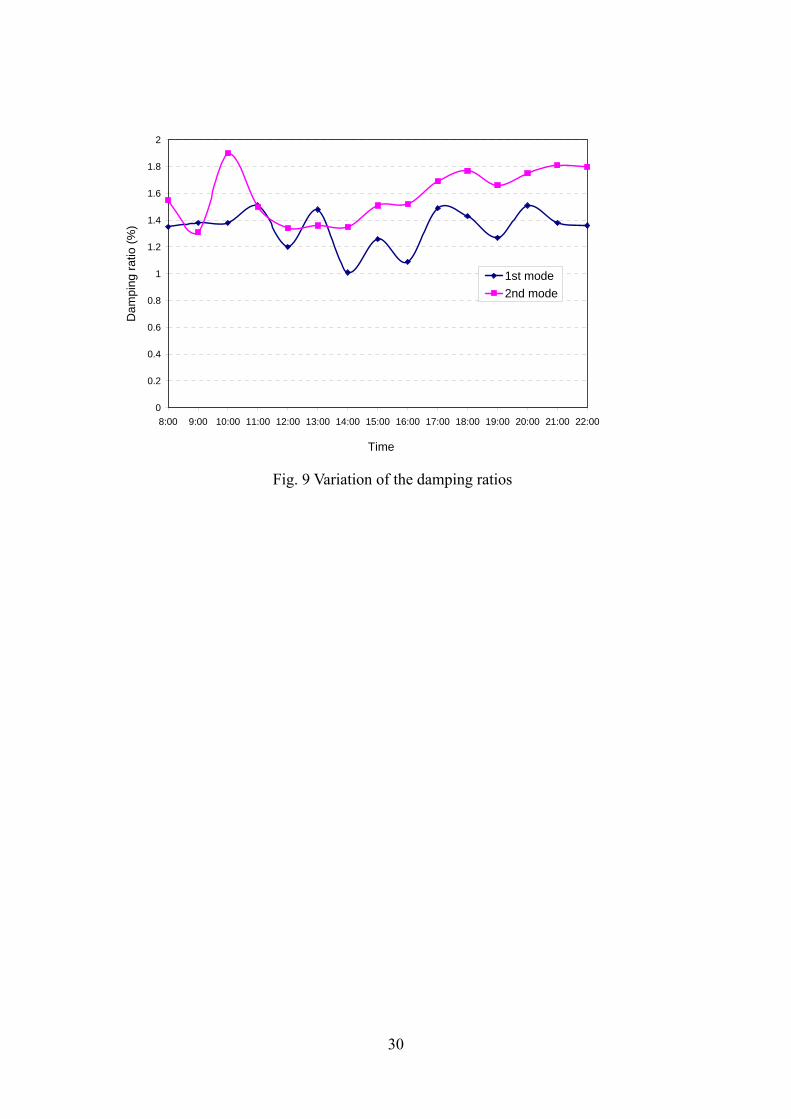
effect on damping ratios is not so obvious. Fig. 9 illustrates the variation of the first
two modal damping ratios extracted from measurement with respect to time. It has
been found that damping ratios increase slightly when temperature arise [20]. Since the
variation of temperature here is not significant and uncertainty level of measurement of
damping is relatively high, the change of damping may be masked by the measurement
noise.
The linear regression technique is then utilized to analyze the relation between the
frequency and temperature. A multiple linear regression model has the form of [28]
0 1 1 ... p p ff t t (3)
where f is the frequency, β0 to βp are the regression coefficients and εf is the regression
error, t1 ~ tp are the temperature explanatory variables. A few cases of temperatures are
studied here.
First, the 7 structural temperatures measured (T1 to T7) are used as the explanatory
variables (p=7). With the least-square fitting [28], the regression coefficients are
computed. The square of the correlation coefficient R2 is 0.97 and the standard
deviation of the error is 0.03 Hz, which means a very good correlation between the
frequency and the temperatures. In literature, some researchers have chosen air
temperature, average of the structural surface temperatures (i.e., (T1+T7)/2), and

14
differential of the surface temperatures (i.e., (T1-T7)/2) as explanatory variables. These
are also applied to the present experimental data and correspondingly only one
temperature variable is used in Eq. (3). The R2 statistics are calculated as 0.74, 0.88,
and 0.18, respectively and the standard deviations of the error are 0.07 Hz, 0.05 Hz,
and 0.13 Hz, respectively. This indicates that the structural frequency is not only
affected by the air temperature or structural surface temperatures, but also by
temperatures at all components of the structure. When one investigates the temperature
effect on the vibration properties of a structure, consideration of temperature
distribution throughout the structure will improve the correlation.
It is widely accepted that Young’s moduli of materials decrease as temperature of the
material increases and thus the natural frequencies decrease. When the thermal field of
the structure is non-uniform, the structure can be regarded as a composite structure that
has different Young’s moduli at different components. The natural frequencies can then
be calculated. This is demonstrated in the following section.
4.3 Quantification of temperature effect
Although variation of frequencies may be due to many reasons, thermal dependent
property of concrete is solely studied here. This is because the slab is simply supported
and the physical boundary condition can be regarded as unchanged during the day. In
previous study by the first author and his colleagues [20], it has shown that the friction

15
at the supports and the geometric variation due to temperature change has much less
effect on the frequencies, as compared with the variation of Young’s modulus with
respect to temperature.
Young’s modulus of concrete with respect to temperature can be represented as a linear
equation, in the range of natural temperature:
20( ) [1 ( 20)]C EE T E T (4)
where T is the temperature of the material, E20ºC is Young’s modulus of concrete at the
temperature 20 and℃ θE is the temperature coefficient of Young’s modulus, which is
suggested as 0.003 by CEP/FIP [29]. This implies that when the temperature of a RC
structure goes up by 1℃ uniformly, the natural frequencies drop down by 0.15%.
Therefore, when a structure experiences 20℃ change, the natural frequencies may
change by 3.0%, which is not small as compared with those due to local damages.
The model in ANSYS shown in Fig. 5 is employed here to calculate the natural
frequencies of the slab. At temperature of 20℃, the Young’s modulus of each element
is 26.0 GPa, which was measured from static tests on three standard cylinder
specimens. Poisson's Ratio is set to 0.3 as usual. The first 2 modal frequencies are
calculated as 20.30 Hz and 81.25 Hz, quite close to the measurement (19.92 Hz and
82.16 Hz, respectively). The model is not updated here to match the measurement as
this is not the objective of the present study.

16
At different time of the date, the temperature at each element of the slab has been
calculated forgoing and the Young’s modulus of each element is temperature dependent
as described in Eq. (4). These are inputted into the ANSYS model to calculate the
frequencies. Variation of the first frequency with respect to time is shown in Fig. 10, as
compared with the measurement. As the Young’s moduli used in numerical analysis are
not exactly the same as the real ones, the frequencies differ from the measurements. To
make comparison of the frequency change, the frequencies are normalized with the
first values. One can find that there is a good agreement between the numerical results
and measurements. This verifies that the variation of structural vibration properties is
affected by the structural temperature distribution. Variation of the second and third
measured bending frequencies is shown in Fig. 11, as compared with the analytical
counterparts. It shows that the variation trend of the measured higher modal
frequencies matches that of the analytical one. One can also observe that the
discrepancy of the higher modes is larger than the first mode. This may be because the
higher modes are not easy to be measured accurately in the case. Moreover, the first
torsion mode cannot be reliably identified in some experiments and the results are not
shown here. This might be because the supports are not ideally flat and partial of the
slab does not contact with the support perfectly, which causes significant error of the
measurement.

17
5. Conclusions and discussions
This paper proposed a new approach to quantify the variation of structural vibration
characteristics with respect to structural temperatures. Being different from the
conventional studies that using air temperature or temperatures at a few points of the
structure, the paper aims to obtain the thermal distribution of the entire structure from
the thermodynamic models. Consequently the relation between the frequencies and the
temperature at the whole structure is established. The frequencies can also be
calculated from the FE model according to the thermal-dependent properties of the
material. Both the frequencies and temperature distribution can be compared with the
measurement to verify the numerical models.
Application to a simple RC slab has found that the thermodynamic models can predict
the structural temperature field accurately. Two different sorts of thermal boundary
conditions were applied. In the first condition, the surface temperatures were given,
and in the second, only the air temperature was provided and the solar irradiation was
numerically simulated. Both gave similar temperature distribution of the slab along the
thickness direction. This indicates that in the practice, structural temperature field can
be predicted with a few critical temperature data at an acceptable accuracy. For more
complicated structures with complex configurations, the first sort of thermal boundary
condition requires more temperature measurements, while the second sort of boundary

18
condition is more convenient. In the heat transfer analysis, many thermal parameters of
material obtained from design code or based on experience may affect the analytical
results significantly. This causes the accurate prediction more difficult.
Linear regression analysis has discovered that the first natural frequency has a better
linear relation with the temperature values at seven different points than with the air
temperature and/or surface temperatures only. This verifies that the frequencies are
global properties and associated with the temperature distribution of the entire
structure. Therefore, consideration of temperature distribution of a whole structure will
lead to more accurate results of the temperature effect on the vibration properties of the
structure.
Temperature effect on steel bar is not considered in the paper. One reason lies in that
temperature coefficient of Young’s modulus of steel θE = 3.6×10⁻⁴/◦C [30], which is
much smaller than that of concrete as 0.003 [29].
ACKNOWLEDGEMENTS
The work performed in this paper is supported by the Hong Kong Polytechnic
University Niche Areas Fund (Project No. 1-BB6G) and Shenzhen University Basic
Research Grant (Project No. 201045).

19
REFERENCES
[1] Doebling SW, Farrar CR Prime MB. A summary review of vibration-based
damage identification methods. The Shock and Vibration Digest 1998;
30(2):91-105.
[2] Sohn H, Farrar CR, Hemez FM, Shunk DD, Stinemates DW, Nadler BR. A
review of structural health monitoring literature: 1996-2001. Los Alamos
National Laboratory Report LA-13976-MS. Los Alamos National Laboratory;
2003.
[3] Xia Y, Hao H, Deeks AJ. Dynamic assessment of shear connectors in slab-girder
bridges. Engineering Structures 2007; 29 (7): 1475-1486.
[4] Zhou HF, Ni YQ, Ko JM. Constructing input to neural networks for modeling
temperature-caused modal variability: Mean temperatures, effective
temperatures, and principal components of temperatures, Engineering Structures
2010; 32 (6): 1747-1759.
[5] Salawu OS. Detection of structural damage through changes in frequency: a
review. Engineering Structures 1997; 19(9):718-23.
[6] Kim JT, Park, JH, Lee, BJ. Vibration-based damage monitoring in model
plate-girder bridges under uncertain temperature conditions. Engineering
Structures 2007; 29 (7): 1354-1365.
[7] Askegaard V, Mossing P. Long term observation of RC-bridge using changes in
natural frequency. Nordic Concrete Research 1988; 7:20-7.
[8] Cornwell P, Farrar CR, Doebling SW, Sohn H. Environmental variability of
modal properties. Experimental Techniques 1999; 23(6):45-8.
[9] Peeters B, De Roeck G. One-year monitoring of the Z24-Bridge: Environmental
effects versus damage events. Earthquake Engineering and Structural Dynamics
2001; 30(2):149-71.

20
[10] Desjardins SL, Londono NA, Lau DT, Khoo H. Real-time data processing,
analysis and visualization for structural monitoring of the confederation bridge.
Advances in Structural Engineering 2006; 9 (1): 141-157.
[11] Song W. Dyke SJ. Ambient vibration based modal identification of the Emerson
bridge considering temperature effects. In: 4th World Conference on Structural
Control and Monitoring. 2006 July 11-13, San Diego, USA.
[12] Ni YQ, Hua XG, Fan KQ, Ko JM. Correlating modal properties with
temperature using long-term monitoring data and support vector machine
technique. Engineering Structures 2005; 27(12):1762-1773.
[13] Ni YQ, Ko JM, Hua XG, Zhou HF. Variability of measured modal frequencies of
a cable-stayed bridge under different wind conditions. Smart Structures and
Systems 2007; 3 (3): 341-356.
[14] Fu Y, DeWolf JT. Monitoring and Analysis of a Bridge with Partially Restrained
Bearings. Journal of Bridge Engineering, ASCE 2001; 6 (1): 23–29.
[15] Liu CY, DeWolf JT. Effect of Temperature on Modal Variability of a Curved
Concrete Bridge under Ambient Loads. Journal Structural Engineering, ASCE
2007; 133 (12): 1742-1751.
[16] Breccolotti M, Franceschini G, Materazzi AL. Sensitivity of Dynamic Methods
for Damage Detection in Structural Concrete Bridges. Shock and Vibration 2004;
11: 383–394.
[17] Macdonald JHG, Daniell WE. Variation of Modal Parameters of a Cable-stayed
Bridge Identified from Ambient Vibration Measurements and FE Modelling.
Engineering Structures 2005; 27 (13): 1916-1930.
[18] Nayeri RD, Masri SF, Ghanem RG, Nigbor RL. A Novel Approach for the
Structural Identification and Monitoring of a Full-Scale 17-Story Building based
on Ambient Vibration Measurements. Smart Materials and Structures 2008; 17
(2): 1-19.
[19] Balmes E, Basseville M, Bourquin F, Mevel L, Nasser H, Treyssede F. Merging
Sensor Data from Multiple Temperature Scenarios for Vibration Monitoring of
Civil Structures. Structural Health Monitoring 2008; 7 (2): 129-142.

21
[20] Xia Y, Hao H, Zanardo G, Deeks A. Long term vibration monitoring of an RC
slab: Temperature and humidity effect. Engineering Structures 2006; 28
(3):441-52.
[21] National Standards of PRC, Code for design of concrete structures. GB
50010-2002, 2002, in Chinese.
[22] Ewins DJ. Modal Testing – Theory, Practice and Application. Research Studies
Press Ltd: Baldock, Hertfordshire, UK; 2000.
[23] ANSYS 8.1. Southpointe (PA, USA): ANSYS Inc.; 2004.
[24] Rohsenow WM. Handbook of heat transfer applications. New York:
McGraw-Hill, 1988.
[25] National Standards of PRC, Thermal design code for civil buildings,
GB50176-93, 1993, in Chinese
[26] Elbadry MM, Ghali A. Temperature Variations in Concrete Bridges. Journal of
Structural Engineering, ASCE 1983; 109 (10): 2355-2374.
[27] Fu HC, Ng SF, Cheung MS. Thermal Behavior of Composite Bridges. Journal
Structural Engineering, ASCE 1990; 116 (12): 3302-3323.
[28] Kottegoda NT, Rosso R. Statistics, Probability, and Reliability for Civil and
Environmental Engineers. McGraw-Hill Companies, Inc.; 1997.
[29] CEB-FIP. Model Code 1990. London: Thomas Telford; 1993.
[30] Brockenbrough RL, Merritt, FS. Structural Steel Designer’s Handbook, 2nd ed.,
New York, McGraw-Hill; 1994.

22
Fig. 1a. The RC slab
Fig. 1b. Positioning thermocouples inside the slab
50 m
m50
mm
700
mm
Fig. 1c. Plan position of the sensors
Thermocouples
(T1~T7)
Thermocouples
(T1~T7)
Thermocouples
(T9~T11)Accelerometers

23
06:00 08:00 10:00 12:00 14:00 16:00 18:00 20:00 22:00 00:00 02:00 04:00 06:0017
19
21
23
25
27
29
31
33
35
3738
Time (hh:mm)
Tem
pera
ture
(C
)
T1T2T3T4T5T6T7Air temp
Fig. 2. Variation of the temperatures at the slab in a 24-hour period
(air temp: ambient temperature)

24
06:00 10:00 14:00 18:00 22:00 02:00 06:00
20
25
30
35
Time (Hour)
Tem
pera
ture
(C
entig
rade
deg
ree)
center-upcenter-midcenter-downcorner-upcorner-midcorner-down
Fig. 3. Comparison between the temperatures at the center
and the temperatures at the corner of the slab

25
17 20 23 26 29 32 35 380
20
40
60
80
100
120Time 07:00
Loc
atio
n (m
m)
T emperature (C)
17 20 23 26 29 32 35 380
20
40
60
80
100
120Time 09:00
Loc
atio
n (m
m)
T emperature (C)
17 20 23 26 29 32 35 380
20
40
60
80
100
120Time 11:00
Loc
atio
n (m
m)
T emperature (C)
17 20 23 26 29 32 35 380
20
40
60
80
100
120Time 13:00
Loc
atio
n (m
m)
T emperature (C)
17 20 23 26 29 32 35 380
20
40
60
80
100
120Time 15:00
Loc
atio
n (m
m)
T emperature (C)
17 20 23 26 29 32 35 380
20
40
60
80
100
120Time 17:00
Loc
atio
n (m
m)
T emperature (C)
17 20 23 26 29 32 35 380
20
40
60
80
100
120Time 23:00
Loc
atio
n (m
m)
T emperature (C)
17 20 23 26 29 32 35 380
20
40
60
80
100
120Time 05:00
Loc
atio
n (m
m)
T emperature (C)
Fig. 4. Temperature distribution along the thickness direction of the slab at different time

26
Fig. 5 Finite element model of the slab constructed with ANSYS
27
15
20
25
30
35
40Point 1
6:0024:0018:0012:00
Tem
per
atu
re (
deg
ree)
Time (Hour)
Measured result Numerical result 1 Numerical result 2
6:00
15
20
25
30
35
40Point 2
6:0024:0018:0012:00
Tem
per
atu
re (
deg
ree)
Time (Hour)
Measured result Numerical result 1 Numerical result 2
6:00
15
20
25
30
35
40Point 3
6:0024:0018:0012:00
Tem
per
atu
re (
deg
ree)
Time (Hour)
Measured result Numerical result 1 Numerical result 2
6:0015
20
25
30
35
40Point 4
6:0024:0018:0012:00
Tem
per
atu
re (
deg
ree)
Time (Hour)
Measured result Numerical result 1 Numerical result 2
6:00
15
20
25
30
35
40Point 5
6:0024:0018:0012:00
Tem
per
atu
re (
deg
ree)
Time (Hour)
Measured result Numerical result 1 Numerical result 2
6:0015
20
25
30
35
40Point 6
6:0024:0018:0012:00
Tem
per
atu
re (
deg
ree)
Time (Hour)
Measured result Numerical result 1 Numerical result 2
6:00
15
20
25
30
35
40Point 7
6:0024:0018:0012:00
Tem
per
atu
re (
deg
ree)
Time (Hour)
Measured result Numerical result 1 Numerical result 2
6:00
Fig. 6 Comparison of temperature data: model prediction vs. measurement

28
00.5
11.5
2
2.53
00.2
0.40.6
0.80
0.10.20.3
Mode: 1 Freq = 19.92 Hz Damping = 1.25 %
X (m)Y (m)
Mod
e Sh
ape
00.5
11.5
22.5
3
00.2
0.40.6
0.8-0.3
-0.150
0.150.3
Mode: 2 Freq = 82.16 Hz Damping = 1.25 %
X (m)Y (m)
Mod
e Sh
ape
00.5
11.5
22.5
3
00.2
0.40.6
0.8-0.3
-0.150
0.150.3
Mode: 3 Freq = 93.82 Hz Damping = 1.62 %
X (m)Y (m)
Mod
e Sh
ape
00.5
11.5
22.5
3
00.2
0.40.6
0.8-0.3
-0.150
0.150.3
Mode: 4 Freq = 153.07 Hz Damping = 0.67 %
X (m)Y (m)
Mod
e Sh
ape
Fig. 7 The measured first four mode shapes of the slab

29
19.65
19.70
19.75
19.80
19.85
19.90
19.95
20.00
20.05
20.10
20.15
17.00
19.00
21.00
23.00
25.00
27.00
29.00
31.00
33.00
35.00
37.00
8:00 9:00 10:00 11:00 12:00 13:00 14:00 15:00 16:00 17:00 18:00 19:00 20:00 21:00 22:00
Tem
per
atu
re
Time (hh:mm)
Temperature-Top
Temperature-Bottom
Frequency
Fig. 8 Variation of the first frequency versus temperatures
Tem
pera
ture
(o C
)
30
0
0.2
0.4
0.6
0.8
1
1.2
1.4
1.6
1.8
2
8:00 9:00 10:00 11:00 12:00 13:00 14:00 15:00 16:00 17:00 18:00 19:00 20:00 21:00 22:00
Time
Dam
ping
rat
io (
%)
1st mode
2nd mode
Fig. 9 Variation of the damping ratios

31
8:00 9:00 10:0011:0012:0013:0014:0015:0016:0017:0018:0019:0020:0021:0022:00
97.9
98.2
98.5
98.8
99.1
99.4
99.7
100
Time (hh:mm)
Freq
uenc
y va
riat
ion
ratio
(%
)
MeasurementTheory
Fig. 10 Comparison of the frequency variation between the measurement and numerical analysis (the 1st bending mode)
8:00 10:00 12:00 14:00 16:00 18:00 20:00 22:0097.0
97.3
97.6
97.9
98.2
98.5
98.8
99.1
99.4
99.7
100.0
100.3
Fre
qu
ency
var
iati
on
rat
io (
%)
Time (hh:mm)
Measurement Theory
8:00 10:00 12:00 14:00 16:00 18:00 20:00 22:0097.0
97.3
97.6
97.9
98.2
98.5
98.8
99.1
99.4
99.7
100.0
Fre
qu
ency
va
ria
tio
n r
ati
o (
%)
Time (hh:mm)
Measurement Theory
(a) The 2nd bending frequency (b) The 3rd bending frequency
Fig. 11 Comparison of the frequency variation between the measurement and numerical analysis (the 2nd and 3rd bending modes)

32
Table 1. The solar irradiation on the slab at different time
Time Solar intensity at top
surface (W/m2) Solar intensity at bottom
surface (W/m2)
06:00 am 1.0 2.3
07:00 am 6.9 29.0 08:00 am 56.6 52.2 09:00 am 223.8 60.8 10:00 am 403.7 64.8 11:00 am 550.2 66.7 12:00 pm 644.4 67.2 13:00 pm 676.7 66.7 14:00 pm 106.7 64.8 15:00 pm 103.7 60.8 16:00 pm 97.3 52.2 17:00 pm 83.5 29.0 18:00 pm 46.4 1.2