Variation of Lateral Ventricular Volume During the Cardiac ...
5
Ellen Lee 1 Jin-zhao Wang Reuben Mezrich Received December 30, 1988; rev1s1on re- quested March 1, 1989; revision received Apri118, 1989; accepted April25, 1989. 1 All authors: Laurie Imaging Center, Robert Wood Johnson Medical School, 141 French St., New Brunswick, NJ 08901 . Address reprint re- quests to R. Mezrich. 01 95-6108{89{1006-1145 © American Society of Neuroradiology 1145 Variation of Lateral Ventricular Volume During the Cardiac Cycle Observed by MR Imaging CSF pulsation suggests variation in the size of the cerebral ventricles during the cardiac cycle. The arterial blood flow and venous outflow are two major components that contribute to the variation. High-resolution MR imaging with cardiac gating provides sharp delineation of the cerebral ventricles with clear boundaries. Subtle changes in the size of the ventricles the cardiac cycle are measurable with high precision and accuracy- 15y using a sophisticated automated edge-detection algorithm. In 12 normal individuals, the cerebral ventricles were examined, and the size of the lateral ventricles a 10-20% change duri_ryg the cardiac cycle. The paHern is complex but similar in appearance to the intrac_l"anial pressure pulse waveform. The variation suggests that the choroid plexus may·piay a greater role as a source of CSF pulsation than currently acknowledged. The ability to measure the variations in ventricular volume has clinical implication as a noninvasive method for the diagnosis of diseases with abnormal brain elasticity. AJNR 10:1145-1149, November/December 1989 The observation of CSF pulsation suggests variation in the size of the cerebral ventricles during the cardiac cycle. The arterial blood flow and venous outflow are two major factors that contribute to the variation. It is generally accepted that CSF pulsation is arterial in origin [1-3]. However, the exact mechanism is uncertain. In 1962, Bering [1] proposed that CSF is circulated actively by the choroid plexuses, which generate their pump force as they fill with blood with each arterial pulse. In 1972, du Boulay et al. [2] thought brain expansion with medial motion of the thalami was squeezing the third ventricle, and was the mechanical source of the CSF pump. Most recently, Feinberg and Mark [3] presented the model that the arterial pulse wave from the cardiac pump was translated into a radially directed inward force in the cerebral cortex, which is opposed transversely by the corpus callosum. With the advent of MR, new imaging capabilities are possible. Cardiac-gated, high-resolution MR allows sharp delineation of the cerebral ventricles with clear boundaries. Mark et al. [4] examined the variation of ventricular size during the cardiac cycle with MR by measuring the dimensions of the ventricles with a ruler. They reported no measurable change in the size of the lateral ventricles and an isometric change in the third ventricle. However, it is now possible to measure subtle changes in the size of the ventricles during the cardiac cycle with high precision and accuracy by using a sophisticated automated edge-detection algo- rithm. This algorithm is one of the functions we have implemented in image processing software on the Macintosh II [5]. In this investigation, our purpose was to determine the variation of the size of the cerebral ventricles during the cardiac cycle in normal individuals. This would add to the understanding of the nature of CSF pulsation, and be the first in a series of studies to apply this phenomenon clinically.
Transcript of Variation of Lateral Ventricular Volume During the Cardiac ...

Ellen Lee1
Jin-zhao Wang Reuben Mezrich
Received December 30, 1988; rev1s1on requested March 1, 1989; revision received Apri118, 1989; accepted April25, 1989.
1 All authors: Laurie Imaging Center, Robert Wood Johnson Medical School, 141 French St., New Brunswick, NJ 08901 . Address reprint requests to R. Mezrich.
01 95-6108{89{1006-1145 © American Society of Neuroradiology
1145
Variation of Lateral Ventricular Volume During the Cardiac Cycle Observed by MR Imaging
CSF pulsation suggests variation in the size of the cerebral ventricles during the cardiac cycle. The arterial blood flow and venous outflow are two major components that contribute to the variation. High-resolution MR imaging with cardiac gating provides sharp delineation of the cerebral ventricles with clear boundaries. Subtle changes in the size of the ventricles ~uring the cardiac cycle are measurable with high precision and accuracy-15y using a sophisticated automated edge-detection algorithm. In 12 normal individuals, the cerebral ventricles were examined, and the size of the lateral ventricles s~owed a 10-20% change duri_ryg the cardiac cycle. The paHern is complex but similar in appearance to the intrac_l"anial pressure pulse waveform. The variation suggests that the choroid plexus may·piay a greater role as a source of CSF pulsation than currently acknowledged.
The ability to measure the variations in ventricular volume has clinical implication as a noninvasive method for the diagnosis of diseases with abnormal brain elasticity.
AJNR 10:1145-1149, November/December 1989
The observation of CSF pulsation suggests variation in the size of the cerebral ventricles during the cardiac cycle. The arterial blood flow and venous outflow are two major factors that contribute to the variation. It is generally accepted that CSF pulsation is arterial in origin [1-3]. However, the exact mechanism is uncertain. In 1962, Bering [1] proposed that CSF is circulated actively by the choroid plexuses, which generate their pump force as they fill with blood with each arterial pulse. In 1972, du Boulay et al. [2] thought brain expansion with medial motion of the thalami was squeezing the third ventricle, and was the mechanical source of the CSF pump. Most recently, Feinberg and Mark [3] presented the model that the arterial pulse wave from the cardiac pump was translated into a radially directed inward force in the cerebral cortex, which is opposed transversely by the corpus callosum.
With the advent of MR, new imaging capabilities are possible. Cardiac-gated, high-resolution MR allows sharp delineation of the cerebral ventricles with clear boundaries. Mark et al. [4] examined the variation of ventricular size during the cardiac cycle with MR by measuring the dimensions of the ventricles with a ruler. They reported no measurable change in the size of the lateral ventricles and an isometric change in the third ventricle. However, it is now possible to measure subtle changes in the size of the ventricles during the cardiac cycle with high precision and accuracy by using a sophisticated automated edge-detection algorithm. This algorithm is one of the functions we have implemented in image processing software on the Macintosh II [5].
In this investigation, our purpose was to determine the variation of the size of the cerebral ventricles during the cardiac cycle in normal individuals. This would add to the understanding of the nature of CSF pulsation, and be the first in a series of studies to apply this phenomenon clinically.
1146 LEE ET AL. AJNR:1 0, November/December 1989
Materials and Methods
Twelve normal individuals, 22 to 33 years old (mean, 25 years), were examined on the Teslacon II Technicare 0.6-T system. Sagittal views were first obtained as localizers for the coronal slices. Cardiacgated coronal images of the brain were obtained on all individuals. The cerebral ventricles were imaged from the genu to the splenium of the corpus callosum. In eight individuals, seven slices of 7.5-mm thickness (two with 1.0 x 1.0-mm pixels and six with 0.8-mm pixels) were obtained at seven different time intervals. In two individuals, eight slices of 7.5-mm thickness (0.8 x 0.8-mm pixels) were obtained at eight different time intervals. In two individuals, only six 1-cm-thick slices (0.8 x 0.8 mm) were obtained at six different time intervals. There was a 20% (of slice thickness) gap between each section obtained. The TR and TE were set at 500 and 30, respectively. There were four excitations for each image. The cardiac delay ranged from 0 to 500 msec after R wave. The R-R intervals were recorded to obtain an average for each individual. The R-R interval varied from 850 to 1100 msec.
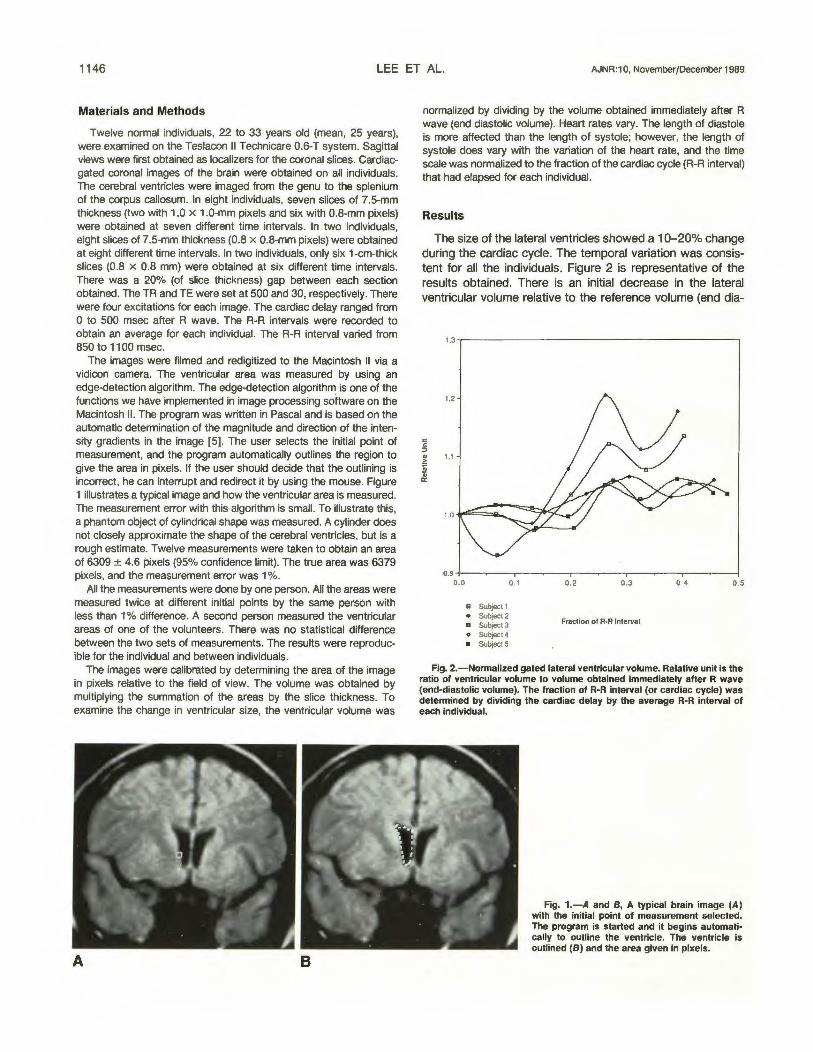
The images were filmed and redigitized to the Macintosh II via a vidicon camera. The ventricular area was measured by using an edge-detection algorithm. The edge-detection algorithm is one of the functions we have implemented in image processing software on the Macintosh II. The program was written in Pascal and is based on the automatic determination of the magnitude and direction of the intensity gradients in the image [5]. The user selects the initial point of measurement, and the program automatically outlines the region to give the area in pixels. If the user should decide that the outlining is incorrect, he can interrupt and redirect it by using the mouse. Figure 1 illustrates a typical image and how the ventricular area is measured. The measurement error with this algorithm is small. To illustrate this, a phantom object of cylindrical shape was measured. A cylinder does not closely approximate the shape of the cerebral ventricles, but is a rough estimate. Twelve measurements were taken to obtain an area of 6309 ± 4.6 pixels (95% confidence limit). The true area was 6379 pixels, and the measurement error was 1 %.
All the measurements were done by one person. All the areas were measured twice at different initial points by the same person with less than 1% difference. A second person measured the ventricular areas of one of the volunteers. There was no statistical difference between the two sets of measurements. The results were reproducible for the individual and between individuals.
The images were calibrated by determining the area of the image in pixels relative to the field of view. The volume was obtained by multiplying the summation of the areas by the slice thickness. To examine the change in ventricular size, the ventricular volume was
A B
normalized by dividing by the volume obtained immediately after R wave (end diastolic volume). Heart rates vary. The length of diastole is more affected than the length of systole; however, the length of systole does vary with the variation of the heart rate, and the time scale was normalized to the fraction of the cardiac cycle (R-R interval) that had elapsed for each individual.
Results
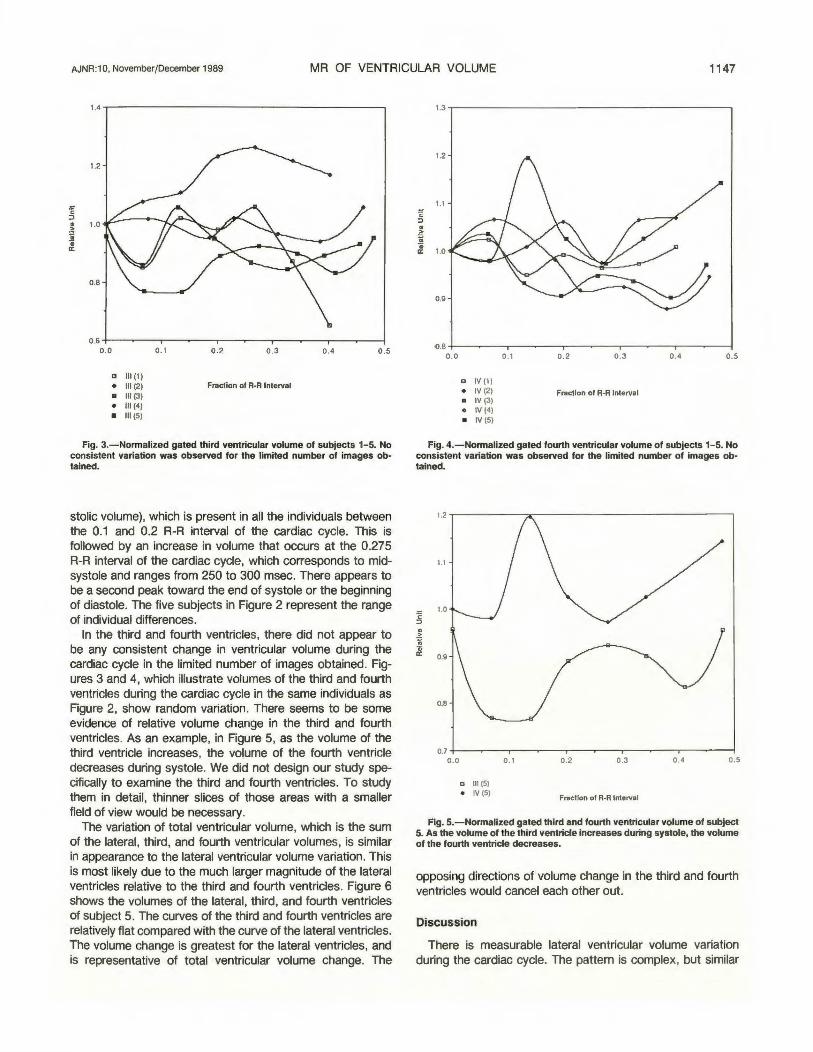
The size of the lateral ventricles showed a 1 0-20% change during the cardiac cycle. The temporal variation was consistent for all the individuals. Figure 2 is representative of the results obtained. There is an initial decrease in the lateral ventricular volume relative to the reference volume (end dia-
1.3...----------------------,
0.9 +--~--.---~--.--~---,-~~-.--~----1 0.0 0.1
m Subject 1 • Subject 2 a Subject3 o Subject4 • Subject 5
0.2 0.3
Fraction of R·R Interval
0.4 0.5
Fig. 2.-Normalized gated lateral ventricular volume. Relative unit is the ratio of ventricular volume to volume obtained immediately after R wave (end-diastolic volume). The fraction of R-R interval (or cardiac cycle) was detennined by dividing the cardiac delay by the average R-R interval of each individual.
Fig. 1.-A and S, A typical brain image (A) with the initial point of measurement selected. The program is started and it begins automatically to outline the ventricle. The ventricle is outlined (S) and the area given in pixels.
AJNR:10, November/December 1989 MR OF VENTRICULAR VOLUME 1147
0.0
.. 111(1) • Ill (2) a 111(3) • 111(4) • 111(5)
0. 1 0.2 0.3 0 .4 0.5
Fraction of R-R Interval
Fig. 3.-Normalized gated third ventricular volume of subjects 1-5. No consistent variation was observed for the limited number of images obtained.
stolic volume), which is present in all the individuals between the 0.1 and 0.2 R-R interval of the cardiac cycle. This is followed by an increase in volume that occurs at the 0.275 R-R interval of the cardiac cycle, which corresponds to midsystole and ranges from 250 to 300 msec. There appears to be a second peak toward the end of systole or the beginning of diastole. The five subjects in Figure 2 represent the range of individual differences.
In the third and fourth ventricles, there did not appear to be any consistent change in ventricular volume during the cardiac cycle in the limited number of images obtained. Figures 3 and 4, which illustrate volumes of the third and fourth ventricles during the cardiac cycle in the same individuals as Figure 2, show random variation. There seems to be some evidence of relative volume change in the third and fourth ventricles. As an example, in Figure 5, as the volume of the third ventricle increases, the volume of the fourth ventricle decreases during systole. We did not design our study specifically to examine the third and fourth ventricles. To study them in detail, thinner slices of those areas with a smaller field of view would be necessary.
The variation of total ventricular volume, which is the sum of the lateral, third, and fourth ventricular volumes, is similar in appearance to the lateral ventricular volume variation. This is most likely due to the much larger magnitude of the lateral ventricles relative to the third and fourth ventricles. Figure 6 shows the volumes of the lateral, third, and fourth ventricles of subject 5. The curves of the third and fourth ventricles are relatively flat compared with the curve of the lateral ventricles. The volume change is greatest for the lateral ventricles, and is representative of total ventricular volume change. The
0.0
., IV (1) • IV (2) a IV (3) o IV (4) • IV (5)
0.1 0.2 0.3 0.4 0.5
Fraction of R-R Interval
Fig. 4.-Normalized gated fourth ventricular volume of subjects 1-5. No consistent variation was observed for the limited number of images obtained.
0.0
D 111(5) o IV (5)
0.1 0.2 0.3 0.4 0.5
Fraction of R-R Interval
Fig. 5.-Normalized gated third and fourth ventricular volume of subject 5. As the volume of the third ventricle increases during systole, the volume of the fourth ventricle decreases.
opposing directions of volume change in the third and fourth ventricles would cancel each other out
Discussion
There is measurable lateral ventricular volume variation during the cardiac cycle. The pattern is complex, but similar

1148 LEE ET AL. AJNR: 1 0, November/December 1989
M E 0
c
"' E .2 0 >
10
5
0.0 0.1
o Total Volume
• Lateral a Ill o IV
0.2 0.3 0.4 0.5
Fraction of R-R Interval
Fig. 6.-Gated total, lateral, third, and fourth ventricular volumes. The curves of the total and lateral ventricles are similar. The curves of the third and fourth ventricles are relatively flat.
in appearance to the intracranial pressure pulse waveform [6, 7]. Figure 7 illustrates the pressure pulse waveform in a normal individual. The first peak (P1) is generated by arterial input within the cranial cavity. The following peaks result from a water-hammer phenomenon [8] arising from the venous side of the vascular bed. Cyclic compression of the superior sagittal sinus by CSF pulsation results in sudden cessation of flow, which generates a force equivalent to the kinetic energy divided by the change in time. This could well explain the two peaks observed in the variation of the lateral ventric-
ECG
R
0.3 Time
Frection of R-R lntervel
Fig. 7.-Typical pressure pulse waveform in a normal individual relative toECG.
ular volume. The first peak occurs during mid-systole and is of arterial origin. The second peak occurs at the end of systole and may be of venous origin. A broader study to include the entire cardiac cycle may produce more peaks associated with the venous system.
It is commonly accepted that the CSF pulsation is of arterial origin, because of the timing in relation to the carotid pulses and ECG, the character of the pulse wave, and its alteration by obstruction elsewhere in the vascular system [2]. However, there is still uncertainty regarding the mechanism. Is it the arterial flow into the cranial cavity causing brain expansion and an inward radial force to the ventricles [2, 3] or is it the choroid plexuses' expansion from the arterial flow resulting in an outward force [1, 9]? The initial decrease in ventricular volume would correspond to an inward force secondary to blood flow into the brain and brain expansion. For the midsystolic increase in the ventricular volume, the mechanism would be an outward force within the ventricles such as could arise from the expansion of the choroid plexus. This increase in volume relative to the end diastolic volume during systole may be an indication that the choroid plexus plays a greater role in CSF pulsation than currently believed. The lateral ventricular volume contains the largest amount of choroid plexus and has the largest variation of volume during the cardiac cycle. The volume of the third ventricle appears to increase with systole, and it also houses the choroid plexus. However, the volume of the fourth ventricle appears to decrease with systole and contains relatively little choroid plexus. The fourth ventricle, by its location, may be affected by the surrounding vascular expansion much more than the other ventricles. We propose the model that arterial blood flow to the choroid plexuses results in expansion of the choroid plexuses with lateral and third ventricular volume expansion, but not fourth ventricular volume expansion, and may be responsible for CSF pulsation.
The relationship between pressure and volume is a function of elasticity [1 0]. The ventricular volume variation can be used as an indication of the elastic response of the ventricles and surrounding brain. Therefore, it would be helpful in the diagnosis of diseases in which brain elasticity is abnormal. This would be a noninvasive method for differentiating hydrocephalus, especially normal pressure hydrocephalus, from atrophy. It may also be applied to evaluate the success of surgery in relief of hydrocephalus.
Stroke volume of the cerebral ventricles can also be calculated by subtracting the end diastolic volume from the midsystolic volume. This may be used as a numerical criterion for evaluating disease. The stroke volumes of the subjects in this study are comparable to the value given by du Boulay [2], which is on the order of 1 cm3
.
In conclusion, there is a 1 0-20% change in lateral ventricular volume during the cardiac cycle in normal individuals. This pattern is similar to the pressure pulse waveform. The increase in ventricular volume supports a greater role for the choroid plexus as a source of CSF pulsation. The variation has clinical implication for the diagnosis of diseases associated with abnormal brain elasticity. Our next study will examine the lateral ventricles of patients with hydrocephalus.

AJNR:1 0, November/December 1989 MR OF VENTRICULAR VOLUME 1149
The accuracy of these continuing studies will be improved by implementing a system for direct digital transfer of images from the MR system to the Macintosh, and with the use of thinner slices in order to improve spatial definition.
REFERENCES
1. Bering RA. Circulation of cerebrospinal fluid. J Neurosurg 1962; 19: 405-413
2. du Boulay GH, O'Connell J, Currie J, Bostick T, Verity P. Further investigation of pulsatile movements in the cerebrospinal fluid pathways. Acta Radio/ Diagn [Stockh]1972;13:496-523
3. Feinberg DA, Mark AS. Human brain motion and cerebrospinal fluid circulation demonstrated with MR velocity imaging. Radiology 1987;163: 793-799
4. Mark AS, Feinberg DA, Brant-Zawadzki MN. Change in size and magnetic resonance signal intensity of the cerebral CSF spaces during the cardiac cycle as studied by gated, high resolution magnetic resonance imaging. Invest Radio/1987;22:290-297
5. Wang J, Mezrich RS, Welkowitz W. Model based cardiac characterization by MRI. In Sideman S, Bayer R, eds. Analysis and simulation of the cardiac system: inhomogeneity and imaging. Boca Raton: CRC Press, 1989
6. Beks J. Intracranial Pressure Ill. New York: Springer-Verlag, 1976 7. Kuramoto S, Moritaka K, Hayashi T, Honda E, Shojima T. Noninvasive
measurement in intracranial pressure and analysis of the pulse waveform. Neural Res 1986;8:93-96
8. Dardenne G, Dereymaeker A, Lacheron JM. Cerebrospinal fluid pressure and pulsatility. Eur Neuro/1969;2:193-216
9. Wilson CB, Bertan V. Interruption of the anterior choroidal artery in experimental hydrocephalus. Arch Neuro/1967;17:614-619
10. Sklar FH, Diehl JT, Beyer CW, Clark WK. Brain elasticity changes with ventriculomegaly. J Neurosurg 1980;53:173-179