Variation Analysis of Tooth Engagement and Load Sharing in Involute Splines · 2014-07-17 ·...
9
GEAR TECHNOLOGY June 2010 www.geartechnology.com 54 Management Summary Involute spline couplings are used to transmit torque from a shaft to a gear hub or other rotating component. External gear teeth on the shaft engage an equal number of internal teeth in the hub. Because multiple teeth engage simultaneously, they can transmit much larger torques than a simple key and keyway assembly. However, manufactur- ing variations affect the clearance between each pair of mating teeth, resulting in only partial engagement. A new model for tooth engagement—based on statistics—predicts that the teeth engage in a sequence, determined by the individual clearances. As the shaft load is applied, the tooth pair with the smallest clearance engages first and then deflects as the load increases, until the second pair engages. The two engaged pairs deflect together until a third pair engages, and so on, until the full load is reached. Thus, only a subset of teeth carries the load. In addition, the load is non-uniformly distributed, with the first tooth carrying the greatest share. As a consequence, the load capacity of spline couplings is greatly reduced, and yet still greater than a single keyway. The statistical model predicts the average number of teeth that will engage for a specified load—plus or minus the expected variation. It also quantitatively predicts the load and stress in each engaged pair. Critical factors in the model are the stiffness and deflection of a single tooth pair and the characterization of the clearance. Detailed finite element analyses (FEAs) were conducted to verify the tooth deflections and engagement sequence. The closed-form statistical results were verified with intensive Monte Carlo simulations (MCSs). The more accurate model has led to increased understanding of the mechanics of involute spline couplings, while providing better prediction tools for designers and improved performance of their designs. Introduction An involute spline coupling con- sists of a shaft with machined gear teeth on its exterior, mated to a hub with a matching set of interior teeth, as shown in Figure 1. They are found in gear trains, transmissions, pumps Variation Analysis of Tooth Engagement and Load Sharing in Involute Splines Kenneth W. Chase, Carl D. Sorensen and Brian DeCaires (Printed with permission of the copyright holder—the American Gear Manufacturers Association, 500 Montgomery Street, Suite 350, Alexandria, Virginia 22314-1560. Statements presented in this paper are those of the author(s) and may not represent the position or opinion of the American Gear Manufacturers Association.) and many other rotating machines. The involute profile makes them self-cen- tering. The transmitted torque is dis- tributed over the teeth, decreasing the load on any one tooth. It is therefore superior to a single key and keyway assembly in that it results in lighter, more efficient shaft designs. In theory, the full ring of gear teeth on the shaft engage with an equal num- ber of teeth in the hub, resulting in the load being equally distributed over all the teeth. But in practice, only a frac- tion actually transmits the load. Due to
Transcript of Variation Analysis of Tooth Engagement and Load Sharing in Involute Splines · 2014-07-17 ·...

GEARTECHNOLOGY June 2010 www.geartechnology.com54
Management Summary
Involute spline couplings are used to transmit torque from a shaft to a gear hub or other rotating component. External gear teeth on the shaft engage an equal number of internal teeth in the hub. Because multiple teeth engage simultaneously, they can transmit much larger torques than a simple key and keyway assembly. However, manufactur-ing variations affect the clearance between each pair of mating teeth, resulting in only partial engagement.
A new model for tooth engagement—based on statistics—predicts that the teeth engage in a sequence, determined by the individual clearances. As the shaft load is applied, the tooth pair with the smallest clearance engages first and then deflects as the load increases, until the second pair engages. The two engaged pairs deflect together until a third pair engages, and so on, until the full load is reached. Thus, only a subset of teeth carries the load. In addition, the load is non-uniformly distributed, with the first tooth carrying the greatest share. As a consequence, the load capacity of spline couplings is greatly reduced, and yet still greater than a single keyway.
The statistical model predicts the average number of teeth that will engage for a specified load—plus or minus the expected variation. It also quantitatively predicts the load and stress in each engaged pair. Critical factors in the model are the stiffness and deflection of a single tooth pair and the characterization of the clearance. Detailed finite element analyses (FEAs) were conducted to verify the tooth deflections and engagement sequence. The closed-form statistical results were verified with intensive Monte Carlo simulations (MCSs).
The more accurate model has led to increased understanding of the mechanics of involute spline couplings, while providing better prediction tools for designers and improved performance of their designs.
IntroductionAn involute spline coupling con-
sists of a shaft with machined gear teeth on its exterior, mated to a hub with a matching set of interior teeth, as shown in Figure 1. They are found in gear trains, transmissions, pumps
Variation Analysis of Tooth
Engagement and Load Sharing in
Involute SplinesKenneth W. Chase, Carl D. Sorensen and Brian DeCaires
(Printed with permission of the copyright holder—the American Gear Manufacturers Association, 500 Montgomery Street, Suite 350, Alexandria, Virginia 22314-1560. Statements presented in this paper are those of the author(s) and may not represent the position or opinion of the American Gear Manufacturers Association.)
and many other rotating machines. The involute profile makes them self-cen-tering. The transmitted torque is dis-tributed over the teeth, decreasing the load on any one tooth. It is therefore superior to a single key and keyway assembly in that it results in lighter,
more efficient shaft designs.In theory, the full ring of gear teeth
on the shaft engage with an equal num-ber of teeth in the hub, resulting in the load being equally distributed over all the teeth. But in practice, only a frac-tion actually transmits the load. Due to

www.geartechnology.com June 2010 GEARTECHNOLOGY 55
manufacturing variations—even with precision gear hobbing processes—only a fraction of spline teeth engage. Splines, therefore, perform far below their theoretical capacity. Designers commonly assume only 1/4 to 1/2 of the teeth carry the full load. They also approximate the load as uniformly dis-tributed among the load-bearing pairs of teeth. These assumptions are often satisfactory, but can lead to early fail-ures when applied to high load applica-tions.
Consider an extreme application: the multi-disk brakes on an industrial mining dump truck, shown in Figure 2. The tires on this behemoth are 13 feet in diameter. The driver climbs two sto-ries to the cab. It hauls loads up to 380 tons over challenging terrain. Stopping at any speed punishes the brakes.
The multi-disk brake assembly con-sists of a set of friction plates—sepa-rated by pressure plates—as shown in Figure 3a. Friction plates are splined on the inside circumference and engage the shaft spline. Pressure plates are splined on the outside circumference and engage the non-rotating hub. The brake is actuated by a ring of hydraulic pistons that clamp the pressure plates to provide braking force. The piston cylinders can be seen on the brake assembly in Figure 3b.
The spline couplings must trans-mit the high braking forces to the hub. Examination of failed plates revealed cracks at the base of the teeth—an indi-cation of bending fatigue failure. Failed tooth fragments can jam between the plates or block cooling passages, pos-sibly leading to complete failure. Also, uneven wear was observed, suggesting unequal tooth loads.
A desire for a better understand-ing of the mechanics of tooth engage-ment led to the current study. Concerns focus on the effect of variation on the load distribution within an involute spline joint. Insights leading to more reliable designs were sought.
The objectives of the research reported here include:
• Develop a statistical model to predict tooth engagement and
continued
Figure 1—Involute splines.
Figure 2—Industrial mining truck (courtesy Caterpillar, Inc.).
Figure 3—Multi-disk brake assembly (courtesy Caterpillar, Inc.).
loads• Investigate the effects of
tooth clear ance variations on spline performance
• Estimate tooth load sharing and stresses
• Verify the tooth engagement model with MCSs• Verify the loads with finite element simulations• Determine the effects of spline design parameter combinations• Develop software for analysis and design of spline couplings
Previous studies of splines have inves-tigated:
• Spline standards and design (Refs. 1–4; 6 and 8–10)
• Process error sources and resultant tooth errors (Refs. 2,
8 and 11–12)• Tooth stresses and deflections (Refs. 3,7, 11, 13 and 17)• Spline tooth engagement (Refs. 2, 8 and 11)• Tooth load distributions (Refs. 2 and 16)Many studies of deflection and
stress in gear teeth have been pub-lished, with valuable results. But spline couplings, although they share involute geometry with gears, are a very dif-
a) b)

GEARTECHNOLOGY June 2010 www.geartechnology.com56
ferent application in that gear design-ers do not seek simultaneous contact between all the pairs of teeth. For spline design, this is the goal—but it is not possible, due to tooth variations. There is, as yet, no quantitative algo-rithm for predicting tooth engagement in splines resulting from manufacturing process errors. With a realistic ana-lytical tool, which includes all critical spline parameters, as well as realis-tic estimates of tooth errors, designers may be able to find an optimum com-bination that significantly improves spline performance.
The results of this study include:• The effects of tooth errors on
mating tooth clearances
• Statistical characterization of clearance variations
• Prediction of tooth engagement• Sequence of tooth engagement
versus load• Stress in each tooth resulting
from non-uniform tooth loads
Analytical ModelTooth errors/tooth clearance. The
natural variation in the spline manu-facturing process leads to non-uniform clearance between pairs of mating teeth. Three common sources of varia-tion for this study were suggested by a gear manufacturing expert: index error, profile error and tooth thickness error (Refs. 12 and 15). Both the inter-
nal and external teeth are subject to all three. With six sources of error, it may be assumed that the clearance variation would approximate a normal or Gaussian distribution, as shown in Figure 4 (Ref. 14). Note that the major-ity of teeth are clustered close to the mean clearance and spread out in the tails.
A requirement for smooth brak-ing action of the truck brakes is that the clearance be sufficient to allow the pressure plates to slide axially. Extra clearance and a decreased pressure angle are provided for this application.
Lead error is another source for long spline teeth, but it did not con-tribute in this application because the brake plates are thin and adjust inde-pendently. The shaft and hub center-lines were also assumed to remain in alignment due to their stiffness and self-centering geometry.
Tooth engagement. The realiza-tion that tooth clearance varies from tooth to tooth led to a new statistical model for tooth engagement (Ref. 5). Consider a shaft and hub assembly: as the shaft rotates to engage the mating internal teeth, the clearance is reduced to zero. However, clearance between all tooth pairs does not go to zero simultaneously. The pair of teeth with the smallest clearance engages first and begins to transmit the torque load. As the load increases, the tooth pair deflects until the second pair engages. The load continues to increase, causing both to deflect until a third pair engag-es, and so on, until the full applied load is reached.
Thus, tooth engagement is a sequential process, sorted in order of increasing clearance. However, due to the random nature of the process errors, the teeth do not engage in numerical order. And so the engage-ment sequence will be as random as the clearances.
Tooth stiffness. The resultant tooth loads depend on the stiffness of a tooth under load. Three modes of deflection contribute: shear, bending and contact (Fig. 5).
For small deflections, spline teeth
Shear
Bending
Contact
Figure 4—Normal distribution of tooth clearance.
Figure 5—Three modes of tooth deflec-tion.
Kint Kext
K1
K2
F
a) Series springs
F
b) Parallel springs
Figure 6—Tooth stiffness models.

www.geartechnology.com June 2010 GEARTECHNOLOGY 57
continued
Fmax = Tapp/r
K1+K2+K3
K1+K2
K1
Deflection
Figure 7—Force-deflection plot due to sequential tooth engagement.
may be modeled as linear springs (Fig. 6). When a tooth on the shaft engag-es a tooth on the hub, they combine as springs in series. Their stiffnesses add as reciprocals. When two pairs of engaged teeth share the load, their stiffnesses add linearly. Thus, as teeth engage sequentially, the combined stiffness increases incrementally.
A plot of the resulting force deflection curve for the spline assem-bly (Fig.7) shows a steepening curve composed of straight, linear segments. Each change in slope is the result of another pair coming into engagement to share the load. At some point, the full, applied load is reached and the number of engaged pairs is determined. Thus, the number of pairs that engage, and their engagement sequence, is a complex interaction between applied load, tooth stiffness and the clearance magnitude and variation.
Note that the deflection from Tooth 1-to-2, 2-to-3, 3-to-4, etc., gets small-er as each new tooth engages. This is due to the normal distribution of the clearance (Fig. 4). Tooth clearances are clustered more closely near the mean of the clearance distribution and spread out in the tails.
Of course, the tangential force on the tooth produces a torque, and the tangential deflection produces a rota-tion. Both force and deflection act at the same radius, hence, the force ver-sus deflection curve is equivalent to a torque versus angular deflection curve.
Load-sharing. A significant result of sequential engagement is that load sharing between the teeth is not uni-form. In Figure 8, the force deflection curves for several pairs of teeth are shown as they engage sequentially. The first pair to engage starts at zero and the load increases with slope K1. As the load increases, the first pair deflects until the second engages. Both pairs share the load and deflect together with a combined stiffness K1 + K2 (Fig. 7). The next pair to engage increases the stiffness to K1 + K2 + K3.
A vertical line in Figure 8 intersects all three force-deflection curves. The total load is F1 + F2 + F3. The loads are
3 Teeth are EngagedTotal Stiffness: Keqv = K1+K2+K3
Applied Force: F = K1δ+K2δ+K3δ
F1
F2
F3
K1
K2
K3
Tooth - Tooth Clearanceδ
δδ
Figure 8—Force-deflection plot for individual teeth.
Percent of Applied Load Carried on Each Tooth
Perc
ent o
f App
lied
Load
1 2 3 4 5 6 7 8 9 10Tooth Number
20%18%16%14%12%10%8%6%4%2%0%
Figure 9—Load sharing plot for 10 engaged teeth.
unequal because the first pair deflected d1, the second d2, and third d3. The first pair carries a bigger share, because it has deflected further.
The load-sharing plot (Fig. 9) shows that the load is not uniformly distributed. The first tooth pair carries 18% of the load, with each successive pair carrying a smaller percentage. The curve is not smooth because of the ran-
dom variation in clearance.Strength of materials model (SMM).
Tooth stiffness is the key factor in an analytical model of tooth engage-ment. The strength of materials model represents each tooth as a stubby, can-tilever beam, with a tapered cross sec-tion, subject to a load acting normal to the surface. The involute profile is

GEARTECHNOLOGY June 2010 www.geartechnology.com58
into tangential and radial components (Fig. 11). The tangential force, F
t, pro-
duces both bending and shear deflec-tions and stresses. The radial force, F
r,
produces a radial force and a reverse bending moment (Fig. 11).
The stress distribution at the base of the tooth is shown for each component of load, and the resultant combined stress distribution, in Figure 12. The stress and deflections are all calculated
Fn Frtp/2
=
σFt
σMr
σFr
σRes=++
+
�
�
� �
�
Figure 11—Equivalent loads acting on a tooth.
Figure 12—Total stress at the base of the tooth.
approximated by a trapezoid, as shown in Figure 10. Fillets are neglected in the stiffness calculations, but are included in the stress calculations. Deflections due to contact stress are also neglected in the stiffness calcula-tions.
The load does not move from root to tip, as occurs in involute gearing, but remains stationary, near the pitch diam-eter. The normal force, F
n, is resolved
in closed form, for instant results, as opposed to conducting a full finite ele-ment analysis.
Map uniform tooth spacing to a normal distribution. As stated previ-ously, the combination of several sources of process variation, for both the external and internal splines, is modeled as a normal distribution. The resultant variation in clearance is clus-tered about the mean, becoming sparse approaching the tails.
Figure 13 illustrates a procedure for mapping a uniformly distributed clear-ance onto a normal distribution for a seven-tooth spline. The vertical axis is divided into seven equal intervals, with the center of each interval located and projected horizontally until it intersects the Cumulative Distribution Function (CDF) for the standard normal distribu-tion. At the intersection point, project down to the horizontal axis to deter-mine the clearance for each tooth. The Probability Density Function (PDF) is plotted below the (CDF) to illustrate the resulting normal distribution.
Note that the CDF goes to infin-ity at y = 0 and y = 7, but since Tooth 1 and Tooth 7 are one half interval inboard, the extreme values of clear-ance are always finite. Also, note that the clearance always increases going from Tooth 1 to 7, but the change gets smaller as you approach the mean, then increases again after the mean is passed.
These values of clearance repre-sent the average, or mean values for Tooth 1, Tooth 2 and so on, up to 7. But, if clearances were measured for 1,000 spline assemblies, there would be a variation about the mean value for Tooth 1 through 7, resulting in a set of distributions, clustered about the mean clearance. (A follow-up paper on this topic is included in Appendix A.)
The mapped method gives an ade-quate estimate of the number of teeth engaged for any specified load, as well as the load sharing.
VerificationThe SMM model for tooth deflec-
tions and stress has been verified by FEA. Finely meshed models were
Pitch Diameter
Form Diameter
Involute
Taper
Fillet Radius
Figure 10—Simplified tooth geometry.

www.geartechnology.com June 2010 GEARTECHNOLOGY 59
continued
analyzed for several cases of differ-ing tooth sizes and parameters. Single pairs of engaged teeth were analyzed by FEA and compared to the SMM results for stiffness, deflection and stress. Spline sections with several teeth engaged, and having prescribed random clearances, were analyzed to verify the load sharing predictions of SMM.
A careful study of contact stress between mating cylinders was done to develop confidence in the use of FEA contact stress elements. These results
Prob
abili
ty
Dimensionless Clearance,
Prob
abili
ty D
ensi
tyTooth 1 Tooth 7
CDF
1
0.8
0.6
0.4
0.2
0
-4 -3 -2 -1 0 1 2 3 4
0.05
0.15
0.25
0.35
0.45
C – C σc
Figure 13—Mapping the spline tooth clearances onto a normal distribution.
a) Nested cylinders
b) Mating spline teeth
Ri
Re
Ri
Re
++
Figure 14—Contact stress case studies.
Figure 15—Finely meshed teeth for FEA contact stress analysis.
were compared to classical Hertz con-tact solutions. A more critical issue was the common assumption used in gear stress analysis that Hertz theory for mating cylinders may be applied to mating involutes. Each cylinder in the Hertz model has constant radius of curvature while involute curvature changes continuously. The assumption is based on the fact that contact phe-nomena are so localized that curvature variation does not significantly affect the contact stress results. Figure 14 shows the geometry for the two cases.
FEA analysis results. An example FEA mesh of mating spline teeth is shown in Figure 15, but the clearance is too small to see.
Sample results of the FEA verifica-tion of the contact stress case studies are presented in Table 1. Width b is half the width of the rectangular con-tact zone. The contact pressure gener-ated in the contact zone is assumed to be parabolic, with the peak value P
max. The comparison is the percent
difference between the two values.
Table 1— Contact Stress Analysis Results.
Percent Difference in ANSYS and Hertz Results
Parameter Parallel Cylin-ders
Nested Cylin-ders
Con-tacting Splines
Contact width, b
7.2% 3.7% 0.54%
Contact pressure, Pmax
3.8% 3.9% 1.3%
GEARTECHNOLOGY June 2010 www.geartechnology.com60
This much error is acceptable for most applications.
The results in Table 2 are a sam-ple of the FEA verification for mating spline teeth. They include: maximum contact pressure, maximum bending stress on the external and internal teeth, deflection at the contact point and the equivalent stiffness of the two engaged teeth.
The SMM maximum stress values in Table 2 require a stress concentra-tion factor similar to those used in strength of materials courses. Charts are available for common loads and geometries, obtained from classical solutions, repeated for a range of geo-metric ratios.
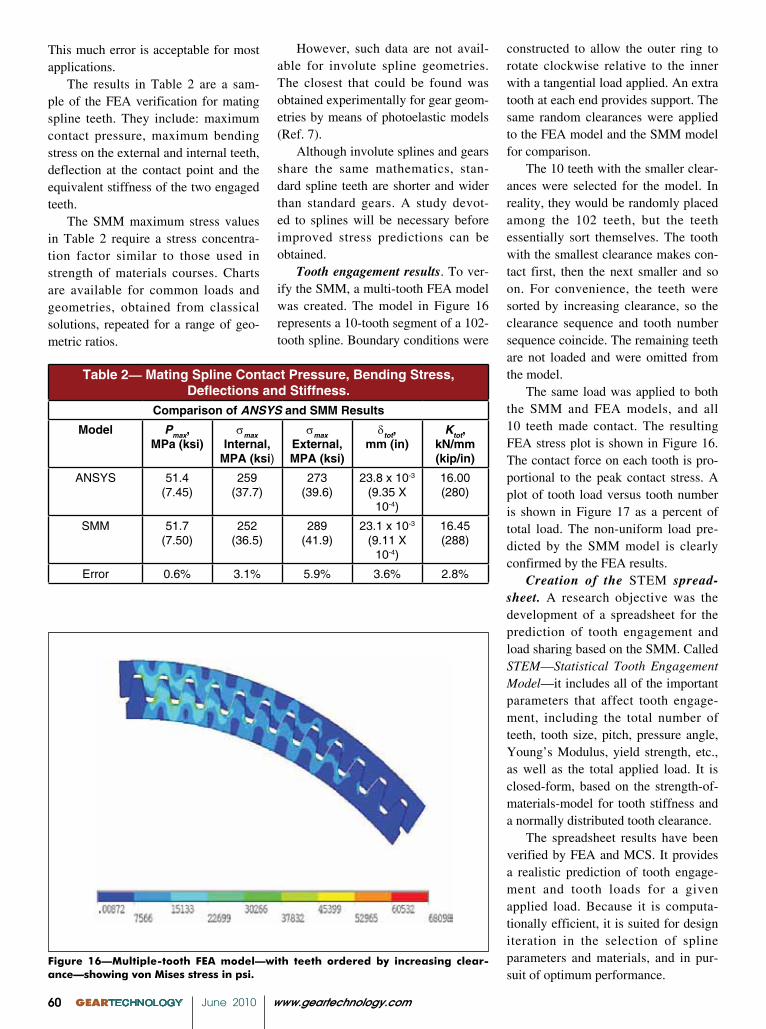
Figure 16—Multiple-tooth FEA model—with teeth ordered by increasing clear-ance—showing von Mises stress in psi.
Table 2— Mating Spline Contact Pressure, Bending Stress, Deflections and Stiffness.
Comparison of ANSYS and SMM ResultsModel Pmax,
MPa (ksi)σmax
Internal, MPA (ksi)
σmax External, MPA (ksi)
dtot, mm (in)
Ktot,kN/mm (kip/in)
ANSYS 51.4(7.45)
259(37.7)
273(39.6)
23.8 x 10⁻³
(9.35 X 10⁻⁴)
16.00(280)
SMM 51.7(7.50)
252(36.5)
289(41.9)
23.1 x 10⁻³
(9.11 X 10⁻⁴)
16.45(288)
Error 0.6% 3.1% 5.9% 3.6% 2.8%
However, such data are not avail-able for involute spline geometries. The closest that could be found was obtained experimentally for gear geom-etries by means of photoelastic models (Ref. 7).
Although involute splines and gears share the same mathematics, stan-dard spline teeth are shorter and wider than standard gears. A study devot-ed to splines will be necessary before improved stress predictions can be obtained.
Tooth engagement results. To ver-ify the SMM, a multi-tooth FEA model was created. The model in Figure 16 represents a 10-tooth segment of a 102-tooth spline. Boundary conditions were
constructed to allow the outer ring to rotate clockwise relative to the inner with a tangential load applied. An extra tooth at each end provides support. The same random clearances were applied to the FEA model and the SMM model for comparison.
The 10 teeth with the smaller clear-ances were selected for the model. In reality, they would be randomly placed among the 102 teeth, but the teeth essentially sort themselves. The tooth with the smallest clearance makes con-tact first, then the next smaller and so on. For convenience, the teeth were sorted by increasing clearance, so the clearance sequence and tooth number sequence coincide. The remaining teeth are not loaded and were omitted from the model.
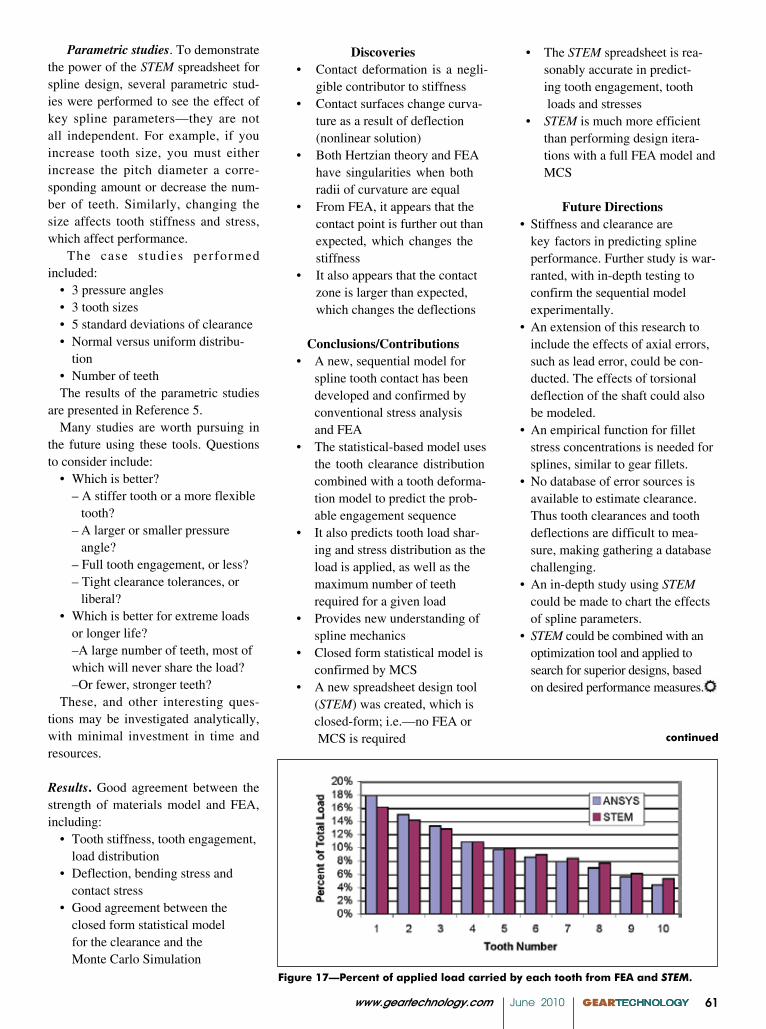
The same load was applied to both the SMM and FEA models, and all 10 teeth made contact. The resulting FEA stress plot is shown in Figure 16. The contact force on each tooth is pro-portional to the peak contact stress. A plot of tooth load versus tooth number is shown in Figure 17 as a percent of total load. The non-uniform load pre-dicted by the SMM model is clearly confirmed by the FEA results.
Creation of the STEM spread-sheet. A research objective was the development of a spreadsheet for the prediction of tooth engagement and load sharing based on the SMM. Called STEM—Statistical Tooth Engagement Model—it includes all of the important parameters that affect tooth engage-ment, including the total number of teeth, tooth size, pitch, pressure angle, Young’s Modulus, yield strength, etc., as well as the total applied load. It is closed-form, based on the strength-of-materials-model for tooth stiffness and a normally distributed tooth clearance.
The spreadsheet results have been verified by FEA and MCS. It provides a realistic prediction of tooth engage-ment and tooth loads for a given applied load. Because it is computa-tionally efficient, it is suited for design iteration in the selection of spline parameters and materials, and in pur-suit of optimum performance.
www.geartechnology.com June 2010 GEARTECHNOLOGY 61
Parametric studies. To demonstrate the power of the STEM spreadsheet for spline design, several parametric stud-ies were performed to see the effect of key spline parameters—they are not all independent. For example, if you increase tooth size, you must either increase the pitch diameter a corre-sponding amount or decrease the num-ber of teeth. Similarly, changing the size affects tooth stiffness and stress, which affect performance.
The case s tudies performed included:
• 3 pressure angles• 3 tooth sizes• 5 standard deviations of clearance• Normal versus uniform distribu-
tion• Number of teethThe results of the parametric studies
are presented in Reference 5.Many studies are worth pursuing in
the future using these tools. Questions to consider include:
• Which is better? – A stiffer tooth or a more flexible
tooth? – A larger or smaller pressure
angle? – Full tooth engagement, or less? – Tight clearance tolerances, or
liberal?• Which is better for extreme loads
or longer life? –A large number of teeth, most of
which will never share the load? –Or fewer, stronger teeth?These, and other interesting ques-
tions may be investigated analytically, with minimal investment in time and resources.
Results. Good agreement between the strength of materials model and FEA, including:
• Tooth stiffness, tooth engagement, load distribution
• Deflection, bending stress and contact stress
• Good agreement between the closed form statistical model for the clearance and the Monte Carlo Simulation
Figure 17—Percent of applied load carried by each tooth from FEA and STEM.
Discoveries• Contact deformation is a negli-
gible contributor to stiffness• Contact surfaces change curva- ture as a result of deflection
(nonlinear solution)• Both Hertzian theory and FEA have singularities when both
radii of curvature are equal• From FEA, it appears that the contact point is further out than expected, which changes the
stiffness• It also appears that the contact zone is larger than expected, which changes the deflections
Conclusions/Contributions• A new, sequential model for spline tooth contact has been developed and confirmed by conventional stress analysis and FEA• The statistical-based model uses the tooth clearance distribution
combined with a tooth deforma- tion model to predict the prob- able engagement sequence• It also predicts tooth load shar- ing and stress distribution as the load is applied, as well as the maximum number of teeth required for a given load• Provides new understanding of spline mechanics• Closed form statistical model is confirmed by MCS• A new spreadsheet design tool (STEM) was created, which is closed-form; i.e.—no FEA or MCS is required
• The STEM spreadsheet is rea- sonably accurate in predict- ing tooth engagement, tooth loads and stresses• STEM is much more efficient than performing design itera- tions with a full FEA model and MCS
Future Directions• Stiffness and clearance are
key factors in predicting spline performance. Further study is war- ranted, with in-depth testing to confirm the sequential model experimentally.• An extension of this research to include the effects of axial errors, such as lead error, could be con- ducted. The effects of torsional deflection of the shaft could also be modeled.• An empirical function for fillet stress concentrations is needed for splines, similar to gear fillets.• No database of error sources is available to estimate clearance. Thus tooth clearances and tooth deflections are difficult to mea- sure, making gathering a database challenging.• An in-depth study using STEM could be made to chart the effects of spline parameters.• STEM could be combined with an optimization tool and applied to search for superior designs, based on desired performance measures.
continued

GEARTECHNOLOGY June 2010 www.geartechnology.com62
AppendixThe statistical model described in
the body of this report only predicts the average tooth engagement sequence. From one spline assembly to the next, the first tooth to engage would always be the pair with the smallest clearance. However, due to statistical variations, the clearance of the first pair would be different from assembly to assembly.
If you measured tooth clearances in 1,000 assemblies, the smallest clear-ance would approach a distribution, similar to the left-most distribution in Figure A1 (Tooth 1).
Similarly, the next tooth to engage would have a distribution like the next distribution in Figure A1 (Tooth 2), and so on.
A full statistical model was also developed as a part of this study. It is the subject of a follow-up report, which is in preparation.
References:1. ANSI B92.1-1970, “Involute Splines and Inspection,” SAE, Warrendale, PA, 1993.2.Adey, R. A., J. Baynham and J.W. Taylor. “Development of Analysis Too l s fo r Sp l ine Coup l ings ,” Proceedings of the Institution of Mechanical Engineers, Vol. 214 Part G –Journal of Aerospace Engineering, pp. 347–357, 2000.3. Burke, P.E. and W. Fisher. “Design and Analysis Procedures for Shafts and Splines,” SAE Technical Paper 680024, 1968.
14. Spotts, M.F. Dimensioning and Tolerancing for Quantity Production, Prentice-Hall, New Jersey, 1983, p. 108.15. Tennutti, M. Gleason Corp., Rochester, NY, private communica-tion, 2007.16. Tjernberg, A. “Load Distribution and Pitch Errors in a Spline Coupling,” Materials and Design 22, 2001, pp. 259–266.17. Volfson, B.P. “Stress Sources and Critical Stress Combinations for Splined Shaft,” Journal of Mechanical Design, 1983, Vol. 104, No. 551, pp. 65–72.
4. Cedoz, R.W. and M.R. Chaplin. “Design Guide for Involute Splines,” SAE, Warrendale, PA, 1994.5. DeCaires, Brian J.K. “Variation Analysis of Involute Spline Tooth Contact,” MS Thesis, Mechanical Engineering Dept., Brigham Young Univ., Provo, UT, 2006.6. Deutschman, A.D., W.J. Michels and C.E. Wilson. Machine Design, Theory and Practice, Macmillan, 1975.7. Dolan, T.J., and E.I. Broghamer. “A Photoelastic Study of Stresses in Gear Tooth Fillets,” Report No. 335, Univ. of Illinois Engineering Experiment Station, March, 1942.8. Dudley, D.W. “How to Design I n v o l u t e S p l i n e s , ” P r o d u c t Engineering, October 28, 1957, pp. 75–80.9. Dudley, D.W. “When Splines Need Stress Control,” Product Engineering, December 23, 1957, pp. 56–61.10. Dudley, D.W. Dudley’s Gear Handbook, 2nd Ed.,” McGraw-Hill, Inc., New York, 1991.11. Kahn-Jetter, Z.J. and S. Wright. “Finite Element Analysis of an I n v o l u t e S p l i n e , ” J o u r n a l o f Mechanical Design, June 2000, Vol. 122, pp. 239–244.1 2 . M c C a u l e y , C . J . E d i t o r , Machinery’s Handbook, 27th Edition, New York, Industrial Press, 2004.13. Salyards, D.G. and H.J. Macke. “The Application of Photoelasticity to the Analysis of Shaft Splines,” Proceedings of the 1990 SEM Spring Conference of Experimental Mechanics , Albuquerque, New Mexico, June 4–6, 1990.
Figure A1—Full statistical model of tooth clearance, showing tooth-by-tooth vari-ation.
Professor Ken Chase has taught mechani-cal engineering at Brigham Young University since 1968 where he teaches machine design, design for manufacture and structural analysis. An advocate of computer technology, he has served as a consultant to industry on numerous projects involving engineering software applica-tions. Since 1984, he has been involved in the development of computer-aided toler-ancing software based on his research at BYU. His most recent work combines toler-ance analysis with finite element analysis to predict the behavior of flexible assemblies, such as airframes or auto bodies.
Carl Sorensen is associate professor of mechanical engineering and undergraduate coordinator at Brigham Young University. He received his doctorate in materials science from MIT and has worked as a consultant in manufacturing processes for General Electric and Chrysler, as well as numerous smaller companies. He has coached more than 20 Capstone projects and has published approximately 30 schol-arly papers.
Brian DeCaires is currently working as a design engineer for Caterpillar Inc. spe-cializing in torque converter design for heavy-duty mining products. He graduated from Brigham Young University in 2006 with his master’s in mechanical engineer-ing. For his graduate studies, DeCaires focused on developing a statistical model to predict tooth engagement in spline cou-plings.