VARIABLES Topic #3. Variables and the Unit of Analysis Variables are characteristics of the...
42
VARIABLES Topic #3
-
Upload
ruth-lloyd -
Category
Documents
-
view
243 -
download
0
Transcript of VARIABLES Topic #3. Variables and the Unit of Analysis Variables are characteristics of the...

VARIABLES
Topic #3
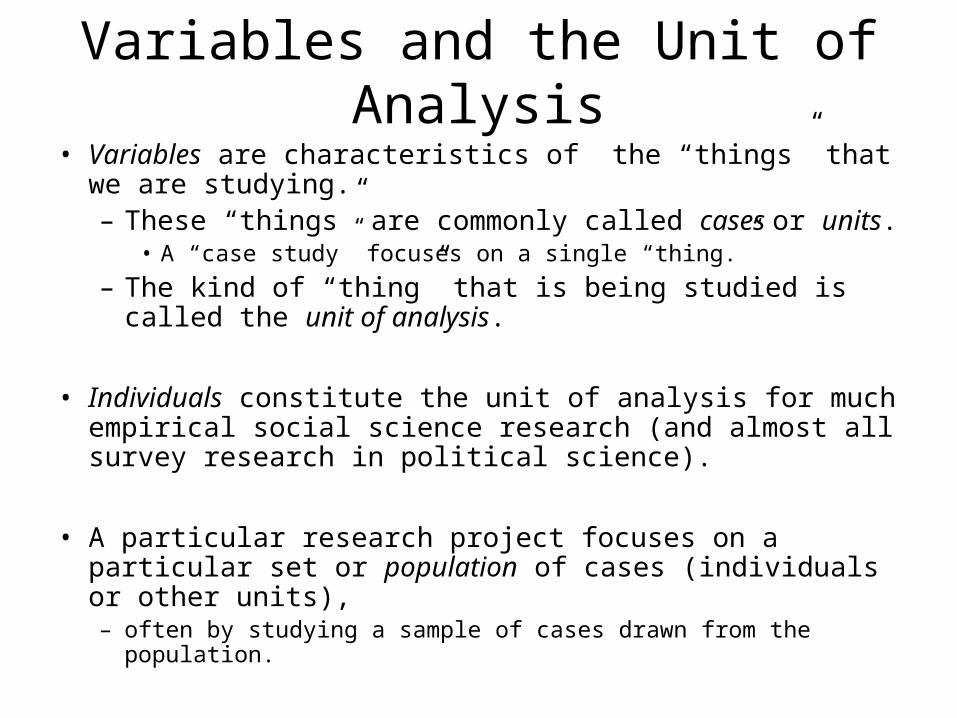
Variables and the Unit of Analysis
• Variables are characteristics of the “things” that we are studying.– These “things” are commonly called cases or units.
• A “case study” focuses on a single “thing.”
– The kind of “thing” that is being studied is called the unit of analysis.
• Individuals constitute the unit of analysis for much empirical social science research (and almost all survey research in political science).
• A particular research project focuses on a particular set or population of cases (individuals or other units),– often by studying a sample of cases drawn from the population.

American National Election Studies• ANES focuses on individuals as the units of analysis in
the American voting age population (VAP).
• ANES variables pertain to these individuals– ANES variables include
• gender, race, education, and other demographic variables; • party identification, voting intention, President approval,
ideology, abortion opinion, political trust, and other attitudinal variables;
• whether registered/voted, candidate vote for, whether contributed campaign $$, and other behavioral variables;
– These are all variable properties of individuals,• not households, elections, nations, etc.

Other Populations of Individuals
• Population = All Members of Congress– additional variables pertaining to this specialized
population of individuals include:• number of terms served, campaign expenditure in last
election, last re-election margin, party affiliation, committee assignments, roll-call vote on specified bill, ADA (etc.) rating, NOMINATE score, etc.
• Annual Survey of Social Security and Medicare Beneficiaries
• British [etc.] Election Studies

Other Units of Analysis in Political Research
• Presidential elections: variables include– winning party, winner’s vote popular vote %, Dem. candidate’s popular vote %,
winner’s electoral vote margin, turnout %, whether the incumbent was running for re-election, total campaign expenditures, etc.
• States in a given Presidential election: variables include– number of electoral votes, winning party/candidate, winner’s vote %; Rep.
candidate’s vote %, turnout %, etc.
• States in all historical Presidential elections: variables include– all of above for each election year
• Nations: variables include– population, GNP, per capita income, literacy rate, military spending as % of GNP,
size of army, type of party system, etc.
• States, counties, other jurisdictions, precincts, legislatures, political parties, etc.

Households
• Households are often the unit of analysis in economic and sociological research– Variables include:
• size (# of persons)• type (single-parent, no children, unrelated, etc.)• type of housing unit• household income• etc.
• Current Population Survey (CPS)• Panel Study of Income Dynamics (PSID)
– Rotating panel surveys of households
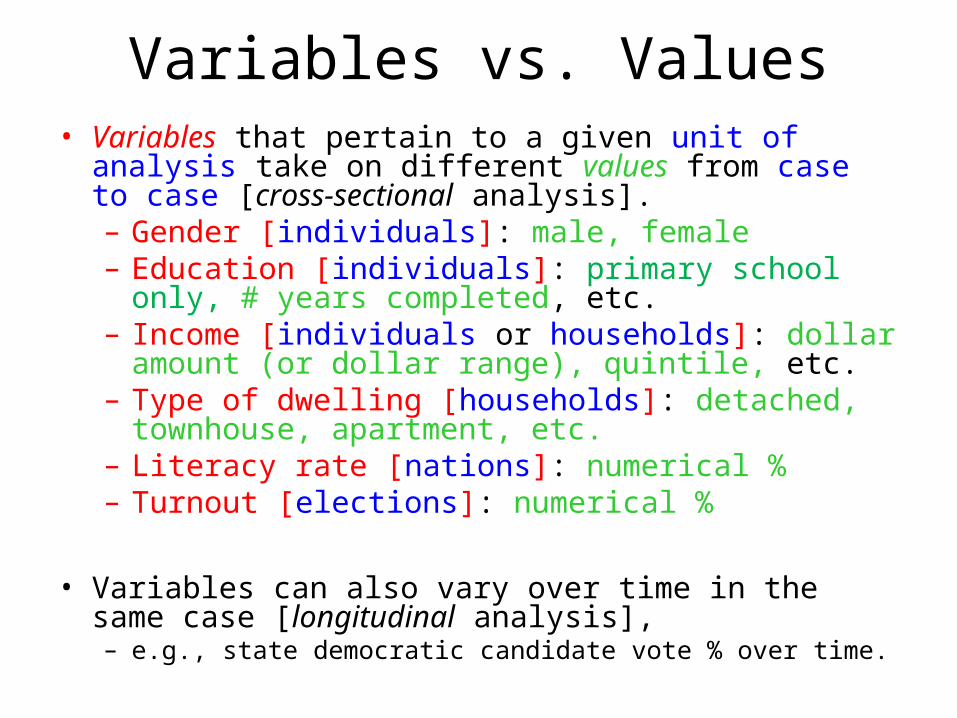
Variables vs. Values• Variables that pertain to a given unit of analysis take on
different values from case to case [cross-sectional analysis].– Gender [individuals]: male, female– Education [individuals]: primary school only, # years
completed, etc.– Income [individuals or households]: dollar amount (or
dollar range), quintile, etc.– Type of dwelling [households]: detached, townhouse,
apartment, etc.– Literacy rate [nations]: numerical %– Turnout [elections]: numerical %
• Variables can also vary over time in the same case [longitudinal analysis],– e.g., state democratic candidate vote % over time.

Variables are the building blocks of empirical political science research
• Researchers have to figure out how to measure the variables they are interested in by designing – appropriate survey questions – or other kinds of measures
• Researchers next need to actually collect the data, e.g., by carrying out – the survey they have designed– or other data collecting operations.
• With the data at hand, researchers then ask such questions as the following:– What is the average or typical value of a variable in a set of
cases? • For example, what is typical level of interest among voters, or the
average rate of turnout in recent elections?

Questions (cont.)• How are the values of a variable distributed in a set of data, i.e., do
most of the same cases have about the same value (low dispersion) or do different cases have very different values (high dispersion). For example:
– Do all voters have about the same level of interest or are some very interested while others not interested at all?
– Do all elections have about the same level of turnout, or do some have very high turnout while others have very low turnout?
– Distribution of income or wealth.• How are two variables related or associated in a set of data? For
example:– Is the level of interest among voters related to their level of education? – Does the level of turnout in elections depend on how close elections are expected to
be?• Does one variable have a (direct) causal impact on another variable?
For example:– Does higher education cause people to become more interested in politics? – Does the prospect of a close election cause more voters to turn out and vote?
• Does one variable have an (indirect) causal impact on another variable? For example:
– Does the prospect of a close election cause greater activity by campaign organizations that in turn causes more voters to turn out and vote?

Variables and Their Values
• To repeat, variables vary — they take on different values from case to case [or from time to time]
• Thus, associated with every variable is a list or range of possible values. For example:
– PARTY IDENTIFICATION (pertaining to individuals) in the U.S has values: REPUBLICAN, DEMOCRAT, INDEPENDENT (or perhaps refinements like STRONG REPUBLICAN, WEAK DEMOCRAT, etc., and/or other values like MINOR PARTY).
– VOTED IN 2008 ELECTION? is another variable pertaining to individuals, with just two possible values, YES and NO.
– HEIGHT is a physical variable pertaining to individuals with values that are real numbers (expressed in units such as inches, centimeters, or feet).
– SIZE (# of persons) is a variable pertaining to households with values that are whole numbers > 1 (values are counts)
– LEVEL OF TURNOUT is a variable pertaining to elections (or to different jurisdictions in a given election), with values ranging potentially from 0% to 100%.
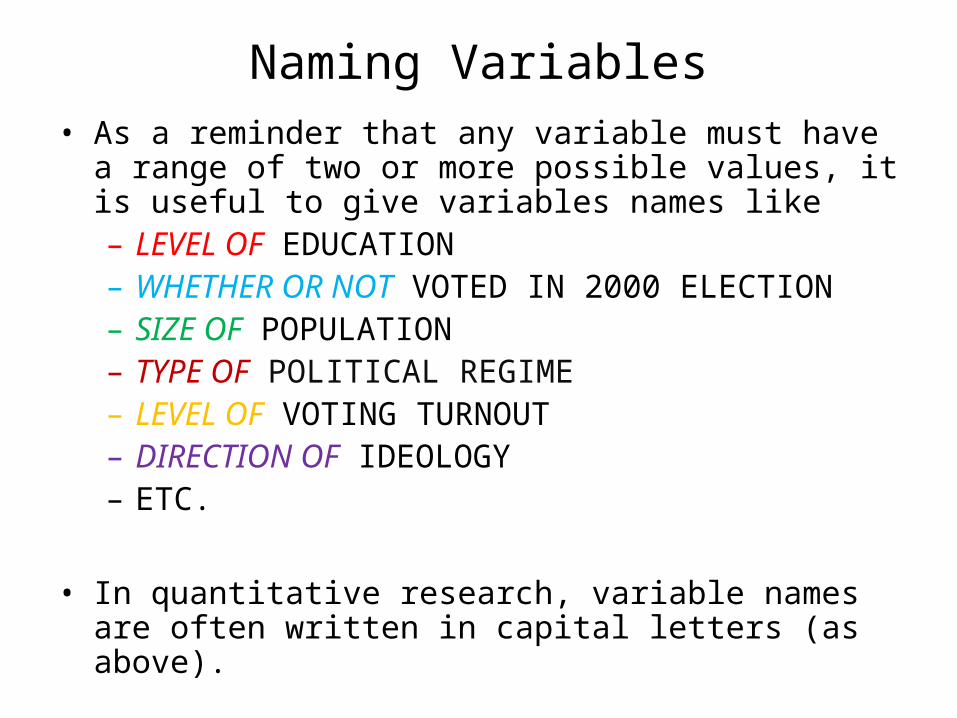
Naming Variables• As a reminder that any variable must have a range of
two or more possible values, it is useful to give variables names like – LEVEL OF EDUCATION– WHETHER OR NOT VOTED IN 2000 ELECTION – SIZE OF POPULATION– TYPE OF POLITICAL REGIME– LEVEL OF VOTING TURNOUT– DIRECTION OF IDEOLOGY– ETC.
• In quantitative research, variable names are often written in capital letters (as above).

Observations/Observed Values
• The actual value of a variable in a particular case is called an observation (or observed value). For example,
– we "observe“ [by asking the appropriate question(s) in a survey] that Joe Smith (the case) has the PARTY IDENTIFICATION (the variable) WEAK DEMOCRAT (the observed value), and likewise
– we “observe” [by consulting the appropriate records] that the 2008 Presidential election (the case) has a LEVEL OF TURNOUT (the variable) of 61% (the observed value).

Identifying Variables (PS#3A)
Each of the following statements makes an empirical assertion (which may or may not be true); each refers (at least implicitly) to two variables (and asserts that there is some kind of relationship between them). For each statement:
(a) indicate to what unit of analysis (individuals, nations, elections, etc.) and, as appropriate, what particular population the variables pertain;
(b) identify the two variables, with appropriate names (probably TYPE OF _____, LEVEL OF _____, DEGREE OF _____, AMOUNT OF _____”, WHETHER OR NOT _____”); and
(c) indicate a range of possible values for each variable (often, but certainly not always, LOW and HIGH will do).(Note: both variables in each sentence pertain to the same units.)
1. Junior members of Congress are less pragmatic than their senior colleagues.
2. Education tends to undermine religious faith. 3. Capital punishment deters murder. 8. When times are bad, incumbent candidates are punished in elections. => 11. If you want to get ahead, stay in school.

CLASS LIST (Data Spreadsheet)
Case ID Variable 1 Var2 Var3 Var4
Grad.Name SSN Class Major GPA Cand? Jones, R. 215-14-6609 Senior POLI 3.12 NoKim, S. 144-56-9231 Sophomore PYSC 2.78 NoSmith. H. 502-45-2323 Junior POLI 2.75 NoWilliams, R. 212-16-7834 Senior HIST 3.28 YesEtc.
What distinctions between different types of variables can we make?

Types of Variables• Our concern here is with drawing distinctions among
variables with respect to their logical properties, not their substantive nature (e.g., demographic, attitudinal, etc.)
• Every variable has at least two possible values (otherwise it could not vary).
• A variable is dichotomous (also called a dummy variable) if it has exactly two possible values (typically “yes” and “no”), e.g., – GRADUATION CANDIDATE? [Students] (Yes/No)
– WHETHER VOTED IN 2000 ELECTION [Inds.] (Yes/No)– GENDER [Inds.] (M/F)
• However, most variables have three or more possible values.– Some variables have an infinite number of possible values.

Qualitative Variables
• A variable is qualitative if its values are given by words– MAJOR [Students]: POLI, HIST, BIOL, etc.– TYPE OF REGIME [nations]: Free, Partly Free, Unfree– ABORTION OPINION [Inds.]: Never permit, etc.
• In a data spreadsheet [e.g., SPSS], these verbal values are typically recorded in terms of numerical codes, because this – saves space, and– facilitates machine processing.– Moreover, survey data from closed-form questions is often pre-
coded (e.g., the Student Survey).

In a spreadsheet
Rows are cases
Columns are variables
Cell are values (varying from case to case)
Values (except V01 YEAR OF SURVEY) in the Student Survey and SETUPS are numerically coded.

Quantitative Variables• A variable is quantitative if its (true, not coded) values
are given by numbers:– GPA [Students]: 3.12, 2.78, etc.– LITERACY RATE [Nations]: 98%, 55%, etc.– HEIGHT [Inds.]: 72", 62", etc.– SIZE [Households]: 1 person, 2 persons, etc.– LEVEL OF TURNOUT [Elections or jurisdictions]: 51%, etc.
• The magnitude of these numbers may depend on the units of measurement used (e.g., is HEIGHT given in inches, feet, centimeters, etc.?).
• In spreadsheet, such values are typically recorded in terms of their actual numerical values.
• The SETUPS data contains data pertaining to variables that, while “truly” quantitative in nature, are recoded in broad categories, e.g.,– AGE (V60) [ 18-24, 25-34, etc.] or
– INCOME (V65A) [0-16th percentile, 17-33rd percentile, etc.]

Truly Quantitative Data Need Not be Coded

Variables and the Unit of Analysis
• Substantively related variables may be of different types depending on the unit of analysis to which they pertain.
– TURNOUT pertaining to individuals is a dichotomous variable with values “yes – voted” and “no – did not vote”.
– [LEVEL OF] TURNOUT pertaining to elections (or jurisdictions, precincts, etc.) is a quantitative variable with possible values ranging from 0% to 100%.

Types of Variables / Levels of Measurement
• It is useful to refine both qualitative and quantitative variables further by distinguishing among four– different types of variables, or (equivalently) – different levels of measurement of pertaining to
variables.
• Note: these distinctions are relevant only as they pertain to non-dichotomous variables.– Please take note of this with respect to PS #3B,
Question 2.

Nominal Variables
• A nominal variable (or a variable measured at the nominal level) has values that are unordered categories.
• Accordingly, nominal variable are qualitative in nature.
• Given two cases and a nominal variable, we can observe – that they have the same value or they have different
values, but (if they have different values)– we cannot say that one has the “higher/bigger” value
and the other the “lower/smaller,” etc.

Nominal Variables (cont.)• A nominal variable typically has a name like
– NAME OF ____– TYPE OF ____ – NATURE OF ____ – KIND OF ____
• Examples:– (NAME OF) MAJOR: Political Science, Economics, History, etc.– (TYPE OF) RELIGIOUS AFFILIATION: Protestant, Catholic,
Jewish, etc. – PREFERENCE FOR REPUBLICAN NOMINATION: Giuliani,
McCain, Romney, etc.
• In a data spreadsheet, numerical codes must be assigned to values of nominal variables in an essentially arbitrary manner,– so it is certainly illegitimate to do arithmetic on the numerical
code values.– Typically the numerical codes are consecutive whole numbers.

Ordinal Variables• An ordinal variable (or a variable measured at the ordinal
level) has values that fall into some kind of natural ordering, – often (but not always) running from (in some sense) LOW to
HIGH. – Therefore, cases can be ranked or ordered with respect to their
values on an ordinal variable.• An ordinal variable is also qualitative in nature.• Given two cases and a ordinal variable, we can observe
– that they have the same value or they have different values, and also (if they have different values)
– that one has the “higher/bigger” value and the other “lower/smaller,” etc., but
– we cannot say how much higher/bigger or lower/smaller. • Given three cases with different values on an ordinal
variable, • we can identify the case with the observed value between the other two• but we cannot say which of the other value it is closer to.

Ordinal Variables (cont.)• An ordinal variable typically has a name like
– DIRECTION OF ___– EXTENT OF ____– LEVEL OF ____– DEGREE of ____
• Examples:– TYPE OF REGIME/DEGREE OF FREEDOM [nations]: Free, Partly Free, Unfree– (LEVEL OF) INTEREST IN THE ELECTION CAMPAIGN [individuals]: from “low”
to “high”– (DIRECTION OF) IDEOLOGY [individuals]: from most liberal to most
conservative– (DEGREE OF) PRESIDENTIAL APPROVAL [individuals]: from strongly approve
to strongly disapprove– DIRECTION OF ABORTION OPINION [individuals]: Never permit, . . . , Always
permit– (LEVEL OF) CLASS STANDING [students] : freshman, sophomore, junior, senior
• When data is recorded in coded form, numerical codes should be assigned to values in a manner consistent with the natural ordering of the values.

Ordinal Variables (cont.)• If the natural ordering is from LOW to HIGH, the codes
should likewise run from lower to higher numbers. • If the natural ordering is not from LOW to HIGH, e.g.,
DIRECTION OF IDEOLOGY, – the two extreme values (or “poles”), e.g., MOST LIBERAL and
MOST CONSERVATIVE, should be assigned the minimum and maximum code values, but
– which gets which is arbitrary ,– and intermediate values, e.g., MODERATE, should be assigned
intermediate codes). • In any event, values are typically assigned numerical
codes that are consecutive integers, – but this is not a logical necessity (because only their order
matters).– It remains illegitimate to do arithmetic on the
numerical code values • unless we are willing to attribute “interval” status to the code
values.

Ordinal Variables (cont.)
• Note that DIRECTION OF IDEOLOGY could be renamed DEGREE OF LIBERALISM, – which does range from LOW (i.e., “least liberal” [or
“most conservative”]) to HIGH (“most liberal” or [“least conservative”]).
• We could also reverse the “polarity” of the renamed variable and call it DEGREE OF CONSERVATISM, – ranging from LOW (i.e., “least conservative” [or “most
liberal”]) to HIGH (“most conservative” [or “least liberal”]).

Ordinal Variables (cont.)• Opinion variables with closed-form values running from
(STRONGLY) AGREE (or APPROVE) to (STRONGLY) DISAGREE (or DISAPPROVE) are ordinal in nature.
• The value INDEPENDENT is usually deemed to fall “between” DEMOCRAT and REPUBLICAN, so PARTY IDENTIFICATION is usually deemed to be ordinal in nature.– But this works only if we treat cases with “minor party” or DK values as
missing data (since these values don’t fall in the natural ordering).
• An SPSS spreadsheet normally displays a numerical code (rather than a blank) for missing data (“unobserved” values), which must be understood as not part of the natural ordering. – In the SETUPS and Student Survey data, missing data coded as (9).
– SPSS must be told the “missing data” code(s) for each variable, so that it can set cases so coded aside when it processes data.


Interval [Scale] Variables• An interval variable (or variable measured at the interval level) has
values that are real numbers that can appropriately be added together, subtracted one from another, and averaged.– SPSS refers to scale variables
• An interval variable is quantitative in nature.• Given two cases and an interval variable, we can say they have the
same value or they have different values, and also (if they have different values) – that one has the higher value and the other lower, etc., and also– how much higher or lower one value is than the other, because
• we can subtract one value from another,• i.e., we can determine the magnitude of the interval separating them and
thus say how “far apart” the cases are with respect to the variable.
– Given three case with different values on an interval variable, we can identify the case with the observed value between the other two and we can also determine which of the to other cases it is closer to.
• But we cannot say how many times greater one value is than another.

Interval Variables (cont.)• An interval variable typically has a name like
– LEVEL OF ____ – DEGREE OF ____ – NUMBER OF ____– AMOUNT OF ____
• In a spreadsheet, actual numerical values (rather than numerical codes) are normally entered into a data array (e.g., Presidential election data).
• But sometimes (numerically coded) class intervals are used instead (e.g., SETUPS V60 [AGE]), as will be discussed later. [See =>]
• Variables like PARTY IDENTIFICATION,IDEOLOGY, and ISSUE OPINIONS are often treated as interval variables (e.g., my Student Survey/ANES longitudinal charts that showed changing average levels of Party ID, Ideology, etc., over time).

A Truly Interval Variable May Be Recoded into An Ordinal One

Ordinal vs. Interval Variables
• Example – Baseball Standings– Rank Standing of a team (first place, second place, etc.) is
ordinal information– Winning Percent (or Games Behind Leader) is interval
information– For the league playoffs:
• the determination of division winners is based on ordinal information only; but
• the determination of the “wild card” entry is based on interval information (best winning percent not otherwise in playoffs)
• A team that fails to make the playoffs may have a higher winning percent that a team that does make the playoffs

Ratio Variables• A ratio variable (or a variable measured at the ratio level)
is an interval variable (that has values that are real numbers that can appropriately be added together, subtracted one from another, and averaged) but in addition– one can appropriately divide one value by another
(i.e., compute their ratio), and – say, for example, that one case has twice the
observed value of another. • This requires that the ratio variable have a non-arbitrary
zero value, – which usually represents in some sense the complete absence
of the characteristic or property to which the variable refers. – Even if negative values are possible, the zero value is non-
arbitrary, e.g.,• level of profit (of a business) may have a negative value, or• rate of economic growth (over years) may have a negative
value.
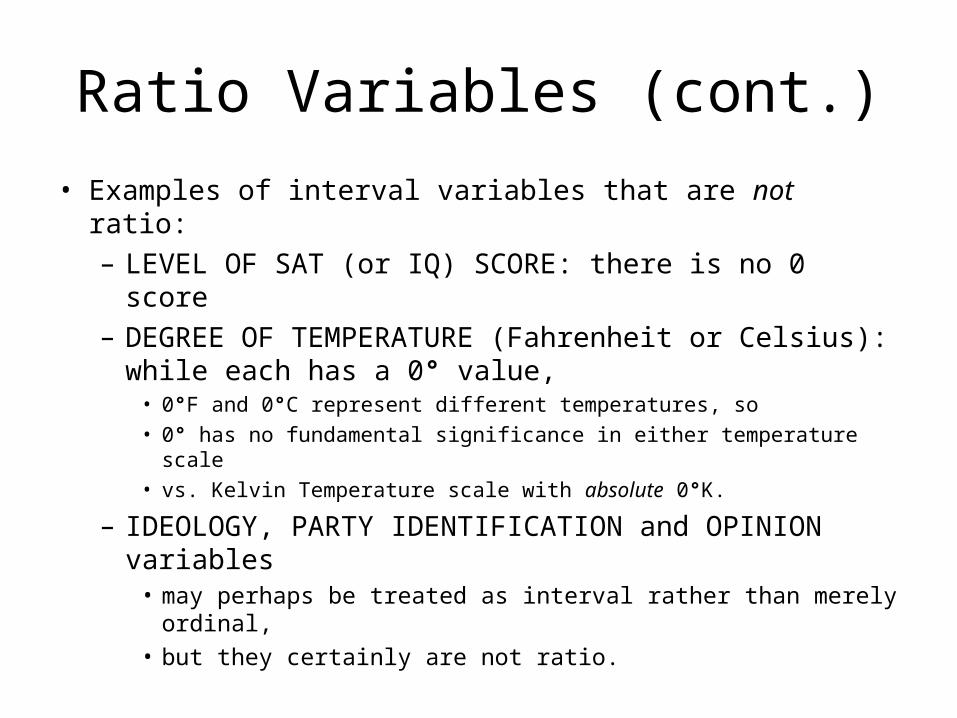
Ratio Variables (cont.)
• Examples of interval variables that are not ratio: – LEVEL OF SAT (or IQ) SCORE: there is no 0 score– DEGREE OF TEMPERATURE (Fahrenheit or
Celsius): while each has a 0° value, • 0°F and 0°C represent different temperatures, so
• 0° has no fundamental significance in either temperature scale
• vs. Kelvin Temperature scale with absolute 0°K.
– IDEOLOGY, PARTY IDENTIFICATION and OPINION variables
• may perhaps be treated as interval rather than merely ordinal,
• but they certainly are not ratio.

Ratio Variables (cont.)
• Examples of ratio variables include:– NUMBER OF CHILDREN or AGE (uncoded) [individuals]– SIZE/NUMBER OF MEMBERS [households or legislatures]– SIZE OF POPULATION [nations]– LEVEL OF INCOME [individuals or households]– PER CAPITA INCOME [nations]– LEVEL OF PROFITS [firms] – SIZE OF BUDGET SURPLUS [governments or fiscal years]– NUMBER OF VOTES FOR DEM CAND [elections, states]– PERCENT OF VOTES FOR DEM CAND [elections, states]
• Even though LEVEL OF PROFITS or SIZE OF BUDGET SURPLUS can have negative values, their zero points are not arbitrary.– However, ratio comparisons can only be made between
observed values with the same [positive or negative] sign.

Freeway Exits and Levels of Measurement
• The identification of freeway exits has changed over the years, progressing from lower to higher levels of measurement.
• Nominal: exits were once only given names (e.g., name of crossroad or town),– So you could tell only whether the upcoming exit is your exit or
not.• Ordinal: Exits then were ordered (e.g., from east to west)
and consecutively numbered, so you could tell– whether you have passed your exit or not, and– how many exits there are between your exit and where you are
now.– (Otherwise exit numbers are uninformative =>)
• Interval/Ratio: Exits are now usually numbered in terms of their distance in miles from the state line,– so can tell how far you have to go to get to your exit – (and also that your exit is X times as far from the state line as
where you are now).
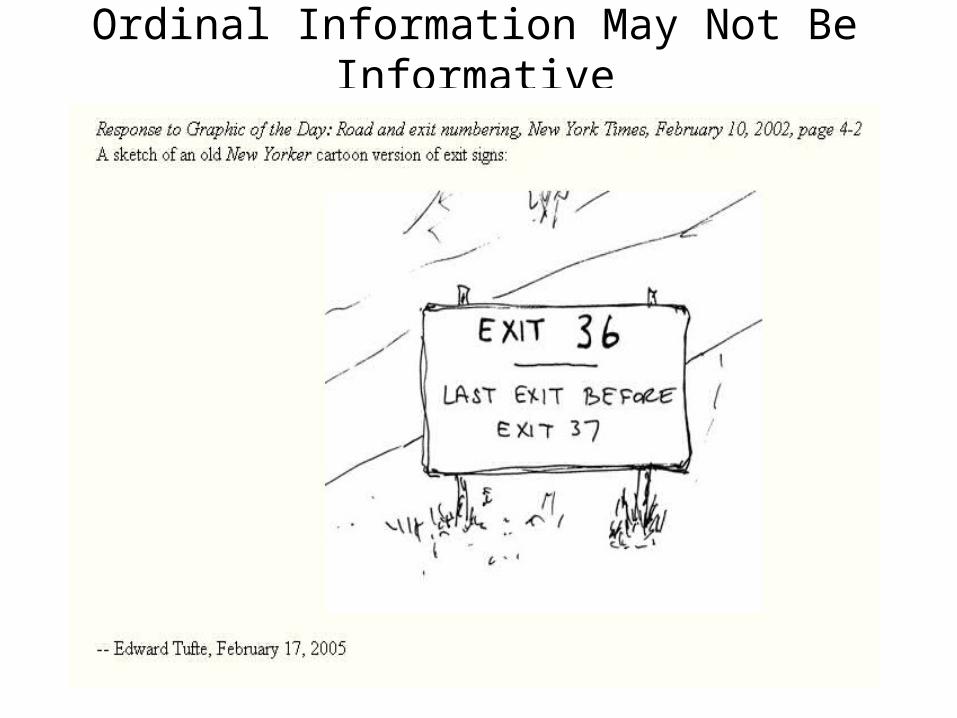
Ordinal Information May Not Be Informative

But Ordinal Is Better Than Nominal

Discrete vs. Continuous Variables• Quantitative [interval and ratio] variables may be either
discrete or continuous. – [Qualitative variables are pretty much necessarily discrete.]
• A discrete variable has a finite (and typically small) number of possible values that usually (if the variable is quantitative) correspond to whole numbers (or integers) only. – NUMBER OF CHILDREN [households] – NUMBER OF MEMBERS [councils or legislatures]– NUMBER OF ELECTORAL VOTES WON BY DEM
CANDIDATE [Presidential elections] vs.– PERCENT OF POPULAR VOTE WON BY DEM CANDIDATE
[Presidential elections]

Continuous Variables
• A continuous variable can have any real number (at least within some range) as a value (i.e., including fractional values between the integers). – So a continuous variable has (at least in principle) an
infinite number of possible values, • so that given two cases with distinct values of the continuous
variable, it is in principle always possible that there is another case with an intermediate value of the variable.
– “Discrete” vs. “Continuous” temperature controls on a kitchen range.
– Digital vs. “old fashioned” thermometer

Continuous Variables (cont.)• Examples:
– LEVEL OF DAILY HIGH TEMPERATURE [places (cross-sectional), days (longitudinal)]
– HEIGHT, WEIGHT, and AGE [individuals]
• Because we typically round off the value of such variables to the nearest degree, inch, pound, year, etc., such variables may “look” discrete.– IDEOLOGY might be thought of as a “truly” continuous variable.
• Some interval variables are in principle discrete but are “virtually” continuous because they have so many possible (numerical) values, e.g.,
• RATE OF TURNOUT [elections]• PERCENT OF VOTE FOR DEMOCRATIC CANDIDATE
[elections]