A Systematic Procedure to Determine Controller Parameters ...

Variable-Speed Wind TurbineController Systematic DesignMethodology: A Comparison ofNon-Linear and Linear Model-Based Designs
July 1999 • NREL/TP-500-25540
M.M. Hand
National Renewable Energy Laboratory1617 Cole BoulevardGolden, Colorado 80401-3393
NREL is a U.S. Department of Energy LaboratoryOperated by Midwest Research Institute •••• Battelle •••• Bechtel
Contract No. DE-AC36-98-GO10337

National Renewable Energy Laboratory1617 Cole BoulevardGolden, Colorado 80401-3393
NREL is a U.S. Department of Energy LaboratoryOperated by Midwest Research Institute •••• Battelle •••• Bechtel
Contract No. DE-AC36-98-GO10337
July 1999 • NREL/TP-500-25540
Variable-Speed Wind TurbineController Systematic DesignMethodology: A Comparison ofNon-Linear and Linear Model-Based Designs
M.M. HandPrepared under Task No. WE901110

NOTICE
This report was prepared as an account of work sponsored by an agency of the United Statesgovernment. Neither the United States government nor any agency thereof, nor any of their employees,makes any warranty, express or implied, or assumes any legal liability or responsibility for the accuracy,completeness, or usefulness of any information, apparatus, product, or process disclosed, or representsthat its use would not infringe privately owned rights. Reference herein to any specific commercialproduct, process, or service by trade name, trademark, manufacturer, or otherwise does not necessarilyconstitute or imply its endorsement, recommendation, or favoring by the United States government or anyagency thereof. The views and opinions of authors expressed herein do not necessarily state or reflectthose of the United States government or any agency thereof.
Available to DOE and DOE contractors from:Office of Scientific and Technical Information (OSTI)P.O. Box 62Oak Ridge, TN 37831
Prices available by calling 423-576-8401
Available to the public from:National Technical Information Service (NTIS)U.S. Department of Commerce5285 Port Royal RoadSpringfield, VA 22161703-605-6000 or 800-553-6847orDOE Information Bridgehttp://www.doe.gov/bridge/home.html
Printed on paper containing at least 50% wastepaper, including 20% postconsumer waste

VARIABLE-SPEED WIND TURBINECONTROLLER SYSTEMATIC DESIGN
METHODOLOGY: A COMPARISON OF NON-LINEAR AND LINEAR MODEL-BASED
DESIGNSBy
M. MAUREEN HAND
B.S., University of Wyoming, 1994
A thesis submitted to the Faculty of the Graduate
School of the University of Colorado in partial
fulfillment of the requirement for the degree of
Master of Science
Department of Mechanical Engineering
1998
ii
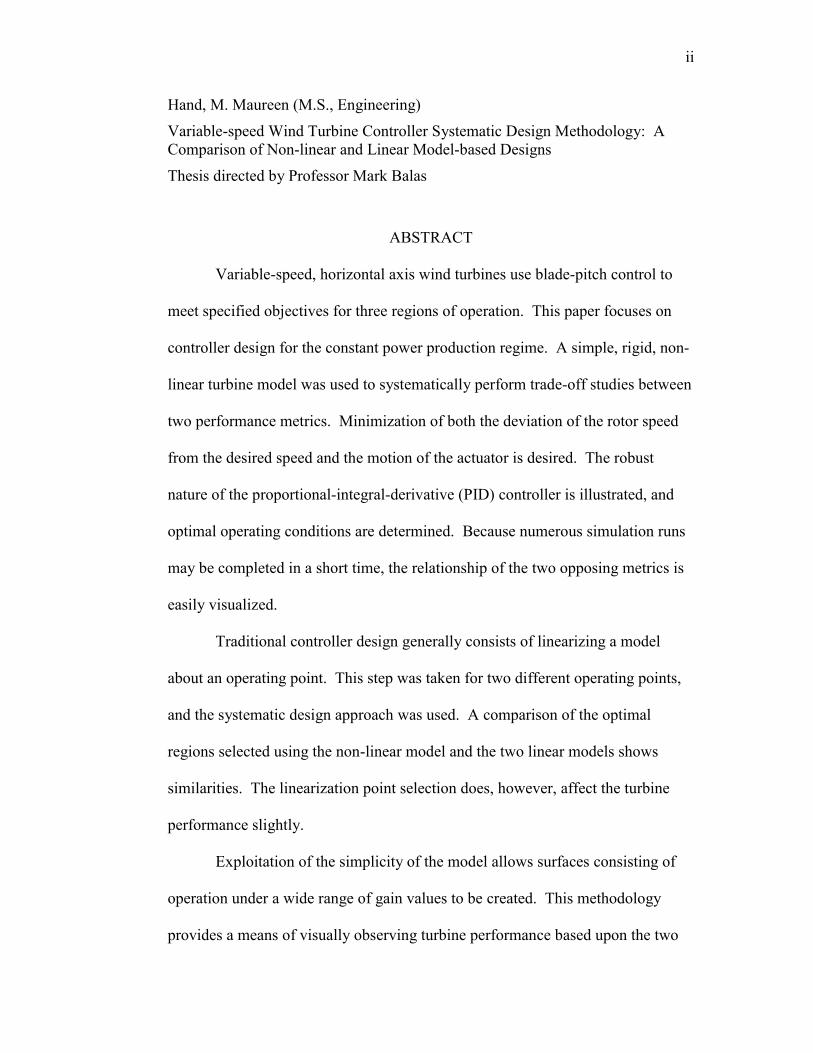
Hand, M. Maureen (M.S., Engineering)
Variable-speed Wind Turbine Controller Systematic Design Methodology: AComparison of Non-linear and Linear Model-based Designs
Thesis directed by Professor Mark Balas
ABSTRACT
Variable-speed, horizontal axis wind turbines use blade-pitch control to
meet specified objectives for three regions of operation. This paper focuses on
controller design for the constant power production regime. A simple, rigid, non-
linear turbine model was used to systematically perform trade-off studies between
two performance metrics. Minimization of both the deviation of the rotor speed
from the desired speed and the motion of the actuator is desired. The robust
nature of the proportional-integral-derivative (PID) controller is illustrated, and
optimal operating conditions are determined. Because numerous simulation runs
may be completed in a short time, the relationship of the two opposing metrics is
easily visualized.
Traditional controller design generally consists of linearizing a model
about an operating point. This step was taken for two different operating points,
and the systematic design approach was used. A comparison of the optimal
regions selected using the non-linear model and the two linear models shows
similarities. The linearization point selection does, however, affect the turbine
performance slightly.
Exploitation of the simplicity of the model allows surfaces consisting of
operation under a wide range of gain values to be created. This methodology
provides a means of visually observing turbine performance based upon the two

iii
metrics chosen for this study. Design of a PID controller is simplified, and it is
possible to ascertain the best possible combination of controller parameters. The
wide, flat surfaces indicate that a PID controller is very robust in this variable-
speed wind turbine application.

iv
ACKNOWLEDGMENTS
The National Renewable Energy Laboratory has supported me throughout
this endeavor with facilities, expertise, and encouragement. I am especially
grateful to Michael Robinson for providing me with this research opportunity.

v
CONTENTS
CHAPTER
I. INTRODUCTION................................................................................. 1
II. BACKGROUND .................................................................................. 3
III. DYNAMIC MODELING...................................................................... 8
IV. TRADITIONAL CONTROLLER DESIGN METHODOLOGY....... 14
V. SYSTEMATIC CONTROLLER DESIGN METHODOLOGY ......... 18
VI. NON-LINEAR MODEL VS. LINEAR MODEL ............................... 29
VII. CONCLUSIONS................................................................................. 42
REFERENCES...................................................................................................... 45
APPENDIX A……………………………………………………………………47
APPENDIX B……………………………………………………………………53
APPENDIX C……………………………………………………………………80
APPENDIX D……………………………………………………………………93

vi
LIST OF TABLES
TABLE
1. Statistics describing wind input files ................................................... 18
2. Comparison of performance metrics for non-linear and linear
model-based controller designs........................................................... 34

vii
LIST OF FIGURES
FIGURE
1. General schematic of a control system .................................................. 3
2. Torque coefficient surface as a function of tip-speed ratio
and blade-pitch angle. ........................................................................... 9
3. Simulation block diagram.................................................................... 11
4. Controller block diagram..................................................................... 12
5. Actuator block diagram ....................................................................... 13
6. Power coefficient surface as a function of tip-speed ratio
and blade-pitch angle .......................................................................... 15
7. Example of cq vs. λ for 2 blade-pitch angles ....................................... 16
8. Performance metric surfaces generated using the non-linear
turbine model for kI=1 deg/rad............................................................ 20
9. Performance metric surfaces generated using the non-linear
turbine model for kI=5 deg/rad............................................................ 21
10. Performance metric surfaces generated using the non-linear
turbine model for kI=10 deg/rad.......................................................... 22
11. Time-series traces of turbine performance ........................................ 24
12. Rotor speed response to step wind input ........................................... 27
13. Pitch rate response to step in wind input ........................................... 27
14. RMS of pitch rate potential performance metric for kI=5 deg/rad .... 28
15. Performance metric surfaces generated using the linear
model (ωT OP = 11 rad/s; wOP = 7.5 m/s; and βOP = 9°)

viii
for kI=1 deg/rad ................................................................................... 30
16. Performance metric surfaces generated using the linear
model (ωT OP = 11 rad/s; wOP = 7.5 m/s; and βOP = 9°)
for kI=5 deg/rad ................................................................................... 31
17. Performance metric surfaces generated using the linear
model (ωT OP = 11 rad/s; wOP = 7.5 m/s; and βOP = 9°)
for kI=10 deg/rad ................................................................................. 32
18. Example of cP vs. λ for three pitch angles ......................................... 35
19. Performance metric surfaces generated using the linear
model (ωT OP = 11 rad/s; wOP = 10 m/s; and βOP = 12°)
for kI=1 deg/rad ................................................................................... 36
20. Performance metric surfaces generated using the linear
model (ωT OP = 11 rad/s; wOP = 10 m/s; and βOP = 12°)
for kI=5 deg/rad ................................................................................... 37
21. Performance metric surfaces generated using the linear
model (ωT OP = 11 rad/s; wOP = 10 m/s; and βOP = 12°)
for kI=10 deg/rad ................................................................................. 38
22. Regions of optimal operation............................................................. 39
23. Time series traces of turbine performance under the optimal
gains as determined using each of the three models ........................... 40

1
CHAPTER I
INTRODUCTION
Recently, utility-scale wind turbine manufacturers have begun to explore
the possibility of operating turbines at variable rotational speeds. Because
variable-speed wind turbines have the potential for increased energy capture,
controller design has become an area of increasing interest. Blade-pitch
regulation provides means for initiating rotation, varying rotational speed to
extract power at low wind speeds, and maintaining power production at a
maximum level. Controllers must be designed to meet each of these objectives,
but this study pertains only to constant power production.
The power regulation regime is entered when the turbine reaches the
design rotor speed for maximum power production. Under these conditions,
rotational speed is constrained to a specified maximum value through blade-pitch
regulation. Fluctuations in wind speed are accommodated to prevent large
excursions from the desired rotational speed. Thus the power production is also
constrained to a relatively constant level. In addition to maintaining a constant
rotational speed, actuator movement must be restrained to prevent fatigue and
overheating. The combination of maintaining a constant rotational speed and
minimizing actuator motion are the control objectives specified for the power
regulation regime.
Controller design has centered mainly on simple, linear, proportional-
integral-derivative (PID) controllers which are easily implemented in the field
environment. Gain selection for these controllers has generally been a trial-and-

2
error process relying on experience and intuition from the engineers. A
systematic approach to gain selection provides visualization of the potential
performance capabilities due to control.
This work presents a methodology for selecting gain values for a PID
controller that regulates rotor speed of a variable-speed wind turbine by adjusting
the blade-pitch angle. The dynamic model used to describe the turbine and its
operating environment is discussed. A traditional approach to PID controller gain
selection is presented for comparison to the systematic methodology. The
traditional approach consists of linearizing a model about an operating point.
Response to step input is examined, and the gains are altered until appropriate
damping behavior is observed. This approach relies heavily on trial-and-error.
Because control design generally begins with a linear model, a comparison of the
systematic gain selection methodology using non-linear and linear simulations
provides insight on the differences. The performance predictions using the
systematic design methodology based on non-linear and linear models are shown.

3
CHAPTER II
BACKGROUND
Control systems are generally reduced to two components, the plant and
the controller. The plant is the object or process being controlled, and the
controller uses output from the plant to adjust its input in order to achieve the
desired action. Figure 1 illustrates the relationship between these components.
As an example, wind turbine control algorithms have focused on maintaining
constant power through rotor speed regulation. In the case of maintaining
constant rotor speed, the input is generally the blade-pitch angle, (Uref, U) in
conjunction with a stochastic disturbance due to the wind (UD), and the output (y)
is rotor speed.
Uref
Controller
Plant
UD
+U
y
Figure 1: General schematic of a control system.
A literature review conducted by de la Salle et al., 1990, summarized the
status of wind turbine control at that time. They found that PI control acting on a
measurement of electrical power was the industry standard for constant-speed
machines, but publications dealing with variable-speed turbines were scant at that

4
time. Due to a lack of concise statement of objectives in the majority of
publications, assessment of controller performance was difficult. Lastly, they
concluded that many publications demonstrated performance improvement as a
result of control.
In a subsequent publication, Leithead et al., 1990, p. 511, suggest the
following control objectives:
• “Alleviate the transient loads throughout the wind turbine.• Regulate and smooth the power generated.• Cause the drive-train to have the appropriate dynamic behaviour.• Maximize the energy capture.”
Although these objectives were proposed for control of a three-bladed, constant
speed wind turbine, a relevant point is made regarding the specifications required
to achieve these objectives: “The different parts of the specification are not
complementary but are competing and an appropriate balance must be attained
(Leithead et al., 1990, p. 511).” Other than the drive-train behavior, these
objectives are appropriate for the different regimes of variable-speed turbine
operation. For instance, maximizing energy capture relates to the variable speed
operation regime. Power regulation is performed in above-rated wind speed
conditions which is the focus of this paper. Competing specifications of
maintaining constant rotational speed while minimizing actuator motion, the
control objectives of this study, dominate this design as well.
The majority of works dealing with constant speed turbines required
simulation of the drive-train dynamics. Generally, the drive-train consists of a
low-speed shaft, gearbox, high-speed shaft and generator. Also, the inherent
stiffness of the grid frequency added complexity. Variable-speed turbines,

5
however, may not include a gearbox in the drive-train, and they are very
compliant at the generator end. Thus, drive-train dynamics may be assumed to be
negligible to simplify variable-speed turbine models.
Control design revolves around an appropriate model of the plant. Wind
turbine design has been aided with the recent development of sophisticated design
codes that accommodate numerous degrees of freedom. However, control design
does not require complex models of each component. Leithead et al., 1989, p.
336, state “since the overall dynamic response of the complete wind turbine
system is required, the models for each component part may be simplified without
significant reduction in the accuracy of representation.” They use a simple
turbine model that consists of an aerodynamic model in the form of a look-up
table and a simple wind model.
As variable-speed wind turbines have become more prominent, the PID
controller has become the U.S. industry standard for blade-pitch control. This
controller regulates the error, or difference between the measured input and the
desired input. This error value along with its derivative and integral with respect
to time provide a signal to the actuator(s) which affects the controlled process.
Knowledge of the plant dynamics is not necessary, and often the three gains are
determined based on intuition and experience.
The PID controller is a linear, single-input-single-output controller limited
to three gains. These values are determined through a variety of methods. Stuart
et al. (1996), Arsudis and Bohnisch (1990), and Leithead et al. (1991) used
system identification techniques to estimate a transfer function of the wind turbine

6
about a particular operating point (wind speed). The controller is then limited to
those operating points specified and is specific to the wind turbine. In other
words, the controller is not designed for wind turbine operation at wind speeds
other than those specifically chosen for system identification, and the controller is
not transportable to other turbines.
Although significantly limited in its operation, favorable results were
produced using PID control by both Arsudis and Bohnisch (1990) and Stuart et al.
(1996). Arsudis and Bohnisch compared a self-tuning PID controller to one that
was “optimized manually based on an operation experience of several years (p.
565).” The self-tuning controller eliminated the overshoot of the blade angle
shown with the original controller, and the time lag to achieve the desired pitch
angle was reduced significantly with the self-tuning controller. Stuart et al.
showed that a PI controller developed using system identification reduced the
response time of the aileron deflection as compared to the previously used
controller. Comparison of the PI controller with a controller designed using
classical methods was the focus of work by Leithead et al. (1991). They
concluded that the classical design marginally outperformed the PI controller.
These studies have shown that simple controllers reduce variation about an
operating point, but the ultimate potential for improved performance as a result of
controlling rotor speed is not quantified. Also the PI gain selection process may
result in adequate operation, but there is no information as to the potential
improvement of performance with different gain values.

7
Although industry has embraced the PID controller, researchers have
begun to investigate the capabilities of more sophisticated control designs such as
state estimation designs. State estimation control successfully reduced power and
rotor torque excursions above rated levels according to Bossanyi (1989).
Constant power production and minimal torque vibrations were achieved with a
Linear Quadratic Optimal Output Feedback controller designed by Bongers et al.
(1989). Comparisons between PID controllers and state estimation based
controllers have been made by Kendall et al. (1997), and Ekelund (1994). A
Disturbance Accommodating Control based state estimator was found to be
slightly inferior to PI control by Kendall et al, but Ekelund’s Linear Quadratic
Controller was superior to PI control. In order to fairly make such comparisons, it
is necessary to establish the best possible baseline PID controller.
The greatest advantage of state estimation over PID control is the fact that
state estimator controllers can incorporate multiple inputs and multiple outputs.
Issues such as reducing blade root fatigue and shaft fatigue could be included in
the control objectives. However, in order to convince industry to shift toward
more complicated controllers, it is necessary to compare the state estimators with
PID controllers. Establishing the performance limitations of PID control through
systematic design methods will provide a basis for comparison with the
sophisticated controllers that potentially will offer greater benefit to the system as
a whole.

8
CHAPTER III
DYNAMIC MODELING
The simple, rigid, non-linear turbine model developed for the purpose of
controller design by Kendall et al., 1997 was used for this design study. The
geometry and aerodynamic characteristics of the simulated turbine resemble those
of a Grumman Windstream-33, 10-m diameter, 20-kW turbine. The National
Renewable Energy Laboratory’s National Wind Technology Center modified this
turbine to operate at variable speeds using blade-pitch regulation. The original
drive-train consisting of a low-speed shaft, gearbox, high-speed shaft, and
generator was replaced with a single, stiff, shaft and direct-drive generator.
Because the drive-train compliance was reduced to that of the stiff shaft only, it
has been neglected in this model.
The fundamental dynamics of this variable-speed wind turbine are
captured with the following simple mathematical model:
EATT QQJ −=ω! (1)
The moment of inertia of the turbine rotor, 1270 kg⋅m2, is represented by JT; ωT is
the angular shaft speed; QE is the mechanical torque necessary to turn the
generator and was assumed to be a constant value commanded by the generator.
Because the generator moment of inertia of a direct-drive turbine is generally
several orders of magnitude less than JT, it has been neglected. The aerodynamic
torque, QA, is represented by:
( ) 2,2
1wARcQ qA βλρ= (2)

9
The air density, ρ, swept area of the rotor, A, and rotor radius, R, are constant.
The radius of this particular turbine is 5 m. The wind speed is given by w.
The torque coefficient, cq, is a highly non-linear function of tip-speed
ratio, λ, and blade-pitch angle, β as illustrated in Figure 2. The tip-speed ratio is
defined as the ratio of the blade tip speed to the prevailing wind speed. The
surface presented in Figure 2 shows only positive values of cq because the turbine
operates most often in this region. These non-linear aerodynamic characteristics
are implemented as a look-up table which was generated using PROPPC (Tangler,
1987). This aerodynamics code uses blade-element momentum theory and
empirical models that predict stalled operation and blade tip losses.
-5
2
9
16
0 1 2 3 4 5 6 7 8 9 10 11 12 13 140
0.01
0.02
0.03
0.04
0.05
0.06
0.07
0.08
To
rqu
e Co
efficient (C
q)
Pitch Angle (deg)
Tip Speed Ratio
0.07-0.080.06-0.070.05-0.060.04-0.050.03-0.040.02-0.030.01-0.020-0.01
Figure 2: Torque coefficient surface as a function of tip-speed ratio andblade-pitch angle. All negative cq values have been set to zero.

10
Because power limitation through speed regulation is the ultimate purpose
for the controller, it is important to recognize the relationship between the power
coefficient and the torque coefficient. Power extracted from the wind is shown in
the following equation:
3),(5.0 wAcP P βλρ= (3)
Because the torque coefficient is related to the power coefficient, cP, through the
following relation
( ) ( )βλλβλ ,, qP cc = (4)
manipulation of the torque coefficient using λ and β will result in manipulation of
the power produced by the turbine.
The block diagram in Figure 3 illustrates the simulation logic as
implemented with MATLAB Simulink software. Actual wind data sampled
at 1 Hz is input to the non-linear plant model. The turbine speed is fed back, and
the reference speed, ωT ref, is subtracted from it resulting in ∆ωT (noise in the
sensor measurements has been neglected). This rotor-speed error is input to the
controller which commands a change in blade-pitch angle, ∆β, based on ∆ωT.
The new pitch angle requested is then β = ∆β + βref, which is physically limited to
angles between 3° and 60° (Selection of the reference speed and reference pitch
angle is described in Chapter IV.). The actuator operates on a pitch rate command.
The pitch rate is determined from the difference between the commanded pitch
angle and the measured blade-pitch angle (noise in the measurements is again
neglected). The simulation uses a variable step size with a maximum step of 0.05
seconds. A new wind speed is read from the input file when the simulation time

11
step corresponds to the time step of the wind data. A new rotational speed is then
determined at the resulting tip-speed ratio and blade-pitch angle.
ReferenceSpeed(ωωωωTref)
PIDController
Pitch AngleLimits
Actuator
Non-LinearTurbinePlant
ReferencePitch (ββββref)
WindSpeed
-+
++∆ω∆ω∆ω∆ωΤΤΤΤ ∆β∆β∆β∆β
ωωωωΤΤΤΤ
Figure 3: Simulation block diagram.
A block diagram of the Proportional-Integral-Derivative (PID) controller
is shown in Figure 4. The difference, or error, between the measured rotor speed
and the desired rotor speed is manipulated with three gain values resulting in the
pitch angle change necessary to eliminate the error. A proportional value, kP,
multiplies the error signal. The integral with respect to time of the error signal is
multiplied by the gain, kI. The gain kD multiplies the derivative of the error
signal. The summation of these three terms produces the desired change in blade-
pitch angle.

12
RotorSpeedError
kI / s
skD
RequestedPitchChange
kP
Proportional Gain
Derivative andDerivative Gain
Integral andIntegral Gain
+
Figure 4: Controller block diagram.
Hydraulic actuators that adjust the blade-pitch angle are simulated for this
study, and the block diagram in Figure 5 illustrates the actuator’s operation.
Hydraulic fluid tends to overheat with excessive pitch motion requiring judicious
use of the actuator. Additionally the linkage between the actuator and the blade-
pitch mechanism may fatigue with overuse of the actuator. The pitch rate that is
commanded by the actuator was physically limited to ± 10 degrees per second
according to manufacturer recommendations. Another measure meant to reduce
actuator motion and eliminate noise in the command signal (once it is introduced
into the simulation) is the inclusion of a “dead zone” to ignore commanded pitch
rates less than ± 0.1 deg/second.

13
RequestedPitch Angle
1_s
LimitPitchRate
BladePitchAngle-
+
ActualPitchRate
2kA
CommandedPitch Rate
Pitch Measurement
IntegrateDeadZone
Figure 5: Actuator block diagram.
In order to assess controller performance, two metrics were developed by
Kendall et al. (1997). The root mean square (RMS) of the error between the
actual rotational speed and the desired rotational speed indicates the capability of
the controller to reject the wind speed fluctuations. After the simulation is
completed (90 seconds), the RMS of the error is computed. The Actuator Duty
Cycle (ADC) was proposed as a measure of actuator motion during a simulation
run. It is simply the total number of degrees pitched over the time period of the
simulation. In order to prevent over-heating of the hydraulic fluid, this value
must remain below 3 deg/s based on information provided by the manufacturer.
For each simulation run, these two metrics were computed, and both must be
considered in determining acceptable operating conditions.

14
CHAPTER IV
TRADITIONAL CONTROLLER DESIGN METHODOLOGY
A traditional approach to design of commonly used linear controllers such
as proportional-integral-derivative (PID), requires that the non-linear turbine
dynamics be linearized about a specified operating point. Once stability is
attained, observation of the system response to step inputs provides direction in
choosing gain values. This approach yields gain values which will provide
adequate performance.
Linearization of the turbine equation (1) results in the following assuming
that QA|OP=QE|OP:
βδαωγω ∆+∆+∆= wJ TTT! (5)
where the linearization coefficients are given by:
OP
q
OP
OP
TT
OP
q
OPOPqOP
OP
TT
OP
q
OP
OPT
TT
cwARJ
ccARw
wJ
cwARJ
∂β∂
ρ∂βω∂δ
∂λ∂
λρ∂ω∂α
∂λ∂
ρ∂ωω∂γ
2
2
2
1
22
1
2
1
==
−==
==
!
!
!
Here, ∆ωT, ∆w, and ∆β represent deviations from the chosen operating point,
ωTOP, wOP, and βOP.
Selection of the operating point is critical to preserving aerodynamic
stability in this system. The rotational speed operating point, ωT OP, was selected
to be the desired constant speed of the turbine, 105 RPM (11 rad/s). The blade-
15
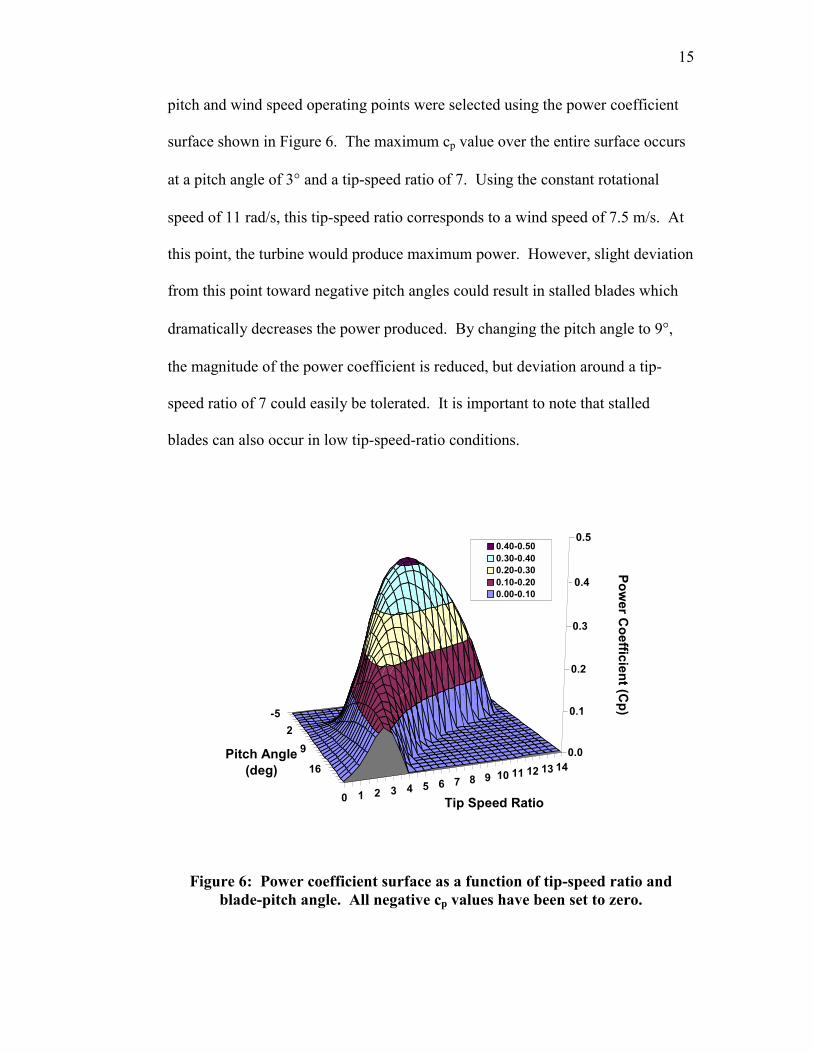
pitch and wind speed operating points were selected using the power coefficient
surface shown in Figure 6. The maximum cp value over the entire surface occurs
at a pitch angle of 3° and a tip-speed ratio of 7. Using the constant rotational
speed of 11 rad/s, this tip-speed ratio corresponds to a wind speed of 7.5 m/s. At
this point, the turbine would produce maximum power. However, slight deviation
from this point toward negative pitch angles could result in stalled blades which
dramatically decreases the power produced. By changing the pitch angle to 9°,
the magnitude of the power coefficient is reduced, but deviation around a tip-
speed ratio of 7 could easily be tolerated. It is important to note that stalled
blades can also occur in low tip-speed-ratio conditions.
-5
2
9
16
0 1 2 3 4 5 6 7 8 9 10 11 12 13 140.0
0.1
0.2
0.3
0.4
0.5
Po
we
r Co
effic
ien
t (Cp
)
Pitch Angle (deg)
Tip Speed Ratio
0.40-0.500.30-0.400.20-0.300.10-0.200.00-0.10
Figure 6: Power coefficient surface as a function of tip-speed ratio andblade-pitch angle. All negative cp values have been set to zero.

16
Figure 7 is an example of the torque coefficient, cq, varying with tip speed
ratio, λ, for pitch angles of 3° and 9°. The peak cq value delineates theoretically
stalled and unstalled operating conditions. The region where the slope of the cq
curve is positive corresponds to stalled operating conditions. The chosen
operating point of β=9° and λ=7 permits deviation of the tip-speed-ratio without
causing blade stall. At this point on the cp surface, the power coefficient may be
approximated by a relatively flat plane tangent to the surface which is ideal for
linearized models. Thus, the linearization operating point was chosen to be: ωT OP
= 11 rad/s; wOP = 7.5 m/s; and βOP = 9°. The peak of the cp surface represents the
reference values used in the simulation: : ωT ref = 11 rad/s; wref = 7.5 m/s; and βref
= 3°.
0
0.01
0.02
0.03
0.04
0.05
0.06
0.07
0.08
0 1 2 3 4 5 6 7 8 9 10 11 12 13 14 15
Tip Speed Ratio (λλλλ)
To
rqu
e C
oef
fici
ent
(Cq)
3 degrees9 degrees
Figure 7: Example of cq vs. λλλλ for 2 blade-pitch angles.

17
In order to determine regions of stable, controlled operation, the closed-
loop transfer function between the output rotational speed and the reference speed
is determined in the Laplace domain. The denominator of this equation is a third-
order polynomial. A Routh array analysis requires each of the coefficients of the
polynomial to be positive in order for the poles of the system to lie in the left-half
plane producing stable, closed-loop operation. The full analysis is found in
Appendix A, but the gains must be as follows in order to maintain stability: kP>-1
deg⋅s/rad, kI>0 deg/rad, kD>-8 deg⋅s2/rad, and (8+kD)(1+kP)>kI. For this linear
approximation of the system, stability is maintained over a wide region.
At this point the designer may examine the system response to step input
in order to select values for each of the gains. A step function approximates an
abrupt change in wind speed and was used by Kendall et al. (1997) to tune a PI
controller. Visual inspection of the rotor speed response and the pitch rate
response may be used to determine the best combination of kP and kI gains to
achieve appropriate damping of the system. However, when the third gain is
introduced, this trial and error method becomes much more tedious and
complicated. This method does not provide the designer with a feel for the
sensitivity of the controller to slight variations in the gain values, and an optimal
range of gain values is not identified.

18
CHAPTER V
SYSTEMATIC CONTROLLER DESIGN METHODOLOGY
In order to systematically determine combinations of three gains that
produce acceptable operating conditions, the simulation was used repeatedly.
Each of the gains was varied over a wide region, and the two metrics were
computed for each run. Additionally, the five different wind input cases shown in
Table 1 were used. The average value of the metrics under each combination of
gains and each wind input case was computed. Contour plots for both metrics
were created while the kP and kD gains were varied at a specific kI. This was done
for a range of kI values from 1 to 20. Trade-off studies between the series of
surfaces were performed to determine the region where optimal operating
conditions exist. Lastly, time-series traces of rotational speed, pitch angle, and
pitch rate for gain combinations within this region were produced to verify
acceptable operation.
Table 1: Statistics describing wind input files.
FileName
Mean(m/s)
StandardDeviation
RMS
Wind3 9.20 1.14 9.27Wind4 11.43 2.28 11.66Wind5 10.88 1.85 11.03Medwind2 10.31 1.82 10.46Highwind4 14.43 2.41 14.63
Figures 8-10 depict surfaces for three different values of kI for both of the
metrics. All of the contour plots indicate wide, flat surfaces for both the actuator

19
duty cycle and the RMS of the rotational speed error. These surfaces illustrate
that a wide range of gain value combinations may be chosen with similar results.
Thus the controller is robust and relatively insensitive to changes in the values of
the gains. However, choosing optimal operating setpoints for the gains requires
closer examination of the surfaces.
The actuator duty cycle surface for kI=1, Figure 8a, indicates that the mean
value decreases rapidly to zero as kP and kD approach one. Figure 9a, which
represents the surface at kI=5, portrays the opposite effect near kP=1 and kD=1,
but a “bucket” with a minimum value of 0.9-1.0 deg/s appears at moderate gain
values of 5-10 for both kP and kD. As the value of kI is further increased to 10 in
Figure 10a, the “bucket” again appears, but its minimum value of 1.0-1.1 is
greater than that of the “bucket” that appears at kI=5. Therefore, the minimum
value of actuator duty cycle over the entire range of the three gain values occurs
somewhere between kI=1 and kI=5. The trend toward higher actuator duty cycle
values as kI increases is shown in Appendix B along with tables containing the
simulation output values.
A similar comparison of the RMS speed error surfaces was performed to
determine the location of its minimum value over the entire range of gain values.
Figure 8b indicates a sharply increasing slope in the RMS speed error for
kP<20.As the integral gain, kI, increases from 1 to 5 in Figure 9b, this sharp slope
boundary decreases to kP<7. Increasing the integral gain to 10, Figure 10b, moves
the slope increase to kP<5. The RMS speed error slowly decreases as kP increases
such that the minimum value would occur beyond the range of the plot. However,

20
1 10 20 30 40 50 60 70
151015202530354045505560657075
Derivative Gain (deg s2/rad)
Pro
po
rtion
al Gain
(deg
s/rad)
2.00-2.101.90-2.001.80-1.901.70-1.801.60-1.701.50-1.601.40-1.501.30-1.401.20-1.301.10-1.201.00-1.100.90-1.000.80-0.900.70-0.800.60-0.700.50-0.60
0.9-1.0
1.2-1.3
1.1-1.21.0-1.1
1.4-1.5
1.3-1.4
(a) Actuator duty cycle (deg/s)
1 10 20 30 40 50 60 70
151015202530354045505560657075
Derivative Gain (deg s2/rad)
Pro
po
rtion
al Gain
(deg
s/rad)
0.45-0.500.40-0.450.35-0.400.30-0.350.25-0.300.20-0.250.15-0.200.10-0.150.05-0.100.00-0.05
0.1-0.15
0.25-0.3
0.2-0.25
0.15-0.2
(b) RMS rotor speed error (rad/s)
Figure 8: Performance metric surfaces generated using the non-linearturbine model for kI=1 deg/rad.
for kI=5 to 10, the surface flattens to a mean RMS speed error of 0.05-0.10. Thus
changing the value of kI alters the point of sharply increasing slope as the

21
1 10 20 30 40 50 60 70
151015202530354045505560657075
Derivative Gain (deg s2/rad)
Pro
po
rtion
al Gain
(deg
s/rad)
2.00-2.101.90-2.001.80-1.901.70-1.801.60-1.701.50-1.601.40-1.501.30-1.401.20-1.301.10-1.201.00-1.100.90-1.000.80-0.900.70-0.800.60-0.700.50-0.60
0.9-1.0
1.3-1.4
1.2-1.3
1.1-1.2
1.0-1.1
*C
*B
*A
1.4-1.5
(a) Actuator duty cycle (deg/s)
1 10 20 30 40 50 60 70
151015202530354045505560657075
Derivative Gain (deg s2/rad)
Pro
po
rtion
al Gain
(deg
s/rad)
0.45-0.500.40-0.450.35-0.400.30-0.350.25-0.300.20-0.250.15-0.200.10-0.150.05-0.100.00-0.05
*A
*B
*C
0.05-0.1
0.2-0.250.15-0.2
0.1-0.15
(b) RMS rotor speed error (rad/s)
Figure 9: Performance metric surfaces generated using the non-linearturbine model for kI=5 deg/rad.
proportional gain is reduced, but the flat region from which the sloped area
originates is maintained.

22
1 10 20 30 40 50 60 70
151015202530354045505560657075
Derivative Gain (deg s2/rad)
Pro
po
rtion
al Gain
(deg
s/rad)
2.00-2.101.90-2.001.80-1.901.70-1.801.60-1.701.50-1.601.40-1.501.30-1.401.20-1.301.10-1.201.00-1.100.90-1.000.80-0.900.70-0.800.60-0.700.50-0.60
1.0-1.1
1.2-1.3
1.4-1.5
1.3-1.4
1.1.1.2
(a) Actuator duty cycle (deg/s)
1 10 20 30 40 50 60 70
151015202530354045505560657075
Derivative Gain (deg s2/rad)
Pro
po
rtion
al Gain
(deg
s/rad)
0.45-0.500.40-0.450.35-0.400.30-0.350.25-0.300.20-0.250.15-0.200.10-0.150.05-0.100.00-0.05
0.5-0.1
0.15-0.2
0.1-0.15
(b) RMS rotor speed error (rad/s)
Figure 10: Performance metric surfaces generated using the non-linearturbine model for kI=10 deg/rad.
Both the RMS speed error and the actuator duty cycle must be considered
in choosing the optimal operating conditions. If the integral gain were reduced
from a value of 5, the RMS speed error surface would retain similar

23
characteristics, but the boundary of increasing slope would begin to move from
kP=7 towards kP = 20. The actuator duty cycle surface would also retain similar
characteristics, but the sharp rise as kP and kD approach one would begin to drop
toward zero. The “bucket” would remain in approximately the same location.
Thus, reducing kI from 5 has little effect on the actuator duty cycle in the region
of the “bucket,” but the corresponding RMS speed error in that region increases.
However, if the integral gain were increased, the “bucket” would begin to rise.
Therefore, in order to minimize the RMS speed error and the actuator duty cycle
simultaneously, the integral gain should be set at 5.
Using an integral gain of 5, the minimum actuator duty cycle region, 0.9-
1.0 deg/s corresponds to an RMS speed error range of 0.15-0.20 rad/s. The point
A on Figure 9a and 9b represents operating conditions where the actuator duty
cycle is minimized (kP=10, kI=5, kD=10). An example of operation in the lowest
RMS speed error range uses the operating condition at Point B (kP=70, kI=5,
kD=50) shown on Figure 9a and 9b. Because the RMS speed error slowly
decreases as the proportional and derivative gains are increased, this point also
indicates operation in the low end of the lowest RMS speed error contour.
To determine which metric is more important, time-series traces of rotor
speed, blade-pitch angle, and pitch rate are presented in Figure 11. The
performance is shown for three different gain combinations based on the surfaces
shown in Figure 9. The wind input for each simulation represents the highest
average wind speed used in this study which produces the most extreme
conditions. Figure 11a includes the time-series of the wind input.

24
0
10
20
30
0 30 60 90
Time (seconds)
Win
d S
pe
ed
(m
/s)
(a)
95
100
105
110
115
0 30 60 90
Time (seconds)
Ro
tor
Sp
ee
d (
RP
M) Point A
Point BPoint C (b)
0
10
20
30
0 30 60 90
Time (seconds)
Pit
ch A
ng
le (
deg
) Point APoint BPoint C (c)
-10
-5
0
5
10
0 30 60 90
Time (seconds)
Pit
ch
Ra
te (
de
g/s
) Point APoint BPoint C (d)
Figure 11: Time-series traces of turbine performance.
Operation at Point A represents the trade-off between minimum actuator
duty cycle and a higher level of RMS speed error. The rotational speed deviation

25
from the desired 105 RPM, shown in Figure 11b, is slightly greater than ±5 RPM.
The pitch rate, illustrated in Figure 11d, does not exceed ±5 deg/s. In this case the
goal of maintaining constant rotational speed is not met satisfactorily. Operation
at Point B depicts the trade-off between minimum RMS speed error and a higher
level of actuator duty cycle. In this case the rotational speed deviation from the
reference is less than ±2 RPM, and the pitch rate reaches the limit of 10 deg/s.
The pitch rate also indicates excessive motion at approximately 45 seconds. This
type of motion is unacceptable when attempting to reduce fatigue and the
potential for overheating.
Point C (kP=30, kI=5, kD=20) was chosen at the intersection of the
minimum RMS speed error range and the lowest corresponding actuator duty
cycle. The rotational speed, pitch angle, and pitch rate obtained at this operating
point are included in Figure 11. The rotational speed closely tracks the desired
105 RPM throughout the simulation with peak deviations of less than ±3 RPM.
The actuator duty cycle does not reach the limit, and the curve is smoother than
that produced at the gain combination of Point B. Operation within this region
results in the best possible combination of the two performance metrics. Figure
11c indicates that the pitch angle commanded by the controller is not noticeably
affected by the choice of gain values.
When using a traditional design methodology, the engineer would subject
the system to step inputs and examine the response in order to adjust the gain
values. In this case of the variable-speed turbine, one would presume that the
rotor speed response should be overdamped and have a short settling time on the

26
order of less than 5 seconds. In other words, the turbine should respond quickly
to wind gusts, and the rotor speed should return to the desired speed without
dropping below the stated value. The pitch rate response would also be expected
to respond in an overdamped manner to reduce unnecessary motion as the speed
returned to its constant value. Again, a quick response (< 5 seconds) seems
appropriate.
The non-linear, turbine model was subjected to wind gusts simulated with
step inputs while the gain values reflected those of each of three points selected
above. The rotor speed responses are shown in Figure 12 and differ from the
above predicted response. The time required to return to a constant speed is
lengthy, 25 seconds when the gains were in the optimal region. At Point A, the
lowest actuator duty cycle region, the rotor response is under-damped, dropping
below the constant speed while the response is over-damped, as suspected, at
Points B and C. The pitch rate responses are shown in Figure 13. At Point A, the
pitch rate nearly reaches the limit and then slowly drops back to a stationary
point. Point B, on the other hand, produces a pitch rate that nearly reaches the
limit, then becomes negative before returning to zero. At Point C, the optimal
gain combination, the pitch rate jumps almost immediately to just below the rate
limit and then drops almost as quickly back to zero.
If one were designing this controller in a traditional manner, it is
conceivable that none of these gain combinations would be selected. The long
settling time evident in the rotor speed response seems contradictory, and the
extreme amplitude of the pitch rate is surprising. However, because the wind

27
10.5
11.0
11.5
0 10 20 30
Time (seconds)
Ro
tor
Sp
eed
(ra
d/s
)Point APoint BPoint C
Figure 12: Rotor speed response to step in wind input.
-10
-5
0
5
10
0 10 20 30
Pit
ch
Ra
te (
de
g/s
)
Point A
Point B
Point C
Figure 13: Pitch rate response to step in wind input.
actually behaves as a persistent disturbance, instead of a single step, the
traditional view of PID controller performance is questionable.
The systematic approach presented herein relies heavily on the two
specific metrics that were selected for this particular application. The hydraulic
actuators that were simulated for this study could easily be replaced by servo-
mechanical actuators. In this case, the actuator duty cycle metric would not
apply. However, servo motors are also susceptible to over-heating. Constant
acceleration of the motor draws current which could lead to heat build-up if the
blade-pitch rate is not regulated.

28
Substituting the RMS of the pitch rate signal for the actuator duty cycle
yields the surface shown in Figure 14. This surface represents kP and kD gain
variations while the integral gain is 5 and corresponds to actuator duty cycle
surface shown in Figure 9a. The RMS pitch rate surface is very similar to the
corresponding actuator duty cycle surface. A trade-off study could be performed
between the corresponding RMS speed error surface shown in Figure 9b and the
RMS pitch rate surface to determine which gain combination will provide the best
overall performance of the turbine. Due to the similar gain sensitivity illustrated
by the actuator duty cycle and the RMS pitch rate, the optimal gain combinations
will also be similar.
1 10 20 30 40 50 60 70
151015202530354045505560657075
Derivative Gain (deg s2/rad)
Pro
po
rtion
al Gain
(deg
s/rad)
2.00-2.10
1.90-2.00
1.80-1.90
1.70-1.80
1.60-1.70
1.50-1.60
1.40-1.50
1.30-1.40
1.20-1.30
1.10-1.20
1.00-1.10
0.90-1.00
0.80-0.90
0.70-0.80
1.2-1.3
1.7-1.8
1.6-1.7
1.5-1.6
1.4-1.5
1.3-1.4
Figure 14: RMS of pitch rate potential performance metric for kI=5 deg/rad.

29
CHAPTER VI
NON-LINEAR MODEL VS. LINEAR MODEL
Controller design theory is based almost exclusively on the assumption
that a linear model of a system will closely approximate the non-linear behavior
observed in reality. Because the initial action a control engineer takes is to
linearize the system about a chosen operating point, it is useful to explore the
consequences of such action through comparison with a non-linear model. The
systematic design approach described in Chapter V was applied to surfaces
created using a linear turbine model for comparison with those generated by the
non-linear model. The linearized turbine described in Chapter IV was inserted
into the Simulink model, and the gains were varied as described in Chapter V.
Surfaces depicting the actuator duty cycle and RMS speed error were created.
Figures 15-17 contain the surfaces generated using the linear model of the
turbine (ωT OP = 11 rad/s; wOP = 7.5 m/s; and βOP = 9°). Again, the average
performance over five wind input cases was computed for both RMS speed error
and actuator duty cycle over the entire range of gain values. These surfaces
portray similar characteristics to those generated using the non-linear model of the
turbine. The actuator duty cycle surface for kI=1 drops sharply toward zero for
low values of kP and kD, while the “bucket” is evident on the surface
corresponding to kI=5. The RMS speed error surfaces all show a flat plane that
slopes up sharply for low values of kP as was seen on the non-linear model
surfaces. This linear model produces an additional contour representing

30
1 10 20 30 40 50 60 70
151015202530354045505560657075
Derivative Gain (deg s2/rad)
Pro
po
rtion
al Gain
(deg
s/rad)
2.00-2.101.90-2.001.80-1.901.70-1.801.60-1.701.50-1.601.40-1.501.30-1.401.20-1.301.10-1.201.00-1.100.90-1.000.80-0.900.70-0.800.60-0.700.50-0.60
0.9-1.0
1.3-1.4
1.2-1.3
1.1-1.2
1.0-1.1
1.4-1.5
(a) Actuator duty cycle (deg/s)
1 10 20 30 40 50 60 70
151015202530354045505560657075
Derivative Gain (deg s2/rad)
Pro
po
rtion
al Gain
(deg
s/rad)
0.45-0.500.40-0.450.35-0.400.30-0.350.25-0.300.20-0.250.15-0.200.10-0.150.05-0.100.00-0.05 0.1-0.15
0.3-0.35
0.25-0.3
0.15-0.2
(b) RMS Speed Error (rad/s)
Figure 15: Performance metric surfaces generated using the first linearmodel (ωωωωT OP = 11 rad/s; wOP = 7.5 m/s; and ββββOP = 9°°°°) for kI=1 deg/rad.
0.0-0.05 RMS speed error for integral gains of 5 and higher. This contour does
not appear in Figures 9 and 10 which were generated by the non-linear model.
The gentle slope toward the high kP values of the surfaces appears slightly

31
1 10 20 30 40 50 60 70
151015202530354045505560657075
Derivative Gain (deg s2/rad)
Pro
po
rtion
al Gain
(deg
s/rad)
2.00-2.101.90-2.001.80-1.901.70-1.801.60-1.701.50-1.601.40-1.501.30-1.401.20-1.301.10-1.201.00-1.100.90-1.000.80-0.900.70-0.800.60-0.700.50-0.60
0.9-1.0
1.3-1.4
1.2-1.31.1-1.21.0-1.1
1.4-1.5
*C
*B
*A
(a) Actuator duty cycle (deg/s)
1 10 20 30 40 50 60 70
151015202530354045505560657075
Derivative Gain (deg s2/rad)
Pro
po
rtion
al Gain
(deg
s/rad)
0.45-0.500.40-0.450.35-0.400.30-0.350.25-0.300.20-0.250.15-0.200.10-0.150.05-0.100.00-0.05
0.0-0.05
0.15-0.2
0.1-0.15
0.05-0.1
*C
*B
*A
(b) RMS speed error (rad/s)
Figure 16: Performance metric surfaces generated using the first linearmodel (ωωωωT OP = 11 rad/s; wOP = 7.5 m/s; and ββββOP = 9°°°°) for kI=5 deg/rad.
sharper than that of the surfaces generated using the non-linear model.
A similar trade-off study was performed to select the region of optimal
operation. For reasons described in Chapter V, the integral gain was determined

32
1 10 20 30 40 50 60 70
151015202530354045505560657075
Derivative Gain (deg s2/rad)
Pro
po
rtion
al Gain
(deg
s/rad)
2.00-2.101.90-2.001.80-1.901.70-1.801.60-1.701.50-1.601.40-1.501.30-1.401.20-1.301.10-1.201.00-1.100.90-1.000.80-0.900.70-0.800.60-0.700.50-0.60
1.1-1.2
1.5-1.6
1.4-1.5
1.3-1.4
1.2-1.3
(a) Actuator duty cycle (deg/s)
1 10 20 30 40 50 60 70
151015202530354045505560657075
Derivative Gain (deg s2/rad)
Pro
po
rtion
al Gain
(deg
s/rad)
0.45-0.500.40-0.450.35-0.400.30-0.350.25-0.300.20-0.250.15-0.200.10-0.150.05-0.100.00-0.05 0.0-0.05
0.15-0.2
0.1-0.15
0.05-0.1
(b) RMS speed error (rad/s)
Figure 17: Performance metric surfaces generated using the first linearmodel (ωωωωT OP = 11 rad/s; wOP = 7.5 m/s; and ββββOP = 9°°°°) for kI=10 deg/rad.

33
to be 5 for the best accommodation of the two metrics. Again, Point A represents
operation in the lowest actuator duty cycle region which corresponds to somewhat
higher RMS speed error. Point B was selected to represent operation in the
lowest RMS speed error contour with a slightly elevated actuator duty cycle.
Lastly, Point C corresponds to the best trade-off between the two: the intersection
between one of the lowest RMS speed error contours and the corresponding
minimum region of actuator duty cycle.
The magnitudes of the metrics as well as the gain values are identical
between the two models for Point A as shown in Table 2. The additional contour
that appears in the RMS speed error surface generated by the linear model, Figure
16b, would alter the selection of Point B slightly. A proportional gain greater
than 70 would place the point in the lowest RMS speed error contour. Also, the
compromise point, C, must be based on the second lowest RMS speed error
contour due to the additional contour that results from use of the linear model.
The intersection of the second lowest RMS speed error contour and the
corresponding actuator duty cycle contour are in a slightly different location than
the corresponding point on the non-linear model generated surface. This leads to
slightly different gain values in this region of optimal operation.
The design approach was repeated using the linear model in order to
assess the dependence on operating point selection. Using the cP surface shown in
Figure 6, the first operating point was selected a distance away from the peak and
on the sloped side that prevents blade stall. Simply increasing the pitch angle
from 9° to 12° and maintaining the tip-speed-ratio of 7 places the point in the

34
negative power coefficient region. By shifting the linearization point in both
pitch angle and tip-speed-ratio, the tangent area around the point is maintained
near the top of the curve as shown in Figure 18. This tip-speed-ratio of 5
corresponds to a wind speed of 10 m/s when maintaining the rotor speed at 11
Table 2: Comparison of performance metrics for non-linear and linearmodel-based controller designs.
Non-Linear Model DesignActuator DutyCycle (deg/s)
RMS SpeedError (rad/s)
Point AkP=10, kI=5, kD=10
0.9-1.0 0.10-0.15
Point BkP=70, kI=5, kD=50
1.2-1.3 0.05-0.10
Point CkP=30, kI=5, kD=25
1.1-1.2 0.05-0.10
Linear I: ωωωωT OP = 11 rad/s;wOP = 7.5 m/s; and ββββOP = 9°°°°
Point AkP=10, kI=5, kD=10
0.9-1.0 0.15-0.20
Point BkP=75, kI=5, kD=50
1.3-1.4 0.00-0.05
Point CkP=25, kI=5, kD=20
1.1-1.2 0.05-0.10
Linear II: ωωωωT OP = 11 rad/s;wOP = 10 m/s; and ββββOP = 12°°°°
Point AkP=10, kI=5, kD=10
0.9-1.0 0.15-0.20
Point BkP=75, kI=5, kD=50
1.2-1.3 0.00-0.05
Point CkP=20, kI=5, kD=15
1.0-1.1 0.05-0.10

35
0.00
0.10
0.20
0.30
0.40
0.50
0 1 2 3 4 5 6 7 8 9 10 11 12 13 14 15
Tip Speed Ratio (λλλλ)
Po
we
r C
oe
ffic
ien
t (c
P)
3 degrees9 degrees12 degreesReference Point∗∗∗∗
∗∗∗∗ ∗∗∗∗Linear II Linear I
Figure 18: Example of cP vs. λλλλ for three pitch angles.
rad/s. Thus the second linearization point was selected to be as follows: ωT OP =
11 rad/s; wOP = 10 m/s; and βOP = 12°.
Again, the surfaces were generated over a range of gain values, and a
trade-off study was performed to select an optimal operating region. The surfaces
shown in Figures 19-21 illustrate similar characteristics to those generated using
the non-linear model (Figures 8-10), and Points A, B, and C represent operation in
the various regions as described above. Table 2 includes the performance metric
magnitudes as well as the selected gain values for the linear model design based
on this second operating point.
In general, the surfaces created by all three models are similar. The
second linear model (ωT OP = 11 rad/s; wOP = 10 m/s; and βOP = 12°) surfaces
more closely represent those generated by the non-linear model. The actuator
duty cycle increases toward the perimeters of the surface most rapidly when the

36
1 10 20 30 40 50 60 70
151015202530354045505560657075
Derivative Gain (deg s2/rad)
Pro
po
rtion
al Gain
(deg
s/rad)
2.00-2.101.90-2.001.80-1.901.70-1.801.60-1.701.50-1.601.40-1.501.30-1.401.20-1.301.10-1.201.00-1.100.90-1.000.80-0.900.70-0.800.60-0.700.50-0.60
0.9-1.0
1.3-1.4
1.2-1.3
1.1-1.2
1.0-1.1
(a) Actuator duty cycle (deg/s)
1 10 20 30 40 50 60 70
151015202530354045505560657075
Derivative Gain (deg s2/rad)
Pro
po
rtion
al Gain
(deg
s/rad)
0.45-0.500.40-0.450.35-0.400.30-0.350.25-0.300.20-0.250.15-0.200.10-0.150.05-0.100.00-0.05
0.05-0.1
0.2-0.25
0.15-0.2
0.1-0.15
(b) RMS speed error (rad/s)
Figure 19: Performance metric surfaces generated using the second linearmodel (ωωωωT OP = 11 rad/s; wOP = 10 m/s; and ββββOP = 12°°°°) for kI=1 deg/rad.
first linear model (ωT OP = 11 rad/s; wOP = 7.5 m/s; and βOP = 9°) is used, and the
corresponding non-linear model based surface is the flattest. Comparison of the
RMS speed error surfaces for kI=5 deg/rad (Figures 9b, 16b, and 20b) indicates

37
1 10 20 30 40 50 60 70
151015202530354045505560657075
Derivative Gain (deg s2/rad)
Pro
po
rtion
al Gain
(deg
s/rad)
2.00-2.101.90-2.001.80-1.901.70-1.801.60-1.701.50-1.601.40-1.501.30-1.401.20-1.301.10-1.201.00-1.100.90-1.000.80-0.900.70-0.800.60-0.700.50-0.60
0.9-1.0
*C
*B
*A
1.3-1.4
1.2-1.3
1.1-1.2
1.0-1.1
(a) Actuator duty cycle (deg/s)
1 10 20 30 40 50 60 70
151015202530354045505560657075
Derivative Gain (deg s2/rad)
Pro
po
rtion
al Gain
(deg
s/rad)
0.45-0.500.40-0.450.35-0.400.30-0.350.25-0.300.20-0.250.15-0.200.10-0.150.05-0.100.00-0.05
0.0-0.05
*C
*B
*A 0.1-0.15
0.05-0.1
(b) RMS speed error (rad/s)
Figure 20: Performance metric surfaces generated using the second linearmodel (ωωωωT OP = 11 rad/s; wOP = 10 m/s; and ββββOP = 12°°°°) for kI=5.
that the non-linear model generated surface is the flattest, and the second linear
model surfaces are the steepest. Thus, in the area surrounding Point C, the

38
1 10 20 30 40 50 60 70
151015202530354045505560657075
Derivative Gain (deg s2/rad)
Pro
po
rtion
al Gain
(deg
s/rad)
2.00-2.101.90-2.001.80-1.901.70-1.801.60-1.701.50-1.601.40-1.501.30-1.401.20-1.301.10-1.201.00-1.100.90-1.000.80-0.900.70-0.800.60-0.700.50-0.60
1.0-1.1
1.3-1.4
1.2-1.3
1.1-1.2
(a) Actuator duty cycle (deg/s)
1 10 20 30 40 50 60 70
151015202530354045505560657075
Derivative Gain (deg s2/rad)
Pro
po
rtion
al Gain
(deg
s/rad)
0.45-0.500.40-0.450.35-0.400.30-0.350.25-0.300.20-0.250.15-0.200.10-0.150.05-0.100.00-0.05
0.0-0.05
0.1-0.15
0.05-0.1
(b) RMS speed error (rad/s)
Figure 21: Performance metric surfaces generated using the second linearmodel (ωωωωT OP = 11 rad/s; wOP = 10 m/s; and ββββOP = 12°°°°) for kI=10 deg/rad.
models all behave similarly. The greatest differences appear toward the edges of
the surfaces.

39
Comparison of the regions of optimal operation selected using the non-
linear model, the first linear model, ωT OP = 11 rad/s; wOP = 7.5 m/s; and βOP = 9°,
and the second linear model, ωT OP = 11 rad/s; wOP = 10 m/s; and βOP = 12 is
shown in Figure 22. The optimal region selected using the second linear model
deviates the most from that obtained using the non-linear model. Assuming that
the non-linear model provides the best representation of actual turbine operation,
time series traces were created using the optimal gain combination obtained from
both linear models. Figure 23 illustrates the time series turbine behavior when
subjected to the highest wind speed case. Included in Figure 23 are the time
traces produced by the non-linear plant simulation when the gains are chosen
using the non-linear model design approach as well as the two linear models.
1 10 20 30 40 50 60 70
151015202530354045505560657075
Derivative Gain (deg s2/rad)
Pro
po
rtion
al Gain
(deg
s/rad)
Linear Model (ωωωωTop=11, wop=10, ββββop=12)
Linear Model (ωωωωTop=11, wop=7.5, ββββop=9)
Non-Linear Model
Figure 22: Regions of optimal operation.

40
95
100
105
110
115
0 30 60 90
Time (seconds)
Ro
tor
Sp
eed
(rp
m)
Non-Linear Point CLinear I Point CLinear II Point C
5
15
25
35
0 30 60 90
Time (seconds)
Pit
ch A
ng
le (
deg
)
Non-Linear Point CLinear I Point CLinear II Point C
-10
-5
0
5
10
0 30 60 90
Time (seconds)
Pit
ch
Ra
te (
de
g/s
)
Non-Linear Point CLinear I Point CLinear II Point C
Figure 23: Time series traces of turbine performance under the optimalgains as determined using each of the three models.
Using the gains selected based on the first linear model, the rotor speed nearly
duplicates that of the non-linear model optimal gain combination. The pitch rate
traces are very similar for all three gain combinations, but the second linear

41
model-based optimal gains slightly out-perform those from the first linear model
design. Again, the blade pitch angles commanded by the controller are nearly
identical.

42
CHAPTER VII
CONCLUSIONS
This systematic approach to PID-controller design provides a means of
visually observing the effect of gain changes on both RMS speed error and
actuator duty cycle. While these metrics are in opposition by nature, the surfaces
permit selection of gain values that produce favorable results for both of the
metrics. The simplicity of the model requires minimal computation time such that
hundreds of simulations can be completed within a few hours. The resolution of
the contour plots may easily be improved by increasing the number of
simulations. This visualization of the effect of gain permits selection of the best
possible combination of controller parameters without requiring a lengthy trial-
and-error process.
A valuable aspect of this design approach is the ability to observe the
robust nature of the PID controller in this variable-speed wind turbine application.
Generation of the surfaces over such varied gain values illustrates the controller
sensitivity. The wide, flat surfaces indicate robust behavior. This is valuable
information for comparison with other types of controllers.
The non-linear dynamics simulated with this simple model are easily
linearized, but several considerations must be made in order to design a PID
controller using a linear model. First, the step response that one would expect is
drastically different from that observed with the gain combination determined to
produce optimum performance. Also, the optimal region based on the balanced
performance of the two metrics shifts with the linearization point selection. The

43
surfaces generated by the linear models tend to slope less gradually toward the
perimeters. These differing slopes yield different areas on the surface that
provide the desired combination of the two performance metrics. Operating point
selection for a linear model is critical to obtaining the best possible performance
from this highly non-linear system.
Although the surfaces are relatively flat, performance does vary when gain
combinations from different areas of the surface are compared. These small
variations may be exacerbated by more complicated dynamics and sensor noise
when these gains are implemented in the field. Thus it is assumed that the non-
linear model-based design will be superior to the designs that relied upon the
linear model. It is hoped that the choice of controller parameters using the
simulation will also be satisfactory for the field turbine.
Lastly, this systematic approach still requires judgement on the part of the
designer. A mathematical relationship between the two metrics could eliminate
this requirement if such can be found. The systematic design methodology could
be automated once weighting functions are determined.
Several opportunities for use of control exist within the wind turbine
industry. In addition to speed regulation with mitigated actuator motion, control
may be used to extend the fatigue life of blades and rotor shafts. Adding control
objectives introduces the need for multiple-input-multiple-output controllers.
Also the interaction between control objectives increases the complexity. For
instance, blade loads could be affected by the blade-pitch control implemented in
this study. To incorporate a blade load objective into a controller, the interaction

44
between the blade pitch motion that regulates the speed and the induced loads
must be accommodated within the controller. Fuzzy logic and neural network
controllers, as well as state-estimation based controllers, could be employed to
incorporate the interaction between the various control objectives.

45
REFERENCES
Arsudis, D., and Bohnisch, H, 1990, “Self-tuning linear controller for the bladepitch control of a 100 kW WEC,” European Community Wind EnergyConference, H.S. Stephens, Bedford, United Kingdom, Vol. xvi+771, pp. 564-568.
Bongers, P., van Engelen, T., Dijkstra, S., Kock, Z.-J., 1989, “Optimal control ofa wind turbine in full load-a case study,” Proceedings, European Wind EnergyConference and Exhibition, Peter Peregrinus, London, United Kingdom, Vol.xxx+1063, pp. 345-349.
Bossanyi, E.A., 1989, “Practical results with adaptive control of the MS2 windturbine,” European Wind Energy Conference and Exhibition, Peter Peregrinus,London, United Kingdom, Vol. xxx+1063, pp. 331-335.
De la Salle, S.A., Reardon, D., Leithead, W.E., 1990, “Review of wind turbinecontrol,” International Journal of Control, vol. 52, no. 6, pp. 1295-1310.
Ekelund, T., 1994, “Speed control of wind turbines in the stall region.”Proceedings, IEEE International Conference on Control and Applications, IEEE;New York, NY, USA, Vol. xlii+1952, pp. 227-32.
Leithead, W.E., Anderson, C.G., 1989, “Simulation of wind turbines by simplemodels,” European Wind Energy Conference and Exhibition, Peter Peregrinus,London, United Kingdom, Vol. xxx+1063, pp. 336-340.
Leithead, W.E., de la Salle, S., Reardon, D., 1990, “Wind turbine controlobjectives and design,” European Community Wind Energy Conference, H.S.Stephens, Bedford, United Kingdom, Vol. xvi+771, pp. 510-515.
Leithead, W.E., de la Salle, S., Reardon, D., Grimble, M.J., 1991, “Wind turbinemodelling and control,” International Conference on Control, IEE, London,United Kingdom, Conference Publication No. 332.
Kendall, L., Balas, M.J., Lee, Y.J., and Fingersh, L.J., 1997, “Application ofProportional-Integral and Disturbance Accommodating Control to Variable-speedVariable Pitch Horizontal Axis Wind Turbines,” Wind Engineering (12:1); pp.21-38.
Stuart, J.G., Wright, A.D., and Butterfield, C. P., 1996, “Considerations for anIntegrated Wind Turbine Controls Capability at the National Wind TechnologyCenter: An Aileron Control Case Study for Power Regulation and LoadMitigation,” TP-440-21335, National Renewable Energy Laboratory, Golden,CO, USA.

46
Tangler, J.L., 1987, “User’s Guide. A Horizontal Axis Wind TurbinePerformance Prediction Code for Personal Computers,” Solar Energy ResearchInstitute, Golden, CO, USA.

47
APPENDIX A
STABILITY ANALYSIS IN LAPLACE DOMAIN

48
Laplace Transformation of System Components
Linear Turbine Plant (Eq. 2)
( ) βδωγαω ∆+∆+∆= TTT twJ !
After Laplace Transformation the equation becomes:
( ) ( )sUsWsJ TTT ∆+∆Ω+∆=∆Ω δγα
Let TJ
γλ = .
δδδδJT
1__ s-λλλλ
ααααJT
+∆Ω∆Ω∆Ω∆ΩT
∆∆∆∆W(s)
∆∆∆∆U(s)
Figure A-1: Block diagram of the linear turbine plant model.
The rotor speed ouput from the plant may be represented as:
( ) ( )λ
δα−
∆+∆=∆Ω
ssU
JsW
J TT
T
1
Actuator
The actuator may be represented by the following diagram after the Laplace
transformation where Ua(s) is the Laplace transform of the pitch angle input and
Uo(s) is the Laplace transform of the pitch angle output.

49
1_ skA
+Ua(s)
Uo(s)
-
Figure A-2: Block diagram of the actuator.
The transfer function between the input pitch angle and the commanded pitch
angle is:
( )( ) A
A
A
A
a
o
ks
k
s
ks
k
sU
sU
+=
+=
1.
Controller
The PID controller is illustrated in Figure A-3 where ∆ΩT(s) represents the input
rotor speed, and ∆Uc(s) represents the output pitch angle change.
kP + kI_ + kD
s
∆Ω∆Ω∆Ω∆ΩT(s) ∆∆∆∆UC(s)
Figure A-3: Block diagram of controller.
The transfer function between the input rotor speed and the output pitch angle
change is as follows:
s
kskksUsC IPD
T
c ++=∆Ω∆=
2
)( .

50
System Transfer Function
Substituting the actuator transfer function and the controller transfer function into
the system diagram shown in Figure A-4, simplifies the determination of the
output rotor speed equation.
C(s)
ΩΩΩΩref δδδδJT
1__ s-λλλλ
ααααJT
+∆Ω∆Ω∆Ω∆ΩT
∆∆∆∆W(s)
∆∆∆∆U(s) kA__ s+kA
∆∆∆∆Uc(s)
+ +∆Ω∆Ω∆Ω∆ΩT
Uref
Ua(s) Uo(s)--
+
UOP(s)
+
ΩΩΩΩOP(s)
ΩΩΩΩT
Figure A-4: System block diagram in Laplace Domain.
The output rotor speed may be represented by:
( )
( ) ( )
( )
( )
( )
( )
( )
−
+
−
−
+
Ω−
−
+
−
Ω+
−
+
−
−
−
−
+
−
−
+
+
−
+
−
−
∆
=Ω
λδ
λδ
λδ
λδ
λδ
λδ
λδ
λδ
λα
sJks
ksC
sJks
ksC
sJks
ksC
s
sJks
ksC
sJsU
sJks
ksC
sJks
kU
sJks
ksC
sJsW
TA
A
TA
Aref
TA
A
OP
TA
A
T
OP
TA
A
TA
Aref
TA
A
T
T
11
1)(
11
11
1
11
1
11
1
Simplifying the denominator and substituting for C(s),

51
( )( ) ( )( )( )λ
δλ
λδ
−+
++−−+
=
−
+
++−
skss
Jkkskskskss
sJks
ksk
s
kk
A
TADIPA
TA
AD
IP
2
11
Stability Analysis
Applying the Routh array to the denominator of the system equation, the system
stability may be ascertained.
Table A-1: Routh Array.
s3
1T
APA Jkkk
δλ −−
s2
TADA Jkkk
δλ −−−T
AI Jkk
δ−
s1
TADA
TAI
TAPA
TADA
Jkkk
Jkk
Jkkk
Jkkk
δλ
δδλδλ
−−
+
−−
−−
0
s0
TAI Jkk
δ−
For stability, the coefficients of the terms in the denominator of the transfer
function must be positive, and each term in the first column of Table 1 must also
be positive. At the operating point, ωT OP = 11 rad/s; wOP = 7.5 m/s; and βOP = 9°,
γ= -150, δ= -150, JT=1270, and kA=2. Note: λ<0 and δ<0.
Thus,

52
• 800 −>⇒>−
−+⇒>−− D
T
ADA
T
ADA kJ
kkkJ
kkkδ
λδλ
• 100 −>⇒>−
−⇒>−− P
T
APA
T
APA kJ
kkkJ
kkkδ
λδλ
• 000 >⇒>−
−⇒>− I
T
AI
T
AI kJ
kkJ
kkδδ
•
( )( ) IPD
T
AI
T
APA
T
ADA
T
AI
T
APA
T
ADA
kkk
Jkk
Jkkk
Jkkk
Jkk
Jkkk
Jkkk
>++⇒
−>
−−
−−⇒
−>
−−
−−
18
δδλ
δλ
δδλδλ

53
APPENDIX B
APPLICATION OF THE SYSTEMATIC METHODOLOGY
USING THE NON-LINEAR MODEL

54
Table B-1: RMS speed error obtained using the non-linear model and medwind2 as wind input file.
Derivative GainProportional
Gain 1 5 10 15 20 25 30 35 40 45 50 55 60 65 70 75
Integral Gain=1 1 0.75 0.81 0.96 1.01 1.08 1.22 1.34 1.38 1.37 1.32 1.25 1.18 1.11 1.05 0.99 0.945 0.47 0.45 0.46 0.48 0.50 0.52 0.55 0.56 0.57 0.58 0.58 0.57 0.56 0.55 0.54 0.52
10 0.32 0.31 0.30 0.30 0.31 0.31 0.32 0.33 0.33 0.33 0.34 0.34 0.34 0.34 0.34 0.3415 0.25 0.25 0.24 0.24 0.23 0.24 0.24 0.24 0.24 0.24 0.25 0.25 0.25 0.25 0.25 0.2520 0.21 0.21 0.20 0.20 0.20 0.20 0.20 0.20 0.20 0.20 0.20 0.20 0.20 0.20 0.20 0.2125 0.19 0.18 0.18 0.18 0.18 0.17 0.17 0.17 0.17 0.17 0.17 0.18 0.18 0.18 0.18 0.1830 0.17 0.17 0.17 0.16 0.16 0.16 0.16 0.16 0.16 0.16 0.16 0.16 0.16 0.16 0.16 0.1635 0.16 0.16 0.15 0.15 0.15 0.15 0.15 0.15 0.15 0.15 0.15 0.15 0.15 0.15 0.15 0.1540 0.15 0.15 0.15 0.14 0.14 0.14 0.14 0.14 0.14 0.14 0.14 0.14 0.14 0.14 0.14 0.1445 0.14 0.14 0.14 0.14 0.14 0.13 0.13 0.13 0.13 0.13 0.13 0.13 0.13 0.13 0.13 0.1350 0.13 0.13 0.13 0.13 0.13 0.13 0.13 0.13 0.13 0.13 0.13 0.13 0.13 0.12 0.12 0.1255 0.13 0.13 0.13 0.13 0.12 0.12 0.12 0.12 0.12 0.12 0.12 0.12 0.12 0.12 0.12 0.1260 0.12 0.12 0.12 0.12 0.12 0.12 0.12 0.12 0.12 0.12 0.12 0.12 0.12 0.12 0.12 0.1265 0.12 0.12 0.12 0.12 0.12 0.12 0.12 0.12 0.11 0.11 0.11 0.11 0.11 0.11 0.11 0.1170 0.12 0.12 0.12 0.11 0.11 0.11 0.11 0.11 0.11 0.11 0.11 0.11 0.11 0.11 0.11 0.1175 0.11 0.11 0.11 0.11 0.11 0.11 0.11 0.11 0.11 0.11 0.11 0.11 0.11 0.11 0.11 0.11
Integral Gain=5 1 2.81 0.95 0.81 0.63 0.42 0.33 0.39 0.45 0.51 0.55 0.58 0.59 0.59 0.57 0.53 0.495 0.48 0.44 0.39 0.32 0.27 0.24 0.24 0.25 0.26 0.28 0.29 0.30 0.30 0.30 0.29 0.29
10 0.30 0.28 0.26 0.23 0.21 0.19 0.19 0.19 0.19 0.19 0.19 0.20 0.20 0.20 0.20 0.2015 0.23 0.22 0.21 0.19 0.18 0.17 0.17 0.16 0.16 0.16 0.16 0.16 0.17 0.17 0.17 0.1720 0.20 0.19 0.18 0.17 0.17 0.16 0.15 0.15 0.15 0.15 0.15 0.15 0.15 0.15 0.15 0.1525 0.18 0.17 0.16 0.16 0.15 0.15 0.15 0.14 0.14 0.14 0.14 0.14 0.14 0.14 0.14 0.1430 0.16 0.16 0.15 0.15 0.14 0.14 0.14 0.14 0.13 0.13 0.13 0.13 0.13 0.13 0.13 0.1335 0.15 0.15 0.14 0.14 0.14 0.13 0.13 0.13 0.13 0.13 0.13 0.12 0.12 0.12 0.12 0.1240 0.14 0.14 0.13 0.13 0.13 0.13 0.13 0.12 0.12 0.12 0.12 0.12 0.12 0.12 0.12 0.1245 0.13 0.13 0.13 0.13 0.12 0.12 0.12 0.12 0.12 0.12 0.12 0.12 0.12 0.12 0.11 0.1150 0.13 0.12 0.12 0.12 0.12 0.12 0.12 0.12 0.12 0.11 0.11 0.11 0.11 0.11 0.11 0.1155 0.12 0.12 0.12 0.12 0.12 0.11 0.11 0.11 0.11 0.11 0.11 0.11 0.11 0.11 0.11 0.1160 0.12 0.12 0.11 0.11 0.11 0.11 0.11 0.11 0.11 0.11 0.11 0.11 0.11 0.11 0.11 0.1165 0.11 0.11 0.11 0.11 0.11 0.11 0.11 0.11 0.11 0.11 0.11 0.10 0.10 0.10 0.10 0.1070 0.11 0.11 0.11 0.11 0.11 0.11 0.11 0.10 0.10 0.10 0.10 0.10 0.10 0.10 0.10 0.1075 0.11 0.11 0.11 0.11 0.10 0.10 0.10 0.10 0.10 0.10 0.10 0.10 0.10 0.10 0.10 0.10
Integral Gain=10 1 19.40 4.02 1.62 0.91 1.01 0.88 0.73 0.61 0.45 0.31 0.24 0.22 0.28 0.33 0.33 0.315 1.81 0.53 0.47 0.41 0.42 0.43 0.39 0.32 0.26 0.21 0.19 0.19 0.19 0.20 0.20 0.21
10 0.29 0.30 0.30 0.29 0.28 0.27 0.25 0.23 0.20 0.18 0.17 0.16 0.16 0.16 0.16 0.1615 0.24 0.24 0.23 0.23 0.22 0.21 0.20 0.19 0.17 0.16 0.15 0.15 0.14 0.14 0.14 0.1420 0.21 0.20 0.20 0.19 0.19 0.18 0.17 0.16 0.16 0.15 0.14 0.14 0.13 0.13 0.13 0.1325 0.19 0.18 0.17 0.17 0.16 0.16 0.15 0.15 0.14 0.14 0.13 0.13 0.13 0.12 0.12 0.1230 0.17 0.16 0.16 0.15 0.15 0.15 0.14 0.14 0.14 0.13 0.13 0.13 0.12 0.12 0.12 0.1235 0.15 0.15 0.15 0.14 0.14 0.14 0.13 0.13 0.13 0.13 0.12 0.12 0.12 0.12 0.12 0.1140 0.14 0.14 0.14 0.14 0.13 0.13 0.13 0.13 0.12 0.12 0.12 0.12 0.12 0.11 0.11 0.1145 0.14 0.13 0.13 0.13 0.13 0.12 0.12 0.12 0.12 0.12 0.12 0.11 0.11 0.11 0.11 0.1150 0.13 0.13 0.13 0.12 0.12 0.12 0.12 0.12 0.12 0.11 0.11 0.11 0.11 0.11 0.11 0.1155 0.13 0.12 0.12 0.12 0.12 0.12 0.12 0.11 0.11 0.11 0.11 0.11 0.11 0.11 0.11 0.1160 0.12 0.12 0.12 0.12 0.11 0.11 0.11 0.11 0.11 0.11 0.11 0.11 0.11 0.11 0.11 0.1065 0.12 0.12 0.11 0.11 0.11 0.11 0.11 0.11 0.11 0.11 0.11 0.11 0.10 0.10 0.10 0.1070 0.11 0.11 0.11 0.11 0.11 0.11 0.11 0.11 0.11 0.11 0.10 0.10 0.10 0.10 0.10 0.1075 0.11 0.11 0.11 0.11 0.11 0.11 0.11 0.10 0.10 0.10 0.10 0.10 0.10 0.10 0.10 0.10

55
Table B-1: RMS speed error obtained using the non-linear model and medwind2 as wind input file.
Derivative GainProportional
Gain 1 5 10 15 20 25 30 35 40 45 50 55 60 65 70 75
Integral Gain=15 1 20.56 9.52 7.98 2.96 1.71 0.98 0.73 1.01 0.92 0.78 0.68 0.60 0.45 0.32 0.25 0.225 16.07 7.28 0.57 0.50 0.48 0.41 0.40 0.45 0.47 0.45 0.40 0.34 0.28 0.23 0.19 0.18
10 0.28 0.29 0.31 0.31 0.31 0.30 0.30 0.30 0.30 0.29 0.26 0.24 0.21 0.19 0.17 0.1615 0.26 0.24 0.24 0.24 0.25 0.24 0.24 0.24 0.23 0.22 0.21 0.19 0.18 0.17 0.16 0.1520 0.22 0.21 0.21 0.21 0.21 0.20 0.20 0.20 0.19 0.18 0.18 0.17 0.16 0.15 0.15 0.1425 0.20 0.19 0.19 0.18 0.18 0.18 0.18 0.17 0.17 0.16 0.16 0.15 0.15 0.14 0.14 0.1330 0.18 0.17 0.17 0.17 0.16 0.16 0.16 0.16 0.15 0.15 0.15 0.14 0.14 0.13 0.13 0.1335 0.17 0.16 0.16 0.15 0.15 0.15 0.15 0.14 0.14 0.14 0.14 0.13 0.13 0.13 0.13 0.1240 0.15 0.15 0.15 0.14 0.14 0.14 0.14 0.14 0.13 0.13 0.13 0.13 0.12 0.12 0.12 0.1245 0.15 0.14 0.14 0.14 0.13 0.13 0.13 0.13 0.13 0.13 0.12 0.12 0.12 0.12 0.12 0.1150 0.14 0.14 0.13 0.13 0.13 0.13 0.13 0.12 0.12 0.12 0.12 0.12 0.12 0.11 0.11 0.1155 0.13 0.13 0.13 0.13 0.12 0.12 0.12 0.12 0.12 0.12 0.12 0.11 0.11 0.11 0.11 0.1160 0.13 0.12 0.12 0.12 0.12 0.12 0.12 0.12 0.11 0.11 0.11 0.11 0.11 0.11 0.11 0.1165 0.12 0.12 0.12 0.12 0.12 0.12 0.11 0.11 0.11 0.11 0.11 0.11 0.11 0.11 0.11 0.1170 0.12 0.12 0.12 0.11 0.11 0.11 0.11 0.11 0.11 0.11 0.11 0.11 0.11 0.11 0.10 0.1075 0.12 0.11 0.11 0.11 0.11 0.11 0.11 0.11 0.11 0.11 0.11 0.11 0.10 0.10 0.10 0.10
Integral Gain=20 1 423.68 5.98 18.42 5.31 2.86 2.07 1.37 0.98 0.74 0.82 1.00 0.93 0.83 0.73 0.66 0.605 175.44 11.26 2.58 0.66 0.48 0.56 0.48 0.42 0.40 0.44 0.50 0.51 0.50 0.46 0.41 0.36
10 7.33 0.25 0.29 0.31 0.32 0.33 0.32 0.31 0.31 0.32 0.33 0.33 0.32 0.30 0.28 0.2515 1.79 0.24 0.23 0.24 0.25 0.25 0.26 0.26 0.25 0.25 0.25 0.25 0.24 0.23 0.22 0.2120 0.24 0.22 0.21 0.21 0.21 0.22 0.22 0.22 0.22 0.21 0.21 0.21 0.20 0.19 0.19 0.1825 0.21 0.20 0.19 0.19 0.19 0.19 0.19 0.19 0.19 0.19 0.18 0.18 0.18 0.17 0.17 0.1630 0.19 0.18 0.18 0.18 0.17 0.17 0.17 0.17 0.17 0.17 0.17 0.16 0.16 0.16 0.15 0.1535 0.18 0.17 0.17 0.16 0.16 0.16 0.16 0.16 0.16 0.15 0.15 0.15 0.15 0.14 0.14 0.1440 0.17 0.16 0.16 0.15 0.15 0.15 0.15 0.15 0.15 0.14 0.14 0.14 0.14 0.14 0.13 0.1345 0.16 0.15 0.15 0.15 0.14 0.14 0.14 0.14 0.14 0.14 0.13 0.13 0.13 0.13 0.13 0.1350 0.15 0.14 0.14 0.14 0.14 0.13 0.13 0.13 0.13 0.13 0.13 0.13 0.13 0.12 0.12 0.1255 0.14 0.14 0.13 0.13 0.13 0.13 0.13 0.13 0.13 0.12 0.12 0.12 0.12 0.12 0.12 0.1260 0.13 0.13 0.13 0.13 0.13 0.12 0.12 0.12 0.12 0.12 0.12 0.12 0.12 0.12 0.12 0.1165 0.13 0.13 0.12 0.12 0.12 0.12 0.12 0.12 0.12 0.12 0.12 0.11 0.11 0.11 0.11 0.1170 0.13 0.12 0.12 0.12 0.12 0.12 0.12 0.12 0.11 0.11 0.11 0.11 0.11 0.11 0.11 0.1175 0.12 0.12 0.12 0.12 0.12 0.11 0.11 0.11 0.11 0.11 0.11 0.11 0.11 0.11 0.11 0.11

56
Table B-2: RMS speed error obtained using the non-linear model and wind3 as wind input file.
Derivative GainProportional
Gain 1 5 10 15 20 25 30 35 40 45 50 55 60 65 70 75
Integral Gain=1 1 0.52 0.52 0.54 0.55 0.59 0.65 0.69 0.70 0.70 0.69 0.67 0.65 0.63 0.61 0.59 0.575 0.33 0.32 0.32 0.33 0.34 0.35 0.36 0.37 0.37 0.37 0.37 0.37 0.37 0.37 0.37 0.37
10 0.26 0.25 0.24 0.24 0.25 0.25 0.25 0.26 0.26 0.26 0.26 0.27 0.27 0.27 0.27 0.2715 0.22 0.21 0.20 0.20 0.20 0.20 0.21 0.21 0.21 0.21 0.21 0.22 0.22 0.22 0.22 0.2220 0.20 0.19 0.18 0.18 0.18 0.18 0.18 0.18 0.18 0.18 0.18 0.18 0.19 0.19 0.19 0.1925 0.18 0.17 0.17 0.16 0.16 0.16 0.16 0.16 0.16 0.16 0.16 0.16 0.16 0.17 0.17 0.1730 0.16 0.16 0.15 0.15 0.15 0.15 0.15 0.15 0.15 0.15 0.15 0.15 0.15 0.15 0.15 0.1535 0.15 0.15 0.14 0.14 0.14 0.14 0.14 0.14 0.14 0.14 0.14 0.14 0.14 0.14 0.14 0.1440 0.14 0.14 0.14 0.13 0.13 0.13 0.13 0.13 0.13 0.13 0.13 0.13 0.13 0.13 0.13 0.1345 0.13 0.13 0.13 0.13 0.13 0.12 0.12 0.12 0.12 0.12 0.12 0.12 0.12 0.12 0.12 0.1250 0.13 0.12 0.12 0.12 0.12 0.12 0.12 0.12 0.12 0.12 0.12 0.12 0.12 0.12 0.12 0.1255 0.12 0.12 0.12 0.12 0.11 0.11 0.11 0.11 0.11 0.11 0.11 0.11 0.11 0.11 0.11 0.1160 0.12 0.11 0.11 0.11 0.11 0.11 0.11 0.11 0.11 0.11 0.11 0.11 0.11 0.11 0.11 0.1165 0.11 0.11 0.11 0.11 0.11 0.11 0.11 0.10 0.10 0.10 0.10 0.10 0.10 0.10 0.10 0.1070 0.11 0.11 0.11 0.11 0.10 0.10 0.10 0.10 0.10 0.10 0.10 0.10 0.10 0.10 0.10 0.1075 0.11 0.10 0.10 0.10 0.10 0.10 0.10 0.10 0.10 0.10 0.10 0.10 0.10 0.10 0.10 0.10
Integral Gain=5 1 0.92 0.65 0.46 0.34 0.41 0.37 0.29 0.32 0.35 0.39 0.41 0.39 0.37 0.38 0.38 0.375 0.35 0.28 0.23 0.20 0.19 0.19 0.19 0.19 0.20 0.20 0.21 0.22 0.22 0.22 0.23 0.23
10 0.24 0.20 0.17 0.16 0.15 0.14 0.14 0.15 0.15 0.15 0.16 0.16 0.16 0.17 0.17 0.1715 0.19 0.17 0.15 0.14 0.13 0.13 0.13 0.13 0.13 0.13 0.14 0.14 0.14 0.14 0.15 0.1520 0.17 0.15 0.14 0.13 0.13 0.12 0.12 0.12 0.12 0.12 0.12 0.13 0.13 0.13 0.13 0.1325 0.15 0.14 0.13 0.13 0.12 0.12 0.12 0.12 0.12 0.12 0.12 0.12 0.12 0.12 0.12 0.1230 0.14 0.13 0.13 0.12 0.12 0.12 0.11 0.11 0.11 0.11 0.11 0.11 0.11 0.11 0.12 0.1235 0.13 0.13 0.12 0.12 0.11 0.11 0.11 0.11 0.11 0.11 0.11 0.11 0.11 0.11 0.11 0.1140 0.13 0.12 0.12 0.11 0.11 0.11 0.11 0.11 0.11 0.11 0.10 0.10 0.11 0.11 0.11 0.1145 0.12 0.12 0.11 0.11 0.11 0.11 0.11 0.10 0.10 0.10 0.10 0.10 0.10 0.10 0.10 0.1050 0.12 0.11 0.11 0.11 0.11 0.10 0.10 0.10 0.10 0.10 0.10 0.10 0.10 0.10 0.10 0.1055 0.11 0.11 0.11 0.11 0.10 0.10 0.10 0.10 0.10 0.10 0.10 0.10 0.10 0.10 0.10 0.1060 0.11 0.11 0.10 0.10 0.10 0.10 0.10 0.10 0.10 0.10 0.10 0.10 0.10 0.10 0.10 0.1065 0.11 0.10 0.10 0.10 0.10 0.10 0.10 0.10 0.10 0.10 0.09 0.09 0.09 0.09 0.09 0.0970 0.10 0.10 0.10 0.10 0.10 0.10 0.10 0.09 0.09 0.09 0.09 0.09 0.09 0.09 0.09 0.0975 0.10 0.10 0.10 0.10 0.10 0.09 0.09 0.09 0.09 0.09 0.09 0.09 0.09 0.09 0.09 0.09
Integral Gain=10 1 115.80 1.29 0.84 0.70 0.58 0.53 0.39 0.36 0.30 0.44 0.47 0.40 0.32 0.29 0.29 0.345 0.58 0.41 0.32 0.29 0.27 0.24 0.21 0.20 0.20 0.21 0.22 0.21 0.20 0.20 0.20 0.20
10 0.31 0.26 0.22 0.19 0.18 0.17 0.16 0.15 0.15 0.15 0.15 0.15 0.15 0.15 0.15 0.1515 0.23 0.20 0.17 0.16 0.15 0.14 0.13 0.13 0.13 0.13 0.13 0.13 0.13 0.13 0.13 0.1320 0.19 0.17 0.15 0.14 0.13 0.13 0.12 0.12 0.12 0.12 0.12 0.12 0.12 0.12 0.12 0.1225 0.16 0.15 0.14 0.13 0.12 0.12 0.12 0.11 0.11 0.11 0.11 0.11 0.11 0.11 0.11 0.1130 0.15 0.14 0.13 0.12 0.12 0.11 0.11 0.11 0.11 0.11 0.10 0.10 0.10 0.10 0.11 0.1135 0.14 0.13 0.12 0.12 0.11 0.11 0.11 0.11 0.10 0.10 0.10 0.10 0.10 0.10 0.10 0.1040 0.13 0.12 0.12 0.11 0.11 0.11 0.11 0.10 0.10 0.10 0.10 0.10 0.10 0.10 0.10 0.1045 0.12 0.12 0.11 0.11 0.11 0.11 0.10 0.10 0.10 0.10 0.10 0.10 0.10 0.10 0.10 0.1050 0.12 0.11 0.11 0.11 0.11 0.10 0.10 0.10 0.10 0.10 0.10 0.10 0.10 0.10 0.10 0.1055 0.11 0.11 0.11 0.11 0.10 0.10 0.10 0.10 0.10 0.10 0.10 0.09 0.09 0.09 0.09 0.0960 0.11 0.11 0.10 0.10 0.10 0.10 0.10 0.10 0.10 0.09 0.09 0.09 0.09 0.09 0.09 0.0965 0.11 0.10 0.10 0.10 0.10 0.10 0.10 0.10 0.09 0.09 0.09 0.09 0.09 0.09 0.09 0.0970 0.10 0.10 0.10 0.10 0.10 0.10 0.10 0.09 0.09 0.09 0.09 0.09 0.09 0.09 0.09 0.0975 0.10 0.10 0.10 0.10 0.10 0.09 0.09 0.09 0.09 0.09 0.09 0.09 0.09 0.09 0.09 0.09

57
Table B-2: RMS speed error obtained using the non-linear model and wind3 as wind input file.
Derivative GainProportional
Gain 1 5 10 15 20 25 30 35 40 45 50 55 60 65 70 75
Integral Gain=15 1 127.81 15.33 1.04 0.86 0.81 0.73 0.53 0.60 0.56 0.38 0.44 0.42 0.30 0.33 0.46 0.505 2.81 0.65 0.42 0.35 0.31 0.31 0.30 0.28 0.25 0.23 0.22 0.22 0.21 0.22 0.24 0.26
10 0.83 0.33 0.28 0.24 0.21 0.20 0.19 0.19 0.18 0.17 0.17 0.16 0.16 0.17 0.17 0.1715 0.33 0.25 0.21 0.19 0.17 0.16 0.15 0.15 0.14 0.14 0.14 0.14 0.14 0.14 0.14 0.1420 0.26 0.20 0.18 0.16 0.15 0.14 0.14 0.13 0.13 0.13 0.12 0.12 0.12 0.12 0.12 0.1225 0.22 0.17 0.16 0.14 0.14 0.13 0.13 0.12 0.12 0.12 0.12 0.11 0.11 0.11 0.11 0.1130 0.19 0.15 0.14 0.13 0.13 0.12 0.12 0.12 0.11 0.11 0.11 0.11 0.11 0.11 0.11 0.1135 0.16 0.14 0.13 0.13 0.12 0.12 0.11 0.11 0.11 0.11 0.11 0.10 0.10 0.10 0.10 0.1040 0.14 0.13 0.12 0.12 0.12 0.11 0.11 0.11 0.11 0.10 0.10 0.10 0.10 0.10 0.10 0.1045 0.13 0.12 0.12 0.11 0.11 0.11 0.11 0.10 0.10 0.10 0.10 0.10 0.10 0.10 0.10 0.1050 0.12 0.12 0.11 0.11 0.11 0.11 0.10 0.10 0.10 0.10 0.10 0.10 0.10 0.10 0.10 0.1055 0.12 0.11 0.11 0.11 0.11 0.10 0.10 0.10 0.10 0.10 0.10 0.10 0.10 0.09 0.09 0.0960 0.11 0.11 0.11 0.11 0.10 0.10 0.10 0.10 0.10 0.10 0.10 0.09 0.09 0.09 0.09 0.0965 0.11 0.11 0.10 0.10 0.10 0.10 0.10 0.10 0.10 0.09 0.09 0.09 0.09 0.09 0.09 0.0970 0.11 0.10 0.10 0.10 0.10 0.10 0.10 0.10 0.09 0.09 0.09 0.09 0.09 0.09 0.09 0.0975 0.10 0.10 0.10 0.10 0.10 0.10 0.10 0.09 0.09 0.09 0.09 0.09 0.09 0.09 0.09 0.09
Integral Gain=20 1 132.48 164.90 54.29 0.86 0.72 0.81 0.77 0.72 0.63 0.55 0.61 0.57 0.41 0.39 0.49 0.465 141.41 47.61 0.61 0.43 0.39 0.33 0.32 0.33 0.33 0.30 0.31 0.27 0.24 0.24 0.24 0.24
10 34.26 0.58 0.35 0.30 0.26 0.24 0.22 0.21 0.21 0.21 0.20 0.19 0.18 0.18 0.18 0.1815 0.85 0.33 0.26 0.23 0.21 0.19 0.18 0.17 0.16 0.16 0.16 0.16 0.15 0.15 0.15 0.1520 0.40 0.25 0.21 0.19 0.17 0.16 0.15 0.15 0.14 0.14 0.14 0.13 0.13 0.13 0.13 0.1325 0.33 0.21 0.18 0.16 0.15 0.15 0.14 0.13 0.13 0.13 0.12 0.12 0.12 0.12 0.12 0.1230 0.28 0.18 0.16 0.15 0.14 0.13 0.13 0.12 0.12 0.12 0.12 0.12 0.11 0.11 0.11 0.1135 0.24 0.16 0.14 0.14 0.13 0.13 0.12 0.12 0.12 0.11 0.11 0.11 0.11 0.11 0.11 0.1140 0.20 0.14 0.13 0.13 0.12 0.12 0.12 0.11 0.11 0.11 0.11 0.11 0.11 0.11 0.10 0.1045 0.17 0.13 0.13 0.12 0.12 0.11 0.11 0.11 0.11 0.11 0.10 0.10 0.10 0.10 0.10 0.1050 0.15 0.13 0.12 0.12 0.11 0.11 0.11 0.11 0.11 0.10 0.10 0.10 0.10 0.10 0.10 0.1055 0.12 0.12 0.12 0.11 0.11 0.11 0.11 0.10 0.10 0.10 0.10 0.10 0.10 0.10 0.10 0.1060 0.12 0.11 0.11 0.11 0.11 0.11 0.10 0.10 0.10 0.10 0.10 0.10 0.10 0.10 0.10 0.0965 0.11 0.11 0.11 0.11 0.10 0.10 0.10 0.10 0.10 0.10 0.10 0.10 0.10 0.09 0.09 0.0970 0.11 0.11 0.11 0.10 0.10 0.10 0.10 0.10 0.10 0.10 0.10 0.09 0.09 0.09 0.09 0.0975 0.11 0.10 0.10 0.10 0.10 0.10 0.10 0.10 0.10 0.10 0.09 0.09 0.09 0.09 0.09 0.09

58
Table B-3: RMS speed error obtained using the non-linear model and wind4 as wind input file.
Derivative GainProportional
Gain 1 5 10 15 20 25 30 35 40 45 50 55 60 65 70 75
Integral Gain=1 1 1.11 1.03 0.85 0.72 0.65 0.62 0.61 0.60 0.59 0.58 0.57 0.56 0.54 0.53 0.51 0.495 0.45 0.43 0.41 0.39 0.37 0.35 0.34 0.33 0.32 0.32 0.31 0.31 0.30 0.30 0.29 0.29
10 0.29 0.28 0.27 0.26 0.26 0.25 0.24 0.24 0.23 0.23 0.22 0.22 0.22 0.22 0.21 0.2115 0.23 0.22 0.21 0.21 0.21 0.20 0.20 0.20 0.19 0.19 0.19 0.19 0.18 0.18 0.18 0.1820 0.19 0.19 0.18 0.18 0.18 0.18 0.18 0.17 0.17 0.17 0.17 0.17 0.16 0.16 0.16 0.1625 0.17 0.17 0.17 0.16 0.16 0.16 0.16 0.16 0.16 0.15 0.15 0.15 0.15 0.15 0.15 0.1530 0.16 0.15 0.15 0.15 0.15 0.15 0.15 0.15 0.14 0.14 0.14 0.14 0.14 0.14 0.14 0.1435 0.14 0.14 0.14 0.14 0.14 0.14 0.14 0.14 0.13 0.13 0.13 0.13 0.13 0.13 0.13 0.1340 0.13 0.13 0.13 0.13 0.13 0.13 0.13 0.13 0.13 0.13 0.13 0.13 0.12 0.12 0.12 0.1245 0.13 0.13 0.12 0.12 0.12 0.12 0.12 0.12 0.12 0.12 0.12 0.12 0.12 0.12 0.12 0.1250 0.12 0.12 0.12 0.12 0.12 0.12 0.12 0.11 0.11 0.11 0.11 0.11 0.11 0.11 0.11 0.1155 0.11 0.11 0.11 0.11 0.11 0.11 0.11 0.11 0.11 0.11 0.11 0.11 0.11 0.11 0.11 0.1160 0.11 0.11 0.11 0.11 0.11 0.11 0.10 0.10 0.10 0.10 0.10 0.10 0.10 0.10 0.10 0.1065 0.10 0.10 0.10 0.10 0.10 0.10 0.10 0.10 0.10 0.10 0.10 0.10 0.10 0.10 0.10 0.1070 0.10 0.10 0.10 0.10 0.10 0.10 0.10 0.10 0.10 0.10 0.09 0.09 0.09 0.09 0.09 0.0975 0.09 0.09 0.09 0.09 0.09 0.09 0.09 0.09 0.09 0.09 0.09 0.09 0.09 0.09 0.09 0.09
Integral Gain=5 1 1.13 0.76 0.50 0.47 0.43 0.41 0.50 0.63 0.67 0.64 0.60 0.58 0.56 0.55 0.53 0.495 0.30 0.26 0.24 0.24 0.24 0.25 0.26 0.28 0.29 0.30 0.30 0.30 0.30 0.29 0.29 0.28
10 0.20 0.18 0.17 0.17 0.17 0.17 0.18 0.18 0.19 0.19 0.19 0.19 0.19 0.19 0.19 0.1815 0.16 0.15 0.14 0.14 0.14 0.14 0.14 0.14 0.14 0.14 0.14 0.14 0.14 0.14 0.14 0.1420 0.13 0.12 0.12 0.11 0.11 0.11 0.11 0.11 0.11 0.11 0.11 0.11 0.11 0.11 0.11 0.1125 0.11 0.10 0.10 0.10 0.10 0.10 0.10 0.10 0.10 0.10 0.10 0.10 0.10 0.10 0.10 0.1030 0.10 0.09 0.09 0.09 0.09 0.09 0.09 0.09 0.09 0.08 0.08 0.08 0.08 0.08 0.08 0.0835 0.09 0.08 0.08 0.08 0.08 0.08 0.08 0.08 0.08 0.08 0.08 0.08 0.08 0.08 0.07 0.0740 0.08 0.08 0.07 0.07 0.07 0.07 0.07 0.07 0.07 0.07 0.07 0.07 0.07 0.07 0.07 0.0745 0.07 0.07 0.07 0.07 0.07 0.07 0.06 0.06 0.06 0.06 0.06 0.06 0.06 0.06 0.06 0.0650 0.07 0.06 0.06 0.06 0.06 0.06 0.06 0.06 0.06 0.06 0.06 0.06 0.06 0.06 0.06 0.0655 0.06 0.06 0.06 0.06 0.06 0.06 0.06 0.06 0.06 0.06 0.06 0.06 0.05 0.05 0.05 0.0560 0.06 0.06 0.06 0.06 0.05 0.05 0.05 0.05 0.05 0.05 0.05 0.05 0.05 0.05 0.05 0.0565 0.06 0.05 0.05 0.05 0.05 0.05 0.05 0.05 0.05 0.05 0.05 0.05 0.05 0.05 0.05 0.0570 0.05 0.05 0.05 0.05 0.05 0.05 0.05 0.05 0.05 0.05 0.05 0.05 0.05 0.05 0.05 0.0575 0.05 0.05 0.05 0.05 0.05 0.05 0.05 0.05 0.05 0.05 0.05 0.05 0.05 0.04 0.04 0.04
Integral Gain=10 1 24.92 20.47 0.86 0.55 0.50 0.49 0.37 0.36 0.35 0.33 0.33 0.31 0.28 0.28 0.35 0.435 0.36 0.26 0.21 0.18 0.17 0.17 0.17 0.17 0.17 0.17 0.18 0.18 0.19 0.20 0.21 0.23
10 0.21 0.16 0.14 0.13 0.12 0.12 0.12 0.12 0.12 0.12 0.13 0.13 0.14 0.14 0.15 0.1615 0.14 0.12 0.11 0.11 0.10 0.10 0.10 0.10 0.10 0.10 0.10 0.11 0.11 0.11 0.12 0.1220 0.11 0.10 0.10 0.09 0.09 0.09 0.09 0.09 0.09 0.09 0.09 0.09 0.09 0.10 0.10 0.1025 0.09 0.09 0.08 0.08 0.08 0.08 0.08 0.08 0.08 0.08 0.08 0.08 0.08 0.08 0.08 0.0830 0.08 0.08 0.07 0.07 0.07 0.07 0.07 0.07 0.07 0.07 0.07 0.07 0.07 0.07 0.07 0.0735 0.07 0.07 0.07 0.07 0.07 0.06 0.06 0.06 0.06 0.06 0.06 0.06 0.06 0.07 0.07 0.0740 0.07 0.06 0.06 0.06 0.06 0.06 0.06 0.06 0.06 0.06 0.06 0.06 0.06 0.06 0.06 0.0645 0.06 0.06 0.06 0.06 0.06 0.06 0.05 0.05 0.05 0.05 0.05 0.05 0.05 0.05 0.05 0.0650 0.06 0.06 0.05 0.05 0.05 0.05 0.05 0.05 0.05 0.05 0.05 0.05 0.05 0.05 0.05 0.0555 0.05 0.05 0.05 0.05 0.05 0.05 0.05 0.05 0.05 0.05 0.05 0.05 0.05 0.05 0.05 0.0560 0.05 0.05 0.05 0.05 0.05 0.05 0.05 0.05 0.05 0.04 0.04 0.04 0.04 0.04 0.04 0.0465 0.05 0.05 0.04 0.04 0.04 0.04 0.04 0.04 0.04 0.04 0.04 0.04 0.04 0.04 0.04 0.0470 0.05 0.04 0.04 0.04 0.04 0.04 0.04 0.04 0.04 0.04 0.04 0.04 0.04 0.04 0.04 0.0475 0.04 0.04 0.04 0.04 0.04 0.04 0.04 0.04 0.04 0.04 0.04 0.04 0.04 0.04 0.04 0.04

59
Table B-3: RMS speed error obtained using the non-linear model and wind4 as wind input file.
Derivative GainProportional
Gain 1 5 10 15 20 25 30 35 40 45 50 55 60 65 70 75
Integral Gain=15 1 558.15 179.12 1.37 0.42 0.27 0.30 0.28 0.36 0.45 0.42 0.34 0.33 0.33 0.31 0.30 0.305 0.67 0.29 0.26 0.21 0.16 0.14 0.13 0.14 0.15 0.15 0.15 0.15 0.16 0.16 0.16 0.16
10 0.23 0.18 0.15 0.13 0.11 0.10 0.10 0.09 0.09 0.10 0.10 0.10 0.10 0.11 0.11 0.1115 0.14 0.12 0.11 0.10 0.09 0.09 0.08 0.08 0.08 0.08 0.08 0.08 0.08 0.08 0.09 0.0920 0.10 0.09 0.09 0.08 0.08 0.08 0.07 0.07 0.07 0.07 0.07 0.07 0.07 0.07 0.07 0.0825 0.08 0.08 0.08 0.07 0.07 0.07 0.07 0.06 0.06 0.06 0.06 0.06 0.06 0.07 0.07 0.0730 0.07 0.07 0.07 0.06 0.06 0.06 0.06 0.06 0.06 0.06 0.06 0.06 0.06 0.06 0.06 0.0635 0.07 0.06 0.06 0.06 0.06 0.06 0.06 0.06 0.05 0.05 0.05 0.05 0.05 0.06 0.06 0.0640 0.06 0.06 0.06 0.05 0.05 0.05 0.05 0.05 0.05 0.05 0.05 0.05 0.05 0.05 0.05 0.0545 0.06 0.05 0.05 0.05 0.05 0.05 0.05 0.05 0.05 0.05 0.05 0.05 0.05 0.05 0.05 0.0550 0.05 0.05 0.05 0.05 0.05 0.05 0.05 0.05 0.05 0.05 0.04 0.04 0.04 0.04 0.05 0.0555 0.05 0.05 0.05 0.04 0.04 0.04 0.04 0.04 0.04 0.04 0.04 0.04 0.04 0.04 0.04 0.0460 0.05 0.04 0.04 0.04 0.04 0.04 0.04 0.04 0.04 0.04 0.04 0.04 0.04 0.04 0.04 0.0465 0.04 0.04 0.04 0.04 0.04 0.04 0.04 0.04 0.04 0.04 0.04 0.04 0.04 0.04 0.04 0.0470 0.04 0.04 0.04 0.04 0.04 0.04 0.04 0.04 0.04 0.04 0.04 0.04 0.04 0.04 0.04 0.0475 0.04 0.04 0.04 0.04 0.04 0.04 0.04 0.04 0.04 0.04 0.04 0.04 0.03 0.03 0.03 0.03
Integral Gain=20 1 730.92 415.88 0.76 0.65 0.33 0.20 0.18 0.20 0.19 0.21 0.27 0.39 0.42 0.38 0.33 0.325 19.91 24.75 0.27 0.28 0.24 0.18 0.14 0.11 0.11 0.11 0.12 0.13 0.15 0.15 0.15 0.16
10 22.87 0.20 0.17 0.14 0.12 0.11 0.10 0.09 0.08 0.08 0.08 0.08 0.09 0.09 0.09 0.1015 0.14 0.12 0.11 0.10 0.09 0.08 0.08 0.07 0.07 0.07 0.07 0.07 0.07 0.07 0.07 0.0720 0.10 0.09 0.08 0.08 0.07 0.07 0.07 0.06 0.06 0.06 0.06 0.06 0.06 0.06 0.06 0.0625 0.08 0.07 0.07 0.07 0.06 0.06 0.06 0.06 0.06 0.06 0.05 0.05 0.05 0.05 0.05 0.0630 0.07 0.06 0.06 0.06 0.06 0.06 0.05 0.05 0.05 0.05 0.05 0.05 0.05 0.05 0.05 0.0535 0.06 0.06 0.06 0.05 0.05 0.05 0.05 0.05 0.05 0.05 0.05 0.05 0.05 0.05 0.05 0.0540 0.06 0.05 0.05 0.05 0.05 0.05 0.05 0.05 0.05 0.05 0.04 0.04 0.04 0.04 0.04 0.0445 0.05 0.05 0.05 0.05 0.05 0.04 0.04 0.04 0.04 0.04 0.04 0.04 0.04 0.04 0.04 0.0450 0.05 0.05 0.04 0.04 0.04 0.04 0.04 0.04 0.04 0.04 0.04 0.04 0.04 0.04 0.04 0.0455 0.05 0.04 0.04 0.04 0.04 0.04 0.04 0.04 0.04 0.04 0.04 0.04 0.04 0.04 0.04 0.0460 0.04 0.04 0.04 0.04 0.04 0.04 0.04 0.04 0.04 0.04 0.04 0.04 0.04 0.04 0.04 0.0465 0.04 0.04 0.04 0.04 0.04 0.04 0.04 0.04 0.04 0.04 0.04 0.04 0.03 0.03 0.03 0.0370 0.04 0.04 0.04 0.04 0.04 0.03 0.03 0.03 0.03 0.03 0.03 0.03 0.03 0.03 0.03 0.0375 0.04 0.04 0.03 0.03 0.03 0.03 0.03 0.03 0.03 0.03 0.03 0.03 0.03 0.03 0.03 0.03

60
Table B-4: RMS speed error obtained using the non-linear model and wind5 as wind input file.
Derivative GainProportional
Gain 1 5 10 15 20 25 30 35 40 45 50 55 60 65 70 75
Integral Gain=1 1 0.48 0.38 0.43 0.52 0.60 0.64 0.65 0.64 0.63 0.61 0.60 0.59 0.59 0.59 0.59 0.595 0.25 0.23 0.22 0.24 0.26 0.28 0.29 0.31 0.32 0.33 0.33 0.34 0.35 0.35 0.36 0.36
10 0.20 0.19 0.19 0.19 0.20 0.20 0.21 0.22 0.23 0.23 0.24 0.24 0.25 0.25 0.26 0.2615 0.18 0.17 0.17 0.17 0.18 0.18 0.18 0.18 0.19 0.19 0.20 0.20 0.20 0.20 0.21 0.2120 0.16 0.16 0.16 0.16 0.16 0.16 0.16 0.16 0.16 0.17 0.17 0.17 0.17 0.17 0.18 0.1825 0.15 0.14 0.14 0.14 0.14 0.14 0.15 0.15 0.15 0.15 0.15 0.15 0.15 0.15 0.15 0.1630 0.13 0.13 0.13 0.13 0.13 0.13 0.13 0.13 0.13 0.13 0.14 0.14 0.14 0.14 0.14 0.1435 0.12 0.12 0.12 0.12 0.12 0.12 0.12 0.12 0.12 0.12 0.12 0.12 0.13 0.13 0.13 0.1340 0.12 0.11 0.11 0.11 0.11 0.11 0.11 0.11 0.11 0.11 0.11 0.12 0.12 0.12 0.12 0.1245 0.11 0.11 0.11 0.11 0.11 0.11 0.11 0.11 0.11 0.11 0.11 0.11 0.11 0.11 0.11 0.1150 0.10 0.10 0.10 0.10 0.10 0.10 0.10 0.10 0.10 0.10 0.10 0.10 0.10 0.10 0.10 0.1055 0.10 0.10 0.09 0.09 0.09 0.09 0.09 0.09 0.09 0.09 0.09 0.10 0.10 0.10 0.10 0.1060 0.09 0.09 0.09 0.09 0.09 0.09 0.09 0.09 0.09 0.09 0.09 0.09 0.09 0.09 0.09 0.0965 0.09 0.09 0.09 0.09 0.09 0.09 0.09 0.09 0.09 0.09 0.09 0.09 0.09 0.09 0.09 0.0970 0.08 0.08 0.08 0.08 0.08 0.08 0.08 0.08 0.08 0.08 0.08 0.08 0.08 0.08 0.08 0.0875 0.08 0.08 0.08 0.08 0.08 0.08 0.08 0.08 0.08 0.08 0.08 0.08 0.08 0.08 0.08 0.08
Integral Gain=5 1 0.54 0.49 0.32 0.47 0.39 0.27 0.25 0.23 0.22 0.23 0.25 0.26 0.27 0.27 0.27 0.275 0.20 0.18 0.16 0.16 0.16 0.14 0.13 0.12 0.11 0.12 0.12 0.12 0.13 0.13 0.14 0.14
10 0.13 0.11 0.11 0.10 0.09 0.09 0.08 0.08 0.08 0.08 0.08 0.08 0.08 0.08 0.08 0.0915 0.10 0.09 0.08 0.08 0.07 0.07 0.07 0.06 0.06 0.06 0.06 0.06 0.06 0.06 0.06 0.0620 0.08 0.07 0.07 0.06 0.06 0.06 0.06 0.05 0.05 0.05 0.05 0.05 0.05 0.05 0.05 0.0525 0.07 0.06 0.06 0.06 0.05 0.05 0.05 0.05 0.05 0.05 0.05 0.05 0.05 0.05 0.05 0.0530 0.06 0.06 0.05 0.05 0.05 0.05 0.05 0.05 0.05 0.04 0.04 0.04 0.04 0.04 0.04 0.0435 0.06 0.05 0.05 0.05 0.05 0.05 0.04 0.04 0.04 0.04 0.04 0.04 0.04 0.04 0.04 0.0440 0.05 0.05 0.05 0.05 0.04 0.04 0.04 0.04 0.04 0.04 0.04 0.04 0.04 0.04 0.04 0.0445 0.05 0.05 0.04 0.04 0.04 0.04 0.04 0.04 0.04 0.04 0.04 0.04 0.04 0.04 0.04 0.0450 0.05 0.04 0.04 0.04 0.04 0.04 0.04 0.04 0.04 0.04 0.04 0.04 0.04 0.04 0.04 0.0455 0.05 0.04 0.04 0.04 0.04 0.04 0.04 0.04 0.04 0.04 0.04 0.04 0.04 0.04 0.04 0.0460 0.04 0.04 0.04 0.04 0.04 0.04 0.04 0.04 0.04 0.04 0.04 0.04 0.04 0.04 0.04 0.0465 0.04 0.04 0.04 0.04 0.04 0.04 0.04 0.04 0.04 0.04 0.04 0.04 0.04 0.04 0.04 0.0470 0.04 0.04 0.04 0.04 0.04 0.04 0.04 0.04 0.04 0.04 0.04 0.04 0.04 0.04 0.03 0.0375 0.04 0.04 0.04 0.04 0.04 0.04 0.04 0.04 0.03 0.03 0.03 0.03 0.03 0.03 0.03 0.03
Integral Gain=10 1 89.72 0.61 0.30 0.32 0.34 0.21 0.25 0.36 0.38 0.29 0.20 0.17 0.18 0.18 0.17 0.165 0.18 0.14 0.13 0.14 0.13 0.13 0.13 0.14 0.15 0.14 0.12 0.11 0.10 0.10 0.09 0.09
10 0.12 0.10 0.09 0.09 0.09 0.08 0.08 0.08 0.08 0.08 0.08 0.07 0.07 0.07 0.06 0.0615 0.09 0.08 0.07 0.07 0.07 0.06 0.06 0.06 0.06 0.06 0.06 0.06 0.05 0.05 0.05 0.0520 0.08 0.07 0.06 0.06 0.05 0.05 0.05 0.05 0.05 0.05 0.05 0.05 0.04 0.04 0.04 0.0425 0.07 0.06 0.05 0.05 0.05 0.05 0.04 0.04 0.04 0.04 0.04 0.04 0.04 0.04 0.04 0.0430 0.06 0.05 0.05 0.04 0.04 0.04 0.04 0.04 0.04 0.04 0.04 0.04 0.03 0.03 0.03 0.0335 0.05 0.05 0.04 0.04 0.04 0.04 0.04 0.03 0.03 0.03 0.03 0.03 0.03 0.03 0.03 0.0340 0.05 0.04 0.04 0.04 0.03 0.03 0.03 0.03 0.03 0.03 0.03 0.03 0.03 0.03 0.03 0.0345 0.04 0.04 0.03 0.03 0.03 0.03 0.03 0.03 0.03 0.03 0.03 0.03 0.03 0.03 0.03 0.0350 0.04 0.04 0.03 0.03 0.03 0.03 0.03 0.03 0.03 0.03 0.03 0.03 0.03 0.03 0.03 0.0255 0.04 0.03 0.03 0.03 0.03 0.03 0.03 0.03 0.03 0.03 0.03 0.02 0.02 0.02 0.02 0.0260 0.04 0.03 0.03 0.03 0.03 0.03 0.03 0.03 0.03 0.02 0.02 0.02 0.02 0.02 0.02 0.0265 0.03 0.03 0.03 0.03 0.03 0.03 0.02 0.02 0.02 0.02 0.02 0.02 0.02 0.02 0.02 0.0270 0.03 0.03 0.03 0.03 0.03 0.02 0.02 0.02 0.02 0.02 0.02 0.02 0.02 0.02 0.02 0.0275 0.03 0.03 0.03 0.02 0.02 0.02 0.02 0.02 0.02 0.02 0.02 0.02 0.02 0.02 0.02 0.02

61
Table B-4: RMS speed error obtained using the non-linear model and wind5 as wind input file.
Derivative GainProportional
Gain 1 5 10 15 20 25 30 35 40 45 50 55 60 65 70 75
Integral Gain=15 1 126.42 41.45 0.45 0.17 0.23 0.22 0.33 0.21 0.16 0.17 0.22 0.29 0.31 0.29 0.23 0.175 30.96 0.14 0.11 0.09 0.10 0.12 0.12 0.11 0.10 0.11 0.12 0.13 0.14 0.14 0.13 0.11
10 0.12 0.09 0.08 0.07 0.07 0.07 0.07 0.07 0.07 0.07 0.08 0.08 0.08 0.08 0.08 0.0715 0.09 0.07 0.06 0.06 0.06 0.06 0.06 0.06 0.06 0.06 0.06 0.06 0.06 0.06 0.06 0.0520 0.08 0.06 0.06 0.05 0.05 0.05 0.05 0.05 0.05 0.05 0.05 0.05 0.05 0.04 0.04 0.0425 0.07 0.05 0.05 0.05 0.04 0.04 0.04 0.04 0.04 0.04 0.04 0.04 0.04 0.04 0.04 0.0430 0.06 0.05 0.04 0.04 0.04 0.04 0.04 0.04 0.04 0.03 0.03 0.03 0.03 0.03 0.03 0.0335 0.05 0.04 0.04 0.04 0.04 0.03 0.03 0.03 0.03 0.03 0.03 0.03 0.03 0.03 0.03 0.0340 0.05 0.04 0.04 0.03 0.03 0.03 0.03 0.03 0.03 0.03 0.03 0.03 0.03 0.03 0.03 0.0345 0.04 0.04 0.03 0.03 0.03 0.03 0.03 0.03 0.03 0.03 0.03 0.03 0.03 0.02 0.02 0.0250 0.04 0.03 0.03 0.03 0.03 0.03 0.03 0.03 0.03 0.02 0.02 0.02 0.02 0.02 0.02 0.0255 0.04 0.03 0.03 0.03 0.03 0.03 0.02 0.02 0.02 0.02 0.02 0.02 0.02 0.02 0.02 0.0260 0.03 0.03 0.03 0.03 0.02 0.02 0.02 0.02 0.02 0.02 0.02 0.02 0.02 0.02 0.02 0.0265 0.03 0.03 0.03 0.02 0.02 0.02 0.02 0.02 0.02 0.02 0.02 0.02 0.02 0.02 0.02 0.0270 0.03 0.03 0.02 0.02 0.02 0.02 0.02 0.02 0.02 0.02 0.02 0.02 0.02 0.02 0.02 0.0275 0.03 0.03 0.02 0.02 0.02 0.02 0.02 0.02 0.02 0.02 0.02 0.02 0.02 0.02 0.02 0.02
Integral Gain=20 1 110.58 75.02 14.05 0.36 0.16 0.21 0.20 0.16 0.27 0.25 0.15 0.12 0.14 0.16 0.19 0.245 84.37 0.20 0.13 0.09 0.08 0.08 0.09 0.10 0.11 0.11 0.09 0.09 0.09 0.10 0.11 0.12
10 0.15 0.10 0.08 0.07 0.06 0.06 0.06 0.07 0.07 0.07 0.07 0.06 0.06 0.07 0.07 0.0715 0.10 0.07 0.06 0.06 0.05 0.05 0.05 0.05 0.05 0.05 0.05 0.05 0.05 0.05 0.05 0.0520 0.08 0.06 0.05 0.05 0.05 0.04 0.04 0.04 0.04 0.04 0.04 0.04 0.04 0.04 0.04 0.0425 0.07 0.05 0.05 0.04 0.04 0.04 0.04 0.04 0.04 0.04 0.04 0.04 0.04 0.04 0.04 0.0430 0.06 0.05 0.04 0.04 0.04 0.04 0.03 0.03 0.03 0.03 0.03 0.03 0.03 0.03 0.03 0.0335 0.05 0.04 0.04 0.03 0.03 0.03 0.03 0.03 0.03 0.03 0.03 0.03 0.03 0.03 0.03 0.0340 0.05 0.04 0.03 0.03 0.03 0.03 0.03 0.03 0.03 0.03 0.03 0.03 0.03 0.03 0.03 0.0345 0.04 0.03 0.03 0.03 0.03 0.03 0.03 0.03 0.03 0.03 0.02 0.02 0.02 0.02 0.02 0.0250 0.04 0.03 0.03 0.03 0.03 0.03 0.03 0.02 0.02 0.02 0.02 0.02 0.02 0.02 0.02 0.0255 0.04 0.03 0.03 0.03 0.02 0.02 0.02 0.02 0.02 0.02 0.02 0.02 0.02 0.02 0.02 0.0260 0.03 0.03 0.03 0.02 0.02 0.02 0.02 0.02 0.02 0.02 0.02 0.02 0.02 0.02 0.02 0.0265 0.03 0.03 0.02 0.02 0.02 0.02 0.02 0.02 0.02 0.02 0.02 0.02 0.02 0.02 0.02 0.0270 0.03 0.03 0.02 0.02 0.02 0.02 0.02 0.02 0.02 0.02 0.02 0.02 0.02 0.02 0.02 0.0275 0.03 0.02 0.02 0.02 0.02 0.02 0.02 0.02 0.02 0.02 0.02 0.02 0.02 0.02 0.02 0.02

62
Table B-5: RMS speed error obtained using the non-linear model and highwind4 as wind input file.
Derivative GainProportional
Gain 1 5 10 15 20 25 30 35 40 45 50 55 60 65 70 75
Integral Gain=1 1 1.13 0.95 0.94 0.98 0.95 0.90 0.89 0.89 0.89 0.88 0.85 0.82 0.80 0.77 0.74 0.725 0.52 0.50 0.49 0.48 0.49 0.49 0.49 0.49 0.49 0.49 0.49 0.48 0.48 0.47 0.47 0.46
10 0.35 0.35 0.34 0.34 0.34 0.34 0.34 0.34 0.34 0.34 0.35 0.35 0.35 0.35 0.35 0.3515 0.29 0.28 0.28 0.28 0.28 0.28 0.28 0.28 0.28 0.28 0.28 0.28 0.28 0.28 0.28 0.2920 0.25 0.24 0.24 0.24 0.24 0.24 0.24 0.24 0.24 0.24 0.24 0.24 0.24 0.25 0.25 0.2525 0.22 0.22 0.22 0.22 0.22 0.22 0.22 0.22 0.22 0.22 0.22 0.22 0.22 0.22 0.22 0.2230 0.20 0.20 0.20 0.20 0.20 0.20 0.20 0.20 0.20 0.20 0.20 0.20 0.20 0.20 0.20 0.2035 0.19 0.19 0.18 0.18 0.18 0.18 0.18 0.18 0.18 0.18 0.18 0.18 0.18 0.19 0.19 0.1940 0.17 0.17 0.17 0.17 0.17 0.17 0.17 0.17 0.17 0.17 0.17 0.17 0.17 0.17 0.17 0.1745 0.16 0.16 0.16 0.16 0.16 0.16 0.16 0.16 0.16 0.16 0.16 0.16 0.16 0.16 0.16 0.1650 0.15 0.15 0.15 0.15 0.15 0.15 0.15 0.15 0.15 0.15 0.15 0.15 0.15 0.15 0.15 0.1555 0.15 0.15 0.15 0.15 0.15 0.15 0.15 0.15 0.15 0.15 0.15 0.15 0.15 0.15 0.15 0.1560 0.14 0.14 0.14 0.14 0.14 0.14 0.14 0.14 0.14 0.14 0.14 0.14 0.14 0.14 0.14 0.1465 0.13 0.13 0.13 0.13 0.13 0.13 0.13 0.13 0.13 0.13 0.13 0.13 0.13 0.13 0.13 0.1370 0.13 0.13 0.13 0.13 0.13 0.13 0.13 0.13 0.13 0.13 0.13 0.13 0.13 0.13 0.13 0.1375 0.12 0.12 0.12 0.12 0.12 0.12 0.12 0.12 0.12 0.12 0.12 0.12 0.12 0.12 0.12 0.12
Integral Gain=5 1 0.61 0.59 0.65 0.63 0.64 0.56 0.52 0.43 0.34 0.31 0.32 0.34 0.39 0.44 0.49 0.535 0.32 0.31 0.32 0.33 0.32 0.31 0.29 0.27 0.25 0.24 0.24 0.25 0.26 0.27 0.29 0.30
10 0.22 0.21 0.21 0.21 0.21 0.20 0.20 0.19 0.19 0.19 0.18 0.19 0.19 0.19 0.19 0.2015 0.17 0.17 0.16 0.16 0.16 0.16 0.16 0.15 0.15 0.15 0.15 0.15 0.15 0.15 0.15 0.1520 0.14 0.14 0.14 0.13 0.13 0.13 0.13 0.13 0.13 0.13 0.13 0.13 0.13 0.13 0.13 0.1325 0.12 0.12 0.12 0.12 0.12 0.11 0.11 0.11 0.11 0.11 0.11 0.11 0.11 0.11 0.11 0.1130 0.11 0.11 0.10 0.10 0.10 0.10 0.10 0.10 0.10 0.10 0.10 0.10 0.10 0.10 0.10 0.1035 0.10 0.10 0.09 0.09 0.09 0.09 0.09 0.09 0.09 0.09 0.09 0.09 0.09 0.09 0.09 0.0940 0.09 0.09 0.09 0.09 0.09 0.09 0.08 0.08 0.08 0.08 0.08 0.08 0.08 0.08 0.08 0.0845 0.08 0.08 0.08 0.08 0.08 0.08 0.08 0.08 0.08 0.08 0.08 0.08 0.08 0.08 0.08 0.0850 0.08 0.08 0.08 0.08 0.07 0.07 0.07 0.07 0.07 0.07 0.07 0.07 0.07 0.07 0.07 0.0755 0.07 0.07 0.07 0.07 0.07 0.07 0.07 0.07 0.07 0.07 0.07 0.07 0.07 0.07 0.07 0.0760 0.07 0.07 0.07 0.07 0.07 0.07 0.07 0.07 0.07 0.07 0.07 0.07 0.07 0.07 0.07 0.0765 0.07 0.07 0.06 0.06 0.06 0.06 0.06 0.06 0.06 0.06 0.06 0.06 0.06 0.06 0.06 0.0670 0.07 0.06 0.06 0.06 0.06 0.06 0.06 0.06 0.06 0.06 0.06 0.06 0.06 0.06 0.06 0.0675 0.06 0.06 0.06 0.06 0.06 0.06 0.06 0.06 0.06 0.06 0.06 0.06 0.06 0.06 0.06 0.06
Integral Gain=10 1 46.61 0.47 0.35 0.41 0.51 0.44 0.40 0.42 0.48 0.42 0.36 0.35 0.37 0.36 0.32 0.275 0.36 0.22 0.21 0.22 0.24 0.24 0.25 0.25 0.26 0.25 0.24 0.23 0.23 0.22 0.20 0.19
10 0.18 0.16 0.16 0.16 0.16 0.17 0.17 0.17 0.17 0.17 0.17 0.16 0.16 0.15 0.15 0.1415 0.14 0.13 0.13 0.13 0.13 0.13 0.13 0.13 0.13 0.13 0.13 0.13 0.13 0.12 0.12 0.1220 0.12 0.11 0.11 0.11 0.11 0.11 0.11 0.11 0.11 0.11 0.11 0.11 0.10 0.10 0.10 0.1025 0.10 0.10 0.10 0.09 0.09 0.09 0.09 0.09 0.09 0.09 0.09 0.09 0.09 0.09 0.09 0.0930 0.09 0.09 0.09 0.08 0.08 0.08 0.08 0.08 0.08 0.08 0.08 0.08 0.08 0.08 0.08 0.0835 0.08 0.08 0.08 0.08 0.08 0.08 0.08 0.08 0.07 0.07 0.07 0.07 0.07 0.07 0.07 0.0740 0.08 0.07 0.07 0.07 0.07 0.07 0.07 0.07 0.07 0.07 0.07 0.07 0.07 0.07 0.07 0.0745 0.07 0.07 0.07 0.07 0.06 0.06 0.06 0.06 0.06 0.06 0.06 0.06 0.06 0.06 0.06 0.0650 0.07 0.06 0.06 0.06 0.06 0.06 0.06 0.06 0.06 0.06 0.06 0.06 0.06 0.06 0.06 0.0655 0.06 0.06 0.06 0.06 0.06 0.06 0.06 0.06 0.06 0.06 0.06 0.05 0.05 0.05 0.05 0.0560 0.06 0.06 0.05 0.05 0.05 0.05 0.05 0.05 0.05 0.05 0.05 0.05 0.05 0.05 0.05 0.0565 0.06 0.05 0.05 0.05 0.05 0.05 0.05 0.05 0.05 0.05 0.05 0.05 0.05 0.05 0.05 0.0570 0.05 0.05 0.05 0.05 0.05 0.05 0.05 0.05 0.05 0.05 0.05 0.05 0.05 0.05 0.05 0.0575 0.05 0.05 0.05 0.05 0.05 0.05 0.05 0.05 0.05 0.05 0.04 0.04 0.04 0.04 0.04 0.04

63
Table B-5: RMS speed error obtained using the non-linear model and highwind4 as wind input file.
Derivative GainProportional
Gain 1 5 10 15 20 25 30 35 40 45 50 55 60 65 70 75
Integral Gain=15 1 8.36 1.61 0.35 0.32 0.24 0.32 0.42 0.40 0.35 0.33 0.30 0.33 0.38 0.37 0.32 0.265 1.47 0.23 0.18 0.16 0.16 0.18 0.20 0.21 0.20 0.20 0.20 0.21 0.22 0.22 0.21 0.20
10 0.17 0.14 0.13 0.13 0.13 0.13 0.14 0.14 0.14 0.15 0.15 0.15 0.15 0.15 0.15 0.1515 0.13 0.11 0.11 0.11 0.11 0.11 0.11 0.11 0.11 0.12 0.12 0.12 0.12 0.12 0.12 0.1220 0.11 0.10 0.09 0.09 0.09 0.09 0.09 0.09 0.10 0.10 0.10 0.10 0.10 0.10 0.10 0.1025 0.09 0.09 0.08 0.08 0.08 0.08 0.08 0.08 0.08 0.08 0.08 0.08 0.08 0.08 0.08 0.0830 0.08 0.08 0.08 0.07 0.07 0.07 0.07 0.07 0.07 0.07 0.07 0.07 0.07 0.07 0.07 0.0735 0.07 0.07 0.07 0.07 0.07 0.07 0.07 0.07 0.07 0.07 0.07 0.07 0.07 0.07 0.07 0.0740 0.07 0.07 0.06 0.06 0.06 0.06 0.06 0.06 0.06 0.06 0.06 0.06 0.06 0.06 0.06 0.0645 0.06 0.06 0.06 0.06 0.06 0.06 0.06 0.06 0.06 0.06 0.06 0.06 0.06 0.06 0.06 0.0650 0.06 0.06 0.06 0.05 0.05 0.05 0.05 0.05 0.05 0.05 0.05 0.05 0.05 0.05 0.05 0.0555 0.06 0.05 0.05 0.05 0.05 0.05 0.05 0.05 0.05 0.05 0.05 0.05 0.05 0.05 0.05 0.0560 0.05 0.05 0.05 0.05 0.05 0.05 0.05 0.05 0.05 0.05 0.05 0.05 0.05 0.05 0.05 0.0565 0.05 0.05 0.05 0.05 0.05 0.04 0.04 0.04 0.04 0.04 0.04 0.04 0.04 0.04 0.04 0.0470 0.05 0.05 0.04 0.04 0.04 0.04 0.04 0.04 0.04 0.04 0.04 0.04 0.04 0.04 0.04 0.0475 0.05 0.04 0.04 0.04 0.04 0.04 0.04 0.04 0.04 0.04 0.04 0.04 0.04 0.04 0.04 0.04
Integral Gain=20 1 11.22 72.27 1.67 0.29 0.30 0.22 0.20 0.26 0.34 0.37 0.33 0.29 0.28 0.26 0.25 0.285 67.23 0.30 0.18 0.15 0.14 0.14 0.14 0.16 0.18 0.19 0.18 0.18 0.17 0.17 0.17 0.18
10 0.16 0.14 0.12 0.11 0.11 0.11 0.11 0.12 0.12 0.13 0.13 0.13 0.13 0.13 0.13 0.1315 0.12 0.11 0.10 0.09 0.09 0.09 0.09 0.09 0.10 0.10 0.10 0.10 0.10 0.11 0.11 0.1120 0.10 0.09 0.08 0.08 0.08 0.08 0.08 0.08 0.08 0.08 0.09 0.09 0.09 0.09 0.09 0.0925 0.09 0.08 0.08 0.07 0.07 0.07 0.07 0.07 0.07 0.07 0.08 0.08 0.08 0.08 0.08 0.0830 0.08 0.07 0.07 0.07 0.07 0.07 0.07 0.07 0.07 0.07 0.07 0.07 0.07 0.07 0.07 0.0735 0.07 0.07 0.06 0.06 0.06 0.06 0.06 0.06 0.06 0.06 0.06 0.06 0.06 0.06 0.06 0.0640 0.06 0.06 0.06 0.06 0.06 0.06 0.06 0.06 0.06 0.06 0.06 0.06 0.06 0.06 0.06 0.0645 0.06 0.06 0.05 0.05 0.05 0.05 0.05 0.05 0.05 0.05 0.05 0.05 0.05 0.05 0.05 0.0550 0.06 0.05 0.05 0.05 0.05 0.05 0.05 0.05 0.05 0.05 0.05 0.05 0.05 0.05 0.05 0.0555 0.05 0.05 0.05 0.05 0.05 0.05 0.05 0.05 0.05 0.05 0.05 0.05 0.05 0.05 0.05 0.0560 0.05 0.05 0.05 0.04 0.04 0.04 0.04 0.04 0.04 0.04 0.04 0.04 0.04 0.04 0.04 0.0465 0.05 0.05 0.04 0.04 0.04 0.04 0.04 0.04 0.04 0.04 0.04 0.04 0.04 0.04 0.04 0.0470 0.05 0.04 0.04 0.04 0.04 0.04 0.04 0.04 0.04 0.04 0.04 0.04 0.04 0.04 0.04 0.0475 0.05 0.04 0.04 0.04 0.04 0.04 0.04 0.04 0.04 0.04 0.04 0.04 0.04 0.04 0.04 0.04

64
Table B-6: RMS speed error obtained using the non-linear model averaged with all five wind input cases.
Derivative GainProportional
Gain 1 5 10 15 20 25 30 35 40 45 50 55 60 65 70 75
Integral Gain=1 1 0.80 0.74 0.74 0.76 0.77 0.81 0.83 0.84 0.84 0.82 0.79 0.76 0.73 0.71 0.68 0.665 0.40 0.38 0.38 0.38 0.39 0.40 0.41 0.41 0.41 0.42 0.42 0.41 0.41 0.41 0.40 0.40
10 0.29 0.27 0.27 0.27 0.27 0.27 0.27 0.28 0.28 0.28 0.28 0.28 0.28 0.28 0.28 0.2915 0.23 0.23 0.22 0.22 0.22 0.22 0.22 0.22 0.22 0.22 0.22 0.23 0.23 0.23 0.23 0.2320 0.20 0.20 0.19 0.19 0.19 0.19 0.19 0.19 0.19 0.19 0.19 0.19 0.19 0.19 0.20 0.2025 0.18 0.18 0.17 0.17 0.17 0.17 0.17 0.17 0.17 0.17 0.17 0.17 0.17 0.17 0.17 0.1730 0.17 0.16 0.16 0.16 0.16 0.16 0.16 0.16 0.16 0.16 0.16 0.16 0.16 0.16 0.16 0.1635 0.15 0.15 0.15 0.15 0.15 0.15 0.15 0.15 0.14 0.14 0.14 0.14 0.15 0.15 0.15 0.1540 0.14 0.14 0.14 0.14 0.14 0.14 0.14 0.14 0.14 0.14 0.14 0.14 0.14 0.14 0.14 0.1445 0.13 0.13 0.13 0.13 0.13 0.13 0.13 0.13 0.13 0.13 0.13 0.13 0.13 0.13 0.13 0.1350 0.13 0.13 0.13 0.12 0.12 0.12 0.12 0.12 0.12 0.12 0.12 0.12 0.12 0.12 0.12 0.1255 0.12 0.12 0.12 0.12 0.12 0.12 0.12 0.12 0.12 0.12 0.12 0.12 0.12 0.12 0.12 0.1260 0.12 0.12 0.11 0.11 0.11 0.11 0.11 0.11 0.11 0.11 0.11 0.11 0.11 0.11 0.11 0.1165 0.11 0.11 0.11 0.11 0.11 0.11 0.11 0.11 0.11 0.11 0.11 0.11 0.11 0.11 0.11 0.1170 0.11 0.11 0.11 0.11 0.10 0.10 0.10 0.10 0.10 0.10 0.10 0.10 0.10 0.10 0.10 0.1075 0.10 0.10 0.10 0.10 0.10 0.10 0.10 0.10 0.10 0.10 0.10 0.10 0.10 0.10 0.10 0.10
Integral Gain=5 1 1.20 0.69 0.55 0.51 0.46 0.39 0.39 0.41 0.42 0.42 0.43 0.43 0.44 0.44 0.44 0.435 0.33 0.29 0.27 0.25 0.24 0.23 0.22 0.22 0.22 0.23 0.23 0.24 0.24 0.24 0.25 0.25
10 0.22 0.20 0.18 0.17 0.17 0.16 0.16 0.16 0.16 0.16 0.16 0.16 0.16 0.17 0.17 0.1715 0.17 0.16 0.15 0.14 0.14 0.13 0.13 0.13 0.13 0.13 0.13 0.13 0.13 0.13 0.13 0.1420 0.14 0.14 0.13 0.12 0.12 0.12 0.12 0.11 0.11 0.11 0.11 0.11 0.11 0.11 0.12 0.1225 0.13 0.12 0.12 0.11 0.11 0.11 0.10 0.10 0.10 0.10 0.10 0.10 0.10 0.10 0.10 0.1030 0.11 0.11 0.11 0.10 0.10 0.10 0.10 0.10 0.10 0.09 0.09 0.09 0.09 0.09 0.09 0.0935 0.10 0.10 0.10 0.10 0.09 0.09 0.09 0.09 0.09 0.09 0.09 0.09 0.09 0.09 0.09 0.0940 0.10 0.09 0.09 0.09 0.09 0.09 0.09 0.09 0.08 0.08 0.08 0.08 0.08 0.08 0.08 0.0845 0.09 0.09 0.09 0.09 0.08 0.08 0.08 0.08 0.08 0.08 0.08 0.08 0.08 0.08 0.08 0.0850 0.09 0.08 0.08 0.08 0.08 0.08 0.08 0.08 0.08 0.08 0.08 0.08 0.08 0.08 0.08 0.0855 0.08 0.08 0.08 0.08 0.08 0.08 0.08 0.08 0.07 0.07 0.07 0.07 0.07 0.07 0.07 0.0760 0.08 0.08 0.08 0.08 0.07 0.07 0.07 0.07 0.07 0.07 0.07 0.07 0.07 0.07 0.07 0.0765 0.08 0.08 0.07 0.07 0.07 0.07 0.07 0.07 0.07 0.07 0.07 0.07 0.07 0.07 0.07 0.0770 0.07 0.07 0.07 0.07 0.07 0.07 0.07 0.07 0.07 0.07 0.07 0.07 0.07 0.07 0.07 0.0775 0.07 0.07 0.07 0.07 0.07 0.07 0.07 0.07 0.07 0.07 0.07 0.07 0.07 0.07 0.07 0.07
Integral Gain=10 1 59.29 5.37 0.79 0.58 0.59 0.51 0.43 0.42 0.39 0.36 0.32 0.29 0.28 0.29 0.29 0.305 0.66 0.31 0.27 0.25 0.25 0.24 0.23 0.22 0.21 0.20 0.19 0.19 0.18 0.18 0.18 0.18
10 0.22 0.20 0.18 0.17 0.17 0.16 0.16 0.15 0.15 0.14 0.14 0.14 0.14 0.13 0.13 0.1315 0.17 0.15 0.14 0.14 0.13 0.13 0.13 0.12 0.12 0.12 0.11 0.11 0.11 0.11 0.11 0.1120 0.14 0.13 0.12 0.12 0.11 0.11 0.11 0.11 0.10 0.10 0.10 0.10 0.10 0.10 0.10 0.1025 0.12 0.11 0.11 0.11 0.10 0.10 0.10 0.10 0.09 0.09 0.09 0.09 0.09 0.09 0.09 0.0930 0.11 0.10 0.10 0.10 0.09 0.09 0.09 0.09 0.09 0.09 0.08 0.08 0.08 0.08 0.08 0.0835 0.10 0.09 0.09 0.09 0.09 0.09 0.08 0.08 0.08 0.08 0.08 0.08 0.08 0.08 0.08 0.0840 0.09 0.09 0.09 0.08 0.08 0.08 0.08 0.08 0.08 0.08 0.08 0.07 0.07 0.07 0.07 0.0745 0.09 0.08 0.08 0.08 0.08 0.08 0.08 0.07 0.07 0.07 0.07 0.07 0.07 0.07 0.07 0.0750 0.08 0.08 0.08 0.08 0.07 0.07 0.07 0.07 0.07 0.07 0.07 0.07 0.07 0.07 0.07 0.0755 0.08 0.08 0.07 0.07 0.07 0.07 0.07 0.07 0.07 0.07 0.07 0.07 0.07 0.07 0.07 0.0760 0.07 0.07 0.07 0.07 0.07 0.07 0.07 0.07 0.07 0.07 0.06 0.06 0.06 0.06 0.06 0.0665 0.07 0.07 0.07 0.07 0.07 0.07 0.06 0.06 0.06 0.06 0.06 0.06 0.06 0.06 0.06 0.0670 0.07 0.07 0.07 0.07 0.06 0.06 0.06 0.06 0.06 0.06 0.06 0.06 0.06 0.06 0.06 0.0675 0.07 0.07 0.06 0.06 0.06 0.06 0.06 0.06 0.06 0.06 0.06 0.06 0.06 0.06 0.06 0.06

65
Table B-6: RMS speed error obtained using the non-linear model averaged with all five wind input cases.
Derivative GainProportional
Gain 1 5 10 15 20 25 30 35 40 45 50 55 60 65 70 75
Integral Gain=15 1 168.26 49.40 2.24 0.95 0.65 0.51 0.46 0.52 0.49 0.42 0.40 0.39 0.35 0.33 0.31 0.295 10.40 1.72 0.31 0.27 0.24 0.23 0.23 0.24 0.24 0.23 0.22 0.21 0.20 0.19 0.19 0.18
10 0.33 0.21 0.19 0.18 0.17 0.16 0.16 0.16 0.16 0.15 0.15 0.15 0.14 0.14 0.14 0.1315 0.19 0.16 0.15 0.14 0.13 0.13 0.13 0.13 0.12 0.12 0.12 0.12 0.12 0.11 0.11 0.1120 0.15 0.13 0.12 0.12 0.12 0.11 0.11 0.11 0.11 0.10 0.10 0.10 0.10 0.10 0.10 0.1025 0.13 0.12 0.11 0.11 0.10 0.10 0.10 0.10 0.09 0.09 0.09 0.09 0.09 0.09 0.09 0.0930 0.12 0.10 0.10 0.10 0.09 0.09 0.09 0.09 0.09 0.09 0.08 0.08 0.08 0.08 0.08 0.0835 0.10 0.10 0.09 0.09 0.09 0.08 0.08 0.08 0.08 0.08 0.08 0.08 0.08 0.08 0.08 0.0840 0.09 0.09 0.09 0.08 0.08 0.08 0.08 0.08 0.08 0.08 0.07 0.07 0.07 0.07 0.07 0.0745 0.09 0.08 0.08 0.08 0.08 0.08 0.07 0.07 0.07 0.07 0.07 0.07 0.07 0.07 0.07 0.0750 0.08 0.08 0.08 0.07 0.07 0.07 0.07 0.07 0.07 0.07 0.07 0.07 0.07 0.07 0.07 0.0755 0.08 0.07 0.07 0.07 0.07 0.07 0.07 0.07 0.07 0.07 0.07 0.06 0.06 0.06 0.06 0.0660 0.07 0.07 0.07 0.07 0.07 0.07 0.07 0.07 0.06 0.06 0.06 0.06 0.06 0.06 0.06 0.0665 0.07 0.07 0.07 0.07 0.07 0.06 0.06 0.06 0.06 0.06 0.06 0.06 0.06 0.06 0.06 0.0670 0.07 0.07 0.07 0.06 0.06 0.06 0.06 0.06 0.06 0.06 0.06 0.06 0.06 0.06 0.06 0.0675 0.07 0.06 0.06 0.06 0.06 0.06 0.06 0.06 0.06 0.06 0.06 0.06 0.06 0.06 0.06 0.06
Integral Gain=20 1 281.78 146.81 17.84 1.49 0.87 0.70 0.54 0.46 0.43 0.44 0.47 0.46 0.42 0.38 0.38 0.385 97.67 16.82 0.75 0.32 0.27 0.26 0.23 0.22 0.22 0.23 0.24 0.24 0.23 0.22 0.22 0.21
10 12.95 0.25 0.20 0.19 0.17 0.17 0.16 0.16 0.16 0.16 0.16 0.16 0.16 0.15 0.15 0.1515 0.60 0.17 0.15 0.14 0.14 0.13 0.13 0.13 0.13 0.13 0.13 0.13 0.12 0.12 0.12 0.1220 0.18 0.14 0.13 0.12 0.12 0.11 0.11 0.11 0.11 0.11 0.11 0.11 0.10 0.10 0.10 0.1025 0.16 0.12 0.11 0.11 0.10 0.10 0.10 0.10 0.10 0.10 0.10 0.09 0.09 0.09 0.09 0.0930 0.14 0.11 0.10 0.10 0.09 0.09 0.09 0.09 0.09 0.09 0.09 0.09 0.08 0.08 0.08 0.0835 0.12 0.10 0.09 0.09 0.09 0.09 0.08 0.08 0.08 0.08 0.08 0.08 0.08 0.08 0.08 0.0840 0.11 0.09 0.09 0.08 0.08 0.08 0.08 0.08 0.08 0.08 0.08 0.07 0.07 0.07 0.07 0.0745 0.10 0.08 0.08 0.08 0.08 0.08 0.07 0.07 0.07 0.07 0.07 0.07 0.07 0.07 0.07 0.0750 0.09 0.08 0.08 0.08 0.07 0.07 0.07 0.07 0.07 0.07 0.07 0.07 0.07 0.07 0.07 0.0755 0.08 0.08 0.07 0.07 0.07 0.07 0.07 0.07 0.07 0.07 0.07 0.07 0.06 0.06 0.06 0.0660 0.08 0.07 0.07 0.07 0.07 0.07 0.07 0.07 0.06 0.06 0.06 0.06 0.06 0.06 0.06 0.0665 0.07 0.07 0.07 0.07 0.07 0.06 0.06 0.06 0.06 0.06 0.06 0.06 0.06 0.06 0.06 0.0670 0.07 0.07 0.07 0.06 0.06 0.06 0.06 0.06 0.06 0.06 0.06 0.06 0.06 0.06 0.06 0.0675 0.07 0.07 0.06 0.06 0.06 0.06 0.06 0.06 0.06 0.06 0.06 0.06 0.06 0.06 0.06 0.06

66
Table B-7: Actuator duty cycle obtained using the non-linear model and medwind2 as wind input file.
Derivative GainProportional
Gain 1 5 10 15 20 25 30 35 40 45 50 55 60 65 70 75
Integral Gain=1 1 0.57 0.56 0.66 0.76 0.84 0.88 0.92 0.96 1.00 1.02 1.02 1.03 1.04 1.04 1.05 1.065 0.72 0.69 0.75 0.83 0.88 0.92 0.95 0.98 1.00 1.01 1.03 1.04 1.05 1.06 1.07 1.08
10 0.88 0.82 0.85 0.89 0.93 0.96 0.98 1.01 1.02 1.04 1.05 1.07 1.08 1.08 1.09 1.1015 1.02 0.92 0.92 0.94 0.96 0.99 1.01 1.03 1.05 1.06 1.08 1.09 1.10 1.11 1.11 1.1220 1.12 1.00 0.98 0.98 1.00 1.01 1.03 1.05 1.07 1.08 1.09 1.11 1.12 1.12 1.13 1.1425 1.19 1.06 1.02 1.01 1.02 1.03 1.04 1.06 1.07 1.09 1.10 1.11 1.12 1.13 1.13 1.1430 1.24 1.10 1.05 1.04 1.04 1.05 1.06 1.07 1.08 1.09 1.10 1.11 1.12 1.13 1.14 1.1435 1.26 1.14 1.08 1.06 1.06 1.06 1.07 1.08 1.08 1.09 1.11 1.12 1.12 1.13 1.14 1.1540 1.28 1.16 1.11 1.09 1.08 1.08 1.08 1.08 1.09 1.10 1.11 1.12 1.12 1.13 1.14 1.1545 1.29 1.18 1.13 1.10 1.09 1.09 1.09 1.09 1.10 1.10 1.11 1.12 1.13 1.13 1.14 1.1550 1.30 1.20 1.15 1.12 1.11 1.10 1.10 1.10 1.11 1.11 1.11 1.12 1.12 1.13 1.14 1.1555 1.30 1.21 1.16 1.13 1.12 1.11 1.11 1.11 1.11 1.11 1.12 1.12 1.12 1.13 1.14 1.1560 1.30 1.21 1.17 1.14 1.13 1.12 1.12 1.12 1.12 1.12 1.12 1.12 1.13 1.13 1.13 1.1465 1.30 1.22 1.18 1.15 1.14 1.13 1.13 1.13 1.13 1.13 1.13 1.13 1.13 1.13 1.13 1.1470 1.30 1.22 1.18 1.16 1.15 1.14 1.13 1.13 1.13 1.13 1.13 1.13 1.13 1.14 1.14 1.1475 1.30 1.23 1.19 1.17 1.16 1.15 1.14 1.14 1.14 1.14 1.14 1.14 1.14 1.14 1.14 1.14
Integral Gain=5 1 2.42 1.67 1.03 0.96 0.89 0.91 1.03 1.03 1.03 1.00 1.00 1.01 1.04 1.06 1.08 1.105 1.15 0.91 0.87 0.89 0.93 0.97 1.00 1.01 1.02 1.03 1.04 1.05 1.08 1.09 1.10 1.11
10 1.05 0.94 0.92 0.93 0.95 1.00 1.02 1.04 1.06 1.07 1.09 1.10 1.10 1.11 1.12 1.1315 1.12 0.98 0.96 0.97 0.98 1.00 1.03 1.05 1.07 1.08 1.10 1.11 1.12 1.12 1.13 1.1420 1.21 1.04 1.00 1.00 1.01 1.02 1.03 1.05 1.07 1.09 1.10 1.11 1.12 1.13 1.14 1.1525 1.28 1.10 1.04 1.03 1.03 1.04 1.05 1.06 1.07 1.09 1.10 1.12 1.13 1.14 1.14 1.1530 1.33 1.15 1.07 1.06 1.05 1.06 1.06 1.07 1.08 1.08 1.10 1.11 1.12 1.13 1.14 1.1535 1.35 1.18 1.10 1.08 1.07 1.07 1.08 1.08 1.09 1.09 1.10 1.10 1.12 1.13 1.14 1.1540 1.36 1.20 1.13 1.10 1.09 1.09 1.09 1.09 1.09 1.10 1.10 1.11 1.11 1.12 1.13 1.1445 1.35 1.21 1.15 1.12 1.10 1.10 1.10 1.10 1.10 1.11 1.11 1.11 1.12 1.12 1.13 1.1450 1.35 1.23 1.16 1.13 1.12 1.11 1.11 1.11 1.11 1.11 1.12 1.12 1.12 1.12 1.13 1.1355 1.34 1.23 1.17 1.14 1.13 1.12 1.12 1.12 1.12 1.12 1.12 1.12 1.13 1.13 1.13 1.1360 1.34 1.24 1.18 1.16 1.14 1.13 1.13 1.12 1.12 1.12 1.13 1.13 1.13 1.13 1.13 1.1465 1.34 1.25 1.19 1.16 1.15 1.14 1.13 1.13 1.13 1.13 1.13 1.13 1.13 1.14 1.14 1.1470 1.34 1.25 1.19 1.17 1.16 1.15 1.14 1.14 1.14 1.13 1.14 1.14 1.14 1.14 1.14 1.1475 1.33 1.26 1.20 1.18 1.16 1.15 1.15 1.14 1.14 1.14 1.14 1.14 1.14 1.14 1.14 1.14
Integral Gain=10 1 1.84 2.18 2.62 1.89 1.75 1.38 1.21 1.14 1.09 1.04 1.02 1.05 1.09 1.12 1.16 1.175 2.89 1.44 1.14 1.04 1.03 1.00 0.98 0.99 1.01 1.04 1.07 1.09 1.11 1.13 1.15 1.16
10 1.41 1.11 1.02 0.98 0.98 0.98 1.00 1.01 1.02 1.03 1.07 1.10 1.12 1.13 1.15 1.1515 1.29 1.07 1.02 1.01 1.01 1.01 1.02 1.03 1.04 1.05 1.06 1.09 1.12 1.13 1.14 1.1520 1.34 1.09 1.04 1.03 1.03 1.03 1.04 1.04 1.05 1.06 1.07 1.08 1.11 1.13 1.14 1.1525 1.40 1.15 1.06 1.05 1.04 1.05 1.05 1.06 1.07 1.07 1.08 1.09 1.10 1.12 1.13 1.1530 1.45 1.20 1.10 1.07 1.06 1.06 1.07 1.07 1.08 1.08 1.09 1.09 1.10 1.11 1.12 1.1435 1.46 1.24 1.13 1.09 1.08 1.08 1.08 1.08 1.09 1.09 1.10 1.10 1.11 1.11 1.11 1.1240 1.47 1.26 1.15 1.11 1.10 1.09 1.09 1.09 1.10 1.10 1.10 1.11 1.11 1.11 1.12 1.1245 1.46 1.28 1.17 1.13 1.11 1.11 1.10 1.10 1.10 1.11 1.11 1.11 1.12 1.12 1.12 1.1250 1.45 1.29 1.19 1.15 1.13 1.12 1.11 1.11 1.11 1.11 1.12 1.12 1.12 1.12 1.13 1.1355 1.44 1.29 1.20 1.16 1.14 1.13 1.12 1.12 1.12 1.12 1.12 1.12 1.13 1.13 1.13 1.1360 1.42 1.29 1.21 1.17 1.15 1.14 1.13 1.13 1.13 1.13 1.13 1.13 1.13 1.13 1.13 1.1365 1.40 1.29 1.22 1.17 1.16 1.14 1.14 1.13 1.13 1.13 1.13 1.13 1.13 1.13 1.14 1.1470 1.39 1.29 1.22 1.18 1.16 1.15 1.14 1.14 1.14 1.14 1.14 1.14 1.14 1.14 1.14 1.1475 1.38 1.29 1.23 1.19 1.17 1.16 1.15 1.14 1.14 1.14 1.14 1.14 1.14 1.14 1.14 1.14

67
Table B-7: Actuator duty cycle obtained using the non-linear model and medwind2 as wind input file.
Derivative GainProportional
Gain 1 5 10 15 20 25 30 35 40 45 50 55 60 65 70 75
Integral Gain=15 1 1.76 2.68 2.42 2.28 2.50 2.06 1.61 1.75 1.50 1.35 1.22 1.18 1.14 1.16 1.13 1.115 1.91 2.40 1.73 1.39 1.18 1.13 1.16 1.13 1.07 1.04 1.04 1.06 1.06 1.08 1.11 1.12
10 1.91 1.35 1.19 1.10 1.05 1.03 1.04 1.04 1.03 1.03 1.04 1.05 1.06 1.07 1.08 1.1115 1.60 1.22 1.10 1.07 1.05 1.04 1.04 1.04 1.04 1.05 1.05 1.06 1.07 1.08 1.08 1.1020 1.49 1.18 1.09 1.07 1.06 1.05 1.05 1.06 1.06 1.06 1.07 1.07 1.08 1.09 1.09 1.1025 1.55 1.21 1.09 1.07 1.07 1.07 1.07 1.07 1.07 1.07 1.08 1.08 1.09 1.09 1.10 1.1030 1.58 1.25 1.12 1.09 1.08 1.08 1.08 1.08 1.08 1.08 1.09 1.09 1.10 1.10 1.11 1.1135 1.58 1.29 1.16 1.11 1.09 1.09 1.09 1.09 1.09 1.09 1.10 1.10 1.10 1.11 1.11 1.1240 1.57 1.31 1.19 1.13 1.11 1.10 1.10 1.10 1.10 1.10 1.10 1.11 1.11 1.11 1.12 1.1245 1.55 1.33 1.21 1.15 1.12 1.11 1.11 1.11 1.11 1.11 1.11 1.11 1.12 1.12 1.12 1.1250 1.55 1.34 1.23 1.17 1.13 1.12 1.12 1.11 1.11 1.12 1.12 1.12 1.12 1.12 1.13 1.1355 1.54 1.35 1.24 1.18 1.15 1.13 1.12 1.12 1.12 1.12 1.12 1.12 1.13 1.13 1.13 1.1360 1.53 1.35 1.25 1.19 1.16 1.14 1.13 1.13 1.13 1.13 1.13 1.13 1.13 1.13 1.13 1.1365 1.52 1.34 1.25 1.20 1.17 1.15 1.14 1.14 1.13 1.13 1.13 1.13 1.13 1.13 1.14 1.1470 1.50 1.34 1.26 1.21 1.17 1.16 1.15 1.14 1.14 1.14 1.14 1.14 1.14 1.14 1.14 1.1475 1.48 1.33 1.26 1.21 1.18 1.16 1.15 1.15 1.14 1.14 1.14 1.14 1.14 1.14 1.14 1.14
Integral Gain=20 1 0.70 2.47 1.93 2.36 2.34 2.66 2.50 2.11 1.65 1.64 1.75 1.54 1.40 1.30 1.24 1.205 0.83 2.23 2.61 2.14 1.52 1.37 1.21 1.19 1.21 1.26 1.20 1.11 1.08 1.09 1.10 1.10
10 2.08 1.58 1.35 1.26 1.18 1.12 1.09 1.08 1.09 1.10 1.08 1.06 1.06 1.06 1.07 1.0815 3.38 1.42 1.20 1.14 1.12 1.09 1.07 1.07 1.07 1.07 1.07 1.07 1.07 1.07 1.07 1.0820 1.83 1.32 1.15 1.11 1.10 1.09 1.08 1.08 1.08 1.08 1.08 1.08 1.08 1.08 1.09 1.0925 1.71 1.29 1.14 1.10 1.10 1.09 1.09 1.08 1.08 1.08 1.09 1.09 1.09 1.09 1.09 1.1030 1.75 1.32 1.16 1.11 1.10 1.09 1.09 1.09 1.09 1.09 1.09 1.10 1.10 1.10 1.10 1.1035 1.76 1.35 1.19 1.12 1.10 1.10 1.10 1.10 1.10 1.10 1.10 1.10 1.10 1.10 1.11 1.1140 1.73 1.37 1.21 1.15 1.12 1.11 1.10 1.10 1.10 1.10 1.11 1.11 1.11 1.11 1.11 1.1245 1.69 1.38 1.24 1.17 1.13 1.12 1.11 1.11 1.11 1.11 1.11 1.11 1.11 1.12 1.12 1.1250 1.66 1.38 1.25 1.19 1.15 1.13 1.12 1.12 1.12 1.12 1.12 1.12 1.12 1.12 1.12 1.1355 1.63 1.39 1.27 1.20 1.16 1.14 1.13 1.12 1.12 1.12 1.12 1.12 1.13 1.13 1.13 1.1360 1.61 1.40 1.28 1.22 1.17 1.15 1.14 1.13 1.13 1.13 1.13 1.13 1.13 1.13 1.13 1.1365 1.61 1.40 1.29 1.23 1.19 1.16 1.15 1.14 1.13 1.13 1.13 1.13 1.13 1.13 1.14 1.1470 1.60 1.40 1.29 1.23 1.19 1.17 1.15 1.14 1.14 1.14 1.14 1.14 1.14 1.14 1.14 1.1475 1.59 1.39 1.29 1.24 1.20 1.17 1.16 1.15 1.15 1.14 1.14 1.14 1.14 1.14 1.14 1.14

68
Table B-8: Actuator duty cycle obtained using the non-linear model and wind3 as wind input file.
Derivative GainProportional
Gain 1 5 10 15 20 25 30 35 40 45 50 55 60 65 70 75
Integral Gain=1 1 0.38 0.49 0.74 0.92 1.03 1.11 1.18 1.23 1.26 1.28 1.31 1.32 1.33 1.34 1.34 1.355 0.61 0.63 0.80 0.95 1.05 1.12 1.17 1.21 1.24 1.27 1.29 1.31 1.33 1.34 1.35 1.36
10 0.92 0.86 0.93 1.02 1.09 1.14 1.19 1.22 1.25 1.28 1.30 1.32 1.34 1.35 1.36 1.3815 1.12 1.01 1.01 1.06 1.12 1.17 1.21 1.24 1.27 1.29 1.32 1.33 1.35 1.37 1.38 1.3920 1.27 1.12 1.09 1.11 1.14 1.18 1.21 1.24 1.27 1.30 1.32 1.34 1.35 1.37 1.38 1.3925 1.37 1.21 1.16 1.16 1.18 1.20 1.22 1.25 1.27 1.29 1.31 1.33 1.35 1.36 1.38 1.3930 1.44 1.28 1.22 1.20 1.21 1.23 1.24 1.26 1.28 1.29 1.31 1.32 1.34 1.35 1.37 1.3835 1.49 1.34 1.27 1.24 1.24 1.25 1.26 1.27 1.29 1.30 1.31 1.32 1.33 1.35 1.36 1.3740 1.54 1.38 1.31 1.28 1.27 1.27 1.28 1.29 1.30 1.31 1.32 1.33 1.34 1.35 1.36 1.3645 1.57 1.42 1.34 1.31 1.29 1.29 1.29 1.30 1.31 1.32 1.33 1.33 1.34 1.35 1.36 1.3750 1.61 1.46 1.37 1.33 1.32 1.31 1.31 1.31 1.32 1.33 1.33 1.34 1.35 1.35 1.36 1.3755 1.64 1.49 1.40 1.36 1.34 1.33 1.32 1.33 1.33 1.33 1.34 1.35 1.35 1.36 1.37 1.3760 1.67 1.51 1.42 1.38 1.35 1.34 1.34 1.34 1.34 1.34 1.35 1.35 1.36 1.36 1.37 1.3765 1.69 1.53 1.44 1.40 1.37 1.36 1.35 1.35 1.35 1.35 1.35 1.36 1.36 1.37 1.37 1.3870 1.71 1.55 1.46 1.41 1.39 1.37 1.36 1.36 1.36 1.36 1.36 1.36 1.37 1.37 1.38 1.3875 1.72 1.57 1.48 1.43 1.40 1.38 1.37 1.37 1.36 1.36 1.37 1.37 1.37 1.37 1.38 1.38
Integral Gain=5 1 2.36 1.35 0.92 0.83 0.95 1.05 1.16 1.21 1.29 1.29 1.33 1.34 1.35 1.30 1.29 1.325 1.17 0.79 0.76 0.87 0.98 1.08 1.17 1.23 1.27 1.30 1.32 1.34 1.35 1.36 1.36 1.37
10 1.13 0.94 0.93 0.98 1.04 1.11 1.17 1.22 1.26 1.29 1.31 1.33 1.35 1.36 1.37 1.3815 1.28 1.08 1.04 1.06 1.10 1.14 1.18 1.21 1.25 1.27 1.30 1.32 1.34 1.35 1.37 1.3820 1.40 1.19 1.12 1.11 1.13 1.17 1.20 1.22 1.25 1.27 1.29 1.31 1.33 1.34 1.36 1.3725 1.47 1.26 1.18 1.16 1.17 1.19 1.22 1.24 1.26 1.28 1.29 1.31 1.32 1.34 1.35 1.3630 1.50 1.32 1.23 1.20 1.20 1.22 1.23 1.25 1.27 1.29 1.30 1.31 1.33 1.34 1.35 1.3635 1.52 1.36 1.27 1.24 1.23 1.24 1.25 1.27 1.28 1.29 1.31 1.32 1.33 1.34 1.35 1.3640 1.55 1.39 1.30 1.27 1.26 1.26 1.27 1.28 1.29 1.30 1.31 1.32 1.33 1.34 1.35 1.3645 1.57 1.41 1.33 1.30 1.28 1.28 1.29 1.29 1.30 1.31 1.32 1.33 1.34 1.35 1.35 1.3650 1.59 1.44 1.36 1.32 1.31 1.30 1.30 1.31 1.31 1.32 1.33 1.33 1.34 1.35 1.36 1.3655 1.62 1.46 1.38 1.35 1.33 1.32 1.31 1.32 1.32 1.33 1.33 1.34 1.35 1.35 1.36 1.3760 1.65 1.49 1.41 1.37 1.34 1.33 1.33 1.33 1.33 1.34 1.34 1.35 1.35 1.36 1.36 1.3765 1.67 1.51 1.43 1.38 1.36 1.35 1.34 1.34 1.34 1.34 1.35 1.35 1.36 1.36 1.37 1.3770 1.69 1.53 1.45 1.40 1.38 1.36 1.35 1.35 1.35 1.35 1.35 1.36 1.36 1.37 1.37 1.3875 1.71 1.55 1.47 1.42 1.39 1.37 1.36 1.36 1.36 1.36 1.36 1.36 1.37 1.37 1.37 1.38
Integral Gain=10 1 0.96 2.48 2.41 1.88 1.27 1.32 1.12 1.08 1.26 1.19 1.22 1.29 1.39 1.37 1.36 1.315 2.91 1.37 1.12 1.00 0.95 1.00 1.04 1.09 1.14 1.17 1.21 1.29 1.34 1.36 1.37 1.39
10 1.51 1.15 1.03 1.01 1.03 1.06 1.09 1.13 1.18 1.22 1.26 1.30 1.33 1.35 1.37 1.3815 1.49 1.20 1.10 1.08 1.10 1.13 1.16 1.20 1.23 1.26 1.28 1.30 1.32 1.33 1.35 1.3720 1.58 1.28 1.17 1.14 1.14 1.16 1.19 1.21 1.24 1.26 1.28 1.30 1.32 1.33 1.34 1.3525 1.64 1.35 1.23 1.19 1.19 1.19 1.21 1.23 1.25 1.27 1.29 1.30 1.32 1.33 1.34 1.3530 1.65 1.39 1.27 1.23 1.22 1.22 1.23 1.24 1.26 1.28 1.29 1.31 1.32 1.33 1.34 1.3535 1.64 1.42 1.31 1.26 1.24 1.24 1.24 1.25 1.27 1.29 1.30 1.31 1.33 1.34 1.35 1.3640 1.63 1.43 1.33 1.29 1.27 1.26 1.26 1.27 1.28 1.29 1.31 1.32 1.33 1.34 1.35 1.3645 1.62 1.45 1.36 1.31 1.29 1.28 1.27 1.28 1.29 1.30 1.31 1.32 1.33 1.34 1.35 1.3650 1.63 1.46 1.37 1.33 1.31 1.29 1.29 1.29 1.30 1.31 1.32 1.33 1.34 1.35 1.35 1.3655 1.64 1.48 1.39 1.35 1.32 1.31 1.30 1.30 1.31 1.32 1.32 1.33 1.34 1.35 1.36 1.3660 1.66 1.49 1.40 1.36 1.34 1.32 1.32 1.32 1.32 1.32 1.33 1.34 1.34 1.35 1.36 1.3765 1.67 1.50 1.42 1.37 1.35 1.34 1.33 1.33 1.33 1.33 1.34 1.34 1.35 1.36 1.36 1.3770 1.67 1.51 1.43 1.38 1.36 1.35 1.34 1.34 1.34 1.34 1.34 1.35 1.35 1.36 1.36 1.3775 1.68 1.52 1.44 1.40 1.37 1.36 1.35 1.35 1.35 1.35 1.35 1.35 1.36 1.36 1.37 1.37

69
Table B-8: Actuator duty cycle obtained using the non-linear model and wind3 as wind input file.
Derivative GainProportional
Gain 1 5 10 15 20 25 30 35 40 45 50 55 60 65 70 75
Integral Gain=15 1 1.11 1.63 2.68 2.55 2.36 2.07 1.66 1.39 1.49 1.37 1.24 1.20 1.40 1.33 1.28 1.275 1.58 3.13 1.51 1.27 1.26 1.17 1.09 1.11 1.13 1.16 1.16 1.19 1.26 1.28 1.26 1.27
10 3.93 1.46 1.18 1.12 1.11 1.12 1.11 1.12 1.14 1.16 1.19 1.22 1.25 1.28 1.30 1.3215 1.98 1.38 1.19 1.14 1.13 1.14 1.16 1.18 1.20 1.21 1.23 1.25 1.28 1.31 1.33 1.3520 1.89 1.40 1.23 1.18 1.17 1.17 1.19 1.21 1.22 1.24 1.26 1.28 1.31 1.32 1.34 1.3525 1.75 1.45 1.28 1.22 1.21 1.20 1.21 1.22 1.24 1.25 1.27 1.29 1.31 1.33 1.34 1.3530 1.73 1.49 1.32 1.26 1.24 1.23 1.23 1.24 1.25 1.27 1.28 1.30 1.32 1.33 1.34 1.3535 1.81 1.51 1.35 1.29 1.26 1.25 1.25 1.26 1.26 1.27 1.29 1.30 1.32 1.33 1.34 1.3540 1.78 1.52 1.37 1.31 1.29 1.27 1.27 1.27 1.27 1.28 1.29 1.31 1.32 1.33 1.34 1.3545 1.76 1.52 1.39 1.33 1.30 1.29 1.28 1.28 1.28 1.29 1.30 1.31 1.32 1.33 1.34 1.3550 1.75 1.51 1.40 1.35 1.32 1.30 1.30 1.29 1.29 1.30 1.31 1.32 1.33 1.34 1.35 1.3655 1.74 1.51 1.41 1.36 1.33 1.32 1.31 1.30 1.30 1.31 1.31 1.32 1.33 1.34 1.35 1.3660 1.72 1.51 1.42 1.37 1.35 1.33 1.32 1.31 1.31 1.31 1.32 1.33 1.34 1.34 1.35 1.3665 1.72 1.52 1.43 1.38 1.36 1.34 1.33 1.32 1.32 1.32 1.33 1.33 1.34 1.35 1.35 1.3670 1.71 1.53 1.44 1.39 1.37 1.35 1.34 1.33 1.33 1.33 1.33 1.34 1.34 1.35 1.36 1.3675 1.70 1.54 1.45 1.40 1.38 1.36 1.35 1.34 1.34 1.34 1.34 1.34 1.35 1.35 1.36 1.37
Integral Gain=20 1 1.20 1.07 1.51 2.87 2.33 2.43 2.25 2.09 1.83 1.43 1.49 1.59 1.46 1.42 1.34 1.295 1.03 1.55 2.95 1.63 1.42 1.32 1.41 1.29 1.19 1.18 1.21 1.21 1.26 1.25 1.22 1.24
10 1.49 2.62 1.46 1.23 1.18 1.18 1.20 1.21 1.17 1.17 1.18 1.20 1.21 1.23 1.25 1.2715 3.24 1.66 1.33 1.21 1.17 1.17 1.18 1.20 1.21 1.22 1.22 1.23 1.24 1.25 1.27 1.2920 2.14 1.64 1.33 1.24 1.21 1.20 1.20 1.21 1.22 1.24 1.25 1.27 1.28 1.29 1.30 1.3225 2.25 1.56 1.35 1.26 1.23 1.22 1.22 1.22 1.24 1.25 1.27 1.28 1.29 1.30 1.31 1.3330 2.11 1.57 1.38 1.29 1.26 1.25 1.24 1.24 1.25 1.26 1.28 1.29 1.30 1.31 1.32 1.3435 2.00 1.60 1.42 1.32 1.29 1.27 1.26 1.26 1.26 1.27 1.28 1.29 1.30 1.32 1.33 1.3440 1.84 1.61 1.44 1.35 1.31 1.29 1.28 1.28 1.28 1.28 1.29 1.30 1.31 1.32 1.33 1.3545 1.85 1.60 1.45 1.36 1.32 1.30 1.29 1.29 1.29 1.29 1.30 1.30 1.31 1.32 1.33 1.3550 1.95 1.60 1.45 1.37 1.34 1.32 1.31 1.30 1.30 1.30 1.30 1.31 1.32 1.32 1.34 1.3555 1.86 1.59 1.45 1.38 1.35 1.33 1.32 1.31 1.31 1.31 1.31 1.31 1.32 1.33 1.34 1.3560 1.86 1.58 1.45 1.39 1.36 1.34 1.33 1.32 1.32 1.32 1.32 1.32 1.32 1.33 1.34 1.3565 1.86 1.58 1.45 1.40 1.37 1.35 1.34 1.33 1.33 1.32 1.32 1.33 1.33 1.34 1.34 1.3570 1.86 1.57 1.45 1.41 1.38 1.36 1.35 1.34 1.33 1.33 1.33 1.33 1.33 1.34 1.35 1.3575 1.87 1.57 1.46 1.41 1.38 1.37 1.35 1.34 1.34 1.34 1.33 1.34 1.34 1.34 1.35 1.36

70
Table B-9: Actuator duty cycle obtained using the non-linear model and wind4 as wind input file.
Derivative GainProportional
Gain 1 5 10 15 20 25 30 35 40 45 50 55 60 65 70 75
Integral Gain=1 1 0.76 0.71 0.84 0.98 1.07 1.12 1.17 1.22 1.25 1.28 1.30 1.32 1.34 1.35 1.37 1.385 0.81 0.80 0.91 1.02 1.09 1.15 1.19 1.23 1.26 1.28 1.30 1.32 1.34 1.35 1.37 1.38
10 1.08 0.98 1.02 1.08 1.14 1.19 1.22 1.25 1.28 1.30 1.32 1.34 1.35 1.36 1.37 1.3815 1.25 1.12 1.11 1.15 1.19 1.22 1.25 1.28 1.30 1.32 1.33 1.35 1.36 1.37 1.38 1.3920 1.37 1.22 1.19 1.20 1.23 1.25 1.28 1.30 1.32 1.33 1.35 1.36 1.37 1.38 1.39 1.4025 1.46 1.30 1.26 1.26 1.27 1.29 1.30 1.32 1.33 1.35 1.36 1.37 1.38 1.39 1.40 1.4230 1.53 1.37 1.31 1.30 1.30 1.31 1.33 1.34 1.35 1.36 1.37 1.38 1.39 1.40 1.42 1.4235 1.59 1.42 1.35 1.33 1.33 1.34 1.35 1.36 1.36 1.37 1.38 1.39 1.40 1.40 1.41 1.4240 1.65 1.47 1.39 1.36 1.36 1.36 1.36 1.37 1.38 1.38 1.39 1.40 1.40 1.41 1.42 1.4245 1.69 1.51 1.42 1.39 1.38 1.38 1.38 1.38 1.39 1.40 1.40 1.41 1.41 1.42 1.42 1.4350 1.72 1.54 1.45 1.42 1.40 1.40 1.40 1.40 1.40 1.41 1.41 1.41 1.42 1.42 1.43 1.4455 1.75 1.57 1.48 1.44 1.42 1.41 1.41 1.41 1.41 1.41 1.42 1.42 1.43 1.44 1.44 1.4560 1.76 1.59 1.50 1.46 1.44 1.42 1.42 1.42 1.42 1.42 1.42 1.43 1.43 1.43 1.44 1.4565 1.77 1.61 1.52 1.48 1.45 1.44 1.43 1.43 1.43 1.43 1.43 1.43 1.44 1.44 1.44 1.4470 1.77 1.63 1.54 1.49 1.47 1.45 1.44 1.44 1.44 1.44 1.44 1.44 1.44 1.44 1.45 1.4575 1.77 1.64 1.55 1.51 1.48 1.46 1.45 1.45 1.44 1.44 1.45 1.45 1.45 1.45 1.45 1.45
Integral Gain=5 1 2.60 1.35 1.04 1.10 1.18 1.23 1.28 1.30 1.30 1.32 1.37 1.37 1.38 1.39 1.40 1.405 1.25 0.94 1.03 1.08 1.15 1.21 1.25 1.28 1.31 1.33 1.35 1.36 1.37 1.38 1.39 1.39
10 1.35 1.10 1.08 1.13 1.18 1.22 1.26 1.29 1.31 1.33 1.35 1.36 1.37 1.38 1.39 1.4015 1.42 1.21 1.17 1.18 1.21 1.25 1.27 1.30 1.32 1.34 1.35 1.37 1.38 1.39 1.40 1.4020 1.48 1.29 1.24 1.24 1.25 1.27 1.30 1.31 1.33 1.35 1.36 1.37 1.38 1.39 1.40 1.4125 1.54 1.36 1.30 1.28 1.29 1.30 1.32 1.33 1.35 1.36 1.37 1.38 1.39 1.40 1.42 1.4330 1.59 1.41 1.34 1.32 1.32 1.33 1.34 1.35 1.36 1.37 1.38 1.39 1.40 1.41 1.42 1.4335 1.64 1.45 1.38 1.36 1.35 1.35 1.36 1.37 1.37 1.38 1.39 1.40 1.40 1.41 1.42 1.4240 1.69 1.49 1.41 1.38 1.37 1.37 1.38 1.38 1.39 1.39 1.40 1.40 1.41 1.42 1.42 1.4345 1.73 1.53 1.44 1.41 1.39 1.39 1.39 1.39 1.40 1.40 1.41 1.41 1.42 1.42 1.43 1.4350 1.76 1.56 1.47 1.43 1.41 1.41 1.40 1.41 1.41 1.41 1.42 1.42 1.43 1.43 1.44 1.4555 1.78 1.59 1.50 1.45 1.43 1.42 1.42 1.42 1.42 1.42 1.42 1.43 1.43 1.44 1.45 1.4560 1.79 1.61 1.52 1.47 1.45 1.43 1.43 1.43 1.43 1.43 1.43 1.43 1.44 1.44 1.44 1.4665 1.80 1.63 1.54 1.49 1.46 1.45 1.44 1.44 1.44 1.44 1.44 1.44 1.44 1.44 1.45 1.4570 1.80 1.64 1.55 1.50 1.48 1.46 1.45 1.45 1.44 1.44 1.44 1.45 1.45 1.45 1.45 1.4575 1.80 1.65 1.57 1.52 1.49 1.47 1.46 1.45 1.45 1.45 1.45 1.45 1.45 1.46 1.46 1.46
Integral Gain=10 1 1.87 1.98 2.04 1.50 1.22 1.19 1.26 1.29 1.31 1.33 1.37 1.36 1.37 1.39 1.42 1.445 2.23 1.36 1.11 1.09 1.17 1.18 1.21 1.26 1.29 1.32 1.34 1.36 1.37 1.39 1.40 1.41
10 1.80 1.33 1.15 1.13 1.17 1.22 1.25 1.28 1.31 1.33 1.35 1.36 1.38 1.39 1.40 1.4115 1.64 1.35 1.23 1.21 1.22 1.25 1.28 1.30 1.32 1.34 1.36 1.37 1.38 1.40 1.40 1.4120 1.63 1.39 1.29 1.27 1.27 1.29 1.31 1.32 1.34 1.35 1.37 1.38 1.39 1.40 1.41 1.4325 1.64 1.42 1.34 1.32 1.31 1.32 1.33 1.34 1.35 1.36 1.38 1.39 1.40 1.40 1.42 1.4330 1.67 1.46 1.38 1.35 1.34 1.35 1.35 1.36 1.37 1.38 1.38 1.39 1.40 1.41 1.42 1.4335 1.71 1.49 1.41 1.38 1.37 1.37 1.37 1.37 1.38 1.39 1.39 1.40 1.41 1.41 1.42 1.4340 1.75 1.53 1.44 1.40 1.39 1.39 1.39 1.39 1.39 1.40 1.40 1.41 1.41 1.42 1.42 1.4345 1.78 1.56 1.46 1.42 1.41 1.40 1.40 1.40 1.40 1.41 1.41 1.42 1.42 1.43 1.43 1.4350 1.80 1.59 1.49 1.45 1.42 1.42 1.41 1.41 1.41 1.42 1.42 1.43 1.43 1.44 1.45 1.4555 1.82 1.61 1.51 1.46 1.44 1.43 1.43 1.42 1.42 1.43 1.43 1.43 1.43 1.44 1.45 1.4660 1.83 1.64 1.53 1.48 1.46 1.44 1.44 1.43 1.43 1.43 1.43 1.44 1.44 1.44 1.44 1.4565 1.83 1.65 1.55 1.50 1.47 1.45 1.45 1.44 1.44 1.44 1.44 1.44 1.44 1.45 1.45 1.4570 1.83 1.66 1.57 1.51 1.48 1.47 1.46 1.45 1.45 1.45 1.45 1.45 1.45 1.45 1.45 1.4575 1.83 1.67 1.58 1.53 1.50 1.48 1.47 1.46 1.46 1.45 1.45 1.45 1.46 1.47 1.47 1.47

71
Table B-9: Actuator duty cycle obtained using the non-linear model and wind4 as wind input file.
Derivative GainProportional
Gain 1 5 10 15 20 25 30 35 40 45 50 55 60 65 70 75
Integral Gain=15 1 0.82 1.11 4.12 1.64 1.38 1.34 1.32 1.29 1.28 1.29 1.36 1.39 1.38 1.39 1.40 1.425 3.42 1.90 1.49 1.31 1.15 1.18 1.23 1.27 1.26 1.28 1.31 1.34 1.35 1.37 1.38 1.40
10 2.36 1.60 1.35 1.22 1.18 1.20 1.24 1.28 1.30 1.31 1.33 1.34 1.36 1.38 1.39 1.4015 1.85 1.49 1.34 1.27 1.24 1.24 1.27 1.29 1.32 1.33 1.35 1.36 1.37 1.38 1.39 1.4020 1.78 1.48 1.36 1.32 1.30 1.30 1.31 1.32 1.33 1.35 1.36 1.37 1.38 1.39 1.40 1.4225 1.75 1.48 1.39 1.35 1.34 1.33 1.34 1.34 1.35 1.36 1.37 1.38 1.39 1.40 1.42 1.4330 1.75 1.50 1.41 1.38 1.36 1.36 1.36 1.36 1.37 1.38 1.39 1.39 1.40 1.41 1.41 1.4235 1.78 1.53 1.44 1.40 1.39 1.38 1.38 1.38 1.39 1.39 1.40 1.40 1.41 1.41 1.42 1.4340 1.81 1.56 1.46 1.42 1.40 1.40 1.40 1.40 1.40 1.40 1.41 1.41 1.42 1.42 1.42 1.4345 1.83 1.59 1.48 1.44 1.42 1.41 1.41 1.41 1.41 1.41 1.42 1.42 1.42 1.43 1.44 1.4550 1.85 1.61 1.51 1.46 1.44 1.43 1.42 1.42 1.42 1.42 1.42 1.43 1.43 1.44 1.45 1.4555 1.86 1.64 1.53 1.48 1.45 1.44 1.43 1.43 1.43 1.43 1.43 1.43 1.44 1.44 1.45 1.4660 1.86 1.66 1.55 1.49 1.47 1.45 1.44 1.44 1.44 1.44 1.44 1.44 1.44 1.44 1.45 1.4565 1.86 1.67 1.56 1.51 1.48 1.46 1.45 1.45 1.45 1.45 1.45 1.45 1.45 1.45 1.45 1.4570 1.86 1.68 1.58 1.52 1.49 1.47 1.46 1.46 1.45 1.45 1.45 1.45 1.45 1.46 1.46 1.4675 1.85 1.69 1.59 1.54 1.50 1.48 1.47 1.46 1.46 1.46 1.46 1.46 1.46 1.47 1.47 1.47
Integral Gain=20 1 0.93 1.21 3.19 2.54 1.48 1.23 1.25 1.33 1.31 1.33 1.32 1.33 1.31 1.35 1.42 1.455 2.26 2.36 1.69 1.65 1.49 1.29 1.19 1.23 1.28 1.32 1.32 1.31 1.31 1.34 1.37 1.39
10 2.32 1.91 1.46 1.38 1.30 1.24 1.23 1.25 1.28 1.31 1.34 1.35 1.34 1.35 1.36 1.3815 2.08 1.62 1.43 1.36 1.31 1.28 1.27 1.28 1.30 1.32 1.34 1.36 1.37 1.38 1.38 1.4020 1.93 1.56 1.42 1.37 1.34 1.32 1.31 1.32 1.33 1.34 1.36 1.37 1.38 1.39 1.41 1.4125 1.88 1.54 1.43 1.39 1.37 1.35 1.35 1.35 1.35 1.36 1.37 1.38 1.39 1.40 1.41 1.4230 1.84 1.55 1.44 1.40 1.39 1.38 1.37 1.37 1.38 1.38 1.39 1.39 1.40 1.41 1.41 1.4235 1.85 1.57 1.46 1.42 1.40 1.40 1.39 1.39 1.39 1.39 1.40 1.40 1.41 1.41 1.42 1.4240 1.87 1.59 1.48 1.44 1.42 1.41 1.41 1.40 1.40 1.41 1.41 1.41 1.42 1.42 1.42 1.4345 1.88 1.62 1.51 1.46 1.43 1.42 1.42 1.42 1.42 1.42 1.42 1.42 1.43 1.44 1.44 1.4550 1.89 1.64 1.53 1.47 1.45 1.44 1.43 1.43 1.43 1.43 1.43 1.43 1.43 1.44 1.45 1.4555 1.90 1.66 1.54 1.49 1.46 1.45 1.44 1.44 1.43 1.43 1.44 1.44 1.44 1.44 1.44 1.4560 1.89 1.68 1.56 1.51 1.48 1.46 1.45 1.45 1.44 1.44 1.44 1.44 1.44 1.45 1.45 1.4565 1.89 1.69 1.58 1.52 1.49 1.47 1.46 1.45 1.45 1.45 1.45 1.45 1.45 1.45 1.45 1.4570 1.89 1.70 1.59 1.53 1.50 1.48 1.47 1.46 1.46 1.45 1.45 1.46 1.46 1.46 1.47 1.4775 1.88 1.71 1.60 1.54 1.51 1.49 1.48 1.47 1.46 1.46 1.46 1.46 1.46 1.47 1.47 1.48

72
Table B-10: Actuator duty cycle obtained using the non-linear model and wind5 as wind input file.
Derivative GainProportional
Gain 1 5 10 15 20 25 30 35 40 45 50 55 60 65 70 75
Integral Gain=1 1 0.37 0.40 0.61 0.73 0.81 0.85 0.88 0.90 0.92 0.94 0.95 0.96 0.97 0.98 0.98 0.995 0.53 0.54 0.65 0.74 0.80 0.85 0.88 0.91 0.93 0.94 0.96 0.97 0.98 0.99 1.00 1.00
10 0.72 0.68 0.72 0.78 0.83 0.86 0.89 0.92 0.94 0.95 0.97 0.98 0.99 1.00 1.00 1.0115 0.89 0.78 0.79 0.82 0.85 0.88 0.91 0.93 0.95 0.96 0.97 0.98 0.99 1.00 1.01 1.0120 1.04 0.88 0.85 0.86 0.88 0.90 0.92 0.94 0.95 0.97 0.98 0.99 1.00 1.00 1.01 1.0225 1.14 0.96 0.90 0.90 0.91 0.92 0.94 0.95 0.96 0.98 0.99 0.99 1.00 1.01 1.02 1.0230 1.21 1.02 0.95 0.93 0.93 0.94 0.95 0.96 0.97 0.98 0.99 1.00 1.01 1.01 1.02 1.0235 1.26 1.07 0.99 0.96 0.96 0.96 0.97 0.98 0.98 0.99 1.00 1.01 1.01 1.02 1.02 1.0340 1.29 1.10 1.02 0.99 0.98 0.98 0.98 0.99 0.99 1.00 1.01 1.01 1.02 1.02 1.03 1.0345 1.30 1.13 1.05 1.01 1.00 0.99 0.99 1.00 1.00 1.01 1.01 1.02 1.02 1.03 1.03 1.0350 1.32 1.15 1.07 1.03 1.01 1.01 1.01 1.01 1.01 1.01 1.02 1.02 1.03 1.03 1.03 1.0455 1.32 1.17 1.09 1.05 1.03 1.02 1.02 1.02 1.02 1.02 1.03 1.03 1.03 1.04 1.04 1.0460 1.33 1.18 1.10 1.06 1.04 1.03 1.03 1.03 1.03 1.03 1.03 1.03 1.04 1.04 1.04 1.0565 1.33 1.19 1.12 1.08 1.06 1.04 1.04 1.03 1.03 1.04 1.04 1.04 1.04 1.04 1.05 1.0570 1.34 1.20 1.13 1.09 1.07 1.05 1.05 1.04 1.04 1.04 1.04 1.04 1.05 1.05 1.05 1.0575 1.34 1.21 1.14 1.10 1.08 1.06 1.05 1.05 1.05 1.05 1.05 1.05 1.05 1.05 1.05 1.06
Integral Gain=5 1 1.66 1.14 0.79 0.95 0.80 0.82 0.85 0.88 0.91 0.94 0.96 0.99 1.00 1.01 1.02 1.025 0.82 0.72 0.71 0.76 0.80 0.83 0.87 0.90 0.92 0.94 0.96 0.98 0.99 1.00 1.01 1.02
10 0.87 0.75 0.76 0.79 0.83 0.86 0.89 0.91 0.94 0.95 0.97 0.98 0.99 1.00 1.01 1.0215 1.00 0.83 0.81 0.83 0.86 0.89 0.91 0.93 0.95 0.96 0.98 0.99 1.00 1.01 1.01 1.0220 1.12 0.92 0.87 0.87 0.89 0.91 0.93 0.94 0.96 0.97 0.98 0.99 1.00 1.01 1.02 1.0225 1.22 0.99 0.92 0.91 0.92 0.93 0.94 0.96 0.97 0.98 0.99 1.00 1.01 1.01 1.02 1.0330 1.28 1.05 0.97 0.94 0.94 0.95 0.96 0.97 0.98 0.99 1.00 1.01 1.01 1.02 1.03 1.0335 1.32 1.10 1.00 0.97 0.97 0.97 0.97 0.98 0.99 1.00 1.00 1.01 1.02 1.02 1.03 1.0340 1.34 1.13 1.04 1.00 0.99 0.99 0.99 0.99 1.00 1.01 1.01 1.02 1.02 1.03 1.03 1.0445 1.35 1.16 1.06 1.02 1.01 1.00 1.00 1.00 1.01 1.01 1.02 1.02 1.03 1.03 1.04 1.0450 1.36 1.18 1.08 1.04 1.02 1.02 1.01 1.01 1.02 1.02 1.02 1.03 1.03 1.04 1.04 1.0455 1.36 1.19 1.10 1.06 1.04 1.03 1.02 1.02 1.02 1.03 1.03 1.03 1.04 1.04 1.04 1.0560 1.36 1.20 1.12 1.07 1.05 1.04 1.03 1.03 1.03 1.03 1.04 1.04 1.04 1.04 1.05 1.0565 1.36 1.21 1.13 1.09 1.06 1.05 1.04 1.04 1.04 1.04 1.04 1.04 1.05 1.05 1.05 1.0570 1.36 1.22 1.14 1.10 1.07 1.06 1.05 1.05 1.05 1.05 1.05 1.05 1.05 1.05 1.05 1.0675 1.36 1.22 1.15 1.11 1.08 1.07 1.06 1.06 1.05 1.05 1.05 1.05 1.05 1.06 1.06 1.06
Integral Gain=10 1 1.86 1.97 1.13 1.19 1.09 0.91 0.96 1.09 1.01 0.94 0.93 0.96 0.98 0.99 0.99 1.005 1.21 0.79 0.80 0.86 0.87 0.89 0.91 0.92 0.93 0.93 0.95 0.96 0.98 0.99 1.00 1.00
10 1.12 0.82 0.80 0.83 0.86 0.89 0.91 0.92 0.94 0.95 0.96 0.97 0.98 0.99 1.00 1.0115 1.15 0.89 0.84 0.85 0.88 0.90 0.92 0.93 0.95 0.96 0.97 0.98 0.99 1.00 1.01 1.0220 1.25 0.97 0.89 0.89 0.90 0.92 0.93 0.95 0.96 0.97 0.98 0.99 1.00 1.01 1.02 1.0225 1.33 1.04 0.94 0.92 0.93 0.94 0.95 0.96 0.97 0.98 0.99 1.00 1.01 1.01 1.02 1.0330 1.38 1.09 0.99 0.96 0.95 0.96 0.96 0.97 0.98 0.99 1.00 1.01 1.01 1.02 1.03 1.0335 1.40 1.13 1.02 0.98 0.97 0.97 0.98 0.98 0.99 1.00 1.01 1.01 1.02 1.02 1.03 1.0340 1.40 1.17 1.05 1.01 0.99 0.99 0.99 1.00 1.00 1.01 1.01 1.02 1.02 1.03 1.03 1.0445 1.40 1.19 1.08 1.03 1.01 1.01 1.00 1.01 1.01 1.01 1.02 1.02 1.03 1.03 1.04 1.0450 1.40 1.20 1.10 1.05 1.03 1.02 1.02 1.02 1.02 1.02 1.03 1.03 1.03 1.04 1.04 1.0455 1.40 1.21 1.12 1.07 1.05 1.03 1.03 1.03 1.03 1.03 1.03 1.03 1.04 1.04 1.04 1.0560 1.40 1.22 1.13 1.08 1.06 1.05 1.04 1.04 1.03 1.04 1.04 1.04 1.04 1.04 1.05 1.0565 1.40 1.23 1.14 1.10 1.07 1.06 1.05 1.04 1.04 1.04 1.04 1.04 1.05 1.05 1.05 1.0570 1.39 1.23 1.15 1.11 1.08 1.07 1.06 1.05 1.05 1.05 1.05 1.05 1.05 1.05 1.06 1.0675 1.39 1.24 1.16 1.11 1.09 1.07 1.06 1.06 1.06 1.05 1.05 1.05 1.06 1.06 1.06 1.06

73
Table B-10: Actuator duty cycle obtained using the non-linear model and wind5 as wind input file.
Derivative GainProportional
Gain 1 5 10 15 20 25 30 35 40 45 50 55 60 65 70 75
Integral Gain=15 1 1.44 2.25 1.87 0.91 1.06 1.09 1.23 1.00 0.97 0.97 1.04 1.12 1.10 1.02 0.99 0.985 2.68 1.03 0.80 0.81 0.88 0.94 0.96 0.96 0.96 0.97 0.98 0.99 0.99 0.99 0.99 1.00
10 1.47 0.94 0.82 0.83 0.87 0.90 0.93 0.95 0.96 0.97 0.97 0.98 0.99 0.99 1.00 1.0115 1.35 0.98 0.87 0.87 0.89 0.91 0.93 0.95 0.96 0.97 0.98 0.99 1.00 1.00 1.01 1.0220 1.40 1.03 0.92 0.90 0.91 0.92 0.94 0.96 0.97 0.98 0.99 0.99 1.00 1.01 1.02 1.0225 1.46 1.09 0.97 0.94 0.93 0.94 0.95 0.97 0.98 0.99 0.99 1.00 1.01 1.01 1.02 1.0330 1.48 1.14 1.01 0.97 0.96 0.96 0.97 0.98 0.99 0.99 1.00 1.01 1.01 1.02 1.03 1.0335 1.48 1.17 1.04 1.00 0.98 0.98 0.98 0.99 0.99 1.00 1.01 1.01 1.02 1.02 1.03 1.0340 1.47 1.20 1.07 1.02 1.00 1.00 1.00 1.00 1.00 1.01 1.01 1.02 1.02 1.03 1.03 1.0445 1.46 1.22 1.10 1.04 1.02 1.01 1.01 1.01 1.01 1.02 1.02 1.02 1.03 1.03 1.04 1.0450 1.45 1.23 1.12 1.06 1.04 1.03 1.02 1.02 1.02 1.02 1.03 1.03 1.03 1.04 1.04 1.0455 1.44 1.24 1.13 1.08 1.05 1.04 1.03 1.03 1.03 1.03 1.03 1.04 1.04 1.04 1.04 1.0560 1.43 1.24 1.14 1.09 1.07 1.05 1.04 1.04 1.04 1.04 1.04 1.04 1.04 1.05 1.05 1.0565 1.43 1.24 1.15 1.10 1.08 1.06 1.05 1.05 1.04 1.04 1.04 1.05 1.05 1.05 1.05 1.0670 1.42 1.25 1.16 1.11 1.09 1.07 1.06 1.05 1.05 1.05 1.05 1.05 1.05 1.05 1.06 1.0675 1.42 1.25 1.17 1.12 1.10 1.08 1.07 1.06 1.06 1.06 1.06 1.06 1.06 1.06 1.06 1.06
Integral Gain=20 1 1.70 2.27 2.94 1.78 1.03 1.11 1.10 1.03 1.28 1.14 1.00 1.01 1.01 1.01 1.07 1.135 0.94 1.75 0.97 0.83 0.83 0.88 0.93 0.98 1.01 1.01 1.00 1.00 1.00 1.01 1.02 1.03
10 2.03 1.16 0.86 0.84 0.86 0.89 0.93 0.95 0.97 0.98 0.99 1.00 1.00 1.01 1.01 1.0215 1.62 1.09 0.91 0.88 0.89 0.91 0.93 0.95 0.97 0.98 0.99 1.00 1.00 1.01 1.01 1.0220 1.60 1.11 0.95 0.92 0.91 0.93 0.94 0.96 0.97 0.98 0.99 1.00 1.01 1.01 1.02 1.0225 1.61 1.15 1.00 0.95 0.94 0.95 0.96 0.97 0.98 0.99 1.00 1.01 1.01 1.02 1.02 1.0330 1.60 1.19 1.03 0.98 0.97 0.97 0.97 0.98 0.99 1.00 1.00 1.01 1.02 1.02 1.03 1.0335 1.58 1.22 1.07 1.01 0.99 0.98 0.99 0.99 1.00 1.00 1.01 1.02 1.02 1.03 1.03 1.0340 1.54 1.24 1.09 1.04 1.01 1.00 1.00 1.00 1.01 1.01 1.02 1.02 1.03 1.03 1.03 1.0445 1.51 1.25 1.11 1.06 1.03 1.02 1.01 1.01 1.02 1.02 1.02 1.03 1.03 1.03 1.04 1.0450 1.49 1.25 1.13 1.07 1.05 1.03 1.02 1.02 1.02 1.03 1.03 1.03 1.04 1.04 1.04 1.0455 1.48 1.26 1.15 1.09 1.06 1.04 1.04 1.03 1.03 1.03 1.03 1.04 1.04 1.04 1.05 1.0560 1.47 1.26 1.16 1.10 1.07 1.06 1.05 1.04 1.04 1.04 1.04 1.04 1.04 1.05 1.05 1.0565 1.46 1.26 1.17 1.11 1.08 1.07 1.06 1.05 1.05 1.05 1.05 1.05 1.05 1.05 1.05 1.0670 1.45 1.26 1.17 1.12 1.09 1.07 1.06 1.06 1.05 1.05 1.05 1.05 1.05 1.06 1.06 1.0675 1.44 1.26 1.18 1.13 1.10 1.08 1.07 1.06 1.06 1.06 1.06 1.06 1.06 1.06 1.06 1.06

74
Table B-11: Actuator duty cycle obtained using the non-linear model and highwind4 as wind input file.
Derivative GainProportional
Gain 1 5 10 15 20 25 30 35 40 45 50 55 60 65 70 75
Integral Gain=1 1 0.79 0.79 1.00 1.12 1.19 1.24 1.28 1.30 1.32 1.34 1.35 1.36 1.37 1.38 1.38 1.405 0.93 0.94 1.05 1.13 1.19 1.24 1.28 1.31 1.33 1.35 1.36 1.37 1.39 1.40 1.41 1.42
10 1.15 1.10 1.15 1.19 1.24 1.27 1.30 1.32 1.35 1.36 1.38 1.39 1.40 1.41 1.42 1.4215 1.32 1.21 1.22 1.25 1.28 1.30 1.33 1.34 1.36 1.38 1.39 1.40 1.41 1.42 1.43 1.4320 1.45 1.31 1.28 1.29 1.31 1.33 1.35 1.36 1.38 1.39 1.40 1.41 1.42 1.43 1.43 1.4325 1.53 1.38 1.33 1.33 1.34 1.35 1.37 1.38 1.39 1.40 1.41 1.42 1.42 1.43 1.44 1.4430 1.58 1.44 1.38 1.37 1.37 1.38 1.39 1.40 1.40 1.41 1.42 1.43 1.44 1.44 1.45 1.4535 1.61 1.48 1.41 1.39 1.39 1.39 1.40 1.41 1.42 1.42 1.43 1.43 1.44 1.45 1.45 1.4640 1.64 1.51 1.44 1.42 1.41 1.41 1.41 1.42 1.43 1.43 1.44 1.44 1.45 1.45 1.45 1.4645 1.65 1.53 1.47 1.44 1.43 1.43 1.43 1.43 1.43 1.44 1.44 1.45 1.45 1.45 1.46 1.4650 1.66 1.55 1.49 1.46 1.44 1.44 1.44 1.44 1.44 1.45 1.45 1.45 1.46 1.46 1.46 1.4755 1.67 1.57 1.50 1.47 1.46 1.45 1.45 1.45 1.45 1.45 1.46 1.46 1.46 1.46 1.47 1.4760 1.68 1.58 1.52 1.49 1.47 1.46 1.46 1.46 1.46 1.46 1.46 1.46 1.46 1.47 1.47 1.4765 1.68 1.59 1.53 1.50 1.48 1.47 1.47 1.46 1.46 1.47 1.47 1.47 1.47 1.47 1.47 1.4770 1.69 1.60 1.54 1.51 1.49 1.48 1.47 1.47 1.47 1.47 1.47 1.47 1.48 1.48 1.48 1.4875 1.70 1.61 1.55 1.52 1.50 1.49 1.48 1.48 1.48 1.48 1.48 1.48 1.48 1.48 1.48 1.48
Integral Gain=5 1 1.84 1.45 1.26 1.28 1.26 1.26 1.27 1.29 1.34 1.37 1.40 1.42 1.44 1.45 1.46 1.485 1.31 1.14 1.17 1.21 1.25 1.28 1.30 1.33 1.35 1.37 1.39 1.41 1.42 1.44 1.44 1.45
10 1.34 1.20 1.21 1.25 1.28 1.31 1.33 1.35 1.37 1.39 1.40 1.41 1.42 1.43 1.44 1.4415 1.43 1.28 1.27 1.29 1.31 1.33 1.35 1.37 1.38 1.40 1.41 1.42 1.43 1.44 1.45 1.4520 1.53 1.36 1.32 1.33 1.34 1.36 1.37 1.38 1.40 1.41 1.42 1.42 1.43 1.44 1.45 1.4525 1.60 1.43 1.37 1.36 1.37 1.38 1.39 1.40 1.41 1.42 1.43 1.43 1.44 1.45 1.45 1.4630 1.63 1.48 1.41 1.39 1.39 1.39 1.40 1.41 1.42 1.43 1.43 1.44 1.44 1.45 1.46 1.4635 1.66 1.51 1.44 1.42 1.41 1.41 1.42 1.42 1.43 1.44 1.44 1.44 1.45 1.46 1.46 1.4640 1.68 1.54 1.47 1.44 1.43 1.43 1.43 1.43 1.44 1.44 1.45 1.45 1.46 1.46 1.47 1.4745 1.69 1.56 1.49 1.46 1.44 1.44 1.44 1.44 1.45 1.45 1.45 1.46 1.46 1.47 1.47 1.4750 1.69 1.58 1.51 1.47 1.46 1.45 1.45 1.45 1.45 1.46 1.46 1.46 1.47 1.47 1.47 1.4755 1.70 1.59 1.52 1.49 1.47 1.46 1.46 1.46 1.46 1.46 1.47 1.47 1.47 1.47 1.48 1.4860 1.70 1.60 1.54 1.50 1.48 1.47 1.47 1.47 1.47 1.47 1.47 1.47 1.47 1.48 1.48 1.4865 1.71 1.61 1.55 1.51 1.49 1.48 1.48 1.48 1.47 1.48 1.48 1.48 1.48 1.48 1.48 1.4870 1.71 1.62 1.56 1.52 1.50 1.49 1.49 1.48 1.48 1.48 1.48 1.48 1.48 1.48 1.49 1.4975 1.72 1.63 1.57 1.53 1.51 1.50 1.49 1.49 1.49 1.49 1.49 1.48 1.49 1.49 1.49 1.49
Integral Gain=10 1 2.44 1.80 1.40 1.44 1.47 1.39 1.39 1.43 1.45 1.40 1.41 1.42 1.40 1.39 1.40 1.425 1.95 1.30 1.24 1.29 1.32 1.33 1.36 1.38 1.39 1.40 1.41 1.41 1.41 1.42 1.42 1.43
10 1.52 1.31 1.26 1.29 1.32 1.34 1.36 1.38 1.39 1.40 1.41 1.42 1.42 1.43 1.44 1.4515 1.54 1.36 1.31 1.32 1.34 1.36 1.37 1.39 1.40 1.41 1.42 1.43 1.43 1.44 1.45 1.4520 1.61 1.41 1.35 1.35 1.36 1.37 1.39 1.40 1.41 1.42 1.43 1.43 1.44 1.45 1.45 1.4625 1.66 1.47 1.40 1.38 1.38 1.39 1.40 1.41 1.42 1.43 1.43 1.44 1.44 1.45 1.46 1.4630 1.68 1.51 1.43 1.41 1.40 1.41 1.41 1.42 1.43 1.43 1.44 1.44 1.45 1.46 1.46 1.4735 1.70 1.54 1.46 1.43 1.42 1.42 1.43 1.43 1.44 1.44 1.45 1.45 1.46 1.46 1.47 1.4740 1.71 1.57 1.49 1.45 1.44 1.44 1.44 1.44 1.44 1.45 1.45 1.46 1.46 1.47 1.47 1.4745 1.72 1.58 1.51 1.47 1.45 1.45 1.45 1.45 1.45 1.46 1.46 1.46 1.47 1.47 1.47 1.4750 1.72 1.60 1.52 1.49 1.47 1.46 1.46 1.46 1.46 1.46 1.46 1.47 1.47 1.47 1.48 1.4855 1.73 1.61 1.54 1.50 1.48 1.47 1.47 1.47 1.47 1.47 1.47 1.47 1.47 1.48 1.48 1.4860 1.73 1.62 1.55 1.51 1.49 1.48 1.48 1.47 1.47 1.47 1.48 1.48 1.48 1.48 1.48 1.4965 1.74 1.63 1.56 1.52 1.50 1.49 1.48 1.48 1.48 1.48 1.48 1.48 1.48 1.48 1.49 1.4970 1.75 1.64 1.57 1.53 1.51 1.50 1.49 1.49 1.49 1.48 1.49 1.48 1.49 1.49 1.49 1.4975 1.76 1.65 1.58 1.54 1.52 1.51 1.50 1.49 1.49 1.49 1.49 1.49 1.49 1.49 1.49 1.49

75
Table B-11: Actuator duty cycle obtained using the non-linear model and highwind4 as wind input file.
Derivative GainProportional
Gain 1 5 10 15 20 25 30 35 40 45 50 55 60 65 70 75
Integral Gain=15 1 4.16 4.73 1.60 1.42 1.39 1.47 1.57 1.42 1.43 1.46 1.44 1.48 1.51 1.48 1.45 1.455 3.68 1.61 1.30 1.29 1.34 1.37 1.39 1.39 1.40 1.42 1.43 1.44 1.45 1.46 1.46 1.46
10 1.69 1.43 1.30 1.31 1.34 1.36 1.38 1.39 1.41 1.42 1.43 1.43 1.44 1.45 1.46 1.4615 1.64 1.42 1.34 1.33 1.35 1.37 1.39 1.40 1.41 1.42 1.43 1.44 1.44 1.45 1.46 1.4620 1.70 1.46 1.38 1.36 1.37 1.38 1.40 1.41 1.42 1.43 1.44 1.44 1.45 1.45 1.46 1.4625 1.72 1.50 1.42 1.39 1.39 1.40 1.41 1.42 1.43 1.43 1.44 1.44 1.45 1.46 1.46 1.4630 1.73 1.54 1.45 1.42 1.41 1.42 1.42 1.43 1.43 1.44 1.45 1.45 1.46 1.46 1.47 1.4735 1.74 1.57 1.48 1.44 1.43 1.43 1.43 1.44 1.44 1.45 1.45 1.45 1.46 1.47 1.47 1.4740 1.75 1.59 1.50 1.46 1.45 1.44 1.44 1.45 1.45 1.45 1.46 1.46 1.46 1.47 1.47 1.4745 1.75 1.61 1.52 1.48 1.46 1.45 1.45 1.45 1.46 1.46 1.46 1.46 1.47 1.47 1.48 1.4850 1.76 1.62 1.54 1.50 1.48 1.47 1.46 1.46 1.46 1.47 1.47 1.47 1.47 1.48 1.48 1.4855 1.76 1.63 1.55 1.51 1.49 1.48 1.47 1.47 1.47 1.47 1.47 1.47 1.48 1.48 1.48 1.4860 1.76 1.64 1.56 1.52 1.50 1.49 1.48 1.48 1.48 1.48 1.48 1.48 1.48 1.48 1.49 1.4965 1.77 1.64 1.57 1.53 1.51 1.50 1.49 1.48 1.48 1.48 1.48 1.48 1.48 1.49 1.49 1.4970 1.79 1.65 1.58 1.54 1.52 1.50 1.50 1.49 1.49 1.49 1.49 1.49 1.49 1.49 1.49 1.4975 1.80 1.66 1.59 1.55 1.53 1.51 1.50 1.50 1.49 1.49 1.49 1.49 1.49 1.49 1.49 1.50
Integral Gain=20 1 4.32 3.04 3.61 1.54 1.47 1.43 1.43 1.48 1.58 1.50 1.43 1.46 1.50 1.47 1.47 1.505 2.91 2.00 1.47 1.33 1.32 1.37 1.40 1.42 1.44 1.43 1.43 1.44 1.45 1.46 1.46 1.48
10 1.86 1.50 1.38 1.32 1.34 1.37 1.39 1.40 1.42 1.43 1.43 1.44 1.45 1.45 1.46 1.4715 1.78 1.47 1.39 1.35 1.36 1.38 1.39 1.41 1.42 1.43 1.44 1.44 1.45 1.46 1.46 1.4720 1.82 1.50 1.40 1.38 1.38 1.39 1.40 1.41 1.42 1.43 1.44 1.44 1.45 1.46 1.46 1.4725 1.80 1.54 1.44 1.41 1.40 1.41 1.41 1.42 1.43 1.44 1.45 1.45 1.45 1.46 1.47 1.4730 1.79 1.57 1.47 1.43 1.42 1.42 1.43 1.43 1.44 1.44 1.45 1.45 1.46 1.47 1.47 1.4735 1.79 1.60 1.50 1.45 1.44 1.43 1.44 1.44 1.45 1.45 1.45 1.46 1.46 1.47 1.47 1.4840 1.79 1.62 1.52 1.47 1.46 1.45 1.45 1.45 1.45 1.46 1.46 1.46 1.47 1.47 1.48 1.4845 1.79 1.63 1.54 1.49 1.47 1.46 1.46 1.46 1.46 1.46 1.47 1.47 1.47 1.48 1.48 1.4850 1.79 1.64 1.55 1.51 1.48 1.47 1.47 1.47 1.47 1.47 1.47 1.47 1.47 1.48 1.48 1.4855 1.80 1.65 1.56 1.52 1.50 1.48 1.48 1.47 1.47 1.47 1.48 1.48 1.48 1.48 1.49 1.4860 1.80 1.65 1.57 1.53 1.51 1.49 1.48 1.48 1.48 1.48 1.48 1.48 1.48 1.49 1.49 1.4965 1.81 1.66 1.58 1.54 1.52 1.50 1.49 1.49 1.49 1.49 1.49 1.48 1.49 1.49 1.49 1.4970 1.81 1.67 1.59 1.55 1.52 1.51 1.50 1.49 1.49 1.49 1.49 1.49 1.49 1.49 1.49 1.4975 1.82 1.68 1.60 1.56 1.53 1.52 1.51 1.50 1.50 1.50 1.49 1.49 1.49 1.50 1.50 1.50

76
Table B-12: Actuator duty cycle obtained using the non-linear model averaged over five wind input cases.
Derivative GainProportional
Gain 1 5 10 15 20 25 30 35 40 45 50 55 60 65 70 75
Integral Gain=1 1 0.57 0.59 0.77 0.90 0.99 1.04 1.09 1.12 1.15 1.17 1.19 1.20 1.21 1.22 1.23 1.245 0.72 0.72 0.83 0.93 1.00 1.05 1.09 1.13 1.15 1.17 1.19 1.20 1.22 1.23 1.24 1.25
10 0.95 0.89 0.93 0.99 1.04 1.08 1.12 1.14 1.17 1.19 1.20 1.22 1.23 1.24 1.25 1.2615 1.12 1.01 1.01 1.04 1.08 1.11 1.14 1.16 1.18 1.20 1.22 1.23 1.24 1.25 1.26 1.2720 1.25 1.11 1.08 1.09 1.11 1.14 1.16 1.18 1.20 1.21 1.23 1.24 1.25 1.26 1.27 1.2825 1.34 1.18 1.13 1.13 1.14 1.16 1.18 1.19 1.21 1.22 1.23 1.24 1.25 1.26 1.27 1.2830 1.40 1.24 1.18 1.17 1.17 1.18 1.19 1.20 1.22 1.23 1.24 1.25 1.26 1.27 1.28 1.2835 1.44 1.29 1.22 1.20 1.20 1.20 1.21 1.22 1.23 1.24 1.25 1.25 1.26 1.27 1.28 1.2840 1.48 1.33 1.25 1.23 1.22 1.22 1.22 1.23 1.24 1.24 1.25 1.26 1.27 1.27 1.28 1.2845 1.50 1.36 1.28 1.25 1.24 1.24 1.24 1.24 1.25 1.25 1.26 1.26 1.27 1.28 1.28 1.2950 1.52 1.38 1.31 1.27 1.26 1.25 1.25 1.25 1.26 1.26 1.26 1.27 1.27 1.28 1.29 1.2955 1.54 1.40 1.33 1.29 1.27 1.26 1.26 1.26 1.26 1.27 1.27 1.27 1.28 1.29 1.29 1.2960 1.55 1.42 1.34 1.31 1.29 1.28 1.27 1.27 1.27 1.27 1.28 1.28 1.28 1.29 1.29 1.3065 1.56 1.43 1.36 1.32 1.30 1.29 1.28 1.28 1.28 1.28 1.28 1.28 1.29 1.29 1.29 1.3070 1.56 1.44 1.37 1.33 1.31 1.30 1.29 1.29 1.29 1.29 1.29 1.29 1.29 1.29 1.30 1.3075 1.57 1.45 1.38 1.34 1.32 1.31 1.30 1.30 1.29 1.29 1.29 1.30 1.30 1.30 1.30 1.30
Integral Gain=5 1 2.17 1.39 1.01 1.02 1.02 1.05 1.12 1.14 1.17 1.19 1.21 1.23 1.24 1.24 1.25 1.265 1.14 0.90 0.91 0.96 1.02 1.07 1.12 1.15 1.18 1.20 1.21 1.23 1.24 1.25 1.26 1.27
10 1.15 0.98 0.98 1.02 1.06 1.10 1.14 1.16 1.19 1.21 1.22 1.24 1.25 1.26 1.27 1.2715 1.25 1.08 1.05 1.07 1.09 1.12 1.15 1.17 1.19 1.21 1.23 1.24 1.25 1.26 1.27 1.2820 1.35 1.16 1.11 1.11 1.13 1.15 1.16 1.18 1.20 1.22 1.23 1.24 1.25 1.26 1.27 1.2825 1.42 1.23 1.16 1.15 1.16 1.17 1.18 1.20 1.21 1.22 1.24 1.25 1.26 1.27 1.28 1.2930 1.47 1.28 1.20 1.18 1.18 1.19 1.20 1.21 1.22 1.23 1.24 1.25 1.26 1.27 1.28 1.2935 1.50 1.32 1.24 1.21 1.21 1.21 1.22 1.22 1.23 1.24 1.25 1.26 1.26 1.27 1.28 1.2940 1.52 1.35 1.27 1.24 1.23 1.23 1.23 1.24 1.24 1.25 1.25 1.26 1.27 1.27 1.28 1.2945 1.54 1.38 1.30 1.26 1.25 1.24 1.24 1.25 1.25 1.26 1.26 1.27 1.27 1.28 1.28 1.2950 1.55 1.40 1.32 1.28 1.26 1.26 1.26 1.26 1.26 1.26 1.27 1.27 1.28 1.28 1.29 1.2955 1.56 1.41 1.34 1.30 1.28 1.27 1.27 1.27 1.27 1.27 1.27 1.28 1.28 1.29 1.29 1.3060 1.57 1.43 1.35 1.31 1.29 1.28 1.28 1.28 1.28 1.28 1.28 1.28 1.29 1.29 1.29 1.3065 1.58 1.44 1.37 1.33 1.31 1.29 1.29 1.28 1.28 1.28 1.29 1.29 1.29 1.29 1.30 1.3070 1.58 1.45 1.38 1.34 1.32 1.30 1.30 1.29 1.29 1.29 1.29 1.29 1.30 1.30 1.30 1.3075 1.59 1.46 1.39 1.35 1.33 1.31 1.30 1.30 1.30 1.30 1.30 1.30 1.30 1.30 1.30 1.31
Integral Gain=10 1 1.79 2.08 1.92 1.58 1.36 1.24 1.19 1.21 1.22 1.18 1.19 1.22 1.25 1.25 1.26 1.275 2.24 1.25 1.08 1.06 1.07 1.08 1.10 1.13 1.15 1.17 1.19 1.22 1.24 1.26 1.27 1.28
10 1.47 1.15 1.05 1.05 1.07 1.10 1.12 1.14 1.17 1.19 1.21 1.23 1.25 1.26 1.27 1.2815 1.42 1.17 1.10 1.09 1.11 1.13 1.15 1.17 1.19 1.20 1.22 1.23 1.25 1.26 1.27 1.2820 1.48 1.23 1.15 1.14 1.14 1.15 1.17 1.18 1.20 1.21 1.23 1.24 1.25 1.26 1.27 1.2825 1.53 1.29 1.19 1.17 1.17 1.18 1.19 1.20 1.21 1.22 1.23 1.24 1.25 1.26 1.28 1.2830 1.56 1.33 1.23 1.20 1.20 1.20 1.20 1.21 1.22 1.23 1.24 1.25 1.26 1.27 1.27 1.2835 1.58 1.36 1.27 1.23 1.22 1.22 1.22 1.23 1.23 1.24 1.25 1.26 1.26 1.27 1.28 1.2840 1.59 1.39 1.29 1.25 1.24 1.23 1.23 1.24 1.24 1.25 1.26 1.26 1.27 1.27 1.28 1.2845 1.60 1.41 1.32 1.27 1.26 1.25 1.25 1.25 1.25 1.26 1.26 1.27 1.27 1.28 1.28 1.2950 1.60 1.43 1.34 1.29 1.27 1.26 1.26 1.26 1.26 1.26 1.27 1.27 1.28 1.28 1.29 1.2955 1.60 1.44 1.35 1.31 1.29 1.27 1.27 1.27 1.27 1.27 1.28 1.28 1.28 1.29 1.29 1.3060 1.61 1.45 1.37 1.32 1.30 1.29 1.28 1.28 1.28 1.28 1.28 1.28 1.29 1.29 1.29 1.3065 1.61 1.46 1.38 1.33 1.31 1.30 1.29 1.29 1.28 1.29 1.29 1.29 1.29 1.29 1.30 1.3070 1.61 1.47 1.39 1.34 1.32 1.31 1.30 1.29 1.29 1.29 1.29 1.29 1.30 1.30 1.30 1.3075 1.61 1.47 1.40 1.35 1.33 1.32 1.31 1.30 1.30 1.30 1.30 1.30 1.30 1.30 1.31 1.31

77
Table B-12: Actuator duty cycle obtained using the non-linear model averaged over five wind input cases.
Derivative GainProportional
Gain 1 5 10 15 20 25 30 35 40 45 50 55 60 65 70 75
Integral Gain=15 1 1.86 2.48 2.54 1.76 1.74 1.60 1.48 1.37 1.34 1.29 1.26 1.28 1.31 1.27 1.25 1.255 2.65 2.01 1.37 1.21 1.16 1.16 1.17 1.17 1.16 1.17 1.18 1.20 1.22 1.24 1.24 1.25
10 2.27 1.35 1.17 1.12 1.11 1.12 1.14 1.15 1.17 1.18 1.19 1.20 1.22 1.23 1.25 1.2615 1.69 1.30 1.17 1.14 1.13 1.14 1.16 1.17 1.19 1.20 1.21 1.22 1.23 1.24 1.26 1.2720 1.65 1.31 1.20 1.17 1.16 1.17 1.18 1.19 1.20 1.21 1.22 1.23 1.24 1.25 1.26 1.2725 1.65 1.35 1.23 1.20 1.19 1.19 1.20 1.20 1.21 1.22 1.23 1.24 1.25 1.26 1.27 1.2730 1.66 1.39 1.26 1.22 1.21 1.21 1.21 1.22 1.22 1.23 1.24 1.25 1.26 1.26 1.27 1.2835 1.68 1.42 1.29 1.25 1.23 1.23 1.23 1.23 1.23 1.24 1.25 1.25 1.26 1.27 1.27 1.2840 1.68 1.44 1.32 1.27 1.25 1.24 1.24 1.24 1.24 1.25 1.25 1.26 1.27 1.27 1.28 1.2845 1.67 1.45 1.34 1.29 1.27 1.26 1.25 1.25 1.25 1.26 1.26 1.27 1.27 1.28 1.28 1.2950 1.67 1.46 1.36 1.31 1.28 1.27 1.26 1.26 1.26 1.26 1.27 1.27 1.28 1.28 1.29 1.2955 1.67 1.47 1.37 1.32 1.29 1.28 1.27 1.27 1.27 1.27 1.27 1.28 1.28 1.29 1.29 1.2960 1.66 1.48 1.38 1.33 1.31 1.29 1.28 1.28 1.28 1.28 1.28 1.28 1.29 1.29 1.29 1.3065 1.66 1.48 1.39 1.35 1.32 1.30 1.29 1.29 1.29 1.29 1.29 1.29 1.29 1.29 1.30 1.3070 1.66 1.49 1.40 1.36 1.33 1.31 1.30 1.29 1.29 1.29 1.29 1.29 1.30 1.30 1.30 1.3075 1.65 1.50 1.41 1.36 1.34 1.32 1.31 1.30 1.30 1.30 1.30 1.30 1.30 1.30 1.31 1.31
Integral Gain=20 1 1.77 2.01 2.64 2.22 1.73 1.77 1.71 1.61 1.53 1.41 1.40 1.38 1.34 1.31 1.31 1.315 1.60 1.98 1.94 1.52 1.32 1.25 1.23 1.22 1.23 1.24 1.23 1.21 1.22 1.23 1.24 1.25
10 1.96 1.75 1.30 1.21 1.17 1.16 1.17 1.18 1.19 1.20 1.21 1.21 1.21 1.22 1.23 1.2415 2.42 1.45 1.25 1.19 1.17 1.17 1.17 1.18 1.19 1.20 1.21 1.22 1.23 1.23 1.24 1.2520 1.87 1.43 1.25 1.20 1.19 1.18 1.19 1.19 1.21 1.22 1.22 1.23 1.24 1.25 1.26 1.2625 1.85 1.42 1.27 1.22 1.21 1.20 1.21 1.21 1.22 1.23 1.23 1.24 1.25 1.25 1.26 1.2730 1.82 1.44 1.30 1.24 1.23 1.22 1.22 1.22 1.23 1.24 1.24 1.25 1.25 1.26 1.27 1.2735 1.79 1.47 1.33 1.27 1.24 1.24 1.23 1.24 1.24 1.24 1.25 1.25 1.26 1.27 1.27 1.2840 1.75 1.48 1.35 1.29 1.26 1.25 1.25 1.25 1.25 1.25 1.26 1.26 1.26 1.27 1.28 1.2845 1.75 1.50 1.37 1.31 1.28 1.26 1.26 1.26 1.26 1.26 1.26 1.27 1.27 1.28 1.28 1.2950 1.76 1.50 1.38 1.32 1.29 1.28 1.27 1.27 1.27 1.27 1.27 1.27 1.28 1.28 1.29 1.2955 1.73 1.51 1.39 1.34 1.31 1.29 1.28 1.28 1.27 1.27 1.28 1.28 1.28 1.28 1.29 1.2960 1.73 1.51 1.40 1.35 1.32 1.30 1.29 1.28 1.28 1.28 1.28 1.28 1.29 1.29 1.29 1.2965 1.73 1.52 1.41 1.36 1.33 1.31 1.30 1.29 1.29 1.29 1.29 1.29 1.29 1.29 1.30 1.3070 1.72 1.52 1.42 1.37 1.34 1.32 1.31 1.30 1.29 1.29 1.29 1.29 1.29 1.30 1.30 1.3075 1.72 1.52 1.43 1.38 1.35 1.33 1.31 1.31 1.30 1.30 1.30 1.30 1.30 1.30 1.30 1.31

78
1 10 20 30 40 50 60 70
151015202530354045505560657075
Derivative Gain (deg s2/rad)
Pro
po
rtion
al Gain
(deg
s/rad)
2.00-2.101.90-2.001.80-1.901.70-1.801.60-1.701.50-1.601.40-1.501.30-1.401.20-1.301.10-1.201.00-1.100.90-1.000.80-0.900.70-0.800.60-0.700.50-0.60
1.1-1.2
1.3-1.4
1.2-1.3
(a) Actuator duty cycle (deg/s)
1 10 20 30 40 50 60 70
151015202530354045505560657075
Derivative Gain (deg s2/rad)
Pro
po
rtion
al Gain
(deg
s/rad)
0.45-0.500.40-0.450.35-0.400.30-0.350.25-0.300.20-0.250.15-0.200.10-0.150.05-0.100.00-0.05
0.05-0.1
0.15-0.2
0.1-0.15
(b) RMS speed error (rad/s)
Figure B-1: Performance metric surfaces generated using the non-linearmodel for kI=15 deg/rad.

79
1 10 20 30 40 50 60 70
1510152025303540
45505560657075
Derivative Gain (deg s2/rad)
Pro
po
rtion
al G
ain
(de
g s
/rad
)
2.00-2.101.90-2.001.80-1.901.70-1.801.60-1.701.50-1.601.40-1.501.30-1.401.20-1.301.10-1.201.00-1.100.90-1.000.80-0.900.70-0.800.60-0.700.50-0.60
1.1-1.2
1.3-1.4
1.2-1.3
(a) Actuator duty cycle (deg/s)
1 10 20 30 40 50 60 70
151015202530354045505560657075
Derivative Gain (deg s2/rad)
Pro
po
rtion
al G
ain
(de
g s
/rad
)
0.45-0.500.40-0.450.35-0.400.30-0.350.25-0.300.20-0.250.15-0.200.10-0.150.05-0.100.00-0.05 0.05-0.1
0.15-0.2
0.1-0.15
(b) RMS speed error (rad/s)
Figure B-2: Performance metric surfaces generated using thenon-linear model for kI=20 deg/rad.

80
APPENDIX C
APPLICATION OF THE SYSTEMATIC METHODOLOGY
USING THE LINEAR MODEL I

81
Table C-1: RMS speed error obtained using the non-linear model and medwind2 as wind input file.
Derivative GainProportional
Gain 1 5 10 15 20 25 30 35 40 45 50 55 60 65 70 75
Integral Gain=1 1 0.98 1.08 1.08 1.06 1.10 1.20 1.30 1.36 1.37 1.34 1.29 1.23 1.17 1.12 1.06 1.005 0.44 0.46 0.48 0.51 0.53 0.55 0.57 0.58 0.58 0.58 0.58 0.58 0.57 0.55 0.54 0.53
10 0.28 0.28 0.29 0.30 0.31 0.32 0.32 0.33 0.33 0.33 0.34 0.34 0.34 0.33 0.33 0.3315 0.21 0.21 0.22 0.22 0.22 0.23 0.23 0.23 0.24 0.24 0.24 0.24 0.24 0.24 0.24 0.2420 0.18 0.18 0.18 0.18 0.18 0.18 0.19 0.19 0.19 0.19 0.19 0.19 0.19 0.20 0.20 0.2025 0.16 0.16 0.16 0.16 0.16 0.16 0.16 0.16 0.16 0.16 0.16 0.17 0.17 0.17 0.17 0.1730 0.14 0.14 0.14 0.14 0.14 0.14 0.14 0.14 0.14 0.15 0.15 0.15 0.15 0.15 0.15 0.1535 0.13 0.13 0.13 0.13 0.13 0.13 0.13 0.13 0.13 0.13 0.13 0.13 0.14 0.14 0.14 0.1440 0.12 0.12 0.12 0.12 0.12 0.12 0.12 0.12 0.12 0.12 0.12 0.12 0.13 0.13 0.13 0.1345 0.12 0.12 0.11 0.12 0.12 0.12 0.12 0.12 0.12 0.12 0.12 0.12 0.12 0.12 0.12 0.1250 0.11 0.11 0.11 0.11 0.11 0.11 0.11 0.11 0.11 0.11 0.11 0.11 0.11 0.11 0.11 0.1155 0.10 0.10 0.10 0.10 0.10 0.10 0.10 0.10 0.10 0.10 0.11 0.11 0.11 0.11 0.11 0.1160 0.10 0.10 0.10 0.10 0.10 0.10 0.10 0.10 0.10 0.10 0.10 0.10 0.10 0.10 0.10 0.1065 0.10 0.10 0.10 0.10 0.10 0.10 0.10 0.10 0.10 0.10 0.10 0.10 0.10 0.10 0.10 0.1070 0.09 0.09 0.09 0.09 0.09 0.09 0.09 0.09 0.09 0.09 0.09 0.09 0.09 0.09 0.09 0.0975 0.09 0.09 0.09 0.09 0.09 0.09 0.09 0.09 0.09 0.09 0.09 0.09 0.09 0.09 0.09 0.09
Integral Gain=5 1 4.77 0.79 0.68 0.50 0.40 0.32 0.34 0.43 0.51 0.57 0.59 0.60 0.59 0.58 0.56 0.545 0.24 0.23 0.22 0.21 0.20 0.20 0.21 0.23 0.25 0.27 0.28 0.29 0.29 0.29 0.29 0.29
10 0.16 0.15 0.15 0.15 0.15 0.15 0.15 0.16 0.16 0.17 0.17 0.18 0.18 0.19 0.19 0.1915 0.13 0.12 0.12 0.12 0.12 0.12 0.12 0.13 0.13 0.13 0.13 0.14 0.14 0.14 0.14 0.1520 0.11 0.11 0.10 0.10 0.10 0.10 0.11 0.11 0.11 0.11 0.11 0.11 0.11 0.12 0.12 0.1225 0.09 0.09 0.09 0.09 0.09 0.09 0.09 0.09 0.09 0.10 0.10 0.10 0.10 0.10 0.10 0.1030 0.08 0.08 0.08 0.08 0.08 0.08 0.08 0.08 0.08 0.08 0.09 0.09 0.09 0.09 0.09 0.0935 0.08 0.08 0.07 0.07 0.07 0.07 0.07 0.08 0.08 0.08 0.08 0.08 0.08 0.08 0.08 0.0840 0.07 0.07 0.07 0.07 0.07 0.07 0.07 0.07 0.07 0.07 0.07 0.07 0.07 0.07 0.07 0.0745 0.06 0.06 0.06 0.06 0.06 0.06 0.06 0.06 0.06 0.06 0.06 0.06 0.06 0.07 0.07 0.0750 0.06 0.06 0.06 0.06 0.06 0.06 0.06 0.06 0.06 0.06 0.06 0.06 0.06 0.06 0.06 0.0655 0.06 0.05 0.05 0.05 0.05 0.05 0.05 0.05 0.05 0.05 0.06 0.06 0.06 0.06 0.06 0.0660 0.05 0.05 0.05 0.05 0.05 0.05 0.05 0.05 0.05 0.05 0.05 0.05 0.05 0.05 0.05 0.0565 0.05 0.05 0.05 0.05 0.05 0.05 0.05 0.05 0.05 0.05 0.05 0.05 0.05 0.05 0.05 0.0570 0.05 0.05 0.05 0.05 0.05 0.05 0.05 0.05 0.05 0.05 0.05 0.05 0.05 0.05 0.05 0.0575 0.04 0.04 0.04 0.04 0.04 0.04 0.04 0.04 0.04 0.04 0.04 0.04 0.04 0.04 0.04 0.04
Integral Gain=10 1 6.86 5.61 0.53 0.52 0.42 0.38 0.47 0.40 0.32 0.28 0.25 0.21 0.18 0.18 0.20 0.245 0.31 0.18 0.18 0.18 0.17 0.17 0.17 0.17 0.15 0.14 0.14 0.13 0.13 0.14 0.14 0.16
10 0.13 0.12 0.11 0.11 0.11 0.11 0.11 0.11 0.11 0.10 0.10 0.10 0.10 0.11 0.11 0.1115 0.10 0.09 0.09 0.09 0.09 0.09 0.09 0.09 0.09 0.09 0.09 0.09 0.09 0.09 0.09 0.0920 0.08 0.08 0.08 0.08 0.08 0.08 0.07 0.07 0.07 0.07 0.07 0.08 0.08 0.08 0.08 0.0825 0.07 0.07 0.07 0.07 0.07 0.07 0.07 0.07 0.07 0.07 0.07 0.07 0.07 0.07 0.07 0.0730 0.07 0.06 0.06 0.06 0.06 0.06 0.06 0.06 0.06 0.06 0.06 0.06 0.06 0.06 0.06 0.0635 0.06 0.06 0.06 0.06 0.06 0.06 0.06 0.06 0.06 0.06 0.06 0.06 0.06 0.06 0.06 0.0640 0.06 0.05 0.05 0.05 0.05 0.05 0.05 0.05 0.05 0.05 0.05 0.05 0.05 0.05 0.05 0.0545 0.05 0.05 0.05 0.05 0.05 0.05 0.05 0.05 0.05 0.05 0.05 0.05 0.05 0.05 0.05 0.0550 0.05 0.05 0.05 0.05 0.05 0.05 0.05 0.05 0.05 0.05 0.05 0.05 0.05 0.05 0.05 0.0555 0.05 0.04 0.04 0.04 0.04 0.04 0.04 0.04 0.04 0.04 0.04 0.04 0.04 0.04 0.04 0.0460 0.04 0.04 0.04 0.04 0.04 0.04 0.04 0.04 0.04 0.04 0.04 0.04 0.04 0.04 0.04 0.0465 0.04 0.04 0.04 0.04 0.04 0.04 0.04 0.04 0.04 0.04 0.04 0.04 0.04 0.04 0.04 0.0470 0.04 0.04 0.04 0.04 0.04 0.04 0.04 0.04 0.04 0.04 0.04 0.04 0.04 0.04 0.04 0.0475 0.04 0.04 0.04 0.04 0.04 0.04 0.04 0.04 0.04 0.04 0.04 0.04 0.04 0.04 0.04 0.04

82
Table C-2: RMS speed error obtained using the non-linear model and wind3 as wind input file.
Derivative GainProportional
Gain 1 5 10 15 20 25 30 35 40 45 50 55 60 65 70 75
Integral Gain=1 1 0.39 0.39 0.42 0.45 0.50 0.57 0.62 0.65 0.66 0.66 0.66 0.65 0.65 0.64 0.62 0.615 0.26 0.25 0.25 0.27 0.29 0.30 0.31 0.32 0.33 0.34 0.35 0.35 0.35 0.35 0.36 0.36
10 0.21 0.20 0.20 0.21 0.21 0.22 0.22 0.23 0.23 0.23 0.24 0.24 0.24 0.25 0.25 0.2515 0.18 0.18 0.17 0.17 0.18 0.18 0.18 0.18 0.19 0.19 0.19 0.19 0.19 0.20 0.20 0.2020 0.16 0.16 0.15 0.15 0.15 0.16 0.16 0.16 0.16 0.16 0.16 0.16 0.16 0.17 0.17 0.1725 0.14 0.14 0.14 0.14 0.14 0.14 0.14 0.14 0.14 0.14 0.14 0.14 0.15 0.15 0.15 0.1530 0.13 0.13 0.13 0.13 0.13 0.13 0.13 0.13 0.13 0.13 0.13 0.13 0.13 0.13 0.13 0.1335 0.12 0.12 0.12 0.12 0.12 0.12 0.12 0.12 0.12 0.12 0.12 0.12 0.12 0.12 0.12 0.1240 0.11 0.11 0.11 0.11 0.11 0.11 0.11 0.11 0.11 0.11 0.11 0.11 0.11 0.11 0.11 0.1145 0.10 0.10 0.10 0.10 0.10 0.10 0.10 0.10 0.10 0.10 0.10 0.10 0.10 0.10 0.10 0.1050 0.10 0.10 0.10 0.10 0.10 0.10 0.10 0.10 0.10 0.10 0.10 0.10 0.10 0.10 0.10 0.1055 0.09 0.09 0.09 0.09 0.09 0.09 0.09 0.09 0.09 0.09 0.09 0.09 0.09 0.09 0.09 0.0960 0.09 0.09 0.09 0.09 0.09 0.09 0.09 0.09 0.09 0.09 0.09 0.09 0.09 0.09 0.09 0.0965 0.08 0.08 0.08 0.08 0.08 0.08 0.08 0.08 0.08 0.08 0.08 0.08 0.08 0.08 0.08 0.0870 0.08 0.08 0.08 0.08 0.08 0.08 0.08 0.08 0.08 0.08 0.08 0.08 0.08 0.08 0.08 0.0875 0.08 0.08 0.08 0.08 0.08 0.08 0.08 0.08 0.08 0.08 0.08 0.08 0.08 0.08 0.08 0.08
Integral Gain=5 1 1.15 0.49 0.44 0.30 0.23 0.24 0.19 0.14 0.14 0.16 0.19 0.20 0.20 0.20 0.20 0.195 0.24 0.20 0.17 0.15 0.13 0.11 0.10 0.09 0.09 0.09 0.09 0.10 0.10 0.10 0.10 0.10
10 0.14 0.12 0.11 0.10 0.09 0.08 0.07 0.07 0.07 0.07 0.07 0.07 0.07 0.07 0.07 0.0715 0.11 0.09 0.08 0.08 0.07 0.07 0.06 0.06 0.06 0.06 0.06 0.06 0.06 0.06 0.06 0.0620 0.09 0.08 0.07 0.07 0.06 0.06 0.06 0.06 0.05 0.05 0.05 0.05 0.05 0.05 0.06 0.0625 0.07 0.07 0.06 0.06 0.06 0.06 0.05 0.05 0.05 0.05 0.05 0.05 0.05 0.05 0.05 0.0530 0.07 0.06 0.06 0.06 0.05 0.05 0.05 0.05 0.05 0.05 0.05 0.05 0.05 0.05 0.05 0.0535 0.06 0.06 0.05 0.05 0.05 0.05 0.05 0.05 0.05 0.05 0.05 0.05 0.05 0.05 0.05 0.0540 0.06 0.05 0.05 0.05 0.05 0.05 0.05 0.05 0.04 0.04 0.04 0.04 0.04 0.04 0.04 0.0445 0.05 0.05 0.05 0.05 0.05 0.04 0.04 0.04 0.04 0.04 0.04 0.04 0.04 0.04 0.04 0.0450 0.05 0.05 0.05 0.04 0.04 0.04 0.04 0.04 0.04 0.04 0.04 0.04 0.04 0.04 0.04 0.0455 0.05 0.04 0.04 0.04 0.04 0.04 0.04 0.04 0.04 0.04 0.04 0.04 0.04 0.04 0.04 0.0460 0.04 0.04 0.04 0.04 0.04 0.04 0.04 0.04 0.04 0.04 0.04 0.04 0.04 0.04 0.04 0.0465 0.04 0.04 0.04 0.04 0.04 0.04 0.04 0.04 0.04 0.04 0.04 0.04 0.04 0.04 0.04 0.0470 0.04 0.04 0.04 0.04 0.04 0.04 0.04 0.04 0.04 0.04 0.04 0.04 0.04 0.04 0.04 0.0475 0.04 0.04 0.04 0.04 0.04 0.04 0.04 0.04 0.04 0.04 0.04 0.04 0.04 0.04 0.04 0.04
Integral Gain=10 1 7.22 3.67 0.69 0.44 0.25 0.35 0.25 0.21 0.17 0.13 0.14 0.16 0.16 0.14 0.12 0.095 0.37 0.21 0.17 0.15 0.14 0.14 0.13 0.11 0.10 0.09 0.09 0.08 0.08 0.08 0.07 0.06
10 0.15 0.13 0.11 0.10 0.09 0.09 0.08 0.08 0.07 0.07 0.06 0.06 0.06 0.05 0.05 0.0515 0.11 0.09 0.08 0.08 0.07 0.07 0.06 0.06 0.06 0.05 0.05 0.05 0.05 0.04 0.04 0.0420 0.08 0.07 0.07 0.06 0.06 0.06 0.05 0.05 0.05 0.05 0.04 0.04 0.04 0.04 0.04 0.0425 0.07 0.06 0.06 0.05 0.05 0.05 0.05 0.04 0.04 0.04 0.04 0.04 0.04 0.03 0.03 0.0330 0.06 0.05 0.05 0.05 0.04 0.04 0.04 0.04 0.04 0.04 0.04 0.03 0.03 0.03 0.03 0.0335 0.05 0.05 0.04 0.04 0.04 0.04 0.04 0.04 0.03 0.03 0.03 0.03 0.03 0.03 0.03 0.0340 0.05 0.04 0.04 0.04 0.04 0.04 0.03 0.03 0.03 0.03 0.03 0.03 0.03 0.03 0.03 0.0345 0.04 0.04 0.04 0.04 0.03 0.03 0.03 0.03 0.03 0.03 0.03 0.03 0.03 0.03 0.03 0.0350 0.04 0.04 0.04 0.03 0.03 0.03 0.03 0.03 0.03 0.03 0.03 0.03 0.03 0.03 0.03 0.0355 0.04 0.03 0.03 0.03 0.03 0.03 0.03 0.03 0.03 0.03 0.03 0.03 0.03 0.03 0.03 0.0360 0.03 0.03 0.03 0.03 0.03 0.03 0.03 0.03 0.03 0.03 0.03 0.03 0.03 0.03 0.03 0.0265 0.03 0.03 0.03 0.03 0.03 0.03 0.03 0.03 0.03 0.03 0.03 0.03 0.02 0.02 0.02 0.0270 0.03 0.03 0.03 0.03 0.03 0.03 0.03 0.03 0.03 0.03 0.02 0.02 0.02 0.02 0.02 0.0275 0.03 0.03 0.03 0.03 0.03 0.03 0.03 0.02 0.02 0.02 0.02 0.02 0.02 0.02 0.02 0.02

83
Table C-3: RMS speed error obtained using the non-linear model and wind4 as wind input file.
Derivative GainProportional
Gain 1 5 10 15 20 25 30 35 40 45 50 55 60 65 70 75
Integral Gain=1 1 1.16 1.10 0.94 0.82 0.77 0.77 0.78 0.79 0.78 0.77 0.75 0.73 0.70 0.68 0.66 0.645 0.48 0.47 0.45 0.43 0.41 0.40 0.39 0.39 0.38 0.38 0.37 0.37 0.37 0.36 0.36 0.35
10 0.32 0.31 0.30 0.30 0.29 0.28 0.28 0.27 0.27 0.27 0.26 0.26 0.26 0.26 0.25 0.2515 0.26 0.25 0.25 0.24 0.24 0.24 0.23 0.23 0.23 0.22 0.22 0.22 0.22 0.22 0.21 0.2120 0.22 0.22 0.22 0.21 0.21 0.21 0.21 0.20 0.20 0.20 0.20 0.20 0.20 0.19 0.19 0.1925 0.20 0.20 0.20 0.19 0.19 0.19 0.19 0.19 0.19 0.18 0.18 0.18 0.18 0.18 0.18 0.1830 0.18 0.18 0.18 0.18 0.18 0.18 0.18 0.17 0.17 0.17 0.17 0.17 0.17 0.17 0.17 0.1735 0.17 0.17 0.17 0.17 0.17 0.17 0.17 0.16 0.16 0.16 0.16 0.16 0.16 0.16 0.16 0.1640 0.16 0.16 0.16 0.16 0.16 0.16 0.16 0.16 0.15 0.15 0.15 0.15 0.15 0.15 0.15 0.1545 0.15 0.15 0.15 0.15 0.15 0.15 0.15 0.15 0.15 0.15 0.15 0.15 0.14 0.14 0.14 0.1450 0.15 0.14 0.14 0.14 0.14 0.14 0.14 0.14 0.14 0.14 0.14 0.14 0.14 0.14 0.14 0.1455 0.14 0.14 0.14 0.14 0.14 0.14 0.13 0.13 0.13 0.13 0.13 0.13 0.13 0.13 0.13 0.1360 0.13 0.13 0.13 0.13 0.13 0.13 0.13 0.13 0.13 0.13 0.13 0.13 0.13 0.13 0.13 0.1365 0.13 0.13 0.13 0.12 0.12 0.12 0.12 0.12 0.12 0.12 0.12 0.12 0.12 0.12 0.12 0.1270 0.12 0.12 0.12 0.12 0.12 0.12 0.12 0.12 0.12 0.12 0.12 0.12 0.12 0.12 0.12 0.1275 0.12 0.12 0.12 0.12 0.11 0.11 0.11 0.11 0.11 0.11 0.11 0.11 0.11 0.11 0.11 0.11
Integral Gain=5 1 1.63 0.82 0.53 0.44 0.49 0.47 0.46 0.56 0.62 0.65 0.66 0.66 0.65 0.63 0.59 0.545 0.34 0.28 0.26 0.25 0.26 0.27 0.28 0.29 0.30 0.31 0.32 0.32 0.32 0.32 0.31 0.30
10 0.21 0.20 0.19 0.18 0.18 0.19 0.19 0.19 0.19 0.20 0.20 0.20 0.20 0.20 0.20 0.1915 0.16 0.16 0.15 0.15 0.15 0.15 0.15 0.15 0.15 0.15 0.15 0.15 0.15 0.15 0.15 0.1420 0.14 0.13 0.13 0.12 0.12 0.12 0.12 0.12 0.12 0.12 0.12 0.12 0.12 0.12 0.12 0.1225 0.12 0.11 0.11 0.11 0.10 0.10 0.10 0.10 0.10 0.10 0.10 0.10 0.10 0.10 0.10 0.1030 0.10 0.10 0.10 0.09 0.09 0.09 0.09 0.09 0.09 0.09 0.09 0.09 0.09 0.09 0.09 0.0935 0.09 0.09 0.09 0.08 0.08 0.08 0.08 0.08 0.08 0.08 0.08 0.08 0.08 0.08 0.08 0.0840 0.08 0.08 0.08 0.08 0.08 0.08 0.07 0.07 0.07 0.07 0.07 0.07 0.07 0.07 0.07 0.0745 0.08 0.07 0.07 0.07 0.07 0.07 0.07 0.07 0.07 0.07 0.07 0.07 0.07 0.07 0.07 0.0750 0.07 0.07 0.07 0.07 0.07 0.07 0.06 0.06 0.06 0.06 0.06 0.06 0.06 0.06 0.06 0.0655 0.07 0.06 0.06 0.06 0.06 0.06 0.06 0.06 0.06 0.06 0.06 0.06 0.06 0.06 0.06 0.0660 0.06 0.06 0.06 0.06 0.06 0.06 0.06 0.06 0.06 0.06 0.06 0.06 0.06 0.05 0.05 0.0565 0.06 0.06 0.06 0.06 0.06 0.06 0.05 0.05 0.05 0.05 0.05 0.05 0.05 0.05 0.05 0.0570 0.06 0.06 0.05 0.05 0.05 0.05 0.05 0.05 0.05 0.05 0.05 0.05 0.05 0.05 0.05 0.0575 0.06 0.05 0.05 0.05 0.05 0.05 0.05 0.05 0.05 0.05 0.05 0.05 0.05 0.05 0.05 0.05
Integral Gain=10 1 8.58 8.02 0.84 0.38 0.54 0.51 0.34 0.33 0.31 0.33 0.37 0.38 0.34 0.30 0.30 0.355 0.47 0.33 0.24 0.20 0.19 0.18 0.17 0.17 0.17 0.18 0.19 0.20 0.20 0.20 0.21 0.22
10 0.20 0.17 0.16 0.14 0.13 0.13 0.13 0.13 0.13 0.13 0.14 0.14 0.14 0.15 0.15 0.1615 0.14 0.13 0.12 0.12 0.11 0.11 0.11 0.11 0.11 0.11 0.11 0.11 0.11 0.12 0.12 0.1220 0.12 0.11 0.10 0.10 0.10 0.09 0.09 0.09 0.09 0.09 0.09 0.09 0.10 0.10 0.10 0.1025 0.10 0.09 0.09 0.09 0.08 0.08 0.08 0.08 0.08 0.08 0.08 0.08 0.08 0.08 0.09 0.0930 0.09 0.08 0.08 0.08 0.08 0.07 0.07 0.07 0.07 0.07 0.07 0.07 0.07 0.07 0.08 0.0835 0.08 0.07 0.07 0.07 0.07 0.07 0.07 0.07 0.07 0.07 0.07 0.07 0.07 0.07 0.07 0.0740 0.07 0.07 0.07 0.06 0.06 0.06 0.06 0.06 0.06 0.06 0.06 0.06 0.06 0.06 0.06 0.0645 0.07 0.06 0.06 0.06 0.06 0.06 0.06 0.06 0.06 0.06 0.06 0.06 0.06 0.06 0.06 0.0650 0.06 0.06 0.06 0.06 0.05 0.05 0.05 0.05 0.05 0.05 0.05 0.05 0.05 0.05 0.05 0.0555 0.06 0.05 0.05 0.05 0.05 0.05 0.05 0.05 0.05 0.05 0.05 0.05 0.05 0.05 0.05 0.0560 0.05 0.05 0.05 0.05 0.05 0.05 0.05 0.05 0.05 0.05 0.05 0.05 0.05 0.05 0.05 0.0565 0.05 0.05 0.05 0.05 0.05 0.05 0.04 0.04 0.04 0.04 0.04 0.04 0.04 0.04 0.04 0.0470 0.05 0.05 0.04 0.04 0.04 0.04 0.04 0.04 0.04 0.04 0.04 0.04 0.04 0.04 0.04 0.0475 0.05 0.04 0.04 0.04 0.04 0.04 0.04 0.04 0.04 0.04 0.04 0.04 0.04 0.04 0.04 0.04

84
Table C-4: RMS speed error obtained using the non-linear model and wind5 as wind input file.
Derivative GainProportional
Gain 1 5 10 15 20 25 30 35 40 45 50 55 60 65 70 75
Integral Gain=1 1 0.58 0.64 0.75 0.86 0.92 0.93 0.91 0.88 0.86 0.83 0.82 0.81 0.80 0.80 0.80 0.805 0.27 0.27 0.29 0.32 0.35 0.38 0.39 0.41 0.42 0.43 0.44 0.44 0.45 0.46 0.46 0.47
10 0.23 0.23 0.23 0.24 0.25 0.26 0.27 0.28 0.29 0.30 0.30 0.31 0.32 0.32 0.33 0.3315 0.21 0.21 0.21 0.21 0.22 0.22 0.23 0.23 0.24 0.24 0.24 0.25 0.25 0.26 0.26 0.2620 0.19 0.19 0.19 0.19 0.19 0.20 0.20 0.20 0.20 0.21 0.21 0.21 0.21 0.22 0.22 0.2225 0.18 0.17 0.18 0.18 0.18 0.18 0.18 0.18 0.18 0.18 0.19 0.19 0.19 0.19 0.19 0.1930 0.16 0.16 0.16 0.16 0.16 0.16 0.16 0.17 0.17 0.17 0.17 0.17 0.17 0.17 0.17 0.1735 0.15 0.15 0.15 0.15 0.15 0.15 0.15 0.15 0.15 0.15 0.15 0.15 0.16 0.16 0.16 0.1640 0.14 0.14 0.14 0.14 0.14 0.14 0.14 0.14 0.14 0.14 0.14 0.14 0.14 0.14 0.14 0.1545 0.13 0.13 0.13 0.13 0.13 0.13 0.13 0.13 0.13 0.13 0.13 0.13 0.13 0.13 0.14 0.1450 0.13 0.13 0.13 0.13 0.13 0.13 0.13 0.13 0.13 0.13 0.13 0.13 0.13 0.13 0.13 0.1355 0.12 0.12 0.12 0.12 0.12 0.12 0.12 0.12 0.12 0.12 0.12 0.12 0.12 0.12 0.12 0.1260 0.11 0.11 0.11 0.11 0.11 0.11 0.11 0.11 0.11 0.11 0.11 0.11 0.11 0.11 0.11 0.1165 0.11 0.11 0.11 0.11 0.11 0.11 0.11 0.11 0.11 0.11 0.11 0.11 0.11 0.11 0.11 0.1170 0.10 0.10 0.10 0.10 0.10 0.10 0.10 0.10 0.10 0.10 0.10 0.10 0.10 0.10 0.10 0.1075 0.10 0.10 0.10 0.10 0.10 0.10 0.10 0.10 0.10 0.10 0.10 0.10 0.10 0.10 0.10 0.10
Integral Gain=5 1 5.62 0.67 0.73 0.70 0.39 0.37 0.35 0.34 0.34 0.36 0.37 0.38 0.38 0.38 0.37 0.385 0.21 0.20 0.20 0.20 0.18 0.16 0.15 0.15 0.15 0.15 0.16 0.17 0.17 0.18 0.18 0.19
10 0.14 0.12 0.12 0.11 0.11 0.10 0.09 0.09 0.09 0.09 0.09 0.10 0.10 0.10 0.11 0.1115 0.10 0.09 0.09 0.08 0.08 0.08 0.07 0.07 0.07 0.07 0.07 0.07 0.07 0.07 0.08 0.0820 0.09 0.08 0.07 0.07 0.07 0.06 0.06 0.06 0.06 0.06 0.06 0.06 0.06 0.06 0.06 0.0625 0.07 0.07 0.06 0.06 0.06 0.06 0.06 0.05 0.05 0.05 0.05 0.05 0.05 0.05 0.05 0.0530 0.07 0.06 0.06 0.06 0.05 0.05 0.05 0.05 0.05 0.05 0.05 0.05 0.05 0.05 0.05 0.0535 0.06 0.06 0.06 0.05 0.05 0.05 0.05 0.05 0.05 0.05 0.05 0.05 0.05 0.05 0.05 0.0540 0.06 0.05 0.05 0.05 0.05 0.05 0.05 0.05 0.05 0.05 0.05 0.05 0.05 0.05 0.05 0.0545 0.05 0.05 0.05 0.05 0.05 0.05 0.05 0.05 0.05 0.05 0.04 0.04 0.04 0.04 0.04 0.0450 0.05 0.05 0.05 0.05 0.05 0.05 0.05 0.05 0.04 0.04 0.04 0.04 0.04 0.04 0.04 0.0455 0.05 0.05 0.05 0.05 0.05 0.04 0.04 0.04 0.04 0.04 0.04 0.04 0.04 0.04 0.04 0.0460 0.05 0.05 0.05 0.04 0.04 0.04 0.04 0.04 0.04 0.04 0.04 0.04 0.04 0.04 0.04 0.0465 0.05 0.05 0.04 0.04 0.04 0.04 0.04 0.04 0.04 0.04 0.04 0.04 0.04 0.04 0.04 0.0470 0.05 0.04 0.04 0.04 0.04 0.04 0.04 0.04 0.04 0.04 0.04 0.04 0.04 0.04 0.04 0.0475 0.04 0.04 0.04 0.04 0.04 0.04 0.04 0.04 0.04 0.04 0.04 0.04 0.04 0.04 0.04 0.04
Integral Gain=10 1 8.79 7.79 0.90 0.84 0.32 0.41 0.53 0.57 0.46 0.31 0.24 0.24 0.25 0.25 0.24 0.245 0.22 0.16 0.16 0.17 0.16 0.16 0.18 0.19 0.18 0.16 0.14 0.13 0.13 0.12 0.12 0.12
10 0.13 0.11 0.10 0.10 0.10 0.10 0.10 0.10 0.10 0.10 0.09 0.09 0.08 0.08 0.08 0.0815 0.10 0.09 0.08 0.08 0.07 0.07 0.07 0.07 0.07 0.07 0.07 0.06 0.06 0.06 0.06 0.0620 0.08 0.07 0.07 0.06 0.06 0.06 0.06 0.06 0.05 0.05 0.05 0.05 0.05 0.05 0.05 0.0525 0.07 0.06 0.06 0.05 0.05 0.05 0.05 0.05 0.05 0.05 0.04 0.04 0.04 0.04 0.04 0.0430 0.06 0.05 0.05 0.05 0.05 0.04 0.04 0.04 0.04 0.04 0.04 0.04 0.04 0.04 0.04 0.0435 0.05 0.05 0.05 0.04 0.04 0.04 0.04 0.04 0.04 0.04 0.04 0.03 0.03 0.03 0.03 0.0340 0.05 0.04 0.04 0.04 0.04 0.04 0.04 0.03 0.03 0.03 0.03 0.03 0.03 0.03 0.03 0.0345 0.05 0.04 0.04 0.04 0.04 0.03 0.03 0.03 0.03 0.03 0.03 0.03 0.03 0.03 0.03 0.0350 0.04 0.04 0.04 0.03 0.03 0.03 0.03 0.03 0.03 0.03 0.03 0.03 0.03 0.03 0.03 0.0355 0.04 0.04 0.03 0.03 0.03 0.03 0.03 0.03 0.03 0.03 0.03 0.03 0.03 0.03 0.03 0.0360 0.04 0.03 0.03 0.03 0.03 0.03 0.03 0.03 0.03 0.03 0.03 0.03 0.03 0.03 0.03 0.0265 0.04 0.03 0.03 0.03 0.03 0.03 0.03 0.03 0.03 0.03 0.03 0.03 0.03 0.02 0.02 0.0270 0.03 0.03 0.03 0.03 0.03 0.03 0.03 0.03 0.03 0.03 0.02 0.02 0.02 0.02 0.02 0.0275 0.03 0.03 0.03 0.03 0.03 0.03 0.03 0.03 0.03 0.02 0.02 0.02 0.02 0.02 0.02 0.02

85
Table C-5: RMS speed error obtained using the non-linear model and highwind4 as wind input file.
Derivative GainProportional
Gain 1 5 10 15 20 25 30 35 40 45 50 55 60 65 70 75
Integral Gain=1 1 1.48 1.48 1.56 1.43 1.30 1.26 1.29 1.30 1.28 1.24 1.20 1.15 1.10 1.05 1.01 0.975 0.71 0.68 0.67 0.67 0.67 0.67 0.67 0.67 0.66 0.65 0.65 0.64 0.63 0.62 0.61 0.61
10 0.47 0.46 0.45 0.45 0.45 0.45 0.45 0.45 0.45 0.45 0.45 0.45 0.45 0.45 0.45 0.4515 0.38 0.37 0.37 0.36 0.36 0.36 0.36 0.36 0.37 0.37 0.37 0.37 0.37 0.37 0.37 0.3720 0.32 0.32 0.32 0.32 0.32 0.31 0.31 0.32 0.32 0.32 0.32 0.32 0.32 0.32 0.32 0.3225 0.29 0.29 0.28 0.28 0.28 0.28 0.28 0.28 0.28 0.28 0.28 0.28 0.28 0.28 0.29 0.2930 0.26 0.26 0.26 0.26 0.26 0.26 0.26 0.26 0.26 0.26 0.26 0.26 0.26 0.26 0.26 0.2635 0.24 0.24 0.24 0.24 0.24 0.24 0.24 0.24 0.24 0.24 0.24 0.24 0.24 0.24 0.24 0.2440 0.23 0.23 0.23 0.22 0.22 0.22 0.22 0.22 0.22 0.22 0.22 0.22 0.22 0.22 0.22 0.2245 0.21 0.21 0.21 0.21 0.21 0.21 0.21 0.21 0.21 0.21 0.21 0.21 0.21 0.21 0.21 0.2150 0.20 0.20 0.20 0.20 0.20 0.20 0.20 0.20 0.20 0.20 0.20 0.20 0.20 0.20 0.20 0.2055 0.19 0.19 0.19 0.19 0.19 0.19 0.19 0.19 0.19 0.19 0.19 0.19 0.19 0.19 0.19 0.1960 0.18 0.18 0.18 0.18 0.18 0.18 0.18 0.18 0.18 0.18 0.18 0.18 0.18 0.18 0.18 0.1865 0.17 0.17 0.17 0.17 0.17 0.17 0.17 0.17 0.17 0.17 0.17 0.17 0.17 0.17 0.17 0.1770 0.17 0.17 0.17 0.17 0.17 0.17 0.17 0.17 0.17 0.17 0.17 0.17 0.17 0.17 0.17 0.1775 0.16 0.16 0.16 0.16 0.16 0.16 0.16 0.16 0.16 0.16 0.16 0.16 0.16 0.16 0.16 0.16
Integral Gain=5 1 6.29 1.69 1.04 1.14 0.85 0.87 0.72 0.51 0.43 0.43 0.49 0.57 0.65 0.73 0.77 0.795 0.50 0.49 0.48 0.47 0.45 0.42 0.38 0.35 0.34 0.33 0.34 0.36 0.38 0.40 0.41 0.42
10 0.32 0.31 0.30 0.29 0.29 0.28 0.27 0.26 0.25 0.25 0.25 0.25 0.26 0.26 0.27 0.2715 0.24 0.23 0.23 0.22 0.22 0.21 0.21 0.21 0.20 0.20 0.20 0.20 0.20 0.20 0.20 0.2020 0.19 0.19 0.18 0.18 0.18 0.18 0.17 0.17 0.17 0.17 0.17 0.17 0.17 0.17 0.17 0.1725 0.16 0.16 0.16 0.16 0.15 0.15 0.15 0.15 0.15 0.15 0.15 0.15 0.14 0.14 0.14 0.1430 0.14 0.14 0.14 0.14 0.14 0.13 0.13 0.13 0.13 0.13 0.13 0.13 0.13 0.13 0.13 0.1335 0.13 0.13 0.12 0.12 0.12 0.12 0.12 0.12 0.12 0.12 0.12 0.12 0.12 0.12 0.12 0.1240 0.12 0.12 0.11 0.11 0.11 0.11 0.11 0.11 0.11 0.11 0.11 0.11 0.11 0.11 0.11 0.1145 0.11 0.11 0.11 0.10 0.10 0.10 0.10 0.10 0.10 0.10 0.10 0.10 0.10 0.10 0.10 0.1050 0.10 0.10 0.10 0.10 0.10 0.10 0.10 0.10 0.10 0.10 0.09 0.09 0.09 0.09 0.09 0.0955 0.09 0.09 0.09 0.09 0.09 0.09 0.09 0.09 0.09 0.09 0.09 0.09 0.09 0.09 0.09 0.0960 0.09 0.09 0.09 0.09 0.09 0.09 0.09 0.09 0.09 0.09 0.09 0.09 0.08 0.08 0.08 0.0865 0.08 0.08 0.08 0.08 0.08 0.08 0.08 0.08 0.08 0.08 0.08 0.08 0.08 0.08 0.08 0.0870 0.08 0.08 0.08 0.08 0.08 0.08 0.08 0.08 0.08 0.08 0.08 0.08 0.08 0.08 0.08 0.0875 0.08 0.08 0.08 0.08 0.08 0.08 0.08 0.08 0.08 0.08 0.08 0.08 0.08 0.07 0.07 0.07
Integral Gain=10 1 11.29 6.59 1.24 2.37 0.92 0.68 0.67 0.80 0.69 0.50 0.49 0.55 0.56 0.51 0.42 0.345 0.48 0.39 0.36 0.38 0.36 0.35 0.35 0.36 0.36 0.34 0.33 0.32 0.31 0.29 0.26 0.24
10 0.26 0.24 0.24 0.24 0.24 0.24 0.24 0.24 0.23 0.23 0.22 0.22 0.21 0.20 0.19 0.1915 0.20 0.19 0.18 0.18 0.18 0.18 0.18 0.18 0.18 0.18 0.17 0.17 0.17 0.16 0.16 0.1520 0.16 0.15 0.15 0.15 0.15 0.15 0.15 0.15 0.15 0.14 0.14 0.14 0.14 0.14 0.13 0.1325 0.14 0.13 0.13 0.13 0.13 0.13 0.13 0.13 0.13 0.12 0.12 0.12 0.12 0.12 0.12 0.1230 0.12 0.12 0.12 0.11 0.11 0.11 0.11 0.11 0.11 0.11 0.11 0.11 0.11 0.11 0.11 0.1035 0.11 0.10 0.10 0.10 0.10 0.10 0.10 0.10 0.10 0.10 0.10 0.10 0.10 0.10 0.10 0.0940 0.10 0.10 0.09 0.09 0.09 0.09 0.09 0.09 0.09 0.09 0.09 0.09 0.09 0.09 0.09 0.0945 0.09 0.09 0.09 0.09 0.09 0.08 0.08 0.08 0.08 0.08 0.08 0.08 0.08 0.08 0.08 0.0850 0.08 0.08 0.08 0.08 0.08 0.08 0.08 0.08 0.08 0.08 0.08 0.08 0.08 0.08 0.08 0.0855 0.08 0.08 0.07 0.07 0.07 0.07 0.07 0.07 0.07 0.07 0.07 0.07 0.07 0.07 0.07 0.0760 0.07 0.07 0.07 0.07 0.07 0.07 0.07 0.07 0.07 0.07 0.07 0.07 0.07 0.07 0.07 0.0765 0.07 0.07 0.07 0.07 0.07 0.07 0.07 0.07 0.06 0.06 0.06 0.06 0.06 0.06 0.06 0.0670 0.06 0.06 0.06 0.06 0.06 0.06 0.06 0.06 0.06 0.06 0.06 0.06 0.06 0.06 0.06 0.0675 0.06 0.06 0.06 0.06 0.06 0.06 0.06 0.06 0.06 0.06 0.06 0.06 0.06 0.06 0.06 0.06

86
Table C-6: RMS speed error obtained using the non-linear model averaged with all five wind input cases.
Derivative GainProportional
Gain 1 5 10 15 20 25 30 35 40 45 50 55 60 65 70 75
Integral Gain=1 1 0.92 0.94 0.95 0.92 0.92 0.94 0.98 0.99 0.99 0.97 0.94 0.91 0.89 0.86 0.83 0.805 0.43 0.42 0.43 0.44 0.45 0.46 0.47 0.47 0.48 0.48 0.48 0.48 0.47 0.47 0.47 0.46
10 0.30 0.30 0.30 0.30 0.30 0.31 0.31 0.31 0.31 0.32 0.32 0.32 0.32 0.32 0.32 0.3215 0.25 0.24 0.24 0.24 0.24 0.24 0.25 0.25 0.25 0.25 0.25 0.25 0.26 0.26 0.26 0.2620 0.21 0.21 0.21 0.21 0.21 0.21 0.21 0.21 0.21 0.22 0.22 0.22 0.22 0.22 0.22 0.2225 0.19 0.19 0.19 0.19 0.19 0.19 0.19 0.19 0.19 0.19 0.19 0.19 0.19 0.19 0.19 0.1930 0.18 0.18 0.17 0.17 0.17 0.17 0.17 0.17 0.17 0.17 0.17 0.18 0.18 0.18 0.18 0.1835 0.16 0.16 0.16 0.16 0.16 0.16 0.16 0.16 0.16 0.16 0.16 0.16 0.16 0.16 0.16 0.1640 0.15 0.15 0.15 0.15 0.15 0.15 0.15 0.15 0.15 0.15 0.15 0.15 0.15 0.15 0.15 0.1545 0.14 0.14 0.14 0.14 0.14 0.14 0.14 0.14 0.14 0.14 0.14 0.14 0.14 0.14 0.14 0.1450 0.14 0.14 0.14 0.14 0.13 0.13 0.13 0.13 0.13 0.13 0.13 0.13 0.13 0.13 0.13 0.1355 0.13 0.13 0.13 0.13 0.13 0.13 0.13 0.13 0.13 0.13 0.13 0.13 0.13 0.13 0.13 0.1360 0.12 0.12 0.12 0.12 0.12 0.12 0.12 0.12 0.12 0.12 0.12 0.12 0.12 0.12 0.12 0.1265 0.12 0.12 0.12 0.12 0.12 0.12 0.12 0.12 0.12 0.12 0.12 0.12 0.12 0.12 0.12 0.1270 0.11 0.11 0.11 0.11 0.11 0.11 0.11 0.11 0.11 0.11 0.11 0.11 0.11 0.11 0.11 0.1175 0.11 0.11 0.11 0.11 0.11 0.11 0.11 0.11 0.11 0.11 0.11 0.11 0.11 0.11 0.11 0.11
Integral Gain=5 1 3.89 0.89 0.68 0.62 0.47 0.45 0.41 0.40 0.41 0.43 0.46 0.48 0.50 0.50 0.50 0.495 0.31 0.28 0.27 0.26 0.24 0.23 0.23 0.22 0.22 0.23 0.24 0.25 0.25 0.26 0.26 0.26
10 0.19 0.18 0.17 0.17 0.16 0.16 0.16 0.15 0.15 0.16 0.16 0.16 0.16 0.16 0.17 0.1715 0.15 0.14 0.13 0.13 0.13 0.12 0.12 0.12 0.12 0.12 0.12 0.12 0.12 0.12 0.13 0.1320 0.12 0.12 0.11 0.11 0.11 0.10 0.10 0.10 0.10 0.10 0.10 0.10 0.10 0.10 0.10 0.1025 0.10 0.10 0.10 0.09 0.09 0.09 0.09 0.09 0.09 0.09 0.09 0.09 0.09 0.09 0.09 0.0930 0.09 0.09 0.09 0.09 0.08 0.08 0.08 0.08 0.08 0.08 0.08 0.08 0.08 0.08 0.08 0.0835 0.08 0.08 0.08 0.08 0.08 0.08 0.08 0.07 0.07 0.07 0.07 0.07 0.07 0.07 0.07 0.0740 0.08 0.07 0.07 0.07 0.07 0.07 0.07 0.07 0.07 0.07 0.07 0.07 0.07 0.07 0.07 0.0745 0.07 0.07 0.07 0.07 0.07 0.07 0.07 0.06 0.06 0.06 0.06 0.06 0.06 0.06 0.06 0.0650 0.07 0.06 0.06 0.06 0.06 0.06 0.06 0.06 0.06 0.06 0.06 0.06 0.06 0.06 0.06 0.0655 0.06 0.06 0.06 0.06 0.06 0.06 0.06 0.06 0.06 0.06 0.06 0.06 0.06 0.06 0.06 0.0660 0.06 0.06 0.06 0.06 0.06 0.06 0.06 0.06 0.06 0.05 0.05 0.05 0.05 0.05 0.05 0.0565 0.06 0.06 0.05 0.05 0.05 0.05 0.05 0.05 0.05 0.05 0.05 0.05 0.05 0.05 0.05 0.0570 0.05 0.05 0.05 0.05 0.05 0.05 0.05 0.05 0.05 0.05 0.05 0.05 0.05 0.05 0.05 0.0575 0.05 0.05 0.05 0.05 0.05 0.05 0.05 0.05 0.05 0.05 0.05 0.05 0.05 0.05 0.05 0.05
Integral Gain=10 1 8.55 6.34 0.84 0.91 0.49 0.47 0.45 0.46 0.39 0.31 0.30 0.31 0.30 0.28 0.26 0.255 0.37 0.25 0.22 0.22 0.20 0.20 0.20 0.20 0.19 0.18 0.18 0.17 0.17 0.17 0.16 0.16
10 0.17 0.15 0.14 0.14 0.13 0.13 0.13 0.13 0.13 0.13 0.12 0.12 0.12 0.12 0.12 0.1215 0.13 0.12 0.11 0.11 0.11 0.10 0.10 0.10 0.10 0.10 0.10 0.10 0.09 0.09 0.09 0.0920 0.10 0.10 0.09 0.09 0.09 0.09 0.09 0.08 0.08 0.08 0.08 0.08 0.08 0.08 0.08 0.0825 0.09 0.08 0.08 0.08 0.08 0.08 0.07 0.07 0.07 0.07 0.07 0.07 0.07 0.07 0.07 0.0730 0.08 0.07 0.07 0.07 0.07 0.07 0.07 0.07 0.06 0.06 0.06 0.06 0.06 0.06 0.06 0.0635 0.07 0.07 0.06 0.06 0.06 0.06 0.06 0.06 0.06 0.06 0.06 0.06 0.06 0.06 0.06 0.0640 0.06 0.06 0.06 0.06 0.06 0.06 0.06 0.05 0.05 0.05 0.05 0.05 0.05 0.05 0.05 0.0545 0.06 0.06 0.05 0.05 0.05 0.05 0.05 0.05 0.05 0.05 0.05 0.05 0.05 0.05 0.05 0.0550 0.05 0.05 0.05 0.05 0.05 0.05 0.05 0.05 0.05 0.05 0.05 0.05 0.05 0.05 0.05 0.0555 0.05 0.05 0.05 0.05 0.05 0.05 0.05 0.04 0.04 0.04 0.04 0.04 0.04 0.04 0.04 0.0460 0.05 0.05 0.04 0.04 0.04 0.04 0.04 0.04 0.04 0.04 0.04 0.04 0.04 0.04 0.04 0.0465 0.05 0.04 0.04 0.04 0.04 0.04 0.04 0.04 0.04 0.04 0.04 0.04 0.04 0.04 0.04 0.0470 0.04 0.04 0.04 0.04 0.04 0.04 0.04 0.04 0.04 0.04 0.04 0.04 0.04 0.04 0.04 0.0475 0.04 0.04 0.04 0.04 0.04 0.04 0.04 0.04 0.04 0.04 0.04 0.04 0.04 0.04 0.04 0.04

87
Table C-7: Actuator duty cycle obtained using the non-linear model and medwind2 as wind input file.
Derivative GainProportional
Gain 1 5 10 15 20 25 30 35 40 45 50 55 60 65 70 75
Integral Gain=1 1 0.75 0.66 0.68 0.74 0.80 0.85 0.88 0.90 0.91 0.92 0.92 0.94 0.95 0.96 0.98 0.995 0.66 0.62 0.67 0.73 0.78 0.83 0.86 0.89 0.91 0.93 0.94 0.96 0.97 0.98 0.99 1.00
10 0.75 0.72 0.74 0.78 0.82 0.86 0.89 0.91 0.93 0.95 0.96 0.98 0.99 1.00 1.01 1.0215 0.87 0.80 0.81 0.83 0.86 0.89 0.91 0.93 0.95 0.96 0.98 0.99 1.00 1.01 1.02 1.0320 0.97 0.88 0.87 0.88 0.90 0.92 0.93 0.95 0.97 0.98 0.99 1.00 1.01 1.02 1.03 1.0325 1.05 0.95 0.92 0.92 0.93 0.94 0.95 0.97 0.98 0.99 1.00 1.01 1.02 1.03 1.03 1.0430 1.12 1.01 0.96 0.95 0.96 0.96 0.97 0.98 0.99 1.00 1.01 1.02 1.03 1.03 1.04 1.0535 1.18 1.06 1.00 0.98 0.98 0.98 0.99 1.00 1.01 1.01 1.02 1.03 1.03 1.04 1.05 1.0540 1.22 1.10 1.04 1.01 1.00 1.00 1.01 1.01 1.02 1.02 1.03 1.04 1.04 1.05 1.05 1.0645 1.26 1.14 1.07 1.04 1.02 1.02 1.02 1.02 1.03 1.03 1.04 1.04 1.05 1.05 1.06 1.0650 1.29 1.16 1.09 1.06 1.04 1.04 1.03 1.04 1.04 1.04 1.05 1.05 1.05 1.06 1.06 1.0755 1.31 1.19 1.11 1.08 1.06 1.05 1.05 1.05 1.05 1.05 1.05 1.06 1.06 1.06 1.07 1.0760 1.33 1.21 1.13 1.09 1.07 1.06 1.06 1.06 1.06 1.06 1.06 1.06 1.07 1.07 1.07 1.0765 1.34 1.22 1.15 1.11 1.09 1.08 1.07 1.07 1.07 1.07 1.07 1.07 1.07 1.07 1.08 1.0870 1.35 1.24 1.16 1.12 1.10 1.09 1.08 1.07 1.07 1.07 1.07 1.07 1.08 1.08 1.08 1.0875 1.35 1.25 1.17 1.13 1.11 1.10 1.09 1.08 1.08 1.08 1.08 1.08 1.08 1.08 1.08 1.09
Integral Gain=5 1 4.23 2.11 1.44 0.91 0.83 0.85 0.93 1.02 1.07 1.08 1.07 1.05 1.04 1.02 1.01 1.025 1.01 0.84 0.81 0.80 0.81 0.85 0.90 0.94 0.96 0.98 0.99 1.00 1.01 1.01 1.02 1.03
10 0.93 0.84 0.82 0.83 0.86 0.88 0.91 0.93 0.95 0.97 0.98 1.00 1.01 1.02 1.02 1.0315 0.99 0.88 0.86 0.87 0.89 0.91 0.93 0.95 0.96 0.98 0.99 1.00 1.01 1.02 1.03 1.0420 1.06 0.94 0.91 0.91 0.92 0.93 0.95 0.96 0.98 0.99 1.00 1.01 1.02 1.03 1.03 1.0425 1.12 1.00 0.95 0.94 0.95 0.95 0.97 0.98 0.99 1.00 1.01 1.02 1.02 1.03 1.04 1.0530 1.18 1.05 0.99 0.97 0.97 0.98 0.98 0.99 1.00 1.01 1.02 1.02 1.03 1.04 1.04 1.0535 1.23 1.09 1.02 1.00 0.99 0.99 1.00 1.01 1.01 1.02 1.03 1.03 1.04 1.04 1.05 1.0540 1.27 1.13 1.06 1.03 1.01 1.01 1.01 1.02 1.02 1.03 1.03 1.04 1.04 1.05 1.05 1.0645 1.30 1.16 1.08 1.05 1.03 1.03 1.03 1.03 1.03 1.04 1.04 1.05 1.05 1.05 1.06 1.0650 1.32 1.19 1.11 1.07 1.05 1.04 1.04 1.04 1.04 1.05 1.05 1.05 1.06 1.06 1.06 1.0755 1.34 1.21 1.13 1.09 1.07 1.06 1.05 1.05 1.05 1.05 1.06 1.06 1.06 1.07 1.07 1.0760 1.35 1.22 1.14 1.10 1.08 1.07 1.06 1.06 1.06 1.06 1.06 1.07 1.07 1.07 1.07 1.0865 1.36 1.24 1.16 1.12 1.09 1.08 1.07 1.07 1.07 1.07 1.07 1.07 1.07 1.08 1.08 1.0870 1.36 1.25 1.17 1.13 1.11 1.09 1.08 1.08 1.08 1.08 1.08 1.08 1.08 1.08 1.08 1.0875 1.37 1.26 1.18 1.14 1.12 1.10 1.09 1.09 1.08 1.08 1.08 1.08 1.08 1.08 1.09 1.09
Integral Gain=10 1 3.98 4.42 2.26 1.61 1.26 1.23 1.22 1.04 0.96 0.96 0.95 0.96 0.99 1.02 1.05 1.075 2.30 1.09 0.98 0.93 0.92 0.95 0.94 0.92 0.92 0.93 0.94 0.96 0.99 1.01 1.03 1.05
10 1.19 0.96 0.90 0.90 0.90 0.91 0.93 0.94 0.95 0.96 0.97 0.98 1.00 1.01 1.03 1.0415 1.16 0.97 0.92 0.91 0.92 0.93 0.94 0.95 0.97 0.98 0.99 1.00 1.01 1.02 1.03 1.0420 1.18 1.01 0.95 0.94 0.94 0.95 0.96 0.97 0.98 0.99 1.00 1.01 1.02 1.03 1.03 1.0425 1.22 1.05 0.98 0.96 0.96 0.97 0.98 0.99 1.00 1.00 1.01 1.02 1.03 1.03 1.04 1.0530 1.26 1.09 1.02 0.99 0.99 0.99 0.99 1.00 1.01 1.01 1.02 1.03 1.03 1.04 1.05 1.0535 1.29 1.13 1.05 1.02 1.01 1.01 1.01 1.01 1.02 1.02 1.03 1.04 1.04 1.05 1.05 1.0640 1.32 1.16 1.08 1.04 1.03 1.02 1.02 1.03 1.03 1.03 1.04 1.04 1.05 1.05 1.06 1.0645 1.34 1.19 1.10 1.06 1.05 1.04 1.04 1.04 1.04 1.04 1.05 1.05 1.05 1.06 1.06 1.0750 1.36 1.21 1.12 1.08 1.06 1.05 1.05 1.05 1.05 1.05 1.05 1.06 1.06 1.06 1.07 1.0755 1.38 1.23 1.14 1.10 1.08 1.07 1.06 1.06 1.06 1.06 1.06 1.06 1.07 1.07 1.07 1.0760 1.39 1.25 1.16 1.12 1.09 1.08 1.07 1.07 1.07 1.07 1.07 1.07 1.07 1.07 1.08 1.0865 1.39 1.26 1.17 1.13 1.10 1.09 1.08 1.08 1.07 1.07 1.07 1.07 1.08 1.08 1.08 1.0870 1.39 1.27 1.19 1.14 1.11 1.10 1.09 1.08 1.08 1.08 1.08 1.08 1.08 1.08 1.08 1.0975 1.39 1.27 1.19 1.15 1.12 1.11 1.10 1.09 1.09 1.09 1.09 1.09 1.09 1.09 1.09 1.09

88
Table C-8: Actuator duty cycle obtained using the non-linear model and wind3 as wind input file.
Derivative GainProportional
Gain 1 5 10 15 20 25 30 35 40 45 50 55 60 65 70 75
Integral Gain=1 1 0.29 0.41 0.62 0.76 0.85 0.92 0.97 1.01 1.04 1.07 1.09 1.11 1.12 1.14 1.15 1.165 0.50 0.51 0.66 0.78 0.86 0.93 0.98 1.02 1.05 1.07 1.09 1.11 1.13 1.14 1.15 1.16
10 0.75 0.70 0.76 0.83 0.90 0.95 1.00 1.03 1.06 1.08 1.10 1.12 1.14 1.15 1.16 1.1715 0.96 0.85 0.86 0.90 0.94 0.99 1.02 1.05 1.07 1.09 1.11 1.13 1.14 1.16 1.17 1.1820 1.12 0.98 0.94 0.96 0.99 1.02 1.05 1.07 1.09 1.11 1.12 1.14 1.15 1.16 1.17 1.1825 1.24 1.08 1.02 1.02 1.03 1.05 1.07 1.09 1.11 1.12 1.13 1.15 1.16 1.17 1.18 1.1930 1.33 1.16 1.08 1.06 1.07 1.08 1.09 1.11 1.12 1.13 1.15 1.16 1.17 1.18 1.18 1.1935 1.39 1.23 1.14 1.11 1.10 1.11 1.12 1.13 1.14 1.15 1.16 1.17 1.17 1.18 1.19 1.2040 1.44 1.28 1.19 1.15 1.13 1.13 1.14 1.14 1.15 1.16 1.17 1.18 1.18 1.19 1.20 1.2045 1.47 1.32 1.22 1.18 1.16 1.16 1.16 1.16 1.17 1.17 1.18 1.18 1.19 1.20 1.20 1.2150 1.49 1.35 1.26 1.21 1.19 1.18 1.17 1.18 1.18 1.18 1.19 1.19 1.20 1.20 1.21 1.2155 1.51 1.38 1.28 1.23 1.21 1.20 1.19 1.19 1.19 1.19 1.20 1.20 1.21 1.21 1.21 1.2260 1.53 1.39 1.31 1.26 1.23 1.21 1.21 1.20 1.20 1.20 1.21 1.21 1.21 1.22 1.22 1.2265 1.54 1.41 1.32 1.27 1.25 1.23 1.22 1.22 1.21 1.21 1.21 1.22 1.22 1.22 1.23 1.2370 1.54 1.42 1.34 1.29 1.26 1.24 1.23 1.23 1.22 1.22 1.22 1.22 1.23 1.23 1.23 1.2375 1.55 1.43 1.35 1.30 1.27 1.26 1.24 1.24 1.23 1.23 1.23 1.23 1.23 1.23 1.24 1.24
Integral Gain=5 1 3.31 1.19 0.92 0.77 0.82 0.90 0.95 1.00 1.03 1.06 1.10 1.12 1.14 1.15 1.16 1.175 1.00 0.74 0.70 0.77 0.84 0.91 0.96 1.01 1.04 1.07 1.09 1.12 1.13 1.15 1.16 1.17
10 0.98 0.80 0.79 0.84 0.89 0.95 0.99 1.02 1.05 1.08 1.10 1.12 1.14 1.15 1.16 1.1715 1.11 0.92 0.89 0.91 0.95 0.98 1.02 1.05 1.07 1.09 1.11 1.13 1.14 1.16 1.17 1.1820 1.23 1.04 0.97 0.97 0.99 1.02 1.05 1.07 1.09 1.11 1.12 1.14 1.15 1.16 1.17 1.1825 1.33 1.13 1.05 1.03 1.04 1.05 1.07 1.09 1.11 1.12 1.13 1.15 1.16 1.17 1.18 1.1930 1.40 1.21 1.11 1.08 1.08 1.08 1.10 1.11 1.12 1.13 1.15 1.16 1.17 1.18 1.18 1.1935 1.45 1.27 1.16 1.12 1.11 1.11 1.12 1.13 1.14 1.15 1.16 1.17 1.18 1.18 1.19 1.2040 1.49 1.31 1.21 1.16 1.14 1.14 1.14 1.15 1.15 1.16 1.17 1.18 1.18 1.19 1.20 1.2045 1.51 1.35 1.24 1.19 1.17 1.16 1.16 1.16 1.17 1.17 1.18 1.19 1.19 1.20 1.20 1.2150 1.53 1.38 1.27 1.22 1.20 1.18 1.18 1.18 1.18 1.18 1.19 1.19 1.20 1.20 1.21 1.2155 1.55 1.40 1.30 1.25 1.22 1.20 1.20 1.19 1.19 1.20 1.20 1.20 1.21 1.21 1.22 1.2260 1.56 1.41 1.32 1.27 1.24 1.22 1.21 1.21 1.20 1.21 1.21 1.21 1.21 1.22 1.22 1.2265 1.56 1.43 1.34 1.28 1.25 1.23 1.22 1.22 1.22 1.22 1.22 1.22 1.22 1.22 1.23 1.2370 1.57 1.44 1.35 1.30 1.27 1.25 1.24 1.23 1.23 1.22 1.22 1.23 1.23 1.23 1.23 1.2475 1.57 1.45 1.36 1.31 1.28 1.26 1.25 1.24 1.24 1.23 1.23 1.23 1.23 1.24 1.24 1.24
Integral Gain=10 1 3.59 3.69 2.39 1.52 0.99 1.11 0.99 1.03 1.02 1.04 1.08 1.10 1.12 1.14 1.15 1.165 2.73 1.16 0.92 0.87 0.89 0.93 0.96 0.99 1.03 1.05 1.08 1.10 1.12 1.14 1.15 1.16
10 1.38 0.99 0.88 0.89 0.92 0.95 0.99 1.02 1.05 1.07 1.09 1.11 1.13 1.14 1.15 1.1715 1.36 1.04 0.95 0.94 0.96 0.99 1.02 1.04 1.07 1.09 1.11 1.12 1.14 1.15 1.16 1.1720 1.41 1.13 1.02 1.00 1.01 1.03 1.05 1.07 1.09 1.10 1.12 1.13 1.15 1.16 1.17 1.1825 1.46 1.21 1.09 1.05 1.05 1.06 1.08 1.09 1.11 1.12 1.13 1.15 1.16 1.17 1.18 1.1830 1.50 1.27 1.15 1.10 1.09 1.09 1.10 1.11 1.12 1.14 1.15 1.16 1.17 1.17 1.18 1.1935 1.54 1.32 1.20 1.14 1.13 1.12 1.13 1.13 1.14 1.15 1.16 1.17 1.17 1.18 1.19 1.2040 1.56 1.36 1.24 1.18 1.16 1.15 1.15 1.15 1.16 1.16 1.17 1.18 1.18 1.19 1.20 1.2045 1.57 1.39 1.27 1.21 1.18 1.17 1.17 1.17 1.17 1.18 1.18 1.19 1.19 1.20 1.20 1.2150 1.58 1.41 1.30 1.24 1.21 1.19 1.19 1.18 1.18 1.19 1.19 1.20 1.20 1.21 1.21 1.2155 1.59 1.43 1.32 1.26 1.23 1.21 1.20 1.20 1.20 1.20 1.20 1.20 1.21 1.21 1.22 1.2260 1.59 1.44 1.34 1.28 1.25 1.23 1.22 1.21 1.21 1.21 1.21 1.21 1.22 1.22 1.22 1.2365 1.59 1.45 1.35 1.30 1.26 1.24 1.23 1.22 1.22 1.22 1.22 1.22 1.22 1.23 1.23 1.2370 1.59 1.46 1.37 1.31 1.28 1.26 1.24 1.24 1.23 1.23 1.23 1.23 1.23 1.23 1.23 1.2475 1.59 1.46 1.38 1.32 1.29 1.27 1.25 1.25 1.24 1.24 1.24 1.24 1.24 1.24 1.24 1.24

89
Table C-9: Actuator duty cycle obtained using the non-linear model and wind4 as wind input file.
Derivative GainProportional
Gain 1 5 10 15 20 25 30 35 40 45 50 55 60 65 70 75
Integral Gain=1 1 0.91 0.71 0.79 0.94 1.06 1.15 1.21 1.26 1.30 1.33 1.36 1.39 1.41 1.43 1.45 1.465 0.79 0.76 0.87 0.99 1.09 1.16 1.22 1.27 1.31 1.34 1.37 1.39 1.42 1.43 1.45 1.46
10 1.04 0.95 0.99 1.07 1.15 1.21 1.26 1.30 1.33 1.36 1.39 1.41 1.43 1.44 1.46 1.4715 1.25 1.11 1.11 1.16 1.21 1.25 1.29 1.33 1.36 1.38 1.40 1.42 1.44 1.45 1.47 1.4820 1.41 1.25 1.21 1.23 1.26 1.29 1.32 1.35 1.38 1.40 1.42 1.44 1.45 1.46 1.48 1.4925 1.54 1.37 1.30 1.30 1.31 1.33 1.36 1.38 1.40 1.42 1.43 1.45 1.46 1.47 1.48 1.4930 1.64 1.46 1.37 1.35 1.36 1.37 1.39 1.40 1.42 1.43 1.45 1.46 1.47 1.48 1.49 1.5035 1.72 1.53 1.44 1.40 1.40 1.40 1.41 1.42 1.44 1.45 1.46 1.47 1.48 1.49 1.50 1.5140 1.79 1.59 1.49 1.45 1.43 1.43 1.44 1.45 1.46 1.46 1.47 1.48 1.49 1.50 1.51 1.5245 1.85 1.64 1.54 1.49 1.47 1.46 1.46 1.47 1.47 1.48 1.49 1.50 1.50 1.51 1.52 1.5250 1.89 1.69 1.58 1.52 1.50 1.48 1.48 1.48 1.49 1.49 1.50 1.51 1.51 1.52 1.52 1.5355 1.94 1.72 1.61 1.55 1.52 1.51 1.50 1.50 1.50 1.51 1.51 1.52 1.52 1.53 1.53 1.5460 1.97 1.75 1.64 1.58 1.55 1.53 1.52 1.52 1.52 1.52 1.52 1.53 1.53 1.53 1.54 1.5465 1.99 1.78 1.66 1.60 1.57 1.55 1.54 1.53 1.53 1.53 1.53 1.54 1.54 1.54 1.55 1.5570 2.01 1.80 1.68 1.62 1.59 1.56 1.55 1.54 1.54 1.54 1.54 1.54 1.55 1.55 1.55 1.5675 2.02 1.82 1.70 1.64 1.60 1.58 1.57 1.56 1.55 1.55 1.55 1.55 1.55 1.56 1.56 1.56
Integral Gain=5 1 4.96 2.24 1.25 1.16 1.25 1.24 1.31 1.36 1.38 1.39 1.42 1.44 1.45 1.45 1.46 1.465 1.41 1.02 1.03 1.08 1.15 1.21 1.26 1.30 1.34 1.37 1.39 1.42 1.43 1.45 1.46 1.47
10 1.34 1.10 1.07 1.12 1.17 1.23 1.28 1.32 1.35 1.38 1.40 1.42 1.44 1.45 1.46 1.4815 1.45 1.22 1.16 1.18 1.22 1.27 1.30 1.34 1.37 1.39 1.41 1.43 1.45 1.46 1.47 1.4820 1.56 1.34 1.26 1.26 1.28 1.31 1.33 1.36 1.38 1.41 1.42 1.44 1.46 1.47 1.48 1.4925 1.64 1.43 1.34 1.32 1.33 1.34 1.36 1.38 1.40 1.42 1.44 1.45 1.46 1.48 1.49 1.5030 1.73 1.51 1.41 1.38 1.37 1.38 1.39 1.41 1.42 1.44 1.45 1.46 1.47 1.49 1.50 1.5035 1.80 1.58 1.47 1.42 1.41 1.41 1.42 1.43 1.44 1.45 1.46 1.47 1.48 1.49 1.50 1.5140 1.86 1.63 1.52 1.47 1.45 1.44 1.44 1.45 1.46 1.47 1.48 1.49 1.49 1.50 1.51 1.5245 1.91 1.68 1.56 1.50 1.48 1.47 1.47 1.47 1.48 1.48 1.49 1.50 1.50 1.51 1.52 1.5350 1.95 1.72 1.60 1.54 1.51 1.49 1.49 1.49 1.49 1.50 1.50 1.51 1.51 1.52 1.53 1.5355 1.98 1.75 1.63 1.57 1.53 1.52 1.51 1.51 1.51 1.51 1.51 1.52 1.52 1.53 1.53 1.5460 2.01 1.78 1.65 1.59 1.56 1.54 1.53 1.52 1.52 1.52 1.53 1.53 1.53 1.54 1.54 1.5465 2.03 1.80 1.68 1.61 1.58 1.55 1.54 1.54 1.53 1.53 1.54 1.54 1.54 1.54 1.55 1.5570 2.05 1.82 1.70 1.63 1.60 1.57 1.56 1.55 1.55 1.54 1.55 1.55 1.55 1.55 1.55 1.5675 2.05 1.84 1.71 1.65 1.61 1.59 1.57 1.56 1.56 1.55 1.55 1.55 1.56 1.56 1.56 1.56
Integral Gain=10 1 4.21 4.34 3.09 1.44 1.74 1.67 1.34 1.37 1.39 1.45 1.46 1.43 1.43 1.47 1.50 1.535 3.16 1.92 1.21 1.13 1.21 1.26 1.28 1.31 1.35 1.38 1.41 1.42 1.44 1.46 1.47 1.49
10 1.88 1.36 1.16 1.15 1.20 1.24 1.28 1.32 1.35 1.38 1.41 1.43 1.44 1.46 1.48 1.4915 1.77 1.39 1.24 1.22 1.24 1.27 1.31 1.34 1.37 1.39 1.42 1.43 1.45 1.47 1.48 1.4920 1.77 1.46 1.32 1.29 1.30 1.32 1.34 1.37 1.39 1.41 1.43 1.44 1.46 1.47 1.48 1.5025 1.80 1.53 1.39 1.35 1.35 1.36 1.37 1.39 1.41 1.43 1.44 1.46 1.47 1.48 1.49 1.5030 1.85 1.59 1.46 1.41 1.39 1.39 1.40 1.42 1.43 1.44 1.46 1.47 1.48 1.49 1.50 1.5135 1.90 1.64 1.51 1.45 1.43 1.43 1.43 1.44 1.45 1.46 1.47 1.48 1.49 1.50 1.51 1.5140 1.95 1.69 1.55 1.49 1.47 1.46 1.46 1.46 1.47 1.47 1.48 1.49 1.50 1.51 1.51 1.5245 1.98 1.73 1.59 1.53 1.50 1.48 1.48 1.48 1.48 1.49 1.49 1.50 1.51 1.51 1.52 1.5350 2.02 1.76 1.63 1.56 1.52 1.51 1.50 1.50 1.50 1.50 1.51 1.51 1.52 1.52 1.53 1.5355 2.05 1.79 1.65 1.59 1.55 1.53 1.52 1.51 1.51 1.52 1.52 1.52 1.53 1.53 1.54 1.5460 2.07 1.81 1.68 1.61 1.57 1.55 1.53 1.53 1.53 1.53 1.53 1.53 1.54 1.54 1.54 1.5565 2.09 1.83 1.70 1.63 1.59 1.56 1.55 1.54 1.54 1.54 1.54 1.54 1.54 1.55 1.55 1.5570 2.09 1.85 1.72 1.65 1.61 1.58 1.57 1.56 1.55 1.55 1.55 1.55 1.55 1.55 1.56 1.5675 2.10 1.86 1.73 1.66 1.62 1.60 1.58 1.57 1.56 1.56 1.56 1.56 1.56 1.56 1.56 1.57

90
Table C-10: Actuator duty cycle obtained using the non-linear model and wind5 as wind input file.
Derivative GainProportional
Gain 1 5 10 15 20 25 30 35 40 45 50 55 60 65 70 75
Integral Gain=1 1 0.41 0.45 0.61 0.72 0.79 0.85 0.89 0.92 0.95 0.97 0.98 0.99 1.01 1.02 1.03 1.035 0.50 0.49 0.59 0.69 0.77 0.83 0.87 0.91 0.94 0.96 0.98 1.00 1.01 1.02 1.03 1.04
10 0.67 0.64 0.69 0.74 0.80 0.85 0.89 0.92 0.95 0.97 0.99 1.00 1.02 1.03 1.04 1.0515 0.84 0.76 0.77 0.80 0.84 0.87 0.91 0.93 0.96 0.98 0.99 1.01 1.02 1.03 1.04 1.0520 0.99 0.87 0.84 0.85 0.88 0.90 0.93 0.95 0.97 0.99 1.00 1.02 1.03 1.04 1.05 1.0525 1.10 0.96 0.90 0.90 0.91 0.93 0.95 0.97 0.98 1.00 1.01 1.02 1.03 1.04 1.05 1.0630 1.20 1.04 0.96 0.95 0.95 0.96 0.97 0.98 1.00 1.01 1.02 1.03 1.04 1.05 1.06 1.0635 1.28 1.10 1.01 0.99 0.98 0.98 0.99 1.00 1.01 1.02 1.03 1.04 1.05 1.06 1.06 1.0740 1.35 1.16 1.06 1.02 1.01 1.01 1.01 1.02 1.02 1.03 1.04 1.05 1.05 1.06 1.07 1.0745 1.41 1.20 1.10 1.05 1.03 1.03 1.03 1.03 1.04 1.04 1.05 1.06 1.06 1.07 1.07 1.0850 1.45 1.24 1.13 1.08 1.06 1.05 1.04 1.05 1.05 1.05 1.06 1.06 1.07 1.07 1.08 1.0855 1.48 1.27 1.16 1.11 1.08 1.06 1.06 1.06 1.06 1.06 1.07 1.07 1.07 1.08 1.08 1.0960 1.51 1.30 1.18 1.13 1.10 1.08 1.07 1.07 1.07 1.07 1.07 1.08 1.08 1.08 1.09 1.0965 1.52 1.32 1.20 1.15 1.11 1.10 1.09 1.08 1.08 1.08 1.08 1.08 1.09 1.09 1.09 1.1070 1.53 1.34 1.22 1.16 1.13 1.11 1.10 1.09 1.09 1.09 1.09 1.09 1.09 1.10 1.10 1.1075 1.53 1.35 1.24 1.18 1.14 1.12 1.11 1.10 1.10 1.10 1.10 1.10 1.10 1.10 1.10 1.10
Integral Gain=5 1 5.26 1.68 1.56 1.20 0.74 0.83 0.87 0.89 0.92 0.96 0.99 1.00 1.01 1.02 1.04 1.055 0.88 0.79 0.74 0.73 0.75 0.79 0.84 0.88 0.91 0.94 0.97 0.99 1.00 1.02 1.03 1.04
10 0.85 0.75 0.75 0.77 0.80 0.84 0.87 0.90 0.93 0.95 0.98 0.99 1.01 1.02 1.04 1.0515 0.97 0.83 0.81 0.82 0.85 0.87 0.90 0.93 0.95 0.97 0.99 1.00 1.02 1.03 1.04 1.0520 1.09 0.92 0.87 0.87 0.89 0.91 0.93 0.95 0.97 0.98 1.00 1.01 1.02 1.03 1.04 1.0525 1.18 1.00 0.93 0.92 0.92 0.93 0.95 0.97 0.98 1.00 1.01 1.02 1.03 1.04 1.05 1.0630 1.27 1.08 0.99 0.96 0.96 0.96 0.97 0.99 1.00 1.01 1.02 1.03 1.04 1.05 1.06 1.0635 1.34 1.14 1.03 1.00 0.99 0.99 0.99 1.00 1.01 1.02 1.03 1.04 1.05 1.05 1.06 1.0740 1.41 1.19 1.08 1.03 1.02 1.01 1.01 1.02 1.03 1.03 1.04 1.05 1.05 1.06 1.07 1.0745 1.46 1.23 1.11 1.06 1.04 1.03 1.03 1.03 1.04 1.04 1.05 1.06 1.06 1.07 1.07 1.0850 1.50 1.27 1.15 1.09 1.06 1.05 1.05 1.05 1.05 1.05 1.06 1.06 1.07 1.07 1.08 1.0855 1.53 1.30 1.17 1.12 1.09 1.07 1.06 1.06 1.06 1.06 1.07 1.07 1.08 1.08 1.08 1.0960 1.54 1.32 1.20 1.14 1.10 1.09 1.08 1.07 1.07 1.07 1.08 1.08 1.08 1.09 1.09 1.0965 1.55 1.34 1.22 1.16 1.12 1.10 1.09 1.09 1.08 1.08 1.08 1.09 1.09 1.09 1.09 1.1070 1.56 1.35 1.23 1.17 1.14 1.12 1.10 1.10 1.09 1.09 1.09 1.09 1.09 1.10 1.10 1.1075 1.55 1.36 1.25 1.19 1.15 1.13 1.11 1.11 1.10 1.10 1.10 1.10 1.10 1.10 1.10 1.11
Integral Gain=10 1 3.76 4.67 3.55 2.75 1.01 1.22 1.44 1.32 1.01 0.90 0.93 0.98 1.00 1.02 1.03 1.035 1.51 0.90 0.89 0.94 0.90 0.93 0.95 0.94 0.92 0.92 0.93 0.96 0.98 1.00 1.01 1.02
10 1.18 0.84 0.82 0.85 0.87 0.90 0.91 0.93 0.93 0.95 0.96 0.98 0.99 1.01 1.02 1.0315 1.18 0.91 0.86 0.86 0.88 0.90 0.92 0.94 0.95 0.97 0.98 0.99 1.01 1.02 1.03 1.0420 1.24 1.00 0.91 0.90 0.91 0.92 0.94 0.95 0.97 0.98 0.99 1.01 1.02 1.03 1.04 1.0525 1.30 1.07 0.96 0.94 0.94 0.95 0.96 0.97 0.98 1.00 1.01 1.02 1.03 1.04 1.05 1.0530 1.37 1.13 1.02 0.98 0.97 0.97 0.98 0.99 1.00 1.01 1.02 1.03 1.04 1.05 1.05 1.0635 1.43 1.19 1.06 1.02 1.00 1.00 1.00 1.01 1.01 1.02 1.03 1.04 1.05 1.05 1.06 1.0740 1.49 1.23 1.10 1.05 1.03 1.02 1.02 1.02 1.03 1.03 1.04 1.05 1.05 1.06 1.07 1.0745 1.53 1.27 1.14 1.08 1.05 1.04 1.04 1.04 1.04 1.05 1.05 1.06 1.06 1.07 1.07 1.0850 1.56 1.30 1.17 1.11 1.07 1.06 1.05 1.05 1.05 1.06 1.06 1.06 1.07 1.07 1.08 1.0855 1.58 1.33 1.19 1.13 1.10 1.08 1.07 1.07 1.06 1.07 1.07 1.07 1.08 1.08 1.08 1.0960 1.59 1.35 1.22 1.15 1.11 1.09 1.08 1.08 1.08 1.08 1.08 1.08 1.08 1.09 1.09 1.0965 1.60 1.37 1.23 1.17 1.13 1.11 1.10 1.09 1.09 1.08 1.09 1.09 1.09 1.09 1.09 1.1070 1.60 1.38 1.25 1.18 1.15 1.12 1.11 1.10 1.10 1.09 1.09 1.09 1.10 1.10 1.10 1.1075 1.59 1.39 1.26 1.20 1.16 1.13 1.12 1.11 1.10 1.10 1.10 1.10 1.10 1.10 1.10 1.11

91
Table C-11: Actuator duty cycle obtained using the non-linear model and highwind4 as wind input file.
Derivative GainProportional
Gain 1 5 10 15 20 25 30 35 40 45 50 55 60 65 70 75
Integral Gain=1 1 1.06 1.03 1.13 1.19 1.31 1.41 1.48 1.55 1.59 1.63 1.66 1.69 1.71 1.73 1.75 1.765 1.21 1.08 1.16 1.28 1.37 1.45 1.51 1.56 1.60 1.64 1.67 1.70 1.72 1.74 1.76 1.77
10 1.45 1.34 1.35 1.41 1.47 1.52 1.57 1.61 1.64 1.67 1.70 1.72 1.74 1.76 1.77 1.7915 1.65 1.52 1.49 1.52 1.55 1.59 1.62 1.65 1.68 1.70 1.72 1.74 1.76 1.77 1.79 1.8020 1.79 1.65 1.60 1.60 1.62 1.64 1.66 1.69 1.71 1.73 1.74 1.76 1.77 1.79 1.80 1.8125 1.90 1.75 1.68 1.67 1.67 1.69 1.70 1.72 1.74 1.75 1.77 1.78 1.79 1.80 1.81 1.8230 1.99 1.83 1.75 1.73 1.72 1.73 1.74 1.75 1.76 1.77 1.79 1.80 1.81 1.82 1.83 1.8435 2.06 1.90 1.81 1.77 1.76 1.76 1.77 1.78 1.78 1.79 1.80 1.81 1.82 1.83 1.84 1.8540 2.12 1.95 1.86 1.82 1.80 1.79 1.79 1.80 1.81 1.81 1.82 1.83 1.83 1.84 1.85 1.8645 2.17 2.00 1.90 1.85 1.83 1.82 1.82 1.82 1.82 1.83 1.83 1.84 1.85 1.85 1.86 1.8650 2.21 2.04 1.93 1.88 1.86 1.84 1.84 1.84 1.84 1.84 1.85 1.85 1.86 1.86 1.87 1.8755 2.23 2.07 1.96 1.91 1.88 1.87 1.86 1.86 1.86 1.86 1.86 1.86 1.87 1.87 1.88 1.8860 2.25 2.09 1.99 1.93 1.90 1.89 1.88 1.87 1.87 1.87 1.87 1.88 1.88 1.88 1.89 1.8965 2.26 2.11 2.01 1.95 1.92 1.90 1.89 1.89 1.88 1.88 1.88 1.89 1.89 1.89 1.89 1.9070 2.27 2.13 2.03 1.97 1.94 1.92 1.91 1.90 1.90 1.89 1.89 1.90 1.90 1.90 1.90 1.9075 2.28 2.14 2.04 1.99 1.95 1.93 1.92 1.91 1.91 1.90 1.90 1.90 1.90 1.91 1.91 1.91
Integral Gain=5 1 5.06 4.49 2.34 2.04 1.61 1.54 1.50 1.53 1.62 1.69 1.75 1.79 1.82 1.83 1.83 1.825 2.17 1.77 1.53 1.49 1.49 1.51 1.54 1.59 1.64 1.68 1.72 1.75 1.77 1.78 1.80 1.80
10 1.85 1.63 1.54 1.53 1.54 1.57 1.60 1.64 1.67 1.70 1.72 1.74 1.76 1.78 1.79 1.8015 1.90 1.68 1.61 1.60 1.61 1.63 1.65 1.68 1.70 1.72 1.74 1.75 1.77 1.78 1.80 1.8120 1.96 1.77 1.68 1.66 1.66 1.68 1.69 1.71 1.73 1.74 1.76 1.77 1.79 1.80 1.81 1.8225 2.03 1.84 1.75 1.72 1.71 1.72 1.73 1.74 1.75 1.77 1.78 1.79 1.80 1.81 1.82 1.8330 2.08 1.90 1.80 1.77 1.75 1.75 1.76 1.77 1.78 1.79 1.80 1.81 1.81 1.82 1.83 1.8435 2.14 1.95 1.85 1.81 1.79 1.78 1.79 1.79 1.80 1.81 1.81 1.82 1.83 1.84 1.84 1.8540 2.18 2.00 1.89 1.84 1.82 1.81 1.81 1.81 1.82 1.82 1.83 1.83 1.84 1.85 1.85 1.8645 2.22 2.04 1.93 1.88 1.85 1.84 1.83 1.83 1.83 1.84 1.84 1.85 1.85 1.86 1.86 1.8750 2.25 2.07 1.96 1.90 1.88 1.86 1.85 1.85 1.85 1.85 1.86 1.86 1.86 1.87 1.87 1.8855 2.28 2.10 1.99 1.93 1.90 1.88 1.87 1.87 1.87 1.87 1.87 1.87 1.87 1.88 1.88 1.8960 2.29 2.12 2.01 1.95 1.92 1.90 1.89 1.88 1.88 1.88 1.88 1.88 1.88 1.89 1.89 1.8965 2.30 2.14 2.03 1.97 1.93 1.91 1.90 1.90 1.89 1.89 1.89 1.89 1.89 1.89 1.90 1.9070 2.30 2.15 2.05 1.99 1.95 1.93 1.92 1.91 1.90 1.90 1.90 1.90 1.90 1.90 1.90 1.9175 2.30 2.16 2.06 2.00 1.97 1.94 1.93 1.92 1.91 1.91 1.91 1.91 1.91 1.91 1.91 1.91
Integral Gain=10 1 4.24 4.48 4.34 5.09 2.61 2.13 2.01 2.09 1.85 1.72 1.76 1.76 1.74 1.72 1.73 1.765 3.50 2.34 2.01 1.89 1.70 1.66 1.68 1.71 1.71 1.71 1.72 1.73 1.73 1.74 1.76 1.77
10 2.41 1.91 1.76 1.71 1.67 1.67 1.68 1.69 1.71 1.72 1.73 1.74 1.76 1.77 1.78 1.8015 2.22 1.87 1.74 1.70 1.69 1.69 1.70 1.71 1.73 1.74 1.75 1.77 1.78 1.79 1.80 1.8120 2.18 1.91 1.78 1.74 1.73 1.73 1.73 1.74 1.75 1.76 1.78 1.79 1.80 1.81 1.82 1.8325 2.18 1.95 1.83 1.78 1.76 1.76 1.76 1.77 1.78 1.78 1.79 1.80 1.81 1.82 1.83 1.8430 2.20 1.99 1.87 1.81 1.79 1.79 1.79 1.79 1.80 1.80 1.81 1.82 1.83 1.83 1.84 1.8535 2.23 2.03 1.91 1.85 1.82 1.81 1.81 1.81 1.82 1.82 1.83 1.83 1.84 1.85 1.85 1.8640 2.26 2.06 1.94 1.88 1.85 1.84 1.83 1.83 1.83 1.84 1.84 1.85 1.85 1.86 1.86 1.8745 2.29 2.09 1.97 1.91 1.88 1.86 1.85 1.85 1.85 1.85 1.85 1.86 1.86 1.87 1.87 1.8850 2.32 2.12 1.99 1.93 1.90 1.88 1.87 1.86 1.86 1.86 1.87 1.87 1.87 1.88 1.88 1.8855 2.33 2.14 2.02 1.95 1.92 1.90 1.89 1.88 1.88 1.88 1.88 1.88 1.88 1.88 1.89 1.8960 2.34 2.16 2.04 1.97 1.94 1.91 1.90 1.89 1.89 1.89 1.89 1.89 1.89 1.89 1.90 1.9065 2.34 2.17 2.05 1.99 1.95 1.93 1.92 1.91 1.90 1.90 1.90 1.90 1.90 1.90 1.90 1.9170 2.34 2.18 2.07 2.01 1.97 1.94 1.93 1.92 1.91 1.91 1.91 1.91 1.91 1.91 1.91 1.9175 2.33 2.19 2.08 2.02 1.98 1.95 1.94 1.93 1.92 1.92 1.92 1.92 1.91 1.92 1.92 1.92

92
Table C-12: Actuator duty cycle obtained using the non-linear model averaged over five wind input cases.
Derivative GainProportional
Gain 1 5 10 15 20 25 30 35 40 45 50 55 60 65 70 75
Integral Gain=1 1 0.68 0.65 0.77 0.87 0.96 1.04 1.09 1.13 1.16 1.18 1.20 1.22 1.24 1.25 1.27 1.285 0.73 0.69 0.79 0.89 0.98 1.04 1.09 1.13 1.16 1.19 1.21 1.23 1.25 1.26 1.28 1.29
10 0.93 0.87 0.91 0.97 1.03 1.08 1.12 1.15 1.18 1.21 1.23 1.25 1.26 1.27 1.29 1.3015 1.11 1.01 1.01 1.04 1.08 1.12 1.15 1.18 1.20 1.22 1.24 1.26 1.27 1.28 1.30 1.3120 1.26 1.13 1.09 1.10 1.13 1.15 1.18 1.20 1.22 1.24 1.26 1.27 1.28 1.29 1.30 1.3125 1.37 1.22 1.17 1.16 1.17 1.19 1.21 1.22 1.24 1.26 1.27 1.28 1.29 1.30 1.31 1.3230 1.46 1.30 1.23 1.21 1.21 1.22 1.23 1.25 1.26 1.27 1.28 1.29 1.30 1.31 1.32 1.3335 1.53 1.36 1.28 1.25 1.24 1.25 1.26 1.27 1.28 1.29 1.29 1.30 1.31 1.32 1.33 1.3340 1.58 1.42 1.33 1.29 1.28 1.27 1.28 1.28 1.29 1.30 1.31 1.31 1.32 1.33 1.33 1.3445 1.63 1.46 1.36 1.32 1.30 1.30 1.30 1.30 1.31 1.31 1.32 1.32 1.33 1.34 1.34 1.3550 1.67 1.50 1.40 1.35 1.33 1.32 1.31 1.32 1.32 1.32 1.33 1.33 1.34 1.34 1.35 1.3555 1.70 1.53 1.43 1.38 1.35 1.34 1.33 1.33 1.33 1.33 1.34 1.34 1.35 1.35 1.35 1.3660 1.72 1.55 1.45 1.40 1.37 1.35 1.35 1.34 1.34 1.34 1.35 1.35 1.35 1.36 1.36 1.3665 1.73 1.57 1.47 1.42 1.39 1.37 1.36 1.36 1.35 1.35 1.36 1.36 1.36 1.36 1.37 1.3770 1.74 1.58 1.49 1.43 1.40 1.38 1.37 1.37 1.36 1.36 1.36 1.37 1.37 1.37 1.37 1.3875 1.74 1.60 1.50 1.45 1.42 1.40 1.39 1.38 1.37 1.37 1.37 1.37 1.37 1.38 1.38 1.38
Integral Gain=5 1 4.57 2.34 1.50 1.21 1.05 1.07 1.11 1.16 1.20 1.24 1.26 1.28 1.29 1.30 1.30 1.315 1.29 1.03 0.96 0.97 1.01 1.05 1.10 1.14 1.18 1.21 1.23 1.25 1.27 1.28 1.29 1.30
10 1.19 1.02 0.99 1.02 1.05 1.09 1.13 1.16 1.19 1.22 1.24 1.25 1.27 1.28 1.30 1.3115 1.28 1.11 1.07 1.08 1.10 1.13 1.16 1.19 1.21 1.23 1.25 1.26 1.28 1.29 1.30 1.3120 1.38 1.20 1.14 1.13 1.15 1.17 1.19 1.21 1.23 1.25 1.26 1.27 1.29 1.30 1.31 1.3225 1.46 1.28 1.20 1.18 1.19 1.20 1.22 1.23 1.25 1.26 1.27 1.29 1.30 1.31 1.31 1.3230 1.53 1.35 1.26 1.23 1.23 1.23 1.24 1.25 1.26 1.28 1.29 1.30 1.31 1.31 1.32 1.3335 1.59 1.41 1.31 1.27 1.26 1.26 1.26 1.27 1.28 1.29 1.30 1.31 1.31 1.32 1.33 1.3440 1.64 1.45 1.35 1.31 1.29 1.28 1.28 1.29 1.30 1.30 1.31 1.32 1.32 1.33 1.34 1.3445 1.68 1.49 1.39 1.34 1.31 1.31 1.30 1.31 1.31 1.32 1.32 1.33 1.33 1.34 1.34 1.3550 1.71 1.52 1.42 1.36 1.34 1.33 1.32 1.32 1.32 1.33 1.33 1.34 1.34 1.35 1.35 1.3555 1.73 1.55 1.44 1.39 1.36 1.35 1.34 1.34 1.34 1.34 1.34 1.34 1.35 1.35 1.36 1.3660 1.75 1.57 1.47 1.41 1.38 1.36 1.35 1.35 1.35 1.35 1.35 1.35 1.36 1.36 1.36 1.3765 1.76 1.59 1.48 1.43 1.40 1.38 1.37 1.36 1.36 1.36 1.36 1.36 1.36 1.37 1.37 1.3770 1.77 1.60 1.50 1.44 1.41 1.39 1.38 1.37 1.37 1.37 1.37 1.37 1.37 1.37 1.37 1.3875 1.77 1.61 1.51 1.46 1.43 1.40 1.39 1.38 1.38 1.38 1.38 1.38 1.38 1.38 1.38 1.38
Integral Gain=10 1 3.96 4.32 3.13 2.48 1.52 1.47 1.40 1.37 1.25 1.21 1.23 1.24 1.25 1.27 1.29 1.315 2.64 1.48 1.20 1.15 1.12 1.15 1.16 1.17 1.18 1.20 1.22 1.23 1.25 1.27 1.28 1.30
10 1.61 1.21 1.10 1.10 1.11 1.13 1.16 1.18 1.20 1.21 1.23 1.25 1.26 1.28 1.29 1.3015 1.54 1.24 1.14 1.13 1.14 1.16 1.18 1.20 1.22 1.23 1.25 1.26 1.28 1.29 1.30 1.3120 1.55 1.30 1.20 1.17 1.18 1.19 1.20 1.22 1.24 1.25 1.26 1.28 1.29 1.30 1.31 1.3225 1.59 1.36 1.25 1.22 1.21 1.22 1.23 1.24 1.25 1.27 1.28 1.29 1.30 1.31 1.32 1.3230 1.64 1.41 1.30 1.26 1.25 1.25 1.25 1.26 1.27 1.28 1.29 1.30 1.31 1.32 1.32 1.3335 1.68 1.46 1.34 1.30 1.28 1.27 1.28 1.28 1.29 1.30 1.30 1.31 1.32 1.32 1.33 1.3440 1.71 1.50 1.38 1.33 1.31 1.30 1.30 1.30 1.30 1.31 1.31 1.32 1.33 1.33 1.34 1.3445 1.75 1.53 1.41 1.36 1.33 1.32 1.31 1.31 1.32 1.32 1.33 1.33 1.34 1.34 1.35 1.3550 1.77 1.56 1.44 1.38 1.35 1.34 1.33 1.33 1.33 1.33 1.34 1.34 1.34 1.35 1.35 1.3655 1.79 1.58 1.47 1.41 1.37 1.36 1.35 1.34 1.34 1.34 1.35 1.35 1.35 1.36 1.36 1.3660 1.80 1.60 1.49 1.43 1.39 1.37 1.36 1.36 1.35 1.35 1.35 1.36 1.36 1.36 1.37 1.3765 1.80 1.62 1.50 1.44 1.41 1.39 1.37 1.37 1.36 1.36 1.36 1.36 1.37 1.37 1.37 1.3770 1.80 1.63 1.52 1.46 1.42 1.40 1.39 1.38 1.37 1.37 1.37 1.37 1.37 1.37 1.38 1.3875 1.80 1.63 1.53 1.47 1.44 1.41 1.40 1.39 1.38 1.38 1.38 1.38 1.38 1.38 1.38 1.38

93
APPENDIX D
APPLICATION OF SYSTEMATIC METHODOLOGY
USING THE LINEAR MODEL II

94
Table D-1: RMS speed error obtained using the non-linear model and medwind2 as wind input file.
Derivative GainProportional
Gain 1 5 10 15 20 25 30 35 40 45 50 55 60 65 70 75
Integral Gain=1 1 0.73 0.82 0.88 0.88 0.90 0.96 1.04 1.11 1.13 1.13 1.10 1.05 1.01 0.96 0.91 0.865 0.38 0.39 0.41 0.43 0.45 0.46 0.48 0.49 0.50 0.50 0.50 0.49 0.49 0.48 0.47 0.46
10 0.25 0.25 0.25 0.26 0.26 0.27 0.28 0.28 0.28 0.29 0.29 0.29 0.29 0.29 0.29 0.2815 0.19 0.19 0.19 0.19 0.19 0.19 0.20 0.20 0.20 0.20 0.21 0.21 0.21 0.21 0.21 0.2120 0.15 0.15 0.15 0.15 0.16 0.16 0.16 0.16 0.16 0.16 0.16 0.17 0.17 0.17 0.17 0.1725 0.13 0.13 0.13 0.13 0.13 0.14 0.14 0.14 0.14 0.14 0.14 0.14 0.14 0.14 0.14 0.1430 0.12 0.12 0.12 0.12 0.12 0.12 0.12 0.12 0.12 0.12 0.12 0.13 0.13 0.13 0.13 0.1335 0.11 0.11 0.11 0.11 0.11 0.11 0.11 0.11 0.11 0.11 0.11 0.11 0.11 0.12 0.12 0.1240 0.10 0.10 0.10 0.10 0.10 0.10 0.10 0.10 0.10 0.10 0.11 0.11 0.11 0.11 0.11 0.1145 0.10 0.10 0.10 0.10 0.10 0.10 0.10 0.10 0.10 0.10 0.10 0.10 0.10 0.10 0.10 0.1050 0.09 0.09 0.09 0.09 0.09 0.09 0.09 0.09 0.09 0.09 0.09 0.09 0.09 0.09 0.09 0.0955 0.09 0.09 0.09 0.09 0.09 0.09 0.09 0.09 0.09 0.09 0.09 0.09 0.09 0.09 0.09 0.0960 0.08 0.08 0.08 0.08 0.08 0.08 0.08 0.08 0.08 0.08 0.08 0.08 0.08 0.08 0.08 0.0865 0.08 0.08 0.08 0.08 0.08 0.08 0.08 0.08 0.08 0.08 0.08 0.08 0.08 0.08 0.08 0.0870 0.08 0.08 0.08 0.08 0.08 0.08 0.08 0.08 0.08 0.08 0.08 0.08 0.08 0.08 0.08 0.0875 0.07 0.07 0.07 0.07 0.07 0.07 0.07 0.07 0.07 0.07 0.07 0.07 0.07 0.07 0.07 0.07
Integral Gain=5 1 0.59 0.54 0.43 0.43 0.33 0.28 0.26 0.32 0.39 0.45 0.48 0.50 0.50 0.49 0.47 0.465 0.21 0.19 0.19 0.18 0.18 0.17 0.18 0.19 0.21 0.22 0.23 0.24 0.25 0.25 0.25 0.25
10 0.14 0.13 0.13 0.13 0.13 0.13 0.13 0.14 0.14 0.15 0.15 0.15 0.16 0.16 0.16 0.1615 0.11 0.11 0.11 0.11 0.11 0.11 0.11 0.11 0.11 0.11 0.12 0.12 0.12 0.12 0.13 0.1320 0.10 0.09 0.09 0.09 0.09 0.09 0.09 0.09 0.09 0.10 0.10 0.10 0.10 0.10 0.10 0.1125 0.08 0.08 0.08 0.08 0.08 0.08 0.08 0.08 0.08 0.08 0.08 0.09 0.09 0.09 0.09 0.0930 0.07 0.07 0.07 0.07 0.07 0.07 0.07 0.07 0.07 0.07 0.08 0.08 0.08 0.08 0.08 0.0835 0.07 0.07 0.07 0.07 0.07 0.07 0.07 0.07 0.07 0.07 0.07 0.07 0.07 0.07 0.07 0.0740 0.06 0.06 0.06 0.06 0.06 0.06 0.06 0.06 0.06 0.06 0.06 0.06 0.06 0.06 0.06 0.0645 0.06 0.06 0.06 0.06 0.06 0.06 0.06 0.06 0.06 0.06 0.06 0.06 0.06 0.06 0.06 0.0650 0.05 0.05 0.05 0.05 0.05 0.05 0.05 0.05 0.05 0.05 0.05 0.05 0.05 0.05 0.05 0.0555 0.05 0.05 0.05 0.05 0.05 0.05 0.05 0.05 0.05 0.05 0.05 0.05 0.05 0.05 0.05 0.0560 0.05 0.05 0.04 0.04 0.04 0.04 0.04 0.05 0.05 0.05 0.05 0.05 0.05 0.05 0.05 0.0565 0.04 0.04 0.04 0.04 0.04 0.04 0.04 0.04 0.04 0.04 0.04 0.04 0.04 0.04 0.04 0.0470 0.04 0.04 0.04 0.04 0.04 0.04 0.04 0.04 0.04 0.04 0.04 0.04 0.04 0.04 0.04 0.0475 0.04 0.04 0.04 0.04 0.04 0.04 0.04 0.04 0.04 0.04 0.04 0.04 0.04 0.04 0.04 0.04
Integral Gain=10 1 6.60 0.77 0.37 0.41 0.32 0.26 0.33 0.33 0.27 0.23 0.21 0.18 0.16 0.15 0.17 0.205 0.21 0.17 0.14 0.14 0.14 0.14 0.14 0.14 0.13 0.13 0.12 0.12 0.11 0.12 0.12 0.13
10 0.11 0.10 0.10 0.10 0.10 0.09 0.09 0.09 0.09 0.09 0.09 0.09 0.09 0.09 0.10 0.1015 0.09 0.08 0.08 0.08 0.08 0.08 0.08 0.08 0.08 0.08 0.08 0.08 0.08 0.08 0.08 0.0820 0.07 0.07 0.07 0.07 0.07 0.07 0.07 0.07 0.07 0.07 0.07 0.07 0.07 0.07 0.07 0.0725 0.07 0.06 0.06 0.06 0.06 0.06 0.06 0.06 0.06 0.06 0.06 0.06 0.06 0.06 0.06 0.0630 0.06 0.06 0.06 0.05 0.05 0.05 0.05 0.05 0.05 0.05 0.05 0.05 0.05 0.05 0.06 0.0635 0.05 0.05 0.05 0.05 0.05 0.05 0.05 0.05 0.05 0.05 0.05 0.05 0.05 0.05 0.05 0.0540 0.05 0.05 0.05 0.05 0.05 0.05 0.05 0.05 0.05 0.05 0.05 0.05 0.05 0.05 0.05 0.0545 0.05 0.04 0.04 0.04 0.04 0.04 0.04 0.04 0.04 0.04 0.04 0.04 0.04 0.04 0.04 0.0450 0.04 0.04 0.04 0.04 0.04 0.04 0.04 0.04 0.04 0.04 0.04 0.04 0.04 0.04 0.04 0.0455 0.04 0.04 0.04 0.04 0.04 0.04 0.04 0.04 0.04 0.04 0.04 0.04 0.04 0.04 0.04 0.0460 0.04 0.04 0.04 0.04 0.04 0.04 0.04 0.04 0.04 0.04 0.04 0.04 0.04 0.04 0.04 0.0465 0.04 0.04 0.03 0.03 0.03 0.03 0.03 0.03 0.03 0.03 0.03 0.03 0.03 0.03 0.04 0.0470 0.03 0.03 0.03 0.03 0.03 0.03 0.03 0.03 0.03 0.03 0.03 0.03 0.03 0.03 0.03 0.0375 0.03 0.03 0.03 0.03 0.03 0.03 0.03 0.03 0.03 0.03 0.03 0.03 0.03 0.03 0.03 0.03

95
Table D-2: RMS speed error obtained using the non-linear model and wind3 as wind input file.
Derivative GainProportional
Gain 1 5 10 15 20 25 30 35 40 45 50 55 60 65 70 75
Integral Gain=1 1 0.39 0.32 0.33 0.36 0.40 0.45 0.49 0.52 0.54 0.54 0.54 0.54 0.53 0.52 0.52 0.515 0.24 0.22 0.22 0.23 0.24 0.25 0.26 0.27 0.28 0.28 0.29 0.29 0.29 0.29 0.30 0.30
10 0.19 0.18 0.17 0.17 0.18 0.18 0.19 0.19 0.19 0.20 0.20 0.20 0.20 0.21 0.21 0.2115 0.16 0.15 0.15 0.15 0.15 0.15 0.15 0.15 0.16 0.16 0.16 0.16 0.16 0.16 0.17 0.1720 0.14 0.13 0.13 0.13 0.13 0.13 0.13 0.13 0.13 0.13 0.14 0.14 0.14 0.14 0.14 0.1425 0.12 0.12 0.12 0.12 0.12 0.12 0.12 0.12 0.12 0.12 0.12 0.12 0.12 0.12 0.12 0.1230 0.11 0.11 0.11 0.11 0.11 0.11 0.11 0.11 0.11 0.11 0.11 0.11 0.11 0.11 0.11 0.1135 0.10 0.10 0.10 0.10 0.10 0.10 0.10 0.10 0.10 0.10 0.10 0.10 0.10 0.10 0.10 0.1040 0.09 0.09 0.09 0.09 0.09 0.09 0.09 0.09 0.09 0.09 0.09 0.09 0.09 0.09 0.09 0.0945 0.09 0.09 0.09 0.09 0.09 0.09 0.09 0.09 0.09 0.09 0.09 0.09 0.09 0.09 0.09 0.0950 0.08 0.08 0.08 0.08 0.08 0.08 0.08 0.08 0.08 0.08 0.08 0.08 0.08 0.08 0.08 0.0855 0.08 0.08 0.08 0.08 0.08 0.08 0.08 0.08 0.08 0.08 0.08 0.08 0.08 0.08 0.08 0.0860 0.07 0.07 0.07 0.07 0.07 0.07 0.07 0.07 0.07 0.07 0.07 0.07 0.07 0.07 0.07 0.0765 0.07 0.07 0.07 0.07 0.07 0.07 0.07 0.07 0.07 0.07 0.07 0.07 0.07 0.07 0.07 0.0770 0.07 0.07 0.07 0.07 0.07 0.07 0.07 0.07 0.07 0.07 0.07 0.07 0.07 0.07 0.07 0.0775 0.06 0.06 0.06 0.06 0.06 0.06 0.06 0.06 0.06 0.06 0.06 0.06 0.06 0.06 0.06 0.06
Integral Gain=5 1 0.86 0.44 0.36 0.26 0.20 0.19 0.17 0.13 0.11 0.13 0.15 0.16 0.17 0.17 0.16 0.165 0.22 0.18 0.15 0.13 0.11 0.10 0.09 0.08 0.08 0.08 0.08 0.08 0.08 0.09 0.09 0.09
10 0.13 0.11 0.10 0.09 0.08 0.07 0.07 0.06 0.06 0.06 0.06 0.06 0.06 0.06 0.06 0.0615 0.10 0.09 0.08 0.07 0.06 0.06 0.06 0.05 0.05 0.05 0.05 0.05 0.05 0.05 0.05 0.0520 0.08 0.07 0.06 0.06 0.06 0.05 0.05 0.05 0.05 0.05 0.05 0.05 0.05 0.05 0.05 0.0525 0.07 0.06 0.06 0.05 0.05 0.05 0.05 0.05 0.05 0.05 0.04 0.04 0.04 0.05 0.05 0.0530 0.06 0.05 0.05 0.05 0.05 0.05 0.04 0.04 0.04 0.04 0.04 0.04 0.04 0.04 0.04 0.0435 0.05 0.05 0.05 0.05 0.04 0.04 0.04 0.04 0.04 0.04 0.04 0.04 0.04 0.04 0.04 0.0440 0.05 0.05 0.04 0.04 0.04 0.04 0.04 0.04 0.04 0.04 0.04 0.04 0.04 0.04 0.04 0.0445 0.05 0.04 0.04 0.04 0.04 0.04 0.04 0.04 0.04 0.04 0.04 0.04 0.04 0.04 0.04 0.0450 0.04 0.04 0.04 0.04 0.04 0.04 0.04 0.04 0.04 0.04 0.04 0.04 0.04 0.04 0.04 0.0455 0.04 0.04 0.04 0.04 0.04 0.04 0.04 0.04 0.04 0.03 0.03 0.03 0.03 0.03 0.03 0.0360 0.04 0.04 0.04 0.04 0.03 0.03 0.03 0.03 0.03 0.03 0.03 0.03 0.03 0.03 0.03 0.0365 0.04 0.04 0.03 0.03 0.03 0.03 0.03 0.03 0.03 0.03 0.03 0.03 0.03 0.03 0.03 0.0370 0.03 0.03 0.03 0.03 0.03 0.03 0.03 0.03 0.03 0.03 0.03 0.03 0.03 0.03 0.03 0.0375 0.03 0.03 0.03 0.03 0.03 0.03 0.03 0.03 0.03 0.03 0.03 0.03 0.03 0.03 0.03 0.03
Integral Gain=10 1 5.17 0.80 0.34 0.30 0.25 0.24 0.23 0.17 0.15 0.12 0.11 0.12 0.13 0.12 0.10 0.085 0.25 0.19 0.15 0.13 0.12 0.12 0.11 0.10 0.09 0.08 0.08 0.07 0.07 0.07 0.06 0.06
10 0.14 0.11 0.10 0.09 0.08 0.08 0.07 0.07 0.06 0.06 0.06 0.05 0.05 0.05 0.04 0.0415 0.10 0.08 0.07 0.07 0.06 0.06 0.06 0.05 0.05 0.05 0.05 0.04 0.04 0.04 0.04 0.0420 0.07 0.07 0.06 0.06 0.05 0.05 0.05 0.04 0.04 0.04 0.04 0.04 0.04 0.03 0.03 0.0325 0.06 0.06 0.05 0.05 0.04 0.04 0.04 0.04 0.04 0.04 0.03 0.03 0.03 0.03 0.03 0.0330 0.05 0.05 0.04 0.04 0.04 0.04 0.04 0.03 0.03 0.03 0.03 0.03 0.03 0.03 0.03 0.0335 0.05 0.04 0.04 0.04 0.04 0.03 0.03 0.03 0.03 0.03 0.03 0.03 0.03 0.03 0.03 0.0340 0.04 0.04 0.04 0.03 0.03 0.03 0.03 0.03 0.03 0.03 0.03 0.03 0.03 0.03 0.03 0.0345 0.04 0.04 0.03 0.03 0.03 0.03 0.03 0.03 0.03 0.03 0.03 0.03 0.03 0.02 0.02 0.0250 0.03 0.03 0.03 0.03 0.03 0.03 0.03 0.03 0.03 0.03 0.03 0.02 0.02 0.02 0.02 0.0255 0.03 0.03 0.03 0.03 0.03 0.03 0.03 0.03 0.02 0.02 0.02 0.02 0.02 0.02 0.02 0.0260 0.03 0.03 0.03 0.03 0.03 0.03 0.02 0.02 0.02 0.02 0.02 0.02 0.02 0.02 0.02 0.0265 0.03 0.03 0.03 0.03 0.02 0.02 0.02 0.02 0.02 0.02 0.02 0.02 0.02 0.02 0.02 0.0270 0.03 0.03 0.02 0.02 0.02 0.02 0.02 0.02 0.02 0.02 0.02 0.02 0.02 0.02 0.02 0.0275 0.03 0.02 0.02 0.02 0.02 0.02 0.02 0.02 0.02 0.02 0.02 0.02 0.02 0.02 0.02 0.02

96
Table D-3: RMS speed error obtained using the non-linear model and wind4 as wind input file.
Derivative GainProportional
Gain 1 5 10 15 20 25 30 35 40 45 50 55 60 65 70 75
Integral Gain=1 1 0.92 0.92 0.85 0.74 0.67 0.64 0.64 0.64 0.65 0.64 0.63 0.61 0.60 0.58 0.56 0.555 0.43 0.41 0.40 0.38 0.37 0.35 0.34 0.34 0.33 0.33 0.32 0.32 0.32 0.31 0.31 0.30
10 0.28 0.27 0.27 0.26 0.25 0.25 0.24 0.24 0.24 0.23 0.23 0.23 0.22 0.22 0.22 0.2215 0.23 0.22 0.22 0.21 0.21 0.21 0.20 0.20 0.20 0.19 0.19 0.19 0.19 0.19 0.19 0.1820 0.19 0.19 0.19 0.18 0.18 0.18 0.18 0.18 0.18 0.17 0.17 0.17 0.17 0.17 0.17 0.1725 0.17 0.17 0.17 0.17 0.17 0.16 0.16 0.16 0.16 0.16 0.16 0.16 0.16 0.15 0.15 0.1530 0.16 0.16 0.16 0.15 0.15 0.15 0.15 0.15 0.15 0.15 0.15 0.15 0.15 0.14 0.14 0.1435 0.15 0.15 0.15 0.14 0.14 0.14 0.14 0.14 0.14 0.14 0.14 0.14 0.14 0.14 0.14 0.1340 0.14 0.14 0.14 0.14 0.14 0.13 0.13 0.13 0.13 0.13 0.13 0.13 0.13 0.13 0.13 0.1345 0.13 0.13 0.13 0.13 0.13 0.13 0.13 0.13 0.13 0.12 0.12 0.12 0.12 0.12 0.12 0.1250 0.12 0.12 0.12 0.12 0.12 0.12 0.12 0.12 0.12 0.12 0.12 0.12 0.12 0.12 0.12 0.1255 0.12 0.12 0.12 0.12 0.12 0.12 0.11 0.11 0.11 0.11 0.11 0.11 0.11 0.11 0.11 0.1160 0.11 0.11 0.11 0.11 0.11 0.11 0.11 0.11 0.11 0.11 0.11 0.11 0.11 0.11 0.11 0.1165 0.11 0.11 0.11 0.11 0.11 0.11 0.11 0.10 0.10 0.10 0.10 0.10 0.10 0.10 0.10 0.1070 0.10 0.10 0.10 0.10 0.10 0.10 0.10 0.10 0.10 0.10 0.10 0.10 0.10 0.10 0.10 0.1075 0.10 0.10 0.10 0.10 0.10 0.10 0.10 0.10 0.10 0.10 0.10 0.10 0.10 0.10 0.10 0.09
Integral Gain=5 1 1.19 0.48 0.47 0.35 0.35 0.39 0.37 0.41 0.48 0.52 0.54 0.55 0.55 0.55 0.53 0.495 0.30 0.25 0.23 0.22 0.22 0.23 0.23 0.24 0.25 0.26 0.27 0.28 0.28 0.28 0.27 0.27
10 0.19 0.18 0.17 0.16 0.16 0.16 0.16 0.17 0.17 0.17 0.17 0.17 0.17 0.17 0.17 0.1715 0.15 0.14 0.13 0.13 0.13 0.13 0.13 0.13 0.13 0.13 0.13 0.13 0.13 0.13 0.13 0.1320 0.12 0.11 0.11 0.11 0.11 0.11 0.11 0.11 0.11 0.11 0.11 0.11 0.11 0.10 0.10 0.1025 0.10 0.10 0.10 0.09 0.09 0.09 0.09 0.09 0.09 0.09 0.09 0.09 0.09 0.09 0.09 0.0930 0.09 0.09 0.08 0.08 0.08 0.08 0.08 0.08 0.08 0.08 0.08 0.08 0.08 0.08 0.08 0.0835 0.08 0.08 0.08 0.08 0.07 0.07 0.07 0.07 0.07 0.07 0.07 0.07 0.07 0.07 0.07 0.0740 0.07 0.07 0.07 0.07 0.07 0.07 0.07 0.07 0.07 0.07 0.06 0.06 0.06 0.06 0.06 0.0645 0.07 0.07 0.06 0.06 0.06 0.06 0.06 0.06 0.06 0.06 0.06 0.06 0.06 0.06 0.06 0.0650 0.06 0.06 0.06 0.06 0.06 0.06 0.06 0.06 0.06 0.06 0.06 0.06 0.05 0.05 0.05 0.0555 0.06 0.06 0.06 0.06 0.05 0.05 0.05 0.05 0.05 0.05 0.05 0.05 0.05 0.05 0.05 0.0560 0.06 0.05 0.05 0.05 0.05 0.05 0.05 0.05 0.05 0.05 0.05 0.05 0.05 0.05 0.05 0.0565 0.05 0.05 0.05 0.05 0.05 0.05 0.05 0.05 0.05 0.05 0.05 0.05 0.05 0.05 0.05 0.0570 0.05 0.05 0.05 0.05 0.05 0.05 0.05 0.05 0.05 0.05 0.04 0.04 0.04 0.04 0.04 0.0475 0.05 0.05 0.05 0.05 0.04 0.04 0.04 0.04 0.04 0.04 0.04 0.04 0.04 0.04 0.04 0.04
Integral Gain=10 1 8.26 7.44 0.68 0.29 0.30 0.36 0.31 0.24 0.25 0.25 0.28 0.31 0.30 0.26 0.25 0.275 0.32 0.25 0.21 0.18 0.16 0.16 0.15 0.15 0.14 0.15 0.16 0.17 0.17 0.17 0.18 0.19
10 0.17 0.15 0.14 0.13 0.12 0.11 0.11 0.11 0.11 0.11 0.12 0.12 0.12 0.13 0.13 0.1415 0.13 0.11 0.11 0.10 0.10 0.10 0.09 0.09 0.09 0.09 0.10 0.10 0.10 0.10 0.10 0.1120 0.10 0.10 0.09 0.09 0.08 0.08 0.08 0.08 0.08 0.08 0.08 0.08 0.08 0.09 0.09 0.0925 0.09 0.08 0.08 0.08 0.07 0.07 0.07 0.07 0.07 0.07 0.07 0.07 0.07 0.07 0.08 0.0830 0.08 0.07 0.07 0.07 0.07 0.07 0.07 0.07 0.06 0.06 0.06 0.07 0.07 0.07 0.07 0.0735 0.07 0.07 0.06 0.06 0.06 0.06 0.06 0.06 0.06 0.06 0.06 0.06 0.06 0.06 0.06 0.0640 0.06 0.06 0.06 0.06 0.06 0.06 0.06 0.05 0.05 0.05 0.05 0.05 0.05 0.05 0.05 0.0545 0.06 0.06 0.05 0.05 0.05 0.05 0.05 0.05 0.05 0.05 0.05 0.05 0.05 0.05 0.05 0.0550 0.05 0.05 0.05 0.05 0.05 0.05 0.05 0.05 0.05 0.05 0.05 0.05 0.05 0.05 0.05 0.0555 0.05 0.05 0.05 0.05 0.05 0.04 0.04 0.04 0.04 0.04 0.04 0.04 0.04 0.04 0.04 0.0460 0.05 0.04 0.04 0.04 0.04 0.04 0.04 0.04 0.04 0.04 0.04 0.04 0.04 0.04 0.04 0.0465 0.04 0.04 0.04 0.04 0.04 0.04 0.04 0.04 0.04 0.04 0.04 0.04 0.04 0.04 0.04 0.0470 0.04 0.04 0.04 0.04 0.04 0.04 0.04 0.04 0.04 0.04 0.04 0.04 0.04 0.04 0.04 0.0475 0.04 0.04 0.04 0.04 0.04 0.04 0.04 0.04 0.04 0.04 0.04 0.03 0.03 0.03 0.03 0.03

97
Table D-4: RMS speed error obtained using the non-linear model and wind5 as wind input file.
Derivative GainProportional
Gain 1 5 10 15 20 25 30 35 40 45 50 55 60 65 70 75
Integral Gain=1 1 0.52 0.46 0.54 0.64 0.71 0.75 0.74 0.73 0.71 0.69 0.67 0.66 0.66 0.66 0.66 0.665 0.25 0.23 0.24 0.26 0.28 0.31 0.32 0.34 0.35 0.36 0.37 0.37 0.38 0.38 0.39 0.39
10 0.20 0.20 0.20 0.20 0.21 0.22 0.23 0.23 0.24 0.25 0.26 0.26 0.27 0.27 0.28 0.2815 0.18 0.18 0.18 0.18 0.18 0.19 0.19 0.19 0.20 0.20 0.21 0.21 0.21 0.22 0.22 0.2220 0.16 0.16 0.16 0.16 0.16 0.17 0.17 0.17 0.17 0.17 0.18 0.18 0.18 0.18 0.19 0.1925 0.15 0.15 0.15 0.15 0.15 0.15 0.15 0.15 0.15 0.16 0.16 0.16 0.16 0.16 0.16 0.1630 0.14 0.14 0.14 0.14 0.14 0.14 0.14 0.14 0.14 0.14 0.14 0.14 0.14 0.14 0.15 0.1535 0.13 0.13 0.13 0.13 0.13 0.13 0.13 0.13 0.13 0.13 0.13 0.13 0.13 0.13 0.13 0.1340 0.12 0.12 0.12 0.12 0.12 0.12 0.12 0.12 0.12 0.12 0.12 0.12 0.12 0.12 0.12 0.1245 0.11 0.11 0.11 0.11 0.11 0.11 0.11 0.11 0.11 0.11 0.11 0.11 0.11 0.11 0.11 0.1150 0.11 0.11 0.11 0.11 0.11 0.11 0.11 0.11 0.11 0.11 0.11 0.11 0.11 0.11 0.11 0.1155 0.10 0.10 0.10 0.10 0.10 0.10 0.10 0.10 0.10 0.10 0.10 0.10 0.10 0.10 0.10 0.1060 0.10 0.10 0.10 0.10 0.10 0.10 0.10 0.10 0.10 0.10 0.10 0.10 0.10 0.10 0.10 0.1065 0.09 0.09 0.09 0.09 0.09 0.09 0.09 0.09 0.09 0.09 0.09 0.09 0.09 0.09 0.09 0.0970 0.09 0.09 0.09 0.09 0.09 0.09 0.09 0.09 0.09 0.09 0.09 0.09 0.09 0.09 0.09 0.0975 0.08 0.08 0.08 0.08 0.08 0.08 0.08 0.08 0.08 0.08 0.08 0.08 0.08 0.08 0.08 0.08
Integral Gain=5 1 0.86 0.54 0.39 0.54 0.39 0.29 0.28 0.26 0.26 0.27 0.29 0.30 0.30 0.30 0.30 0.305 0.19 0.17 0.16 0.17 0.16 0.14 0.13 0.12 0.12 0.13 0.13 0.14 0.14 0.15 0.15 0.15
10 0.13 0.11 0.10 0.10 0.09 0.09 0.08 0.08 0.08 0.08 0.08 0.08 0.08 0.09 0.09 0.0915 0.10 0.09 0.08 0.07 0.07 0.07 0.06 0.06 0.06 0.06 0.06 0.06 0.06 0.06 0.07 0.0720 0.08 0.07 0.07 0.06 0.06 0.06 0.06 0.05 0.05 0.05 0.05 0.05 0.05 0.05 0.05 0.0625 0.07 0.06 0.06 0.06 0.05 0.05 0.05 0.05 0.05 0.05 0.05 0.05 0.05 0.05 0.05 0.0530 0.06 0.06 0.05 0.05 0.05 0.05 0.05 0.05 0.04 0.04 0.04 0.04 0.04 0.04 0.04 0.0435 0.06 0.05 0.05 0.05 0.05 0.04 0.04 0.04 0.04 0.04 0.04 0.04 0.04 0.04 0.04 0.0440 0.05 0.05 0.05 0.04 0.04 0.04 0.04 0.04 0.04 0.04 0.04 0.04 0.04 0.04 0.04 0.0445 0.05 0.05 0.04 0.04 0.04 0.04 0.04 0.04 0.04 0.04 0.04 0.04 0.04 0.04 0.04 0.0450 0.05 0.04 0.04 0.04 0.04 0.04 0.04 0.04 0.04 0.04 0.04 0.04 0.04 0.04 0.04 0.0455 0.04 0.04 0.04 0.04 0.04 0.04 0.04 0.04 0.04 0.04 0.04 0.04 0.04 0.04 0.04 0.0460 0.04 0.04 0.04 0.04 0.04 0.04 0.04 0.04 0.04 0.04 0.04 0.04 0.04 0.04 0.04 0.0465 0.04 0.04 0.04 0.04 0.04 0.04 0.04 0.04 0.04 0.04 0.04 0.04 0.04 0.04 0.04 0.0470 0.04 0.04 0.04 0.04 0.04 0.04 0.04 0.04 0.04 0.04 0.04 0.04 0.04 0.04 0.04 0.0475 0.04 0.04 0.04 0.04 0.04 0.04 0.04 0.04 0.04 0.04 0.04 0.03 0.03 0.03 0.03 0.03
Integral Gain=10 1 8.32 3.25 0.48 0.34 0.35 0.25 0.33 0.41 0.39 0.30 0.21 0.18 0.19 0.20 0.19 0.185 0.23 0.14 0.12 0.13 0.13 0.13 0.14 0.15 0.15 0.14 0.12 0.11 0.10 0.10 0.10 0.10
10 0.12 0.10 0.09 0.08 0.08 0.08 0.08 0.09 0.08 0.08 0.08 0.07 0.07 0.07 0.07 0.0615 0.09 0.08 0.07 0.07 0.06 0.06 0.06 0.06 0.06 0.06 0.06 0.06 0.05 0.05 0.05 0.0520 0.07 0.06 0.06 0.06 0.05 0.05 0.05 0.05 0.05 0.05 0.05 0.04 0.04 0.04 0.04 0.0425 0.06 0.06 0.05 0.05 0.05 0.04 0.04 0.04 0.04 0.04 0.04 0.04 0.04 0.04 0.04 0.0430 0.06 0.05 0.04 0.04 0.04 0.04 0.04 0.04 0.04 0.04 0.03 0.03 0.03 0.03 0.03 0.0335 0.05 0.04 0.04 0.04 0.04 0.04 0.03 0.03 0.03 0.03 0.03 0.03 0.03 0.03 0.03 0.0340 0.04 0.04 0.04 0.04 0.03 0.03 0.03 0.03 0.03 0.03 0.03 0.03 0.03 0.03 0.03 0.0345 0.04 0.04 0.03 0.03 0.03 0.03 0.03 0.03 0.03 0.03 0.03 0.03 0.03 0.03 0.03 0.0350 0.04 0.03 0.03 0.03 0.03 0.03 0.03 0.03 0.03 0.03 0.03 0.03 0.03 0.02 0.02 0.0255 0.03 0.03 0.03 0.03 0.03 0.03 0.03 0.03 0.03 0.03 0.02 0.02 0.02 0.02 0.02 0.0260 0.03 0.03 0.03 0.03 0.03 0.03 0.03 0.02 0.02 0.02 0.02 0.02 0.02 0.02 0.02 0.0265 0.03 0.03 0.03 0.03 0.03 0.02 0.02 0.02 0.02 0.02 0.02 0.02 0.02 0.02 0.02 0.0270 0.03 0.03 0.03 0.03 0.02 0.02 0.02 0.02 0.02 0.02 0.02 0.02 0.02 0.02 0.02 0.0275 0.03 0.03 0.02 0.02 0.02 0.02 0.02 0.02 0.02 0.02 0.02 0.02 0.02 0.02 0.02 0.02

98
Table D-5: RMS speed error obtained using the non-linear model and highwind4 as wind input file.
Derivative GainProportional
Gain 1 5 10 15 20 25 30 35 40 45 50 55 60 65 70 75
Integral Gain=1 1 1.39 1.20 1.27 1.25 1.15 1.09 1.08 1.10 1.09 1.06 1.03 0.98 0.94 0.90 0.86 0.835 0.63 0.60 0.58 0.58 0.58 0.58 0.58 0.58 0.57 0.57 0.56 0.55 0.54 0.54 0.53 0.52
10 0.42 0.41 0.40 0.39 0.39 0.39 0.39 0.39 0.39 0.39 0.39 0.39 0.39 0.39 0.39 0.3915 0.33 0.32 0.32 0.32 0.32 0.32 0.32 0.32 0.32 0.32 0.32 0.32 0.32 0.32 0.32 0.3220 0.28 0.28 0.28 0.27 0.27 0.27 0.27 0.27 0.27 0.27 0.27 0.27 0.27 0.28 0.28 0.2825 0.25 0.25 0.25 0.25 0.24 0.24 0.24 0.24 0.24 0.24 0.24 0.24 0.25 0.25 0.25 0.2530 0.23 0.23 0.22 0.22 0.22 0.22 0.22 0.22 0.22 0.22 0.22 0.22 0.22 0.22 0.22 0.2235 0.21 0.21 0.21 0.21 0.21 0.21 0.21 0.21 0.21 0.21 0.21 0.21 0.21 0.21 0.21 0.2140 0.20 0.19 0.19 0.19 0.19 0.19 0.19 0.19 0.19 0.19 0.19 0.19 0.19 0.19 0.19 0.1945 0.18 0.18 0.18 0.18 0.18 0.18 0.18 0.18 0.18 0.18 0.18 0.18 0.18 0.18 0.18 0.1850 0.17 0.17 0.17 0.17 0.17 0.17 0.17 0.17 0.17 0.17 0.17 0.17 0.17 0.17 0.17 0.1755 0.16 0.16 0.16 0.16 0.16 0.16 0.16 0.16 0.16 0.16 0.16 0.16 0.16 0.16 0.16 0.1660 0.16 0.16 0.16 0.16 0.16 0.16 0.16 0.16 0.16 0.16 0.16 0.16 0.16 0.16 0.16 0.1665 0.15 0.15 0.15 0.15 0.15 0.15 0.15 0.15 0.15 0.15 0.15 0.15 0.15 0.15 0.15 0.1570 0.14 0.14 0.14 0.14 0.14 0.14 0.14 0.14 0.14 0.14 0.14 0.14 0.14 0.14 0.14 0.1475 0.14 0.14 0.14 0.14 0.14 0.14 0.14 0.14 0.14 0.14 0.14 0.14 0.14 0.14 0.14 0.14
Integral Gain=5 1 1.50 1.13 0.82 0.86 0.77 0.70 0.65 0.51 0.40 0.37 0.39 0.45 0.52 0.58 0.64 0.665 0.42 0.41 0.40 0.40 0.39 0.37 0.34 0.32 0.30 0.29 0.29 0.30 0.32 0.34 0.35 0.36
10 0.27 0.26 0.26 0.26 0.25 0.24 0.24 0.23 0.22 0.22 0.22 0.22 0.22 0.23 0.23 0.2315 0.21 0.20 0.20 0.19 0.19 0.19 0.19 0.18 0.18 0.18 0.18 0.18 0.18 0.18 0.18 0.1820 0.17 0.16 0.16 0.16 0.16 0.16 0.15 0.15 0.15 0.15 0.15 0.15 0.15 0.15 0.15 0.1525 0.14 0.14 0.14 0.14 0.14 0.13 0.13 0.13 0.13 0.13 0.13 0.13 0.13 0.13 0.13 0.1330 0.13 0.12 0.12 0.12 0.12 0.12 0.12 0.12 0.12 0.12 0.12 0.11 0.11 0.11 0.11 0.1135 0.11 0.11 0.11 0.11 0.11 0.11 0.11 0.11 0.11 0.11 0.10 0.10 0.10 0.10 0.10 0.1040 0.10 0.10 0.10 0.10 0.10 0.10 0.10 0.10 0.10 0.10 0.10 0.10 0.10 0.10 0.09 0.0945 0.09 0.09 0.09 0.09 0.09 0.09 0.09 0.09 0.09 0.09 0.09 0.09 0.09 0.09 0.09 0.0950 0.09 0.09 0.09 0.09 0.09 0.09 0.09 0.08 0.08 0.08 0.08 0.08 0.08 0.08 0.08 0.0855 0.08 0.08 0.08 0.08 0.08 0.08 0.08 0.08 0.08 0.08 0.08 0.08 0.08 0.08 0.08 0.0860 0.08 0.08 0.08 0.08 0.08 0.08 0.08 0.08 0.08 0.08 0.08 0.07 0.07 0.07 0.07 0.0765 0.07 0.07 0.07 0.07 0.07 0.07 0.07 0.07 0.07 0.07 0.07 0.07 0.07 0.07 0.07 0.0770 0.07 0.07 0.07 0.07 0.07 0.07 0.07 0.07 0.07 0.07 0.07 0.07 0.07 0.07 0.07 0.0775 0.07 0.07 0.07 0.07 0.07 0.07 0.07 0.07 0.07 0.07 0.07 0.07 0.07 0.07 0.07 0.07
Integral Gain=10 1 12.19 8.40 0.47 0.74 0.78 0.55 0.49 0.57 0.61 0.49 0.41 0.44 0.46 0.44 0.39 0.325 0.43 0.32 0.29 0.30 0.31 0.30 0.29 0.30 0.31 0.30 0.29 0.28 0.27 0.26 0.24 0.22
10 0.23 0.21 0.20 0.20 0.20 0.20 0.20 0.20 0.20 0.20 0.20 0.19 0.19 0.18 0.17 0.1715 0.17 0.16 0.16 0.16 0.16 0.16 0.16 0.16 0.16 0.15 0.15 0.15 0.15 0.14 0.14 0.1420 0.14 0.13 0.13 0.13 0.13 0.13 0.13 0.13 0.13 0.13 0.13 0.12 0.12 0.12 0.12 0.1225 0.12 0.12 0.11 0.11 0.11 0.11 0.11 0.11 0.11 0.11 0.11 0.11 0.11 0.11 0.10 0.1030 0.10 0.10 0.10 0.10 0.10 0.10 0.10 0.10 0.10 0.10 0.10 0.10 0.09 0.09 0.09 0.0935 0.09 0.09 0.09 0.09 0.09 0.09 0.09 0.09 0.09 0.09 0.09 0.09 0.09 0.09 0.08 0.0840 0.09 0.08 0.08 0.08 0.08 0.08 0.08 0.08 0.08 0.08 0.08 0.08 0.08 0.08 0.08 0.0845 0.08 0.08 0.08 0.08 0.08 0.07 0.07 0.07 0.07 0.07 0.07 0.07 0.07 0.07 0.07 0.0750 0.07 0.07 0.07 0.07 0.07 0.07 0.07 0.07 0.07 0.07 0.07 0.07 0.07 0.07 0.07 0.0755 0.07 0.07 0.07 0.07 0.07 0.07 0.06 0.06 0.06 0.06 0.06 0.06 0.06 0.06 0.06 0.0660 0.06 0.06 0.06 0.06 0.06 0.06 0.06 0.06 0.06 0.06 0.06 0.06 0.06 0.06 0.06 0.0665 0.06 0.06 0.06 0.06 0.06 0.06 0.06 0.06 0.06 0.06 0.06 0.06 0.06 0.06 0.06 0.0670 0.06 0.06 0.06 0.06 0.06 0.06 0.05 0.05 0.05 0.05 0.05 0.05 0.05 0.05 0.05 0.0575 0.05 0.05 0.05 0.05 0.05 0.05 0.05 0.05 0.05 0.05 0.05 0.05 0.05 0.05 0.05 0.05

99
Table D-6: RMS speed error obtained using the non-linear model averaged with all five wind input cases.
Derivative GainProportional
Gain 1 5 10 15 20 25 30 35 40 45 50 55 60 65 70 75
Integral Gain=1 1 0.79 0.74 0.77 0.78 0.76 0.77 0.80 0.82 0.82 0.81 0.79 0.77 0.75 0.73 0.70 0.685 0.39 0.37 0.37 0.37 0.38 0.39 0.40 0.40 0.41 0.41 0.41 0.41 0.40 0.40 0.40 0.39
10 0.27 0.26 0.26 0.26 0.26 0.26 0.26 0.27 0.27 0.27 0.27 0.27 0.27 0.28 0.28 0.2815 0.22 0.21 0.21 0.21 0.21 0.21 0.21 0.21 0.21 0.22 0.22 0.22 0.22 0.22 0.22 0.2220 0.19 0.18 0.18 0.18 0.18 0.18 0.18 0.18 0.18 0.18 0.18 0.19 0.19 0.19 0.19 0.1925 0.17 0.16 0.16 0.16 0.16 0.16 0.16 0.16 0.16 0.16 0.16 0.16 0.16 0.17 0.17 0.1730 0.15 0.15 0.15 0.15 0.15 0.15 0.15 0.15 0.15 0.15 0.15 0.15 0.15 0.15 0.15 0.1535 0.14 0.14 0.14 0.14 0.14 0.14 0.14 0.14 0.14 0.14 0.14 0.14 0.14 0.14 0.14 0.1440 0.13 0.13 0.13 0.13 0.13 0.13 0.13 0.13 0.13 0.13 0.13 0.13 0.13 0.13 0.13 0.1345 0.12 0.12 0.12 0.12 0.12 0.12 0.12 0.12 0.12 0.12 0.12 0.12 0.12 0.12 0.12 0.1250 0.12 0.12 0.11 0.11 0.11 0.11 0.11 0.11 0.11 0.11 0.11 0.11 0.11 0.11 0.11 0.1155 0.11 0.11 0.11 0.11 0.11 0.11 0.11 0.11 0.11 0.11 0.11 0.11 0.11 0.11 0.11 0.1160 0.10 0.10 0.10 0.10 0.10 0.10 0.10 0.10 0.10 0.10 0.10 0.10 0.10 0.10 0.10 0.1065 0.10 0.10 0.10 0.10 0.10 0.10 0.10 0.10 0.10 0.10 0.10 0.10 0.10 0.10 0.10 0.1070 0.10 0.10 0.10 0.09 0.09 0.09 0.09 0.09 0.09 0.09 0.09 0.09 0.09 0.09 0.09 0.0975 0.09 0.09 0.09 0.09 0.09 0.09 0.09 0.09 0.09 0.09 0.09 0.09 0.09 0.09 0.09 0.09
Integral Gain=5 1 1.00 0.62 0.49 0.49 0.41 0.37 0.35 0.33 0.33 0.35 0.37 0.39 0.41 0.42 0.42 0.415 0.27 0.24 0.23 0.22 0.21 0.20 0.20 0.19 0.19 0.20 0.20 0.21 0.21 0.22 0.22 0.22
10 0.17 0.16 0.15 0.15 0.14 0.14 0.14 0.14 0.13 0.14 0.14 0.14 0.14 0.14 0.14 0.1515 0.13 0.12 0.12 0.11 0.11 0.11 0.11 0.11 0.11 0.11 0.11 0.11 0.11 0.11 0.11 0.1120 0.11 0.10 0.10 0.10 0.09 0.09 0.09 0.09 0.09 0.09 0.09 0.09 0.09 0.09 0.09 0.0925 0.09 0.09 0.09 0.08 0.08 0.08 0.08 0.08 0.08 0.08 0.08 0.08 0.08 0.08 0.08 0.0830 0.08 0.08 0.08 0.08 0.07 0.07 0.07 0.07 0.07 0.07 0.07 0.07 0.07 0.07 0.07 0.0735 0.07 0.07 0.07 0.07 0.07 0.07 0.07 0.07 0.07 0.07 0.07 0.07 0.06 0.06 0.06 0.0740 0.07 0.07 0.06 0.06 0.06 0.06 0.06 0.06 0.06 0.06 0.06 0.06 0.06 0.06 0.06 0.0645 0.06 0.06 0.06 0.06 0.06 0.06 0.06 0.06 0.06 0.06 0.06 0.06 0.06 0.06 0.06 0.0650 0.06 0.06 0.06 0.06 0.05 0.05 0.05 0.05 0.05 0.05 0.05 0.05 0.05 0.05 0.05 0.0555 0.05 0.05 0.05 0.05 0.05 0.05 0.05 0.05 0.05 0.05 0.05 0.05 0.05 0.05 0.05 0.0560 0.05 0.05 0.05 0.05 0.05 0.05 0.05 0.05 0.05 0.05 0.05 0.05 0.05 0.05 0.05 0.0565 0.05 0.05 0.05 0.05 0.05 0.05 0.05 0.05 0.05 0.05 0.05 0.05 0.05 0.05 0.05 0.0570 0.05 0.05 0.05 0.05 0.05 0.05 0.04 0.04 0.04 0.04 0.04 0.04 0.04 0.04 0.04 0.0475 0.04 0.04 0.04 0.04 0.04 0.04 0.04 0.04 0.04 0.04 0.04 0.04 0.04 0.04 0.04 0.04
Integral Gain=10 1 8.11 4.13 0.47 0.42 0.40 0.33 0.34 0.35 0.34 0.28 0.24 0.25 0.25 0.23 0.22 0.215 0.29 0.21 0.18 0.18 0.17 0.17 0.17 0.17 0.17 0.16 0.15 0.15 0.15 0.14 0.14 0.14
10 0.15 0.13 0.12 0.12 0.12 0.11 0.11 0.11 0.11 0.11 0.11 0.11 0.10 0.10 0.10 0.1015 0.11 0.10 0.10 0.09 0.09 0.09 0.09 0.09 0.09 0.09 0.09 0.08 0.08 0.08 0.08 0.0820 0.09 0.09 0.08 0.08 0.08 0.08 0.07 0.07 0.07 0.07 0.07 0.07 0.07 0.07 0.07 0.0725 0.08 0.07 0.07 0.07 0.07 0.07 0.07 0.06 0.06 0.06 0.06 0.06 0.06 0.06 0.06 0.0630 0.07 0.07 0.06 0.06 0.06 0.06 0.06 0.06 0.06 0.06 0.06 0.06 0.06 0.06 0.06 0.0535 0.06 0.06 0.06 0.06 0.05 0.05 0.05 0.05 0.05 0.05 0.05 0.05 0.05 0.05 0.05 0.0540 0.06 0.05 0.05 0.05 0.05 0.05 0.05 0.05 0.05 0.05 0.05 0.05 0.05 0.05 0.05 0.0545 0.05 0.05 0.05 0.05 0.05 0.05 0.05 0.05 0.04 0.04 0.04 0.04 0.04 0.04 0.04 0.0450 0.05 0.05 0.04 0.04 0.04 0.04 0.04 0.04 0.04 0.04 0.04 0.04 0.04 0.04 0.04 0.0455 0.04 0.04 0.04 0.04 0.04 0.04 0.04 0.04 0.04 0.04 0.04 0.04 0.04 0.04 0.04 0.0460 0.04 0.04 0.04 0.04 0.04 0.04 0.04 0.04 0.04 0.04 0.04 0.04 0.04 0.04 0.04 0.0465 0.04 0.04 0.04 0.04 0.04 0.04 0.04 0.04 0.04 0.04 0.04 0.04 0.03 0.03 0.03 0.0370 0.04 0.04 0.04 0.04 0.03 0.03 0.03 0.03 0.03 0.03 0.03 0.03 0.03 0.03 0.03 0.0375 0.04 0.03 0.03 0.03 0.03 0.03 0.03 0.03 0.03 0.03 0.03 0.03 0.03 0.03 0.03 0.03

100
Table D-7: Actuator duty cycle obtained using the non-linear model and medwind2 as wind input file.
Derivative GainProportional
Gain 1 5 10 15 20 25 30 35 40 45 50 55 60 65 70 75
Integral Gain=1 1 0.57 0.57 0.64 0.71 0.77 0.80 0.83 0.85 0.86 0.87 0.88 0.89 0.90 0.91 0.92 0.925 0.61 0.60 0.66 0.72 0.77 0.80 0.83 0.85 0.87 0.88 0.89 0.90 0.91 0.92 0.93 0.93
10 0.74 0.70 0.73 0.77 0.80 0.83 0.85 0.87 0.88 0.89 0.91 0.92 0.92 0.93 0.94 0.9415 0.86 0.78 0.79 0.81 0.83 0.85 0.87 0.88 0.89 0.91 0.92 0.92 0.93 0.94 0.94 0.9520 0.96 0.85 0.83 0.84 0.86 0.87 0.88 0.90 0.91 0.92 0.92 0.93 0.94 0.94 0.95 0.9525 1.03 0.91 0.87 0.87 0.88 0.89 0.90 0.91 0.92 0.92 0.93 0.94 0.94 0.95 0.96 0.9630 1.08 0.96 0.91 0.90 0.90 0.90 0.91 0.92 0.93 0.93 0.94 0.94 0.95 0.95 0.96 0.9635 1.12 0.99 0.94 0.92 0.92 0.92 0.92 0.93 0.93 0.94 0.94 0.95 0.96 0.96 0.96 0.9640 1.14 1.02 0.96 0.94 0.93 0.93 0.93 0.94 0.94 0.95 0.95 0.96 0.96 0.96 0.96 0.9745 1.16 1.04 0.98 0.96 0.95 0.94 0.94 0.95 0.95 0.95 0.96 0.96 0.96 0.97 0.97 0.9750 1.16 1.06 1.00 0.97 0.96 0.95 0.95 0.95 0.96 0.96 0.96 0.97 0.97 0.97 0.97 0.9755 1.17 1.07 1.01 0.98 0.97 0.96 0.96 0.96 0.96 0.96 0.97 0.97 0.97 0.97 0.97 0.9860 1.16 1.08 1.02 0.99 0.98 0.97 0.97 0.97 0.97 0.97 0.97 0.97 0.97 0.98 0.98 0.9865 1.16 1.08 1.03 1.00 0.99 0.98 0.98 0.97 0.97 0.97 0.98 0.98 0.98 0.98 0.98 0.9870 1.15 1.08 1.04 1.01 1.00 0.99 0.98 0.98 0.98 0.98 0.98 0.98 0.98 0.98 0.98 0.9875 1.14 1.09 1.04 1.02 1.00 0.99 0.99 0.98 0.98 0.98 0.98 0.98 0.98 0.98 0.98 0.98
Integral Gain=5 1 1.93 1.27 0.92 0.82 0.76 0.79 0.86 0.91 0.95 0.95 0.95 0.95 0.94 0.93 0.93 0.945 0.88 0.75 0.74 0.76 0.78 0.81 0.85 0.88 0.90 0.91 0.92 0.93 0.93 0.94 0.94 0.95
10 0.89 0.78 0.78 0.80 0.82 0.84 0.86 0.88 0.89 0.91 0.92 0.93 0.94 0.94 0.95 0.9515 0.96 0.84 0.82 0.83 0.85 0.86 0.88 0.89 0.90 0.91 0.92 0.93 0.94 0.95 0.95 0.9620 1.03 0.89 0.86 0.86 0.87 0.88 0.89 0.90 0.91 0.92 0.93 0.94 0.94 0.95 0.95 0.9625 1.08 0.94 0.89 0.89 0.89 0.90 0.91 0.91 0.92 0.93 0.94 0.94 0.95 0.95 0.96 0.9630 1.13 0.98 0.93 0.91 0.91 0.91 0.92 0.92 0.93 0.94 0.94 0.95 0.95 0.96 0.96 0.9635 1.15 1.01 0.95 0.93 0.93 0.93 0.93 0.93 0.94 0.94 0.95 0.95 0.96 0.96 0.96 0.9740 1.17 1.04 0.97 0.95 0.94 0.94 0.94 0.94 0.95 0.95 0.95 0.96 0.96 0.96 0.97 0.9745 1.18 1.06 0.99 0.97 0.95 0.95 0.95 0.95 0.95 0.96 0.96 0.96 0.97 0.97 0.97 0.9750 1.19 1.07 1.01 0.98 0.97 0.96 0.96 0.96 0.96 0.96 0.96 0.97 0.97 0.97 0.97 0.9755 1.18 1.08 1.02 0.99 0.98 0.97 0.97 0.96 0.96 0.97 0.97 0.97 0.97 0.97 0.98 0.9860 1.18 1.09 1.03 1.00 0.98 0.98 0.97 0.97 0.97 0.97 0.97 0.97 0.97 0.98 0.98 0.9865 1.17 1.09 1.04 1.01 0.99 0.98 0.98 0.98 0.98 0.98 0.98 0.98 0.98 0.98 0.98 0.9870 1.16 1.09 1.04 1.02 1.00 0.99 0.99 0.98 0.98 0.98 0.98 0.98 0.98 0.98 0.98 0.9875 1.15 1.09 1.05 1.02 1.01 1.00 0.99 0.99 0.98 0.98 0.98 0.98 0.98 0.99 0.99 0.99
Integral Gain=10 1 4.16 3.39 1.33 1.23 0.99 0.94 0.99 0.90 0.86 0.87 0.88 0.90 0.92 0.95 0.96 0.985 1.45 0.92 0.83 0.83 0.84 0.86 0.87 0.87 0.87 0.88 0.89 0.91 0.93 0.94 0.95 0.97
10 1.09 0.86 0.83 0.83 0.85 0.86 0.87 0.88 0.89 0.90 0.91 0.92 0.93 0.94 0.95 0.9615 1.10 0.90 0.85 0.85 0.86 0.88 0.89 0.90 0.90 0.91 0.92 0.93 0.94 0.95 0.95 0.9620 1.12 0.94 0.89 0.88 0.88 0.89 0.90 0.91 0.92 0.92 0.93 0.94 0.94 0.95 0.96 0.9625 1.15 0.98 0.92 0.90 0.90 0.91 0.91 0.92 0.93 0.93 0.94 0.94 0.95 0.95 0.96 0.9630 1.18 1.01 0.95 0.92 0.92 0.92 0.92 0.93 0.93 0.94 0.94 0.95 0.95 0.96 0.96 0.9635 1.20 1.04 0.97 0.94 0.93 0.93 0.94 0.94 0.94 0.95 0.95 0.96 0.96 0.96 0.97 0.9740 1.21 1.06 0.99 0.96 0.95 0.94 0.95 0.95 0.95 0.95 0.96 0.96 0.96 0.97 0.97 0.9745 1.22 1.08 1.01 0.98 0.96 0.96 0.95 0.95 0.96 0.96 0.96 0.96 0.97 0.97 0.97 0.9750 1.21 1.09 1.02 0.99 0.97 0.97 0.96 0.96 0.96 0.96 0.97 0.97 0.97 0.97 0.97 0.9855 1.21 1.10 1.03 1.00 0.98 0.97 0.97 0.97 0.97 0.97 0.97 0.97 0.97 0.98 0.98 0.9860 1.20 1.10 1.04 1.01 0.99 0.98 0.98 0.97 0.97 0.97 0.98 0.98 0.98 0.98 0.98 0.9865 1.19 1.10 1.05 1.02 1.00 0.99 0.98 0.98 0.98 0.98 0.98 0.98 0.98 0.98 0.98 0.9870 1.17 1.10 1.05 1.02 1.01 1.00 0.99 0.99 0.98 0.98 0.98 0.98 0.98 0.98 0.98 0.9975 1.16 1.10 1.06 1.03 1.01 1.00 0.99 0.99 0.99 0.99 0.99 0.99 0.99 0.99 0.99 0.99

101
Table D-8: Actuator duty cycle obtained using the non-linear model and wind3 as wind input file.
Derivative GainProportional
Gain 1 5 10 15 20 25 30 35 40 45 50 55 60 65 70 75
Integral Gain=1 1 0.28 0.44 0.66 0.78 0.86 0.91 0.95 0.98 1.00 1.02 1.03 1.05 1.06 1.07 1.08 1.095 0.54 0.57 0.70 0.80 0.87 0.92 0.95 0.98 1.01 1.02 1.04 1.05 1.06 1.07 1.08 1.09
10 0.81 0.73 0.79 0.85 0.90 0.94 0.97 0.99 1.01 1.03 1.05 1.06 1.07 1.08 1.09 1.0915 1.00 0.87 0.86 0.90 0.93 0.96 0.98 1.01 1.02 1.04 1.05 1.06 1.07 1.08 1.09 1.1020 1.13 0.97 0.93 0.94 0.96 0.98 1.00 1.02 1.03 1.05 1.06 1.07 1.08 1.09 1.09 1.1025 1.21 1.05 0.99 0.98 0.99 1.01 1.02 1.03 1.05 1.06 1.07 1.08 1.08 1.09 1.10 1.1030 1.26 1.10 1.04 1.02 1.02 1.03 1.04 1.05 1.06 1.07 1.07 1.08 1.09 1.10 1.10 1.1135 1.29 1.15 1.07 1.05 1.04 1.04 1.05 1.06 1.07 1.07 1.08 1.09 1.09 1.10 1.11 1.1140 1.31 1.18 1.10 1.07 1.06 1.06 1.06 1.07 1.08 1.08 1.09 1.09 1.10 1.11 1.11 1.1145 1.33 1.20 1.13 1.10 1.08 1.08 1.08 1.08 1.08 1.09 1.09 1.10 1.11 1.11 1.11 1.1250 1.34 1.22 1.15 1.11 1.10 1.09 1.09 1.09 1.09 1.10 1.10 1.11 1.11 1.11 1.12 1.1255 1.34 1.23 1.16 1.13 1.11 1.10 1.10 1.10 1.10 1.10 1.11 1.11 1.11 1.12 1.12 1.1260 1.34 1.24 1.18 1.14 1.12 1.11 1.11 1.11 1.11 1.11 1.11 1.12 1.12 1.12 1.12 1.1365 1.33 1.25 1.19 1.15 1.14 1.12 1.12 1.12 1.12 1.12 1.12 1.12 1.12 1.13 1.13 1.1370 1.32 1.25 1.20 1.16 1.15 1.13 1.13 1.12 1.12 1.12 1.12 1.13 1.13 1.13 1.13 1.1375 1.32 1.25 1.20 1.17 1.15 1.14 1.13 1.13 1.13 1.13 1.13 1.13 1.13 1.13 1.13 1.14
Integral Gain=5 1 2.66 1.07 0.79 0.77 0.82 0.89 0.94 0.97 1.00 1.02 1.04 1.06 1.07 1.08 1.09 1.105 0.94 0.68 0.72 0.79 0.85 0.90 0.94 0.98 1.00 1.02 1.04 1.06 1.07 1.08 1.09 1.10
10 1.00 0.80 0.80 0.85 0.89 0.93 0.96 0.99 1.01 1.03 1.05 1.06 1.07 1.08 1.09 1.1015 1.13 0.92 0.88 0.90 0.93 0.96 0.98 1.00 1.02 1.04 1.05 1.06 1.07 1.08 1.09 1.1020 1.22 1.02 0.95 0.95 0.97 0.99 1.00 1.02 1.03 1.05 1.06 1.07 1.08 1.09 1.10 1.1025 1.28 1.09 1.01 0.99 1.00 1.01 1.02 1.03 1.05 1.06 1.07 1.08 1.08 1.09 1.10 1.1030 1.31 1.14 1.05 1.03 1.02 1.03 1.04 1.05 1.06 1.07 1.07 1.08 1.09 1.10 1.10 1.1135 1.33 1.17 1.09 1.06 1.05 1.05 1.05 1.06 1.07 1.07 1.08 1.09 1.10 1.10 1.11 1.1140 1.35 1.20 1.12 1.08 1.07 1.07 1.07 1.07 1.08 1.08 1.09 1.09 1.10 1.11 1.11 1.1145 1.36 1.22 1.14 1.10 1.09 1.08 1.08 1.08 1.09 1.09 1.10 1.10 1.11 1.11 1.11 1.1250 1.36 1.23 1.16 1.12 1.10 1.09 1.09 1.09 1.10 1.10 1.10 1.11 1.11 1.11 1.12 1.1255 1.36 1.25 1.17 1.14 1.12 1.11 1.10 1.10 1.10 1.11 1.11 1.11 1.12 1.12 1.12 1.1260 1.35 1.25 1.19 1.15 1.13 1.12 1.11 1.11 1.11 1.11 1.11 1.12 1.12 1.12 1.12 1.1365 1.35 1.26 1.20 1.16 1.14 1.13 1.12 1.12 1.12 1.12 1.12 1.12 1.12 1.13 1.13 1.1370 1.34 1.26 1.20 1.17 1.15 1.14 1.13 1.13 1.12 1.12 1.13 1.13 1.13 1.13 1.13 1.1375 1.33 1.26 1.21 1.18 1.16 1.14 1.14 1.13 1.13 1.13 1.13 1.13 1.13 1.13 1.13 1.14
Integral Gain=10 1 3.54 3.36 1.17 1.00 0.90 0.95 0.94 0.96 0.99 1.00 1.03 1.04 1.06 1.07 1.08 1.095 1.71 1.02 0.80 0.84 0.87 0.90 0.93 0.96 0.99 1.01 1.03 1.05 1.06 1.07 1.08 1.09
10 1.33 0.93 0.86 0.87 0.90 0.93 0.96 0.98 1.00 1.02 1.04 1.05 1.07 1.08 1.09 1.0915 1.31 1.01 0.92 0.92 0.94 0.96 0.98 1.00 1.02 1.03 1.05 1.06 1.07 1.08 1.09 1.1020 1.35 1.08 0.99 0.97 0.98 0.99 1.00 1.02 1.03 1.05 1.06 1.07 1.08 1.09 1.09 1.1025 1.37 1.14 1.04 1.01 1.01 1.01 1.02 1.04 1.05 1.06 1.07 1.07 1.08 1.09 1.10 1.1030 1.38 1.18 1.08 1.04 1.03 1.04 1.04 1.05 1.06 1.07 1.07 1.08 1.09 1.10 1.10 1.1135 1.39 1.21 1.11 1.07 1.06 1.05 1.06 1.06 1.07 1.08 1.08 1.09 1.09 1.10 1.11 1.1140 1.39 1.23 1.14 1.10 1.08 1.07 1.07 1.07 1.08 1.08 1.09 1.10 1.10 1.11 1.11 1.1145 1.39 1.24 1.16 1.12 1.10 1.09 1.08 1.09 1.09 1.09 1.10 1.10 1.11 1.11 1.11 1.1250 1.39 1.26 1.17 1.13 1.11 1.10 1.10 1.10 1.10 1.10 1.10 1.11 1.11 1.12 1.12 1.1255 1.38 1.26 1.19 1.15 1.12 1.11 1.11 1.10 1.11 1.11 1.11 1.11 1.12 1.12 1.12 1.1260 1.38 1.27 1.20 1.16 1.14 1.12 1.12 1.11 1.11 1.11 1.12 1.12 1.12 1.12 1.13 1.1365 1.36 1.27 1.21 1.17 1.15 1.13 1.13 1.12 1.12 1.12 1.12 1.12 1.13 1.13 1.13 1.1370 1.35 1.27 1.21 1.18 1.16 1.14 1.13 1.13 1.13 1.13 1.13 1.13 1.13 1.13 1.13 1.1375 1.34 1.27 1.22 1.19 1.16 1.15 1.14 1.14 1.13 1.13 1.13 1.13 1.13 1.13 1.14 1.14

102
Table D-9: Actuator duty cycle obtained using the non-linear model and wind4 as wind input file.
Derivative GainProportional
Gain 1 5 10 15 20 25 30 35 40 45 50 55 60 65 70 75
Integral Gain=1 1 0.70 0.67 0.84 0.98 1.07 1.14 1.18 1.22 1.25 1.27 1.29 1.31 1.32 1.34 1.35 1.365 0.78 0.77 0.90 1.01 1.09 1.15 1.19 1.23 1.26 1.28 1.30 1.31 1.33 1.34 1.35 1.36
10 1.06 0.96 1.01 1.08 1.14 1.18 1.22 1.25 1.27 1.29 1.31 1.32 1.34 1.35 1.36 1.3615 1.25 1.11 1.11 1.14 1.18 1.21 1.24 1.27 1.29 1.30 1.32 1.33 1.34 1.35 1.36 1.3720 1.39 1.23 1.19 1.20 1.22 1.24 1.26 1.28 1.30 1.32 1.33 1.34 1.35 1.36 1.37 1.3725 1.50 1.31 1.25 1.24 1.25 1.27 1.29 1.30 1.31 1.33 1.34 1.35 1.36 1.37 1.37 1.3830 1.57 1.38 1.31 1.29 1.29 1.29 1.31 1.32 1.33 1.34 1.35 1.36 1.36 1.37 1.38 1.3835 1.63 1.44 1.35 1.32 1.31 1.32 1.32 1.33 1.34 1.35 1.36 1.37 1.37 1.38 1.38 1.3940 1.67 1.48 1.39 1.35 1.34 1.34 1.34 1.35 1.35 1.36 1.37 1.37 1.38 1.38 1.39 1.3945 1.70 1.51 1.42 1.38 1.36 1.36 1.36 1.36 1.36 1.37 1.37 1.38 1.39 1.39 1.39 1.4050 1.71 1.54 1.44 1.40 1.38 1.37 1.37 1.37 1.37 1.38 1.38 1.39 1.39 1.40 1.40 1.4055 1.71 1.55 1.46 1.42 1.40 1.39 1.38 1.38 1.38 1.39 1.39 1.39 1.40 1.40 1.40 1.4160 1.71 1.57 1.48 1.44 1.41 1.40 1.40 1.39 1.39 1.39 1.40 1.40 1.40 1.41 1.41 1.4165 1.70 1.57 1.49 1.45 1.43 1.41 1.41 1.40 1.40 1.40 1.40 1.41 1.41 1.41 1.41 1.4270 1.69 1.58 1.50 1.46 1.44 1.42 1.42 1.41 1.41 1.41 1.41 1.41 1.41 1.42 1.42 1.4275 1.68 1.58 1.51 1.47 1.45 1.43 1.43 1.42 1.42 1.42 1.42 1.42 1.42 1.42 1.42 1.42
Integral Gain=5 1 3.54 1.05 1.14 1.05 1.13 1.17 1.22 1.26 1.29 1.30 1.32 1.33 1.34 1.35 1.35 1.365 1.29 0.93 0.97 1.05 1.11 1.17 1.21 1.25 1.27 1.30 1.31 1.33 1.34 1.35 1.35 1.36
10 1.31 1.06 1.05 1.10 1.15 1.19 1.23 1.26 1.28 1.30 1.32 1.33 1.34 1.35 1.36 1.3715 1.41 1.18 1.14 1.16 1.19 1.22 1.25 1.27 1.29 1.31 1.32 1.34 1.35 1.36 1.36 1.3720 1.50 1.28 1.22 1.21 1.23 1.25 1.27 1.29 1.30 1.32 1.33 1.34 1.35 1.36 1.37 1.3825 1.58 1.36 1.28 1.26 1.26 1.28 1.29 1.30 1.32 1.33 1.34 1.35 1.36 1.37 1.37 1.3830 1.64 1.42 1.33 1.30 1.30 1.30 1.31 1.32 1.33 1.34 1.35 1.36 1.37 1.37 1.38 1.3835 1.68 1.47 1.37 1.33 1.32 1.32 1.33 1.34 1.34 1.35 1.36 1.37 1.37 1.38 1.38 1.3940 1.72 1.51 1.41 1.36 1.35 1.34 1.35 1.35 1.36 1.36 1.37 1.37 1.38 1.39 1.39 1.4045 1.74 1.53 1.43 1.39 1.37 1.36 1.36 1.36 1.37 1.37 1.38 1.38 1.39 1.39 1.39 1.4050 1.75 1.56 1.46 1.41 1.39 1.38 1.38 1.38 1.38 1.38 1.38 1.39 1.39 1.40 1.40 1.4055 1.74 1.57 1.48 1.43 1.41 1.39 1.39 1.39 1.39 1.39 1.39 1.39 1.40 1.40 1.40 1.4160 1.74 1.58 1.49 1.45 1.42 1.41 1.40 1.40 1.40 1.40 1.40 1.40 1.40 1.41 1.41 1.4165 1.73 1.59 1.50 1.46 1.43 1.42 1.41 1.41 1.40 1.40 1.41 1.41 1.41 1.41 1.41 1.4270 1.71 1.59 1.51 1.47 1.44 1.43 1.42 1.42 1.41 1.41 1.41 1.41 1.41 1.42 1.42 1.4275 1.69 1.59 1.52 1.48 1.45 1.44 1.43 1.42 1.42 1.42 1.42 1.42 1.42 1.42 1.42 1.42
Integral Gain=10 1 3.96 4.44 2.08 1.13 1.21 1.31 1.26 1.25 1.29 1.32 1.34 1.34 1.33 1.35 1.37 1.395 2.37 1.34 1.09 1.06 1.13 1.18 1.22 1.24 1.27 1.30 1.32 1.33 1.34 1.35 1.36 1.37
10 1.71 1.23 1.11 1.11 1.15 1.19 1.23 1.26 1.28 1.30 1.32 1.33 1.35 1.36 1.37 1.3715 1.63 1.30 1.19 1.18 1.20 1.23 1.25 1.27 1.29 1.31 1.33 1.34 1.35 1.36 1.37 1.3820 1.66 1.37 1.26 1.24 1.24 1.26 1.28 1.29 1.31 1.32 1.33 1.35 1.36 1.36 1.37 1.3825 1.70 1.42 1.31 1.28 1.28 1.29 1.30 1.31 1.32 1.33 1.34 1.35 1.36 1.37 1.38 1.3830 1.73 1.47 1.36 1.32 1.31 1.31 1.32 1.33 1.34 1.34 1.35 1.36 1.37 1.38 1.38 1.3935 1.76 1.51 1.40 1.35 1.34 1.33 1.34 1.34 1.35 1.35 1.36 1.37 1.38 1.38 1.39 1.3940 1.78 1.54 1.43 1.38 1.36 1.35 1.35 1.36 1.36 1.36 1.37 1.38 1.38 1.39 1.39 1.4045 1.79 1.57 1.45 1.40 1.38 1.37 1.37 1.37 1.37 1.37 1.38 1.38 1.39 1.39 1.40 1.4050 1.79 1.58 1.48 1.42 1.40 1.39 1.38 1.38 1.38 1.38 1.39 1.39 1.39 1.40 1.40 1.4055 1.78 1.59 1.49 1.44 1.42 1.40 1.39 1.39 1.39 1.39 1.39 1.40 1.40 1.40 1.41 1.4160 1.77 1.60 1.51 1.46 1.43 1.41 1.41 1.40 1.40 1.40 1.40 1.40 1.41 1.41 1.41 1.4165 1.75 1.60 1.52 1.47 1.44 1.43 1.42 1.41 1.41 1.41 1.41 1.41 1.41 1.41 1.41 1.4270 1.73 1.60 1.52 1.48 1.45 1.44 1.43 1.42 1.42 1.41 1.41 1.41 1.42 1.42 1.42 1.4275 1.71 1.60 1.53 1.49 1.46 1.44 1.43 1.43 1.42 1.42 1.42 1.42 1.42 1.42 1.42 1.42

103
Table D-10: Actuator duty cycle obtained using the non-linear model and wind5 as wind input file.
Derivative GainProportional
Gain 1 5 10 15 20 25 30 35 40 45 50 55 60 65 70 75
Integral Gain=1 1 0.39 0.40 0.60 0.72 0.78 0.83 0.86 0.88 0.90 0.91 0.92 0.93 0.94 0.95 0.96 0.965 0.51 0.52 0.62 0.71 0.78 0.82 0.85 0.88 0.90 0.91 0.93 0.94 0.95 0.96 0.96 0.97
10 0.71 0.66 0.70 0.75 0.80 0.83 0.86 0.89 0.90 0.92 0.93 0.94 0.95 0.96 0.97 0.9715 0.89 0.77 0.77 0.80 0.83 0.85 0.88 0.90 0.91 0.92 0.94 0.95 0.96 0.96 0.97 0.9820 1.02 0.86 0.83 0.84 0.86 0.87 0.89 0.91 0.92 0.93 0.94 0.95 0.96 0.97 0.97 0.9825 1.11 0.94 0.88 0.87 0.88 0.89 0.91 0.92 0.93 0.94 0.95 0.96 0.96 0.97 0.98 0.9830 1.19 1.00 0.92 0.91 0.91 0.91 0.92 0.93 0.94 0.95 0.95 0.96 0.97 0.97 0.98 0.9835 1.24 1.04 0.96 0.93 0.93 0.93 0.93 0.94 0.95 0.95 0.96 0.97 0.97 0.98 0.98 0.9940 1.27 1.08 0.99 0.96 0.95 0.94 0.95 0.95 0.96 0.96 0.97 0.97 0.98 0.98 0.99 0.9945 1.28 1.10 1.02 0.98 0.96 0.96 0.96 0.96 0.96 0.97 0.97 0.98 0.98 0.99 0.99 0.9950 1.29 1.12 1.04 1.00 0.98 0.97 0.97 0.97 0.97 0.98 0.98 0.98 0.99 0.99 0.99 1.0055 1.28 1.13 1.05 1.01 0.99 0.98 0.98 0.98 0.98 0.98 0.98 0.99 0.99 0.99 1.00 1.0060 1.28 1.14 1.07 1.03 1.01 1.00 0.99 0.99 0.99 0.99 0.99 0.99 0.99 1.00 1.00 1.0065 1.27 1.14 1.08 1.04 1.02 1.00 1.00 0.99 0.99 0.99 0.99 1.00 1.00 1.00 1.00 1.0070 1.25 1.15 1.08 1.05 1.03 1.01 1.01 1.00 1.00 1.00 1.00 1.00 1.00 1.00 1.01 1.0175 1.24 1.14 1.09 1.06 1.04 1.02 1.01 1.01 1.01 1.00 1.00 1.00 1.01 1.01 1.01 1.01
Integral Gain=5 1 3.00 1.36 0.86 0.95 0.72 0.77 0.83 0.85 0.88 0.90 0.93 0.94 0.95 0.96 0.97 0.985 0.77 0.68 0.70 0.73 0.75 0.79 0.83 0.86 0.88 0.90 0.92 0.94 0.95 0.96 0.97 0.97
10 0.87 0.72 0.73 0.76 0.79 0.82 0.85 0.88 0.90 0.91 0.93 0.94 0.95 0.96 0.97 0.9715 1.00 0.82 0.79 0.80 0.83 0.85 0.87 0.89 0.91 0.92 0.93 0.94 0.95 0.96 0.97 0.9820 1.10 0.90 0.85 0.84 0.86 0.87 0.89 0.91 0.92 0.93 0.94 0.95 0.96 0.97 0.97 0.9825 1.18 0.97 0.90 0.88 0.88 0.90 0.91 0.92 0.93 0.94 0.95 0.96 0.96 0.97 0.98 0.9830 1.24 1.02 0.94 0.91 0.91 0.91 0.92 0.93 0.94 0.95 0.95 0.96 0.97 0.97 0.98 0.9835 1.29 1.07 0.97 0.94 0.93 0.93 0.94 0.94 0.95 0.95 0.96 0.97 0.97 0.98 0.98 0.9940 1.31 1.10 1.00 0.97 0.95 0.95 0.95 0.95 0.96 0.96 0.97 0.97 0.98 0.98 0.99 0.9945 1.32 1.12 1.03 0.99 0.97 0.96 0.96 0.96 0.97 0.97 0.97 0.98 0.98 0.99 0.99 0.9950 1.32 1.14 1.05 1.00 0.98 0.98 0.97 0.97 0.97 0.98 0.98 0.98 0.99 0.99 0.99 1.0055 1.31 1.15 1.06 1.02 1.00 0.99 0.98 0.98 0.98 0.98 0.98 0.99 0.99 0.99 1.00 1.0060 1.30 1.15 1.07 1.03 1.01 1.00 0.99 0.99 0.99 0.99 0.99 0.99 0.99 1.00 1.00 1.0065 1.28 1.16 1.08 1.04 1.02 1.01 1.00 1.00 1.00 0.99 1.00 1.00 1.00 1.00 1.00 1.0170 1.27 1.15 1.09 1.05 1.03 1.02 1.01 1.00 1.00 1.00 1.00 1.00 1.00 1.00 1.01 1.0175 1.25 1.15 1.10 1.06 1.04 1.02 1.02 1.01 1.01 1.01 1.00 1.00 1.01 1.01 1.01 1.01
Integral Gain=10 1 4.02 4.65 1.56 1.15 1.00 0.92 0.99 1.04 0.92 0.86 0.88 0.91 0.93 0.94 0.95 0.965 1.58 0.76 0.74 0.81 0.83 0.85 0.87 0.88 0.88 0.88 0.89 0.91 0.93 0.94 0.95 0.96
10 1.16 0.80 0.77 0.80 0.83 0.85 0.87 0.88 0.89 0.90 0.91 0.93 0.94 0.95 0.96 0.9615 1.17 0.89 0.82 0.83 0.84 0.86 0.88 0.89 0.91 0.92 0.93 0.94 0.95 0.95 0.96 0.9720 1.22 0.96 0.87 0.86 0.87 0.88 0.89 0.91 0.92 0.93 0.94 0.95 0.95 0.96 0.97 0.9725 1.28 1.02 0.92 0.89 0.89 0.90 0.91 0.92 0.93 0.94 0.95 0.95 0.96 0.97 0.97 0.9830 1.33 1.06 0.96 0.93 0.92 0.92 0.92 0.93 0.94 0.95 0.95 0.96 0.97 0.97 0.98 0.9835 1.36 1.10 0.99 0.95 0.94 0.94 0.94 0.94 0.95 0.96 0.96 0.97 0.97 0.98 0.98 0.9940 1.37 1.13 1.02 0.98 0.96 0.95 0.95 0.95 0.96 0.96 0.97 0.97 0.98 0.98 0.99 0.9945 1.37 1.15 1.04 1.00 0.98 0.97 0.96 0.96 0.97 0.97 0.97 0.98 0.98 0.99 0.99 0.9950 1.36 1.16 1.06 1.01 0.99 0.98 0.98 0.97 0.98 0.98 0.98 0.98 0.99 0.99 0.99 1.0055 1.34 1.17 1.07 1.03 1.00 0.99 0.99 0.98 0.98 0.98 0.99 0.99 0.99 0.99 1.00 1.0060 1.33 1.17 1.09 1.04 1.02 1.00 0.99 0.99 0.99 0.99 0.99 0.99 0.99 1.00 1.00 1.0065 1.31 1.17 1.09 1.05 1.03 1.01 1.00 1.00 1.00 1.00 1.00 1.00 1.00 1.00 1.00 1.0170 1.29 1.17 1.10 1.06 1.04 1.02 1.01 1.01 1.00 1.00 1.00 1.00 1.00 1.00 1.01 1.0175 1.27 1.16 1.10 1.07 1.04 1.03 1.02 1.01 1.01 1.01 1.01 1.01 1.01 1.01 1.01 1.01

104
Table D-11: Actuator duty cycle obtained using the non-linear model and highwind4 as wind input file.
Derivative GainProportional
Gain 1 5 10 15 20 25 30 35 40 45 50 55 60 65 70 75
Integral Gain=1 1 1.01 0.89 1.10 1.20 1.31 1.38 1.44 1.48 1.52 1.55 1.57 1.58 1.60 1.61 1.62 1.635 1.15 1.07 1.17 1.27 1.35 1.41 1.45 1.49 1.52 1.55 1.57 1.59 1.61 1.62 1.63 1.64
10 1.41 1.30 1.32 1.37 1.42 1.46 1.49 1.52 1.55 1.57 1.59 1.60 1.62 1.63 1.64 1.6515 1.58 1.45 1.43 1.45 1.48 1.51 1.53 1.55 1.57 1.59 1.61 1.62 1.63 1.64 1.65 1.6620 1.71 1.56 1.51 1.51 1.53 1.54 1.56 1.58 1.59 1.61 1.62 1.63 1.64 1.65 1.66 1.6725 1.80 1.64 1.57 1.56 1.57 1.58 1.59 1.60 1.61 1.62 1.64 1.65 1.65 1.66 1.67 1.6830 1.87 1.70 1.62 1.60 1.60 1.61 1.61 1.62 1.63 1.64 1.65 1.66 1.66 1.67 1.68 1.6935 1.92 1.75 1.67 1.64 1.63 1.63 1.63 1.64 1.65 1.65 1.66 1.67 1.67 1.68 1.69 1.6940 1.95 1.78 1.70 1.67 1.65 1.65 1.65 1.66 1.66 1.67 1.67 1.68 1.68 1.69 1.69 1.7045 1.97 1.81 1.73 1.69 1.68 1.67 1.67 1.67 1.67 1.68 1.68 1.69 1.69 1.70 1.70 1.7050 1.98 1.83 1.75 1.71 1.69 1.69 1.68 1.68 1.68 1.69 1.69 1.69 1.70 1.70 1.71 1.7155 1.98 1.85 1.77 1.73 1.71 1.70 1.70 1.69 1.69 1.70 1.70 1.70 1.70 1.71 1.71 1.7260 1.98 1.86 1.79 1.75 1.72 1.71 1.71 1.70 1.70 1.70 1.71 1.71 1.71 1.71 1.72 1.7265 1.98 1.87 1.80 1.76 1.74 1.72 1.72 1.71 1.71 1.71 1.71 1.72 1.72 1.72 1.72 1.7270 1.97 1.88 1.81 1.77 1.75 1.73 1.73 1.72 1.72 1.72 1.72 1.72 1.72 1.72 1.73 1.7375 1.97 1.88 1.82 1.78 1.76 1.74 1.74 1.73 1.73 1.73 1.73 1.73 1.73 1.73 1.73 1.73
Integral Gain=5 1 4.74 2.72 1.62 1.58 1.45 1.43 1.44 1.47 1.53 1.58 1.62 1.64 1.66 1.67 1.67 1.675 1.80 1.50 1.38 1.38 1.41 1.44 1.47 1.51 1.54 1.57 1.60 1.62 1.63 1.65 1.65 1.66
10 1.71 1.47 1.43 1.44 1.46 1.49 1.52 1.54 1.56 1.58 1.60 1.62 1.63 1.64 1.65 1.6615 1.76 1.56 1.50 1.50 1.51 1.53 1.55 1.57 1.59 1.60 1.61 1.63 1.64 1.65 1.66 1.6720 1.83 1.64 1.56 1.55 1.56 1.57 1.58 1.59 1.61 1.62 1.63 1.64 1.65 1.66 1.67 1.6725 1.89 1.70 1.62 1.59 1.59 1.60 1.60 1.61 1.62 1.63 1.64 1.65 1.66 1.67 1.67 1.6830 1.94 1.74 1.66 1.63 1.62 1.62 1.63 1.63 1.64 1.65 1.65 1.66 1.67 1.68 1.68 1.6935 1.97 1.78 1.69 1.66 1.65 1.64 1.64 1.65 1.65 1.66 1.67 1.67 1.68 1.68 1.69 1.6940 2.00 1.82 1.72 1.69 1.67 1.66 1.66 1.66 1.67 1.67 1.68 1.68 1.69 1.69 1.70 1.7045 2.00 1.84 1.75 1.71 1.69 1.68 1.68 1.68 1.68 1.68 1.69 1.69 1.69 1.70 1.70 1.7150 2.01 1.86 1.77 1.73 1.71 1.70 1.69 1.69 1.69 1.69 1.69 1.70 1.70 1.70 1.71 1.7155 2.01 1.87 1.79 1.74 1.72 1.71 1.70 1.70 1.70 1.70 1.70 1.71 1.71 1.71 1.71 1.7260 2.00 1.88 1.80 1.76 1.73 1.72 1.71 1.71 1.71 1.71 1.71 1.71 1.71 1.72 1.72 1.7265 2.00 1.89 1.81 1.77 1.74 1.73 1.72 1.72 1.72 1.72 1.72 1.72 1.72 1.72 1.72 1.7370 1.99 1.89 1.82 1.78 1.76 1.74 1.73 1.73 1.72 1.72 1.72 1.72 1.73 1.73 1.73 1.7375 1.98 1.89 1.83 1.79 1.76 1.75 1.74 1.73 1.73 1.73 1.73 1.73 1.73 1.73 1.73 1.73
Integral Gain=10 1 4.39 4.76 1.86 2.23 2.01 1.64 1.60 1.67 1.66 1.58 1.60 1.62 1.61 1.60 1.61 1.635 2.90 1.82 1.63 1.59 1.55 1.52 1.54 1.56 1.57 1.58 1.60 1.61 1.62 1.62 1.63 1.64
10 2.10 1.66 1.55 1.54 1.54 1.54 1.56 1.57 1.58 1.60 1.61 1.62 1.63 1.64 1.65 1.6615 1.98 1.69 1.58 1.56 1.56 1.57 1.58 1.59 1.60 1.61 1.62 1.63 1.64 1.65 1.66 1.6720 1.97 1.73 1.63 1.60 1.59 1.60 1.60 1.61 1.62 1.63 1.64 1.65 1.66 1.66 1.67 1.6825 1.99 1.77 1.66 1.63 1.62 1.62 1.62 1.63 1.64 1.64 1.65 1.66 1.67 1.67 1.68 1.6930 2.02 1.80 1.70 1.66 1.65 1.64 1.64 1.65 1.65 1.66 1.66 1.67 1.67 1.68 1.69 1.6935 2.04 1.83 1.73 1.69 1.67 1.66 1.66 1.66 1.66 1.67 1.67 1.68 1.68 1.69 1.69 1.7040 2.05 1.86 1.75 1.71 1.69 1.68 1.67 1.67 1.68 1.68 1.68 1.69 1.69 1.70 1.70 1.7045 2.05 1.87 1.77 1.73 1.70 1.69 1.69 1.69 1.69 1.69 1.69 1.70 1.70 1.70 1.71 1.7150 2.05 1.89 1.79 1.74 1.72 1.71 1.70 1.70 1.70 1.70 1.70 1.70 1.71 1.71 1.71 1.7255 2.04 1.90 1.81 1.76 1.73 1.72 1.71 1.71 1.71 1.71 1.71 1.71 1.71 1.72 1.72 1.7260 2.03 1.90 1.82 1.77 1.74 1.73 1.72 1.72 1.72 1.71 1.72 1.72 1.72 1.72 1.72 1.7365 2.02 1.90 1.83 1.78 1.76 1.74 1.73 1.73 1.72 1.72 1.72 1.72 1.72 1.73 1.73 1.7370 2.01 1.90 1.83 1.79 1.76 1.75 1.74 1.73 1.73 1.73 1.73 1.73 1.73 1.73 1.73 1.7375 2.00 1.90 1.84 1.80 1.77 1.76 1.75 1.74 1.74 1.73 1.73 1.73 1.73 1.74 1.74 1.74

105
Table D-12: Actuator duty cycle obtained using the non-linear model averaged over five wind input cases.
Derivative GainProportional
Gain 1 5 10 15 20 25 30 35 40 45 50 55 60 65 70 75
Integral Gain=1 1 0.59 0.59 0.77 0.88 0.96 1.01 1.05 1.08 1.11 1.12 1.14 1.15 1.16 1.17 1.18 1.195 0.72 0.71 0.81 0.90 0.97 1.02 1.06 1.09 1.11 1.13 1.15 1.16 1.17 1.18 1.19 1.20
10 0.95 0.87 0.91 0.96 1.01 1.05 1.08 1.10 1.12 1.14 1.16 1.17 1.18 1.19 1.20 1.2115 1.12 1.00 0.99 1.02 1.05 1.08 1.10 1.12 1.14 1.15 1.17 1.18 1.19 1.20 1.20 1.2120 1.24 1.09 1.06 1.07 1.08 1.10 1.12 1.14 1.15 1.16 1.18 1.19 1.19 1.20 1.21 1.2225 1.33 1.17 1.11 1.11 1.11 1.13 1.14 1.15 1.16 1.17 1.18 1.19 1.20 1.21 1.21 1.2230 1.39 1.23 1.16 1.14 1.14 1.15 1.16 1.17 1.18 1.18 1.19 1.20 1.21 1.21 1.22 1.2235 1.44 1.27 1.20 1.17 1.17 1.17 1.17 1.18 1.19 1.19 1.20 1.21 1.21 1.22 1.22 1.2340 1.47 1.31 1.23 1.20 1.19 1.19 1.19 1.19 1.20 1.20 1.21 1.21 1.22 1.22 1.23 1.2345 1.49 1.33 1.25 1.22 1.21 1.20 1.20 1.20 1.21 1.21 1.22 1.22 1.23 1.23 1.23 1.2450 1.49 1.35 1.28 1.24 1.22 1.22 1.21 1.21 1.22 1.22 1.22 1.23 1.23 1.23 1.24 1.2455 1.50 1.37 1.29 1.26 1.24 1.23 1.22 1.22 1.22 1.23 1.23 1.23 1.24 1.24 1.24 1.2460 1.49 1.38 1.31 1.27 1.25 1.24 1.23 1.23 1.23 1.23 1.24 1.24 1.24 1.24 1.25 1.2565 1.49 1.38 1.32 1.28 1.26 1.25 1.24 1.24 1.24 1.24 1.24 1.24 1.24 1.25 1.25 1.2570 1.48 1.39 1.33 1.29 1.27 1.26 1.25 1.25 1.25 1.25 1.25 1.25 1.25 1.25 1.25 1.2575 1.47 1.39 1.33 1.30 1.28 1.27 1.26 1.25 1.25 1.25 1.25 1.25 1.25 1.25 1.26 1.26
Integral Gain=5 1 3.17 1.49 1.07 1.03 0.98 1.01 1.05 1.09 1.13 1.15 1.17 1.19 1.19 1.20 1.20 1.215 1.13 0.91 0.90 0.94 0.98 1.02 1.06 1.09 1.12 1.14 1.16 1.17 1.18 1.19 1.20 1.21
10 1.15 0.97 0.96 0.99 1.02 1.06 1.08 1.11 1.13 1.15 1.16 1.17 1.19 1.20 1.20 1.2115 1.25 1.06 1.03 1.04 1.06 1.09 1.11 1.13 1.14 1.16 1.17 1.18 1.19 1.20 1.21 1.2120 1.34 1.15 1.09 1.08 1.10 1.11 1.13 1.14 1.15 1.17 1.18 1.19 1.20 1.20 1.21 1.2225 1.40 1.21 1.14 1.12 1.13 1.13 1.15 1.16 1.17 1.18 1.19 1.20 1.20 1.21 1.22 1.2230 1.45 1.26 1.18 1.16 1.15 1.16 1.16 1.17 1.18 1.19 1.19 1.20 1.21 1.22 1.22 1.2335 1.49 1.30 1.22 1.18 1.17 1.17 1.18 1.18 1.19 1.20 1.20 1.21 1.22 1.22 1.23 1.2340 1.51 1.33 1.24 1.21 1.20 1.19 1.19 1.20 1.20 1.21 1.21 1.22 1.22 1.23 1.23 1.2345 1.52 1.35 1.27 1.23 1.21 1.21 1.21 1.21 1.21 1.21 1.22 1.22 1.23 1.23 1.23 1.2450 1.52 1.37 1.29 1.25 1.23 1.22 1.22 1.22 1.22 1.22 1.22 1.23 1.23 1.24 1.24 1.2455 1.52 1.38 1.30 1.26 1.24 1.23 1.23 1.23 1.23 1.23 1.23 1.23 1.24 1.24 1.24 1.2460 1.51 1.39 1.32 1.28 1.26 1.24 1.24 1.24 1.23 1.24 1.24 1.24 1.24 1.24 1.25 1.2565 1.51 1.39 1.33 1.29 1.27 1.25 1.25 1.24 1.24 1.24 1.24 1.24 1.25 1.25 1.25 1.2570 1.49 1.40 1.33 1.30 1.28 1.26 1.26 1.25 1.25 1.25 1.25 1.25 1.25 1.25 1.25 1.2675 1.48 1.40 1.34 1.31 1.28 1.27 1.26 1.26 1.25 1.25 1.25 1.25 1.25 1.26 1.26 1.26
Integral Gain=10 1 4.01 4.12 1.60 1.34 1.22 1.15 1.16 1.16 1.14 1.13 1.15 1.16 1.17 1.18 1.20 1.215 2.00 1.17 1.02 1.03 1.04 1.06 1.09 1.10 1.12 1.13 1.15 1.16 1.17 1.19 1.20 1.21
10 1.48 1.10 1.02 1.03 1.05 1.08 1.10 1.11 1.13 1.14 1.16 1.17 1.18 1.19 1.20 1.2115 1.44 1.15 1.07 1.07 1.08 1.10 1.12 1.13 1.14 1.16 1.17 1.18 1.19 1.20 1.21 1.2120 1.46 1.22 1.13 1.11 1.11 1.12 1.14 1.15 1.16 1.17 1.18 1.19 1.20 1.20 1.21 1.2225 1.50 1.27 1.17 1.14 1.14 1.15 1.15 1.16 1.17 1.18 1.19 1.20 1.20 1.21 1.22 1.2230 1.53 1.31 1.21 1.17 1.17 1.17 1.17 1.18 1.18 1.19 1.20 1.20 1.21 1.22 1.22 1.2335 1.55 1.34 1.24 1.20 1.19 1.18 1.19 1.19 1.19 1.20 1.21 1.21 1.22 1.22 1.23 1.2340 1.56 1.36 1.27 1.22 1.21 1.20 1.20 1.20 1.20 1.21 1.21 1.22 1.22 1.23 1.23 1.2345 1.56 1.38 1.29 1.24 1.22 1.21 1.21 1.21 1.21 1.22 1.22 1.22 1.23 1.23 1.24 1.2450 1.56 1.39 1.30 1.26 1.24 1.23 1.22 1.22 1.22 1.22 1.23 1.23 1.23 1.24 1.24 1.2455 1.55 1.40 1.32 1.28 1.25 1.24 1.23 1.23 1.23 1.23 1.23 1.24 1.24 1.24 1.24 1.2560 1.54 1.41 1.33 1.29 1.26 1.25 1.24 1.24 1.24 1.24 1.24 1.24 1.24 1.25 1.25 1.2565 1.53 1.41 1.34 1.30 1.27 1.26 1.25 1.25 1.25 1.24 1.25 1.25 1.25 1.25 1.25 1.2570 1.51 1.41 1.34 1.31 1.28 1.27 1.26 1.25 1.25 1.25 1.25 1.25 1.25 1.25 1.25 1.2675 1.50 1.41 1.35 1.31 1.29 1.28 1.27 1.26 1.26 1.26 1.26 1.26 1.26 1.26 1.26 1.26

REPORT DOCUMENTATION PAGE Form ApprovedOMB NO. 0704-0188
Public reporting burden for this collection of information is estimated to average 1 hour per response, including the time for reviewing instructions, searching existing datasources, gathering and maintaining the data needed, and completing and reviewing the collection of information. Send comments regarding this burden estimate or any otheraspect of this collection of information, including suggestions for reducing this burden, to Washington Headquarters Services, Directorate for Information Operations andReports, 1215 Jefferson Davis Highway, Suite 1204, Arlington, VA 22202-4302, and to the Office of Management and Budget, Paperwork Reduction Project (0704-0188),Washington, DC 20503.
1. AGENCY USE ONLY (Leave blank) 2. REPORT DATEJuly 1999
3. REPORT TYPE AND DATES COVEREDTechnical Report
4. TITLE AND SUBTITLE
Variable-Speed Wind Turbine Controller Systematic Design Methodology: A Comparison of Non-Linear and Linear Model-Based Designs
6. AUTHOR(S)M.M. Hand
5. FUNDING NUMBERS
WE901110
7. PERFORMING ORGANIZATION NAME(S) AND ADDRESS(ES) 8. PERFORMING ORGANIZATIONREPORT NUMBER
9. SPONSORING/MONITORING AGENCY NAME(S) AND ADDRESS(ES)National Renewable Energy Laboratory1617 Cole Blvd.Golden, CO 80401-3393
10. SPONSORING/MONITORINGAGENCY REPORT NUMBERTP-500-25540
11. SUPPLEMENTARY NOTES
12a. DISTRIBUTION/AVAILABILITY STATEMENTNational Technical Information ServiceU.S. Department of Commerce5285 Port Royal RoadSpringfield, VA 22161
12b. DISTRIBUTION CODE
13. ABSTRACT (Maximum 200 words)Variable-speed, horizontal axis wind turbines use blade-pitch control to meet specified objectives for three regions of operation. Thispaper focuses on controller design for the constant power production regime. A simple, rigid, non-linear turbine model was used tosystematically perform trade-off studies between two performance metrics. Minimization of both the deviation of the rotor speed from thedesired speed and the motion of the actuator is desired. The robust nature of the proportional-integral-derivative (PID) controller isillustrated, and optimal operating conditions are determined. Because numerous simulation runs may be completed in a short time, therelationship of the two opposing metrics is easily visualized.Traditional controller design generally consists of linearizing a model about an operating point. This step was taken for two differentoperating points, and the systematic design approach was used. A comparison of the optimal regions selected using the non-linear modeland the two linear models shows similarities. The linearization point selection does, however, affect the turbine performance slightly.Exploitation of the simplicity of the model allows surfaces consisting of operation under a wide range of gain values to be created. Thismethodology provides a means of visually observing turbine performance based upon the two metrics chosen for this study. Design of aPID controller is simplified, and it is possible to ascertain the best possible combination of controller parameters. The wide, flat surfacesindicate that a PID controller is very robust in this variable-speed wind turbine application.
15. NUMBER OF PAGES 14. SUBJECT TERMS
wind energy, wind turbines, wind turbine design 16. PRICE CODE
17. SECURITY CLASSIFICATIONOF REPORTUnclassified
18. SECURITY CLASSIFICATIONOF THIS PAGEUnclassified
19. SECURITY CLASSIFICATIONOF ABSTRACTUnclassified
20. LIMITATION OF ABSTRACT
UL
NSN 7540-01-280-5500 Standard Form 298 (Rev. 2-89)Prescribed by ANSI Std. Z39-18
298-102