Cerebral oxygen vasoreactivity and cerebral tissue oxygen reactivity.pdf

Variable cerebral responses to equally distinct deviance infour auditory dimensions: A mismatch negativity study
LEON Y. DEOUELLa and SHLOMO BENTINa,b
aDepartment of Psychology, Hebrew University of Jerusalem, IsraelbCenter for Neural Computation, Hebrew University of Jerusalem, Israel
Abstract
In this study we compared the amplitude, latency, and spatial distribution of the mismatch negativity~MMN !, elicitedby tones deviating in either frequency, intensity, stimulus-onset asynchrony~SOA! or location, and assessed inter- andintra-subject variability. Cross-dimensional comparisons were facilitated by adjusting the magnitude of deviance indi-vidually, so that the detection rates were similar, both across dimensions~within subject! and across subjects~withindimension!. Despite similar detection rates, the MMN elicited by frequency deviance was larger, and the MMN elicitedby SOA deviance was earlier than the other types of MMN. The reliability of frequency-related MMN was better thanthat of the other types of MMN. The results highlight the problems of comparing MMN across dimensions, especiallyin clinical populations.
Descriptors: Auditory discrimination, Event-related potentials, Mismatch negativity, Auditory attention,Clinical application
Mismatch negativity~MMN ! is an event-related potential~ERP!component elicited by a “deviant” stimulus presented infrequentlyin a train of repeated “standard” stimuli. Deviance may occur indifferent dimensions. For example, the deviant stimulus may differfrom the standard in frequency~e.g., Sams, Paavilainen, Alho, &Näätänen, 1985!, intensity~e.g., Näätänen, Paavilainen, Alho, Rein-ikainen, & Sams, 1987!, inter-stimulus interval~e.g., Näätänen,Jiang, Lavikainen, Reinikainen, & Paavilainen, 1993!, duration~e.g., Paavilainen, Alho, Reinikainen, Sams, & Näätänen, 1991!,spatial location~e.g., Paavilainen, Karlsson, Reinikainen, &Näätänen, 1989!, phonetic value~e.g., Aaltonen, Niemi, Nyrke, &Tuhkanen, 1987!, or more complex temporal structure~e.g.,Schröger, Tervaniemi, & Näätänen, 1995!. Recent studies demon-strated indeed that the MMN elicited by deviance in differentdimensions may rely not only on the unified representation of thestimulus but also on the representation of distinct auditory featuresembedded in the echoic trace~Deacon, Nousak, Pilotti, Ritter, &Yang, 1998; Giard et al., 1995; Schröger, 1995; for a review seeRitter, Deacon, Gomes, Javitt, & Vaughan, 1995!.
An important characteristic of the MMN paradigm is that theattention of the subject does not have to be focused on the stimuli.Therefore, the MMN is considered to be associated with a pre-
attentive detection of a mismatch between an incoming stimulusand the echoic memory trace formed by the standard stimulus~Näätänen, 1990, 1992!. Because the detection of the differencebetween the standard and the deviant depends on the ability of theauditory system to decipher~and encode! the relevant specificdimension, the MMN may be used not only as a tool for studyingechoic memory~cf., Ritter et al., 1995!, but also as a physiologicalsign for the encoding of specific stimulus attributes. Thus, differ-ences in the amplitude, latency, and spatial distribution of theMMN elicited by manipulating different dimensions may be usedto compare the integrity of the auditory system involved in pro-cessing those dimensions. Such comparisons may provide insightsinto various normal conditions~e.g., with varied levels of attentioninvolved, in combination with stimulation in another modality! andpathological conditions such as developmental disabilities, stroke,and degenerative diseases~cf. Aaltonen et al., 1987; Korpilahti &Lang, 1994; Kraus & McGee, 1994!. The use of MMN~rather thanperformance measures! is particularly advantageous for testing in-dividuals who cannot provide performance data, such as patientswith unilateral neglect or patients in coma~Kane, Curry, Buttler, &Cummins, 1993!. Moreover, using MMN may help disentanglepure auditory from higher-level mechanisms. A prerequisite of thisapproach, however, is to establish the normal pattern of the MMNand its variability across dimensions of deviance. Accordingly, thepurpose of the present study was not to discern differences inprocessing efficiency across dimensions but rather, keeping per-ceptual efficiency and experimental conditions constant, to exam-ine the dimension-related MMN characteristics.
Reliable use of MMN for comparing the distinct processing ofindividual stimulus features is hindered by two major impedi-ments. The first is the high sensitivity of the MMN to experimentaldesign. Factors such as interstimulus interval~ISI!, intensity of the
This study has been supported by a grant from the Israel ScienceFoundation, founded by the Israel Academy of Sciences and Humanities,and by a European Union grant BMH4-CT96-0819 to COBRAIN project.
We thank Prof. Walter Ritter and Prof. Erich Schröger, for helpfulcomments on a previous version of this manuscript, and Ms. Naomi Wexlerfor skillful assistance.
Address reprint requests to: Dr. Leon Deouell, Department of Psychol-ogy, Hebrew University, Jerusalem, 91905, Israel. E-mail: [email protected].
Psychophysiology, 35~1998!, 745–754. Cambridge University Press. Printed in the USA.Copyright © 1998 Society for Psychophysiological Research
745

stimuli, characteristics of the standard, and probability of the de-viance may affect the observed amplitude and latency of the MMNsignificantly~see Näätänen, 1992, pp. 148–160 for a review!. Con-sequently, in the absence of a standardized design, comparisonsbetween experiments are risky even when the same dimension ofdeviance is explored. This problem is even more conspicuous whenMMNs elicited by deviance in different dimensions are compared,because it is possible that each of the above factors interacts dif-ferently with different dimensions of deviance. The few studiesthat have attempted to examine these interactions have revealedtheir complexity. For example, it has been shown that whereas theMMN elicited by deviance in frequency is independent of theintensity, the ISI, or of the duration of tones, the MMN elicited bydeviation in intensity is directly and linearly correlated with theabsolute tone intensity, the duration of the tones, and the ISI be-tween the tones~Böttcher-Gandor & Ullsperger, 1992; Paavilainen,Jiang, Lavikainen, & Näätänen, 1993; Schröger, 1994, 1996!. Theinteraction between other experimental factors and different di-mensions of deviance is as yet unknown. In the absence of suchknowledge, the effect of manipulating the dimension of deviancemay be easily confounded with differences induced by its possibleinteraction with local experimental factors. This complexity is aug-mented by the considerable intrasubject test–retest variability ofMMN, which may limit the interpretations of within-subject dif-ferences among blocks in the same experiment~Escera & Grau,1996; Lang et al., 1995; Pekkonen, Rinne, & Näätänen, 1995!. Oneway to minimize this irrelevant variance is to compare the MMNelicited by deviants in different auditory dimensions within subjectwhile the different deviants are intermixed within block.
The second impediment to comparing the MMN associatedwith various stimulus dimensions is that the subjects’ psychophys-ical discrimination level may differ across dimensions. Moreover,the pattern of these differences is not necessarily the same acrosssubjects. A specific change in frequency, for example, may beeasily detected by one person and hardly noticeable for another,whereas the opposite may be true for shifts in spatial location ofthe sound source. This problem is troublesome because of thecorrelation between individual discrimination capacity and MMN~Kraus et al., 1993; Lang et al., 1990; Näätänen, Schröger, Ter-vaniemi, Karakas, & Paavilainen, 1993; Sams et al., 1985!, as wellas the correlation between the amplitude and latency of the MMNand the magnitude of difference between standard and deviantstimuli ~Näätänen, Paavilainen, Alho, Reinikainen, & Sams, 1989;Paavilainen et al., 1989; Tiitinen, May, Reinikainen, & Näätänen,1994!. Therefore, a reliable comparison of MMN across dimen-sions must be based on prior adjustment of the magnitude of de-viance in each dimension to the individual subject’s psychophysicalperformance. This way, emerging differences across dimensionscould be ascribed to characteristics related to processing of a spe-cific dimension, rather than to individual differences in the abilityto detect changes in specific dimensions. Whereas electrophysio-logical data were previously reported along with behavioral dis-crimination data, this has been done only at the group level~e.g.,Sams et al., 1985; Schröger, 1995, Schröger & Wolff, 1997!. More-over, these studies confirmed that subjects vary widely in theirability to detect the deviant stimuli. To our knowledge, adaptationof the amount of deviance in different dimensions according toeach subject’s subjective discrimination threshold has not yet beenreported.
In the present study, we compared the MMN elicited by devi-ance in different dimensions of tones while addressing some of theabove problems. Recently, Deacon et al.~1998! reported that when
deviants along three different dimensions were intermixed in oneblock, the MMN elicited by each type of deviant seemed to beindependent of the existence of other deviants in the block. On thebasis of this finding, we compared the MMN elicited by deviancein frequency, intensity, stimulus-onset asynchrony~SOA!, or spa-tial location, intermixed in the same blocks. We took special careto match the magnitude of the difference between standard anddeviant stimuli across dimensions, by adjusting the magnitude ofeach deviance to the individual discrimination threshold of thesubject in the respective dimension. Furthermore, because the au-ditory deficits of some patients may be asymmetrically lateralized,the effect of different dimensions of deviance was explored bycomparing the MMN elicited by deviants presented to the right orthe left side of the subject. Finally, because keeping the subjectivedeviance constant led to variability in the objective deviance acrosssubjects, we were able to correlate the amplitude and the latency ofeach MMN to theobjectivephysical difference between standardsand deviants. If significant correlations were found despite thesubjectively equated deviance, a role for the objective magnitudeof deviance in modulating the MMN could not be discarded. Inaddition, we calculated the correlation between the MMN obtainedin response to deviance in different dimensions. This correlationmay be important in clinical practice in which attempts are madeto find differential deficits in processing different dimensions withinsingle patients. Given the high variability of the MMN betweensubjects, a significant within-subjects correlation between dimen-sions would entail that a subject presenting with a “good” MMN inone dimension should be expected to present with a “good” MMNin other dimensions.
Methods and Materials
SubjectsEight undergraduate students~four female and four male! con-sented to participate in the study following detailed description ofthe procedure and general aims. They were paid for participation.All subjects were right-handed and had no known hearing loss.
StimuliStandard stimuliThe standard stimuli were 932 Hz, 70 dB~SPL!, 100 ms long
~10 ms rise and fall time! pure tones. The stimuli were presentedfrom a loudspeaker placed 608 to the right or to the left ofthe subjects’ midsagittal plane. The SOA between standards was500 ms.
Deviant stimuliThere were four types of deviant tones in each block. The
deviant tones differed from the standard tones in that they eitherhad a lower frequency, or a softer intensity, or their source had amore medial location or the SOA between them and the precedingstandard tones was shorter than the SOA between two standardtones. The magnitude of deviation in each of these four featureswas determined for each subject individually using the followingprocedure:
Stage 1.A staircase method was used to determine the minimalmagnitude of difference between the standard and deviant that wasclearly noticeable. For frequency, intensity, and source-location,the subject was presented with consecutive pairs of stimuli, thefirst of which was always the standard tone, as characterized above.The subject had to decide whether the second stimulus was iden-
746 L.Y. Deouell and S. Bentin
tical to or different from the standard in a predesignated dimen-sion. If a difference was not detected, it was increased in thefollowing trial, by changing the value of the second tone by onepredetermined step in the tested dimension. When the differencewas detected, it was decreased in the same manner. For determin-ing the SOA deviance level, the same procedure was used, exceptthat the subject was presented with five stimuli~i.e., four ISIs!instead of two, and had to say whether the fourth interval was thesame as those intervals preceding it. The steps were 2 Hz forfrequency, 1 dB for intensity, 10 ms for SOA, and 158 for location.The procedure was continued until the staircase undulated repeat-edly within a certain range. This range was determined twice foreach subject and each dimension, once starting from no differenceand once starting a from a large difference. For each dimension,the magnitude of deviance to be used while recording the ERPswas selected from the higher limit of the determined range, that is,a deviance that was consistently detected. The selected value wastested in the second stage.
Stage 2.Following the staircase stage, the detection accuracyof the selected difference magnitude was tested. For each dimen-sion, the subject was presented with 100 groups of four consecu-tive tones at 500 ms SOA. Half of these quartets consisted of fouridentical standard tones and half consisted of three standard tonesfollowed by a deviant tone differing from the standard in onedimension. The magnitude of the deviance was that selected in thefirst stage. The subject’s task was to press one button if the fourtones were identical and another if the last tone differed from thefirst three. If the hit rate for detecting the deviant tones was lowerthan 95% or the false alarm rate higher than 10%~or d9 over 2.9!,stage 2 was repeated using a larger difference.
Stage 3.At this stage, deviant tones along all four dimensionswere presented intermixed with the standards in one block, at 500ms SOA~except for SOA-deviants!. Twenty-five deviants of eachtype were randomly interspersed among 400 standard stimuli andthe subjects were instructed to press a button whenever a deviantoccurred, regardless of deviance type. Once more, adjustmentswere made if a deviance was detected less than 92% of the time~2misses out of 25 trials! or false alarms were more than 10%. Infact, false alarms were rare at this stage.
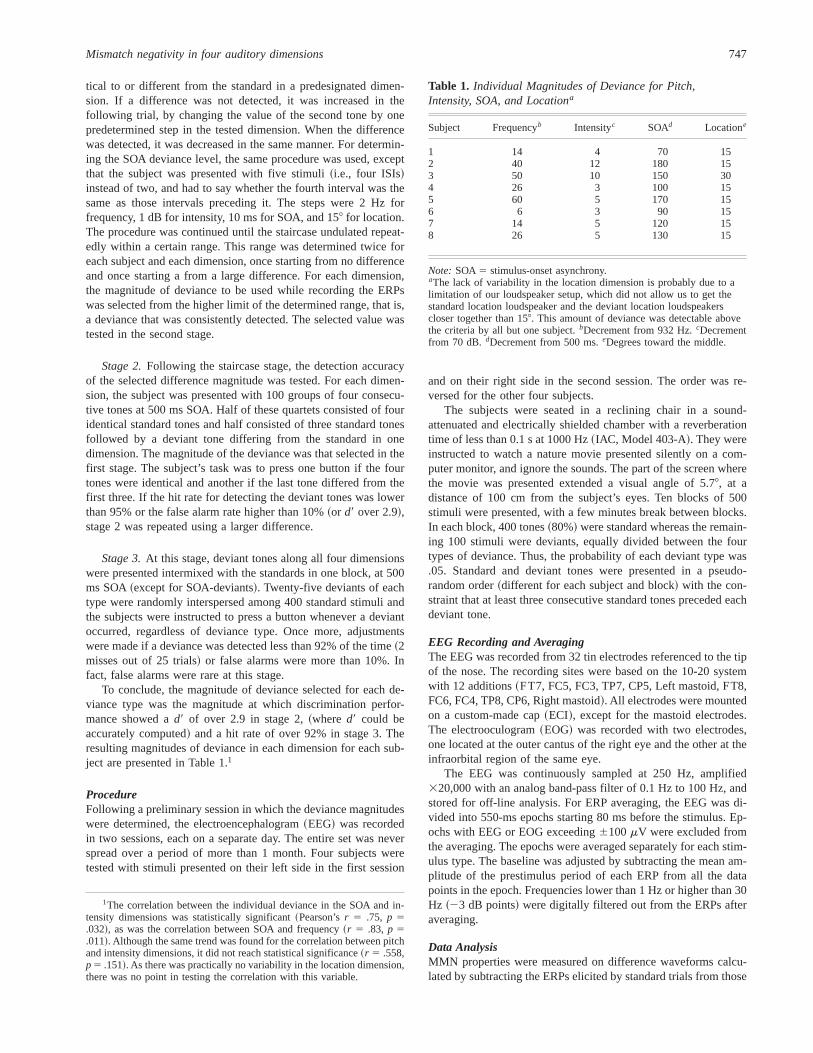
To conclude, the magnitude of deviance selected for each de-viance type was the magnitude at which discrimination perfor-mance showed ad9 of over 2.9 in stage 2,~where d9 could beaccurately computed! and a hit rate of over 92% in stage 3. Theresulting magnitudes of deviance in each dimension for each sub-ject are presented in Table 1.1
ProcedureFollowing a preliminary session in which the deviance magnitudeswere determined, the electroencephalogram~EEG! was recordedin two sessions, each on a separate day. The entire set was neverspread over a period of more than 1 month. Four subjects weretested with stimuli presented on their left side in the first session
and on their right side in the second session. The order was re-versed for the other four subjects.
The subjects were seated in a reclining chair in a sound-attenuated and electrically shielded chamber with a reverberationtime of less than 0.1 s at 1000 Hz~IAC, Model 403-A!. They wereinstructed to watch a nature movie presented silently on a com-puter monitor, and ignore the sounds. The part of the screen wherethe movie was presented extended a visual angle of 5.78, at adistance of 100 cm from the subject’s eyes. Ten blocks of 500stimuli were presented, with a few minutes break between blocks.In each block, 400 tones~80%! were standard whereas the remain-ing 100 stimuli were deviants, equally divided between the fourtypes of deviance. Thus, the probability of each deviant type was.05. Standard and deviant tones were presented in a pseudo-random order~different for each subject and block! with the con-straint that at least three consecutive standard tones preceded eachdeviant tone.
EEG Recording and AveragingThe EEG was recorded from 32 tin electrodes referenced to the tipof the nose. The recording sites were based on the 10-20 systemwith 12 additions~FT7, FC5, FC3, TP7, CP5, Left mastoid, FT8,FC6, FC4, TP8, CP6, Right mastoid!. All electrodes were mountedon a custom-made cap~ECI!, except for the mastoid electrodes.The electrooculogram~EOG! was recorded with two electrodes,one located at the outer cantus of the right eye and the other at theinfraorbital region of the same eye.
The EEG was continuously sampled at 250 Hz, amplified320,000 with an analog band-pass filter of 0.1 Hz to 100 Hz, andstored for off-line analysis. For ERP averaging, the EEG was di-vided into 550-ms epochs starting 80 ms before the stimulus. Ep-ochs with EEG or EOG exceeding6100mV were excluded fromthe averaging. The epochs were averaged separately for each stim-ulus type. The baseline was adjusted by subtracting the mean am-plitude of the prestimulus period of each ERP from all the datapoints in the epoch. Frequencies lower than 1 Hz or higher than 30Hz ~23 dB points! were digitally filtered out from the ERPs afteraveraging.
Data AnalysisMMN properties were measured on difference waveforms calcu-lated by subtracting the ERPs elicited by standard trials from those
1The correlation between the individual deviance in the SOA and in-tensity dimensions was statistically significant~Pearson’sr 5 .75, p 5.032!, as was the correlation between SOA and frequency~r 5 .83, p 5.011!. Although the same trend was found for the correlation between pitchand intensity dimensions, it did not reach statistical significance~r 5 .558,p5 .151!. As there was practically no variability in the location dimension,there was no point in testing the correlation with this variable.
Table 1. Individual Magnitudes of Deviance for Pitch,Intensity, SOA, and Locationa
Subject Frequencyb Intensityc SOAd Locatione
1 14 4 70 152 40 12 180 153 50 10 150 304 26 3 100 155 60 5 170 156 6 3 90 157 14 5 120 158 26 5 130 15
Note: SOA5 stimulus-onset asynchrony.aThe lack of variability in the location dimension is probably due to alimitation of our loudspeaker setup, which did not allow us to get thestandard location loudspeaker and the deviant location loudspeakerscloser together than 158. This amount of deviance was detectable abovethe criteria by all but one subject.bDecrement from 932 Hz.cDecrementfrom 70 dB. dDecrement from 500 ms.eDegrees toward the middle.
Mismatch negativity in four auditory dimensions 747

elicited by deviant trials in the same block. The amplitude of theMMN was assessed in two ways:~a! by measuring the maximumnegativity at Fz between 100–250 ms, in each subject, and~b! byaveraging the amplitude within an epoch of 12 ms before and 12ms after the peak latency of the MMN in the grand-averageddifference waveforms, across a predesignated cluster of electrodes~Fz, F3, F4, FC3, FC4, FC5, FC6, F7, F8, FT7, FT8!. Hence,whereas the first measure was evidence of the most negative peakin each subject, the second disregarded individual variation of peaklatency and summated across a larger scalp distribution. In addi-tion, topographical analyses were done testing the interaction acrossall 32 electrodes and the different conditions. All statistical analy-ses were done within subjects. The significance of the differencebetween the response to the standard and to the deviant was as-
sessed for each dimension and side using one-tailed pairedt tests.Differences among conditions were validated by analysis of vari-ance~ANOVA !.
Results
Visual inspection of the ERPs elicited by the standard tones andthe four types of deviant stimuli revealed a negative shift of thedeviants compared with the standards between 100 and 250 ms~Figure 1!. This MMN is clearly seen in the difference waveforms,computed by subtracting the waveform elicited by the standardevent from that elicited by each type of deviance~Figure 2!.
Regardless of dimension or side of stimulation, the MMN wasmost prominent at the frontal electrodes and less so centrally. The
Figure 1. Grand average event-related potentials~ERPs! elicited by the standard tones and each of the four types of deviant tones. Theleft mastoid~LM ! is shown for right side presentation, and the right mastoid~RM! is shown for left side presentation. The horizontalbar represents an epoch from 80 ms before to 470 ms after the stimulus, and the vertical bar6 1 mV for the scalp as well as the electro-oculogram~EOG! waveforms. The apparent shift of N1 toward positive absolute values is probably a consequence of a slow~1–1.5 Hz!wave overriding the data. This shift can be corrected by high-pass filtering above 1.5 Hz. However, to avoid excessive manipulation of thedata, the analysis and plots were performed using the more commonly used high-pass filter at 1.0 Hz.
748 L.Y. Deouell and S. Bentin

MMN was accompanied by a positivity~polarity reversal! at themastoid sites~Figures 2 and 3!. Following the terminology used bySchröger~1995!, the MMN elicited by frequency, intensity, SOA,and location shifts will be referred to hereinafter as MMN-F, MMN-I,MMN-S, and MMN-L, respectively. The effect of the “side ofpresentation” and “dimension of deviance” on MMN was analyzedusing amplitude, peak latency, and spatial distribution as the de-pendent variables in separate analyses.
AmplitudeEffects of dimension of deviance and side of stimulation.The
amplitude of the MMN, averaged over the cluster of frontal elec-trodes, was significantly different from zero for all the dimensions,whether the stimuli came from the right or the left side of thesubject~Table 2!.
For individually measured peak amplitudes~at Fz!, the effect ofdimension-of-deviance was significant,F~3,21! 5 4.23,p , .02,G-G e 5 0.70, whereas the effect of side-of-deviance was not,F~1,7! , 1.0. The interaction between the two effects was also not
significant,F~3,21! , 1.00. Post hoc univariate comparisons be-tween dimensions~collapsed over right and left side stimulation!revealed that MMN-F was larger than all the other types of MMN,F~1,7! 5 8.09,p , .025, which did not differ among themselves.When the same type of analysis was done using average amplitudeat the frontal cluster of electrodes around the grand-average peaklatency~rather than the individual most negative peak!, no signif-icant main effects or interaction were found. Therefore the numer-ical results of the statistical analyses reported below refer only tothe individual maximum negativity at Fz. The same analyses wererun, however, using the average amplitude measure as the depen-dent variable, and whenever qualitative differences were foundbetween the two types of analysis, both are reported.
Correlation between the MMN amplitude and the objective sizeof deviance.Correlation analyses were conducted to test the rela-tions between the individual magnitudes of objective deviance andthe MMN separately for frequency, intensity, and SOA. Correla-tions were not computed for location deviance due to the lack of
Figure 2. Grand average difference waves computed by subtracting the response to the standard stimuli from the response to each typeof deviant. See Figure 1 for details.
Mismatch negativity in four auditory dimensions 749

variability in the magnitude of deviance in this dimension. Thecorrelation between the magnitude of frequency deviance and theamplitude of MMN-F was marginally significant~Spearman’sr 5.65, p , .05!. Although the magnitudes of SOA and intensity
deviance were also positively correlated with the amplitude ofMMN, these correlations were not statistically significant~Spear-man’sr for MMN-I: .53, MMN-S: .62; critical value for .05 prob-ability of error: .64!.
Figure 3. Lateral views of scalp voltage distribution~spline interpolation! at the peak amplitude of the mismatch negativity~MMN !elicited by the four types of deviance. Darker regions represent more negative potentials. White dots represent electrode locations seenfrom these lateral viewpoints.
Table 2. Grand Average Peak Mismatch Negativity Latencies, Amplitudes, Standard Errors, t Value,and Probability of Type I Error (One-Tailed)a
Frequency Intensity SOA Location
Right Left Right Left Right Left Right Left
Latency~ms! 183 178 211 179 141 146 177 185
Mean amplitude~SE! 21.61 21.54 20.88 20.78 20.57 20.69 20.95 20.99~0.47! ~0.38! ~0.25! ~0.14! ~0.24! ~0.26! ~0.19! ~0.25!
t~7! 23.44 24.00 23.52 25.76 22.41 22.65 25.03 23.94p , .006 p , .003 p 5 .005 p , .001 p , .025 p , .02 p 5 .001 p 5 .003
Note: SOA5 stimulus-onset asynchrony.aAmplitudes are the average amplitudes612 ms around the grand average peak MMN latency at Fz.
750 L.Y. Deouell and S. Bentin

Correlation between right and left side of stimulation.Becausethe responses to stimuli presented on the right or on the left wererecorded on separate days and no general effects of side werefound in any dimension, we considered the two recordings a kindof test–retest reliability measure and analyzed it by calculating thecorrelation between the two sets of data. The amplitudes of MMN-Felicited by left and right side tones were significantly correlated~Spearman’sr 5 .90, p , .01!. In contrast, the same type ofcorrelation was not significant for the other types of MMN~Spear-man’s r for MMN-I: 2.11, MMN-S: .51, MMN-L: .43; criticalvalue for .05 probability of error: .64!.
Correlation between dimensions.An additional analysis testedthe correlation between the amplitudes of MMN elicited by thefour investigated dimensions. When the dependent variable wasthe MMN at Fz measured at the individual peak negativity, onlythe correlation between MMN-F and MMN-I was significant~Spear-man’s r 5 .67, p , .05!. No significant correlation among theMMN types was found when the dependent variable was the av-eraged frontal negativity around the grand average peak negativity.
LatencyEffects of dimension of deviance and side of stimulation.The
peak latency of the MMN elicited by MMN-S was the shortest,followed by MMN-L and MMN-F, and finally by MMN-I, whichelicited the latest MMN~Table 2!. The ANOVA of the latency ofthe most negative peak between 100–250 ms, with side of stimu-lation and dimension of deviance as factors, revealed a signifi-cant main effect of dimension,F~3,21! 5 8.05,p , .001, G-Ge 5.81, and a significant interaction between side and dimension,F~3,21! 5 4.4, p , .015, G-Ge 5 .62. A post hoc univariateanalysis of the effect of dimension revealed that the peak latenciesof MMN-F, MMN-I, and MMN-L were not significantly different,whereas the latency of MMN-S was significantly shorter than thatof the three other types of MMN,F~1,7! 5 17.5,p , .004. A posthoc analysis of the interaction effect revealed that the interactionresulted from a significantly shorter latency of MMN-I when stim-uli were presented on the left rather than on the right side,F~1,7! 5 7.34,p , .05, whereas the other types of MMN were notaffected by the side of stimulation~Figure 4!.
Correlation between the MMN latency and the objective size ofdeviance.A significant negative correlation was found betweenthe magnitude of frequency deviance and the latency of MMN-F~Spearman’sr 5 2.86, p , .01!. Because the latency of MMN-Idepended on the side from which the tones were presented~see theprevious paragraph!, we repeated the analysis separately for theMMNs elicited by tones presented on the left and on the right sideof the subject. This analysis revealed a significant correlation be-tween the objective magnitude of intensity deviance and MMN-Ionly when the tones were presented to the left of the subject~Spearman’sr 5 2.75,p , .05!. MMN-F was correlated with thedegree of frequency deviance whether the tones were presented tothe left or to the right of the subject~r 5 2.89, p , .01 andr 5 2.77, p , .05, respectively! .
Correlation between right- and left-side stimulation.There wasa significant positive correlation between the latencies of MMN-Felicited by tones presented to the right and the left of the subject~Spearman’sr 5 .95,p , .01!. However, the same correlations forMMN-I ~r 5 2.11!, MMN-S ~r 5 .49!, and MMN-L ~0.53! werenot statistically significant.
Correlation between dimensions.No significant correlation wasobserved between the latencies of MMN elicited by any two di-mensions of deviance.
Spatial Distribution of Scalp PotentialsFigure 3 displays spline interpolation of the potentials in the dif-ferent conditions, at each respective peak MMN latency. It is ev-ident that in all conditions, and over both hemispheres, the MMNis charac-terized by a frontal negativity, accompanied by positivityat the mastoid and posterior temporal sites. The frontal negativitytended to be stronger over the right hemisphere, regardless of sideof stimulation, when the deviance was in the location dimension~MMN-L !. With the other types of MMN, however, no clear asym-metry was observed. The maps also show that the orientation of the“zero line,” which demarcates the region of negativity from theregion of positivity, varied with the type of MMN. It was the mosthorizontal for MMN-F ~roughly extending from the inion to theauricular trigon!, the most vertical for MMN-I~roughly betweenFz and the trigon!, and midway for MMN-S and MMN-L. Thesedifferences in spatial distribution were not significant, however, inANOVA with all electrodes and dimensions of deviance as factors,following normalization using McCarthy and Wood’s~1985! method,F~93,651! ,1 for the interaction between dimension and elec-trodes. The voltage distribution and the orientation of the zero linewere symmetrical across hemispheres and similar within dimen-sions, whether the MMN was elicited by presenting the tones to thesubject’s right or left sides.
Discussion
The purpose of the present study was to compare the MMN elic-ited by deviance in different dimensions, while holding extraneousvariables as constant as possible. Previous studies compared MMNelicited by manipulating different auditory dimensions. In most ofthese publications, however, differences in individual performanceamong dimensions have not been reported and, when reported~e.g., Schröger, 1995!, they were large. Therefore, whereas thesestudies suggested that mismatch in different physical dimensionsof the auditory stimulus may elicit distinct neuronal activities~e.g.,Deacon et al., 1998; Giard et al., 1995; Levänen, Ahonen, Hari,McEvoy, & Sams, 1996; Levänen, Hari, McEvoy, & Sams, 1993;
Figure 4. Average of individual subjects’ peak latencies of mismatch neg-ativity ~MMN ! elicited by the four types of deviance used. Tones werepresented from loudspeakers on the left of the subject~dark bars! or on theright of the subject~light bars!. The error bars represent the standard errorof the mean.
Mismatch negativity in four auditory dimensions 751

Schröger, 1995!, they did not allow a simple comparison of theMMN patterns per se across deviant types. In the present study weused individually adjusted parameters to determine the size ofdeviance, and mixed all the deviant stimuli along four dimensionsin the same block. The results revealed that, despite the compara-ble psychophysical performance level, there were significant dif-ferences in the MMN amplitude, latency, and variability across thefour dimensions. These differences, however, were not constantacross subjects, suggesting heterogeneity in the manner of pro-cessing different auditory dimensions among subjects. The side atwhich the stimuli were delivered did not have a significant maineffect.
The average amplitude of MMN elicited by deviance in fre-quency was higher than the amplitudes of the MMNs elicited bydeviance in intensity, location, and SOA, which were remarkablyclose to one another. This pattern suggests that despite the com-parable subjective distinctiveness of deviance across all four di-mensions, the frequency deviance may have been more obtrusiveto the system than the other types of deviance. In this respect it isinteresting to note that the difference between MMN-F and theother types of MMN was evident at Fz but not at the mastoid.Thus, it is possible that the difference between frequency and otherdimensions is related to the putatively attention-related frontal gen-erator of MMN~cf., Deouell, Bentin, & Giard, 1998; Giard, Perrin,Pernier, & Bouchet, 1990!, rather than to the auditory cortex gen-erators in the supratemporal plane that are probably better reflectedby the mastoid positivity. On the other hand, whereas this frontalcomponent of MMN has been suggested to be related to involun-tary attention switch, the stronger MMN at Fz was not associatedwith a more prominent P3a, which is assumed to be a sign of sucha switch~Näätänen, 1992!.
The fact that the MMN-F amplitude was greater than the am-plitude of the other MMN types may also result from the differentorientation of the current dipoles underlying the different types ofMMN. For example, in a recent study, the equivalent current di-pole ~ECD! that best fitted the potential distribution of MMN-Iwas oriented along a lower-postero-medial to upper-antero-lateralplane, whereas the ECD associated with MMN-F was orientedalong a lower-postero-lateral to higher-antero-medial~Giard et al.,1995!. Therefore, it may be expected that the MMN-F dipole,pointing toward the anterior midline, would be better detected atFz than the MMN-I dipole which points away from the midline.Although the difference in spatial distribution of the four types ofMMN was not statistically significant in our study, the differentorientations of the isopotential zero-lines resembled that observedin Giard et al.’s study. The absence of statistical significance in thecurrent study may have been caused by the considerably fewertrials used in our study compared with the study of Giard et al.
Like the MMN’s amplitude, the latency of the MMN variedacross dimensions. However, whereas the MMN-F was outstand-ing for amplitude, for latency the MMN-S differed significantlyfrom all other types of MMN by having a shorter latency. Becausein our design the magnitude of deviance in SOA was equivalent tothe other types of deviance, the shorter latency elicited cannot beexplained by the reported linear relationship between the magni-tude of deviance and the latency of MMN~Tiitinen et al., 1994!.The present results suggest, therefore, that detection of an earlier-than-usual stimulus may be faster than the detection of the otherkinds of deviation tested.
The MMN-L latency in our study was apparently longer thanthat reported in previous studies~e.g., Kujala, Alho, Paavilainen,Summala, & Näätänen, 1992; Paavilainen et al., 1989!. This dif-
ference might have had one of two causes: One cause might be thatthe location shift was smaller~158! in the present study than inthose previous studies. The other cause might be that we used afree-field setup, whereas the shorter MMN-L latencies were re-corded with apparent shifts introduced by interaural time or inten-sity differences. Supporting our explanation, when a free-field setupwas used, and the shift in location was comparable to ours~108!,the latency of MMN-L was even slightly longer than ours~Paavilain-en et al., 1989!.
The similar latency of the MMN-L and MMN-F in the presentstudy seems to be at odds with results published by Schröger andhis associates in a series of studies. For example, using frequencychange from 600 Hz to 625 Hz, and location shift created byinteraural time delay through earphones, Schröger~1995! found anearlier MMN-L than MMN-F ~but did not find any amplitudedifferences!. However, the comparison between the two types ofMMN in that study may not have been valid because the hit ratesfor the two types of deviants were not only significantly different,but also varied widely across subjects~27–96% for frequency de-viants and 1–93% for location deviants!. In a more recent study,Schröger and Wolff~1997! replicated the latency difference be-tween the MMN-L and MMN-F and reported that the hit rate andreaction time for the discrimination of the deviants and standardswas similar for the two dimensions. This result, however, wasobtained in a control group, different from the group tested in theMMN study. Moreover, the objective difference between the stan-dards and the deviants in Schröger and Wolff’s study was large~from 600 to 660 Hz and from 458 to the right, to 458 to the left!.Notably, although in the present study the deviance in location wasmuch smaller~158!, the subjects’ performance was almost perfect.Therefore, it is possible that the discrimination between standardsand deviants in the Schröger and Wolff study~especially for thedeviance in location! was too easy to reveal differences betweenthe subjective discrimination for frequency and location.2 None-theless, their results led Schröger and Wolff to suggest that pre-attentive information about stimulus location is stored early, andforms a substrate for later selective spatial attention mechanisms.The comparable latency of MMN-L and MMN-F in the presentstudy casts doubt on this interpretation, suggesting that when dis-crimination performance levels are equated individually across di-mensions, the difference in latency does not hold, at least in a~more natural! free-field setting. At the very least, this discrepancyhighlights the difficulty of drawing conclusions from comparisonsbetween dimensions and the relevance of individual performancedata when such comparisons are the goal.
The amplitude of the MMN-F and its latency were distinct fromthose elicited by other dimensions also by significantly correlatingwith the objective physical difference between the standards andthe deviants. Similar correlations were reported in previous studies~e.g., Tiitinen et al., 1994!. In those studies, however, the magni-tude of deviance was manipulated within the subject. Conse-quently, the increase of the actual magnitude of deviance in thosestudies enhanced the subjective salience of the deviant stimuli. Incontrast, the magnitude of deviance in our study was varied be-tween subjects, while keeping the subjective salience level pre-sumably equal. The possibility that this effect was due to an overlap
2Indeed, in Schröger and Wolff~1997!, the hit rate was not at ceiling.However, in that study the time during which subjects’ responses wereaccepted was very limited and many correct responses could conceivablyhave been rejected on the basis of being too late~Schröger, personal com-munication, 1998!.
752 L.Y. Deouell and S. Bentin
of an enhanced N1 in response to the different frequency of thedeviant is unlikely, considering both the minute changes in fre-quency between the standard and deviant stimuli~from 0.6 to 6%!,and the distance of the MMN latency~180 ms! from the latency ofN1 ~100 ms!. Hence, unlike previous studies that emphasized theeffect of subjective discriminability on the MMN amplitude~e.g.,Kraus et al., 1993; Lang et al., 1990; Näätänen, Schröger, et al.,1993, Sams et al., 1985!, inasmuch as the present attempt to equatethe salience level was successful, and keeping in mind the smallsample tested, our study suggests that the absolute frequency dif-ference between standard and deviant stimuli plays a role in de-termining the amplitude of the MMN.
Although there was no overall trend toward side-of-stimulationeffects on the amplitude of MMN, the only condition in whichMMNs elicited by right and left side stimulation were significantlycorrelated was the frequency deviance. This finding was true forthe latency and amplitude variables. As stimulation on the left sideand the right side were conducted in separate sessions several daysapart, the lack of correlation should probably be taken as a poortest–retest reliability at the individual level of all the types ofMMN that we tested, with the exception of MMN-F. Both Esceraand Grau~1996!, who tested MMN-F replicability between twosessions held 2 hr apart, and Pekkonen et al.~1995!, who testedreplicability over 1 month, reported good replicability at the grouplevel, but not at the individual level. These authors suggested thatthe poorer replicability at the individual level is a consequence ofusing an insufficient number of deviant tones~resulting in a lowsignal-to-noise ratio in the average!. In our study, there were moredeviants~250 of each kind! than in either the Escera and Grau~1996! or the Pekkonen et al.~1995! study ~160 and 150, respec-tively!. Therefore, this factor may explain the improved individual-level test–retest replicability obtained for MMN-F here. However,there are two additional factors that may also have enhanced thereliability of the MMN-F’s amplitude and latency in our study.
These factors were the low probability of deviants~.05 for eachtype of deviance! and the fact that we assured that the presentmagnitude of deviance was within the subjects’ discriminationcapacity. Nonetheless, even under these more optimal conditions,the individual test–retest reliability of MMN-L, MMN-I, andMMN-S was not sufficiently augmented. If indeed the problem isextrinsic ~i.e., resulting from a low signal-to-noise ratio! ratherthan intrinsic~i.e., resulting from a low reliability of the processesunderlying MMN!, then more experimentation will probably re-veal the conditions for its resolution.
Summary and Conclusions
The purpose of this study was to compare the MMN elicited bydeviance along the dimensions of frequency, intensity, SOA, andlocation. The MMN elicited by these types of deviance variedsignificantly in amplitude, latency, and reliability, despite the factthat discrimination between the standards and the deviants wascomparably easy for the different types of deviance. Specifically,the amplitude of MMN-F was larger than all other types of MMN,whereas the latency of MMN-S was shorter than the latency of anyother MMN type. Conversely, and in contrast to previous reports,there was no difference in latency between MMN-L and MMN-Funder the current conditions, emphasizing the importance of indi-vidual discrimination measurements when comparisons betweendimensions are sought. Moreover, when the individual’s discrim-ination level was controlled for, the within-subject test–retest re-liability for MMN-F was better than previously reported. On theother hand, whereas the reliability at the group level was good forall dimensions, the within-subject reliability in dimensions otherthan frequency was still low. The relatively large intersubject vari-ability across dimensions, and the weak test–retest reliability insome dimensions require the use of utmost caution when employ-ing the MMN in single case studies.
REFERENCES
Aaltonen, O., Niemi, P., Nyrke, T., & Tuhkanen, M.~1987!. Event relatedbrain potentials and the perception of a phonetic continuum.BiologicalPsychology, 24, 197–207.
Böttcher-Gandor, C., & Ullsperger, P.~1992!. Mismatch negativity in event-related potentials as a function of varying inter-stimulus intervals.Psy-chophysiology, 29, 546–550.
Deacon, D., Nousak, J., Pilotti, M., Ritter, W., & Yang, C. M.~1998!.Automatic change detection: Does the auditory system use representa-tions of individual stimulus features or gestalts?Psychophysiology, 35,413–419.
Deouell, L. Y., Bentin, S., & Giard, M. H.~1998!. Mismatch negativity indichotic listening: Evidence for interhemispheric differences and mul-tiple generators.Psychophysiology, 35, 355–365.
Escerea, C., & Grau, C.~1996!. Short-term replicability of the mismatchnegativity.Electroencephalography and Clinical Neurophysiology, 100,549–554.
Giard, M. H., Lavikainen, J., Reinikainen, K., Perrin, F., Bertrand, O.,Pernier, J., & Näätänen, R.~1995!. Separate representation of stimulusfrequency, intensity, and duration in auditory sensory memory: Anevent related potential and dipole-model analysis.Journal of CognitiveNeuroscience, 7, 133–143.
Giard, M. H., Perrin, F., Pernier, J., & Bouchet, P.~1990!. Brain generatorsimplicated in the processing of auditory stimulus deviance: A topo-graphic event related potential study.Psychophysiology, 27, 627–640.
Kane, N. M., Curry, H., Buttler, S. R., & Cummins, B. H.~1993!. Elec-trophysiological indicators of awakening from coma.Lancet, 341,688.
Korpilahti, P., & Lang, H.~1994!. Auditory ERP components and mismatchnegativity in dysphasic children. Electroencephalography and ClinicalNeurophysiology, 91, 256–264.
Kraus N., & McGee, T.~1994!. Mismatch negativity in the assessment ofcentral auditory function.American Journal of Audiology, 3, 139–151.
Kraus, N., McGee, T., Micco, A., Carrell, T., Sharma, A., & Nicol, T.~1993!. Mismatch negativity in school-age children to speech stimulithat are just perceptibly different.Electroencephalography and ClinicalNeurophysiology, 88, 123–130.
Kujala, T., Alho, K., Paavilainen, P., Summala, H., & Näätänen, R.~1992!.Neural plasticity in processing of sound location by the early blind: Anevent-related potential study.Electroencephalography and ClinicalNeurophysiology, 84, 469–472.
Lang, A. H., Eeorola, O., Korpilahti, P., Holopainen, I., Salo, S., & Aal-tonen, O.~1995!. Practical issues in the clinical application of mis-match negativity.Ear and Hearing, 16, 118–130.
Lang, A. H., Nyrke, T., Ek, M., Aaltonen, O., Raimo, I., & Näätänen, R.~1990!. Pitch discrimination performance and auditive event-related-potentials. In C. H. M. Brunia, A. W. K. Gaillard & A. Kok~Eds.!,Psychophysiological brain research~Vol. 1, pp. 294–298!. Tilburg:Tilburg University Press.
Levänen, S., Ahonen, A., Hari, R., McEvoy L., & Sams, M.~1996!. De-viant auditory stimuli activate human left and right auditory cortexdifferently. Cerebral Cortex, 6, 288–296.
Levänen, S., Hari, R., McEvoy, L., & Sams, M.~1993!. Responses of thehuman auditory cortex to changes in one versus two stimulus features.Experimental Brain Research, 97, 177–183.
McCarthy, G., & Wood, C. C.~1985!. Scalp distribution of event-relatedpotentials: An ambiguity associated with analysis of variance models.Electroencephalography and Clinical Neurophysiology, 62, 203–208.
Näätänen, R.~1990!. The role of attention in auditory information process-ing as revealed by event-related potentials and other brain measures ofcognitive function.Behavioral and Brain Sciences, 13, 201–288.
Mismatch negativity in four auditory dimensions 753

Näätänen, R.~1992!. Attention and brain function. Hillsdale, NJ: Erlbaum.Näätänen, R., Jiang, D., Lavikainen, J., Reinikainen, K., & Paavilainen, P.
~1993!. Event-related potentials reveal a memory trace for temporalfeatures.NeuroReport, 5, 310–312.
Näätänen, R., Paavilainen, P., Alho, K., Reinikainen, K., & Sams, M.~1987!. The mismatch negativity to intensity changes in an auditorystimulus sequence. In R. Johnson, Jr., J. W. Rohrbaugh, & R. Parasur-aman~Eds.!, Current trends in event related potential research (EEGsuppl. 40, pp. 125–131!. Amsterdam: Elsevier.
Näätänen, R., Paavilainen, P., Alho, K., Reinikainen, K., & Sams, M.~1989!. Do event-related potentials reveal a mechanism of the auditorysensory memory in the human brain?Neuroscience Letters, 98, 217–221.
Näätänen, R., Schröger, E., Tervaniemi, M., Karakas, S., & Paavilainen, P.~1993!. Development of memory trace for complex sound patterns inthe human brain.NeuroReport, 4, 503–506.
Paavilainen, P., Alho, K., Reinikainen, K., Sams, M., & Näätänen, R.~1991!. Right hemisphere dominance of different mismatch negativi-ties.Electroencephalography and Clinical Neurophysiology, 78, 466–479.
Paavilainen, P., Jiang, D., Lavikainen, J., & Näätänen, R.~1993!. Stimulusduration and the sensory memory trace: An event-related potential study.Biological Psychology, 35, 139–152.
Paavilainen, P., Karlsson, M. L., Reinikainen, K., & Näätänen, R.~1989!.Mismatch negativity to change in spatial location of an auditory stim-ulus.Electroencephalography and Clinical Neurophysiology, 73, 129–141.
Pekkonen, E., Rinne, T., & Näätänen, R.~1995!. Variability and replica-bility of mismatch negativity.Electroencephalography and ClinicalNeurophysiology, 96, 546–554.
Ritter, W., Deacon, D., Gomes, H., Javitt, D. C., & Vaughan, H. G.~1995!.The mismatch negativity of event-related potentials as a probe of tran-sient auditory memory: A review.Ear and Hearing, 16, 52–57.
Sams, M., Paavilainen, P., Alho, K., & Näätänen, R.~1985!. Auditoryfrequency discrimination and event-related potentials.Electroenceph-alography and Clinical Neurophysiology, 62, 437–448.
Schröger, E.~1994!. Automatic detection of frequency change is invariantover a large intensity range.NeuroReport, 5, 825–828.
Schröger, E.~1995!. Processing of auditory deviants with changes in oneversus two stimulus dimensions.Psychophysiology, 32, 55–65.
Schröger, E.~1996!. The influence of stimulus intensity and inter-stimulusinterval on the detection of pitch and loudness changes.Electroenceph-alography and Clinical Neurophysiology, 100, 517–526.
Schröger, E., Tervaniemi, M., & Näätänen, R.~1995!. Time course ofloudness in tone patterns is automatically represented by the humanbrain.Neuroscience Letters, 202, 117–120.
Schröger, E., & Wolff, C.~1997!. Fast preattentive processing of location:A functional basis for selective listening in humans.Neuroscience Let-ters, 232, 5–8.
Tiitinen, H., May, P., Reinikainen, K., & Näätänen R.~1994!. Attentivenovelty detection in humans is governed by pre-attentive sensory mem-ory. Nature, 372, 90–92.
~Received January 7, 1998;Accepted May 27, 1998!
754 L.Y. Deouell and S. Bentin